ngo local pay · pdf file · 2010-09-16ngo local pay. contents of this guide survey...
TRANSCRIPT

NGO Local Pay
Understanding the
NGO Local Pay Report

NGO Local Pay
Contents of this Guide
Survey Methodology Recap
Report Part I: You and the Market
Report Part II:Individual Position Information

NGO Local Pay
Survey Methodology Recap

NGO Local Pay
The Birches Group ApproachGlobally‐consistent methodology tailored to less‐developed markets
‘Outside‐in’ job matching ensures accuracy
Total Compensation Data
Gross or net reporting
Flexible, web‐based delivery options
Customizable results
Surveys in over 140 countries, including all of Africa

NGO Local Pay
Measuring the Market -
Data Collection
Survey designed to meet the unique needs of international NGOs
Methodology consistent across all countries
Each survey participant interviewed
Salary ranges collected from each employer• Scales represent the range of compensation for a particular
grade, from minimum to maximum
• Allows participants to see the full span of the market practice
• Average incumbent data
• Benefits and perquisites
• Pension and health benefits, leave provisions

NGO Local Pay
Job Matching –
Accuracy and Consistency
• ‘Outside‐in’
approach
• Done by BG specialists ‐
not
survey participants
• Regional/global employer standards if applicable
• 14 distinct BG levels (BG grades) • Four Factors to Determine Job Levels:
• Nature of Work: substantive contribution
• Enabling Environment: context and role in team
• Partnerships: interaction internal/external
• Results: impact and effect

NGO Local Pay
Job Level Key -
Part II, Section 4

NGO Local Pay
Benchmark JobsTightly focused benchmark jobs that are representative of developing country labour markets
A cross‐section of occupations common to all employers, including Finance (FIN); Administration and Non‐clerical Support (ADM); Human Resources (HR); Secretarial / Team Assistants (SEC) and General Professional (GEN)
NGO specific jobsProgramme Development Management (DPM)
HIV
Country Director
Logistics (LOG)

NGO Local Pay
Catalog of Benchmark Jobs -
Part II, Section 3

NGO Local Pay
Glossary of Terms -
Definitions Part I, Section 12 and Part II, Section 6

NGO Local Pay
Glossary of Terms -
Definitions Part I, Section 12 and Part II, Section 6

NGO Local Pay
NGO Local Pay Survey Report Part I

NGO Local Pay
Part I -
Employer Specific Data
Customized to reflect the specific participant’s data against other surveyed employers
Brief market overview narrative (Section 2) provides context to market conditions
Values stated in local currency and annual terms

NGO Local Pay
You vs. the Market -
Section 3
• Average Total Compensation of all of your jobs matched at each
level as compared to the other surveyed employers (the market)• Shown by BG level
• 50th
and 75th
percentile data lines
• Total Compensation = total cash + in‐kind benefits (excludes pension,
medical plans)
NGO Local Pay
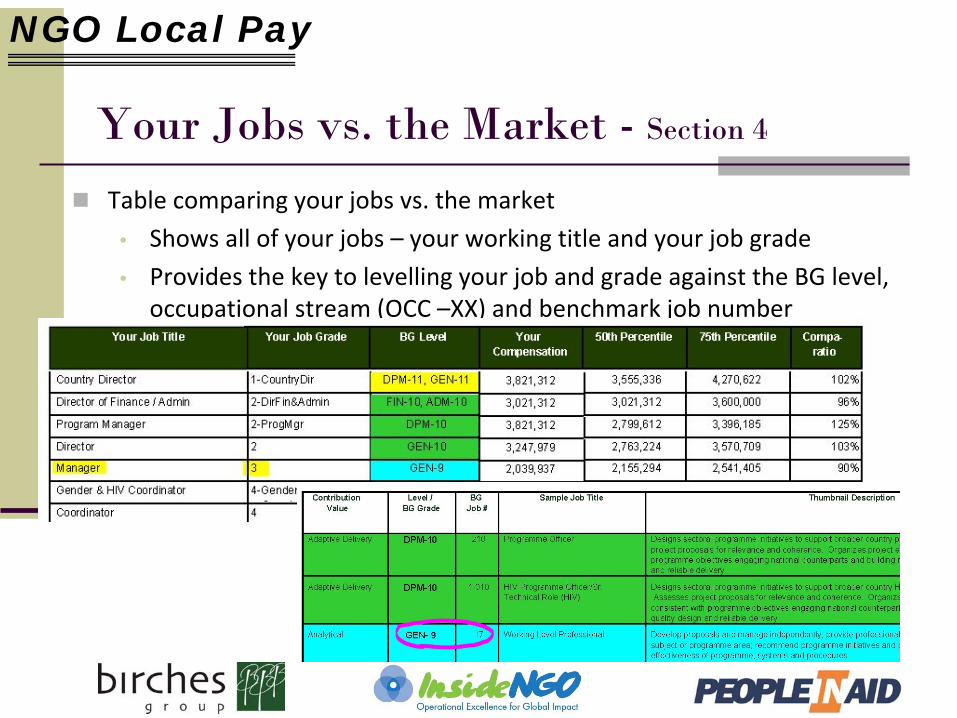
Your Jobs vs. the Market -
Section 4
Table comparing your jobs vs. the market
• Shows all of your jobs – your working title and your job grade
• Provides the key to levelling
your job and grade against the BG level,
occupational stream (OCC –XX) and benchmark job number

NGO Local Pay
Your Jobs vs. the Market -
Section 4
• Average Total Compensation of each of your matched
jobs as compared
to the other surveyed employers
• Your Compensation = average of the values provided for each job
• Correlates with data shown in Section 5 d

NGO Local Pay
Your Jobs vs. the Market -
Section 4
Compa‐ratio is the relationship of your average gross salary per job to the overall market average• Ratio of 90% suggests you are 10% behind the market average
• Ratio of 125 % suggests you are 25% ahead of the market
average

NGO Local Pay
Overall Market Data by Quartile -
Section 5
Detailed comparison of specific elements of your gross pay against the market• Includes all BG benchmark jobs matched in the survey

NGO Local Pay
Market Data Mix -
Section 5
Selection of different combinations of components allows review of data as ‘building blocks’ towards TOTAL REWARD
Base salary only
Base salary + fixed cash allowances(e.g. guaranteed 13th month or year end bonus)
Base salary + fixed cash + short term incentives(variable bonuses, e.g. performance bonus, profit share)
Total Compensation:Base salary + fixed cash + short term incentives
+ in‐kind benefits

NGO Local Pay
Market Data References -
Section 5
Minimum (Min) and Maximum (Max) provides structure or ‘bookends’
MRP (Market Reference Point) provides Actual salary data

NGO Local Pay
Market Data Interpretation -
Section 5
Compares what you pay at the benchmark job level against:• Lowest (blue) and Highest (red) values• Percentile data (green)
• Incumbent Weighted Average (total number per job as reported in survey) • Incumbent Log Weighted Average (adjusted for dominance by large employers)
• Mean (simple arithmetic average of data reported by all employers)

NGO Local Pay
Summary of Benefit Practices-
Section 6
• Medical benefits• provided by employers to employees and family members
• levels of contribution employer vs
employee
• Retirement plans• by type
• level of contribution to DC (Defined Contribution) plans as a percent of base
salary
• By employer details:• Medical plans 7 b
• Retirement plans 7 c
• Family benefits 7 d
• Leave benefits 7 e

NGO Local Pay
Benefits By Employer -
Section 7a
Details allowances, incentives and in‐kind benefits provided by employer
• Blue
= in‐kind benefits
Green = cash benefits
• T = Taxable
• NT = Non‐taxable
• Sorted by category and
prevalence

NGO Local Pay
Tax Summary -
Section 8
Summarizes the national personal income tax code
• Rates based on single individual
• Standard deductions
or exemption identified

NGO Local Pay
Social Security Summary -
Section 9
Summarizes the national social security and labour code provisions

NGO Local Pay
Exchange Rate Summary -
Section 10
Historical references to local currency in Euros, Pounds and US Dollars
Based on United Nations Operational Rates of Exchange

NGO Local Pay
NGO Local Pay Survey Report Part II

NGO Local Pay
Part II -
Detailed Position InformationIndividual position summaries for each of the survey benchmark jobs
Analysis of total compensation
Mix of compensation by component
Most common in‐kind benefits

NGO Local Pay
Individual Position Reports -
Section 2
Detailed reports for each benchmark job in the NGO Local Pay survey
Each page contains at‐a‐glance data and values for one survey job

NGO Local Pay
Market Footprint-
Section 2 a
Captures the range of the market for Total Gross Compensation
Determine the appropriate market positioning for your organization using the full market range
Illustrates percentiles using:
Minimum (hiring rate)
MRP (average of actualincumbent data)
Maximum (highestattainable)

NGO Local Pay
Compensation “Mix”
-
Section 2 b
Provides a breakdown of the elements of average compensation of the MRP at the 50th percentile
Determine the proportion of base salary vs. benefits
Apply the % to any other market reference to approximate the package composition

NGO Local Pay
Prevalence of Benefits -Section 2 c
Illustrates percentage of employers providing each type of in‐kind benefit

NGO Local Pay
Other Information -
Part II
Part II also includes the following additional information:
Catalog of Benchmark Jobs
Job Level Key
BG Approach to Job Matching and Measuring the Market
List of Participants
Definitions