nguyễn vũ hưng: worldbank data visualization
TRANSCRIPT

Imagine Cup 2011 World State Visualization

Imagine Cup 2011 World State Visualization
INTRODominator team
Team members: Nguyen Hoang Long Ngo Quang Khanh Vo Dang Phat
Mentors: Nguyen Vu Hung Phan Truong Lam

Imagine Cup 2011 World State Visualization
AGENDA

Imagine Cup 2011 World State Visualization

Imagine Cup 2011 World State Visualization
World Bank
• International financial institution• Provide loan to developing countries for project
contributing to the 8 millennium goals…• Have a large amount of information on various
aspects of more than 200 countries.
Part1: Project Idea

Imagine Cup 2011 World State Visualization
Part1: Project Idea

Imagine Cup 2011 World State Visualization
Part1: Project Idea
• Vast amount of data in raw & numeric form• To get data, user have to download excel files
which may contain hundreds of data that they aren’t interested in
• Lack interaction, only suitable for researchers.
World Bank’s data

Imagine Cup 2011 World State Visualization
Graphic User interfaces
Part1: Project Idea

Imagine Cup 2011 World State Visualization
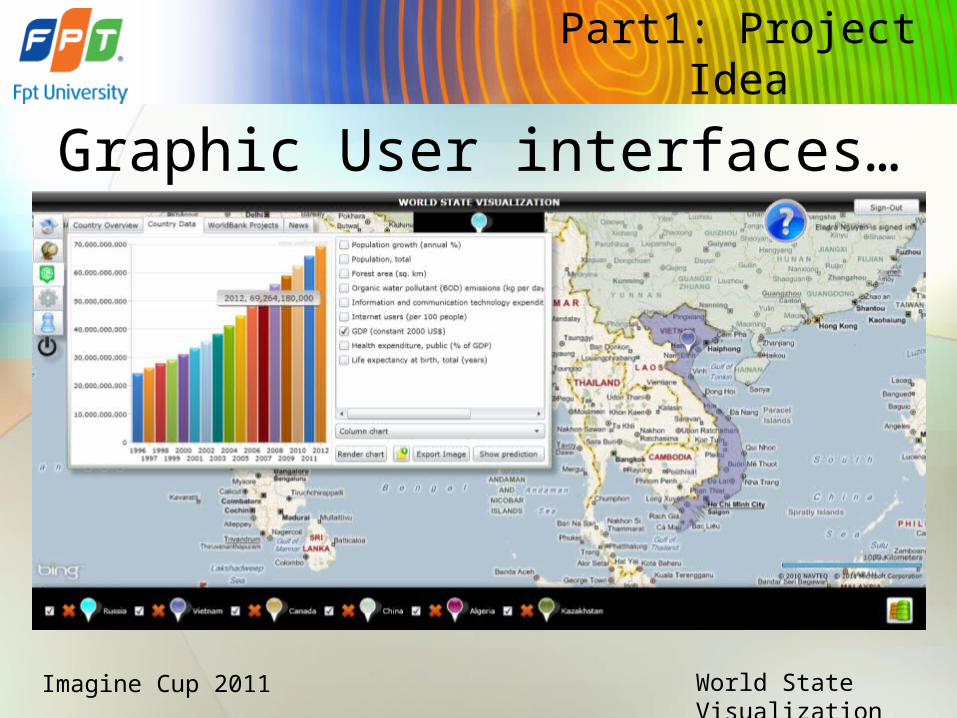
Graphic User interfaces…
Part1: Project Idea
Imagine Cup 2011 World State Visualization
Graphic User interfaces…
Part1: Project Idea

Imagine Cup 2011 World State Visualization
Part1: Project Idea
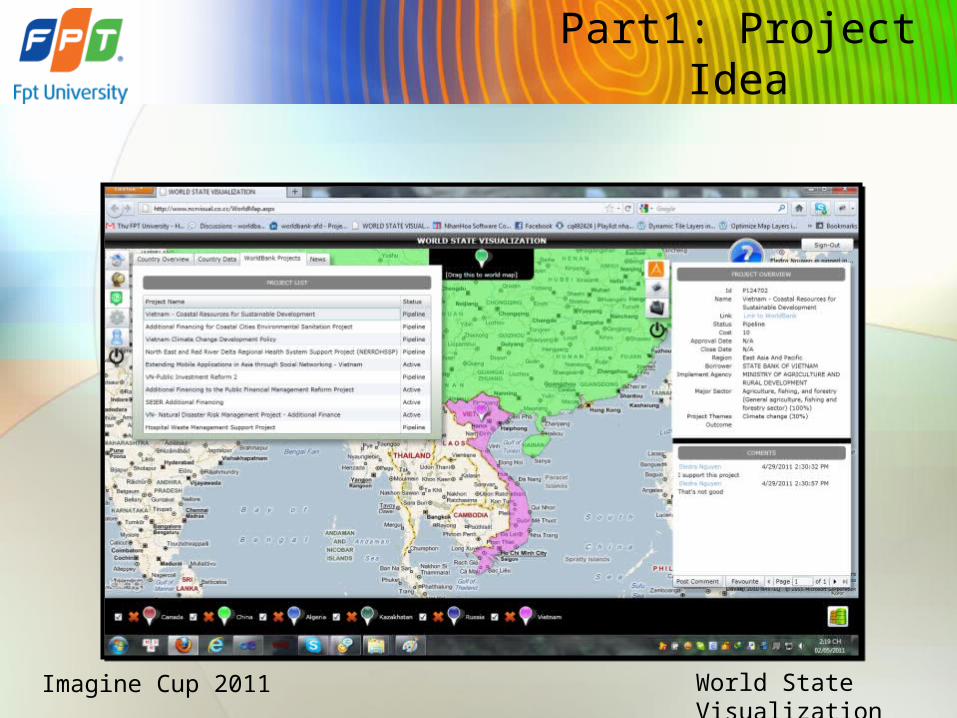
World Bank’s projects

Imagine Cup 2011 World State Visualization
Part1: Project Idea
• Most if not all of the local people affected by a project doesn’t know about it.
• Lack methods to Monitoring actual status of project• Lack methods to obtain opinions of local affected
people• A Dam project to create electricity in South Africa, but the
electricity produced is too expensive for local people and villages downstream is devastated because of the water flow’s changes.
• What if World Bank received feedback beforehand?
World Bank’s projects
Imagine Cup 2011 World State Visualization
Part1: Project Idea

Imagine Cup 2011 World State Visualization
Part1: Project Idea
Imagine Cup 2011 World State Visualization
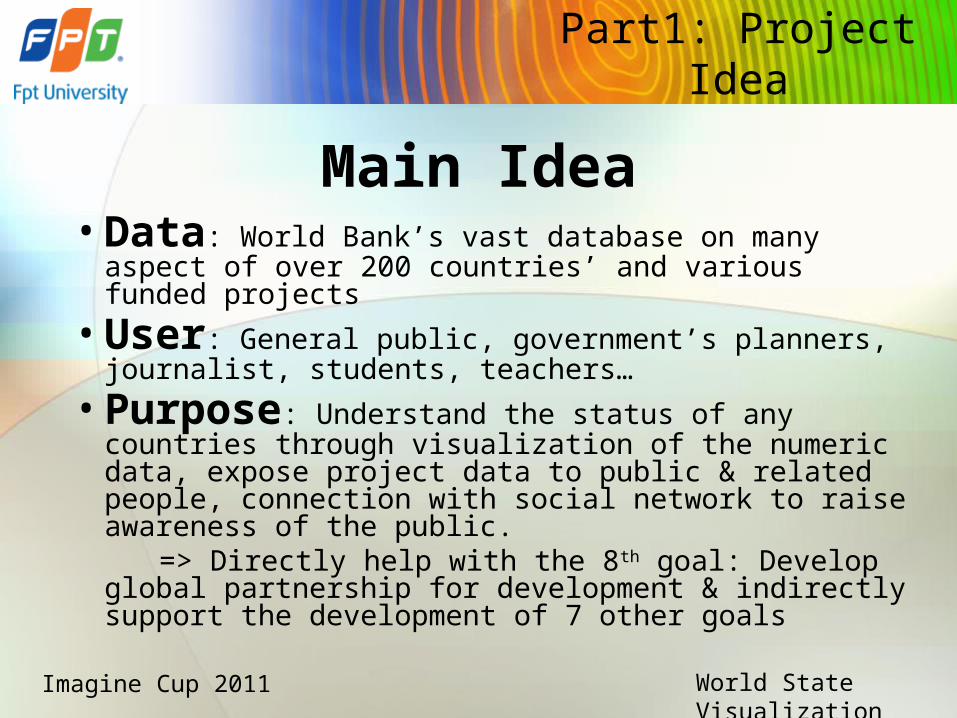
Main Idea• Data: World Bank’s vast database on many aspect of over
200 countries’ and various funded projects• User: General public, government’s planners, journalist,
students, teachers… • Purpose: Understand the status of any countries
through visualization of the numeric data, expose project data to public & related people, connection with social network to raise awareness of the public.
=> Directly help with the 8th goal: Develop global partnership for development & indirectly support the development of 7 other goals
Part1: Project Idea

Imagine Cup 2011 World State Visualization
Imagine Cup 2011 World State Visualization

Imagine Cup 2011 World State Visualization
Physical View
Part 2: System Design

Imagine Cup 2011 World State Visualization
Target a single, consistent runtime for browser-based applications, rather than dealing with the complexity of multiple browsers in different versions.
Video and multimedia effects. Highly interactive
Technology
Part 2: System Design

Imagine Cup 2011 World State Visualization
RIA SERVICES
Simplifies the traditional n-tier application pattern by bringing together the
ASP.NET and Silverlight platforms
Technology...
Part 2: System Design

Imagine Cup 2011 World State Visualization
Highly interactive Map control
Geography services
Technology...
Part 2: System Design

Imagine Cup 2011 World State Visualization
Sign up once – Use Everywhere
Technology...
Part 2: System Design

Imagine Cup 2011 World State Visualization