nhb residex 2019.pdf5 figure: hpi@market prices for under construction properties for tier-=1 cities...
TRANSCRIPT
Government of India
NHB RESIDEX TECHNICAL ADVISORY COMMITTEE MEMBERS
1. Ministry of Finance – Shri Arun Kumar, Adviser, Economic Division, Department of Economic Affairs
2. Ministry of Housing & Urban Affairs - Shri Anupam Mishra, Economic Advisor (Housing)
3. Ministry of Statistics & Programme Implementation – Shri D.K.Sinha, Deputy Director General, Price Statistics Division, Central Statistics Office
4. Ministry of Statistics & Programme Implementation - Shri Vivek Srivastava, Deputy Director, National Accounts Division, Central Statistics Office
Reserve Bank of India
5. Shri. Anujit Mitra, Adviser, Department of Statistics and Information Management (DSIM)
Experts
6. Smt. Balbir Kaur, Ex-Adviser, Department of Economic and Policy Research, Reserve Bank of India
7. Dr. Bimal Roy, Professor, Indian Statistical Institute, Kolkata
8. Dr. Deepayan Sarkar, Professor, Indian Statistical Institute, New Delhi
9. Dr. Neeraj Hatekar, Professor, Department of Economics, Mumbai University
National Housing Bank
10. Shri S.K.Hota, Managing Director, NHB
11. Dr. A.K. Tripathi, Executive Director
12. Shri K. Chakravarthy, General Manager
Financial Institutions
13. Shri Sanjeev Naryani, Chief General Manager, REHBU, State Bank of India
14. Shri Sanjay Joshi, General Manager, HDFC Limited
Industry Institutions
15. Brig. (Retd.) R.R. Singh, Director General, NAREDCO, Industry Association
NHB RESIDEX TEAM
Shri. Vishal Goyal, Deputy General Manager (Email: [email protected])
Shri. Niladri Bose, Regional Manager (Email: [email protected])
SUPPORT AGENCY Liases Foras Real Estate Rating & Research Private Limited
Shri Pankaj Kapoor, Founder & Managing Director (Email: [email protected])
Ms. Tanvi Goyal, Head Client Engagement (Email: [email protected])
For more details visit us on https://residex.nhbonline.org.in/
DISCLAIMER 1987, has made its best effort to collect/collate the
data/information from various Banks, HFCs for providing a cluster of housing related
whatsoever, express or implied. NHB
does not warrant any information or material printed in NHB RESIDEX.
website.
permission of the publisher.”
1
Introduction to NHB RESIDEX
NHB RESIDEX, India’s first official Housing Price Index (HPI), was launched in July, 2007, to track the movement in prices of
residential properties in select cities on quarterly basis, taking 2007 as the base year. With a view to reflect the current
macroeconomic scenario, NHB RESIDEX has been revamped to include cluster of indices with updated base year, revised
methodology and automated processes.
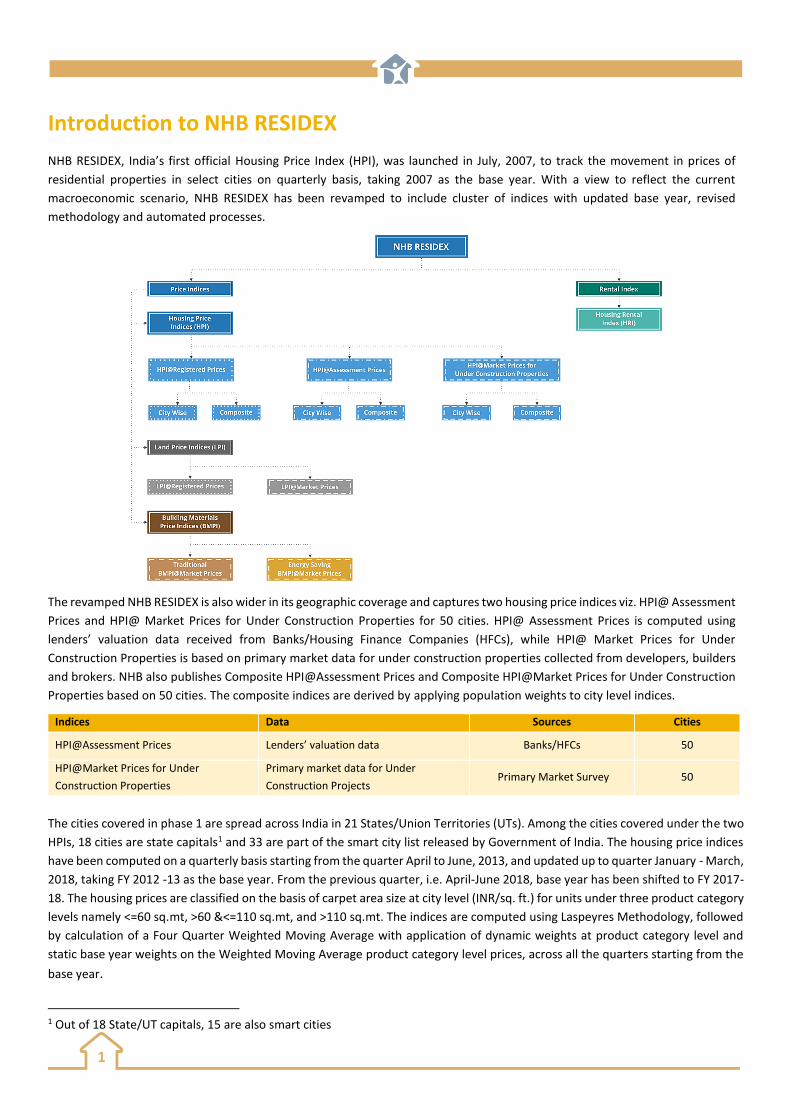
The revamped NHB RESIDEX is also wider in its geographic coverage and captures two housing price indices viz. HPI@ Assessment
Prices and HPI@ Market Prices for Under Construction Properties for 50 cities. HPI@ Assessment Prices is computed using
lenders’ valuation data received from Banks/Housing Finance Companies (HFCs), while HPI@ Market Prices for Under
Construction Properties is based on primary market data for under construction properties collected from developers, builders
and brokers. NHB also publishes Composite HPI@Assessment Prices and Composite HPI@Market Prices for Under Construction
Properties based on 50 cities. The composite indices are derived by applying population weights to city level indices.
Indices Data Sources Cities
HPI@Assessment Prices Lenders’ valuation data Banks/HFCs 50
HPI@Market Prices for Under
Construction Properties
Primary market data for Under
Construction Projects Primary Market Survey 50
The cities covered in phase 1 are spread across India in 21 States/Union Territories (UTs). Among the cities covered under the two
HPIs, 18 cities are state capitals1 and 33 are part of the smart city list released by Government of India. The housing price indices
have been computed on a quarterly basis starting from the quarter April to June, 2013, and updated up to quarter January - March,
2018, taking FY 2012 -13 as the base year. From the previous quarter, i.e. April-June 2018, base year has been shifted to FY 2017-
18. The housing prices are classified on the basis of carpet area size at city level (INR/sq. ft.) for units under three product category
levels namely <=60 sq.mt, >60 &<=110 sq.mt, and >110 sq.mt. The indices are computed using Laspeyres Methodology, followed
by calculation of a Four Quarter Weighted Moving Average with application of dynamic weights at product category level and
static base year weights on the Weighted Moving Average product category level prices, across all the quarters starting from the
base year.
1 Out of 18 State/UT capitals, 15 are also smart cities
2
Executive Summary
HPI@Assessment Prices during the quarter January to March-2019
HPI recorded an overall increase in 44 cities, decrease in 5 cities and no change in 1 city on Y-o-Y basis and increase in 31 cities,
decrease in 11 cities and no change in 8 cities on Q-o-Q basis.
Annual growth in HPI ranged from 22.2% in Bhiwadi to (-) 6% in Kochi at the end of the quarter, whereas, the quarterly growth in
HPI ranged from 9.9%% in Hyderabad to (-) 7.6% in Chakan.
Composite HPI@Assessment Prices based on 50 cities
Composite HPI@Assessment Prices stood at 83 in June, 2013 and has moved up to 107 in the current quarter i.e. March, 2019.
The index has moved up with a CAGR of 4.3% over the years.
The index increased by 7% on YoY basis.
Tier-wise movement
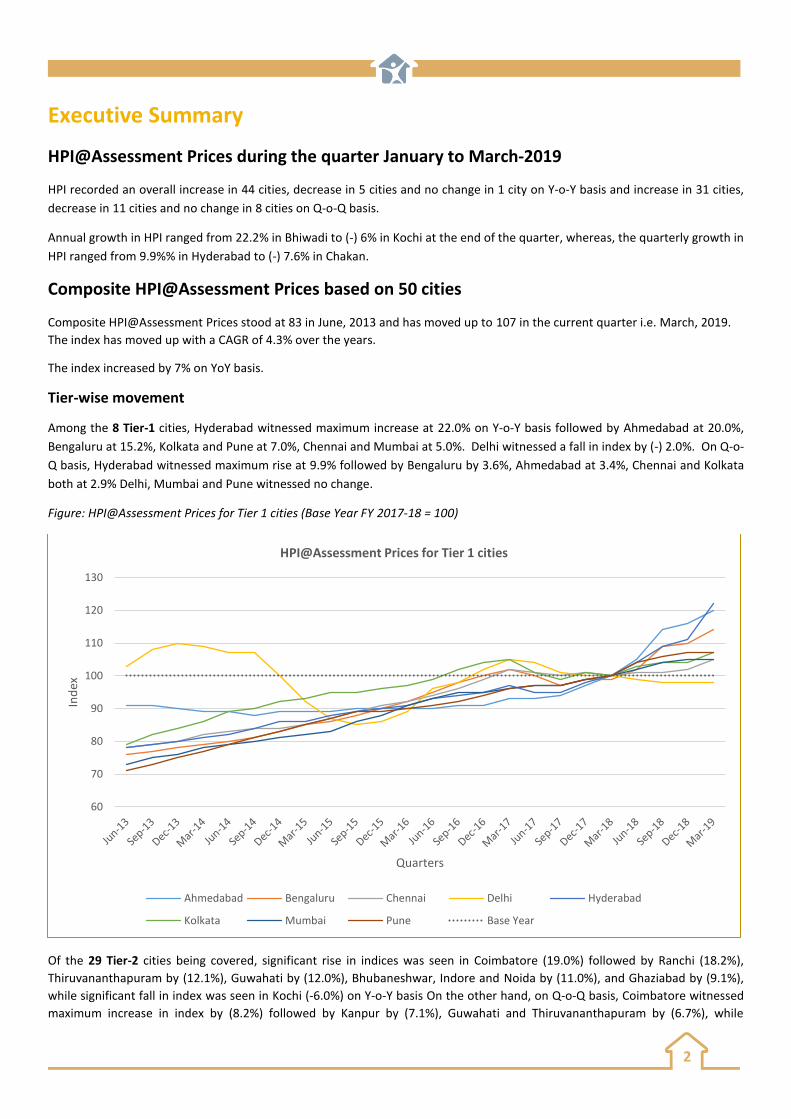
Among the 8 Tier-1 cities, Hyderabad witnessed maximum increase at 22.0% on Y-o-Y basis followed by Ahmedabad at 20.0%,
Bengaluru at 15.2%, Kolkata and Pune at 7.0%, Chennai and Mumbai at 5.0%. Delhi witnessed a fall in index by (-) 2.0%. On Q-o-
Q basis, Hyderabad witnessed maximum rise at 9.9% followed by Bengaluru by 3.6%, Ahmedabad at 3.4%, Chennai and Kolkata
both at 2.9% Delhi, Mumbai and Pune witnessed no change.
Figure: HPI@Assessment Prices for Tier 1 cities (Base Year FY 2017-18 = 100)
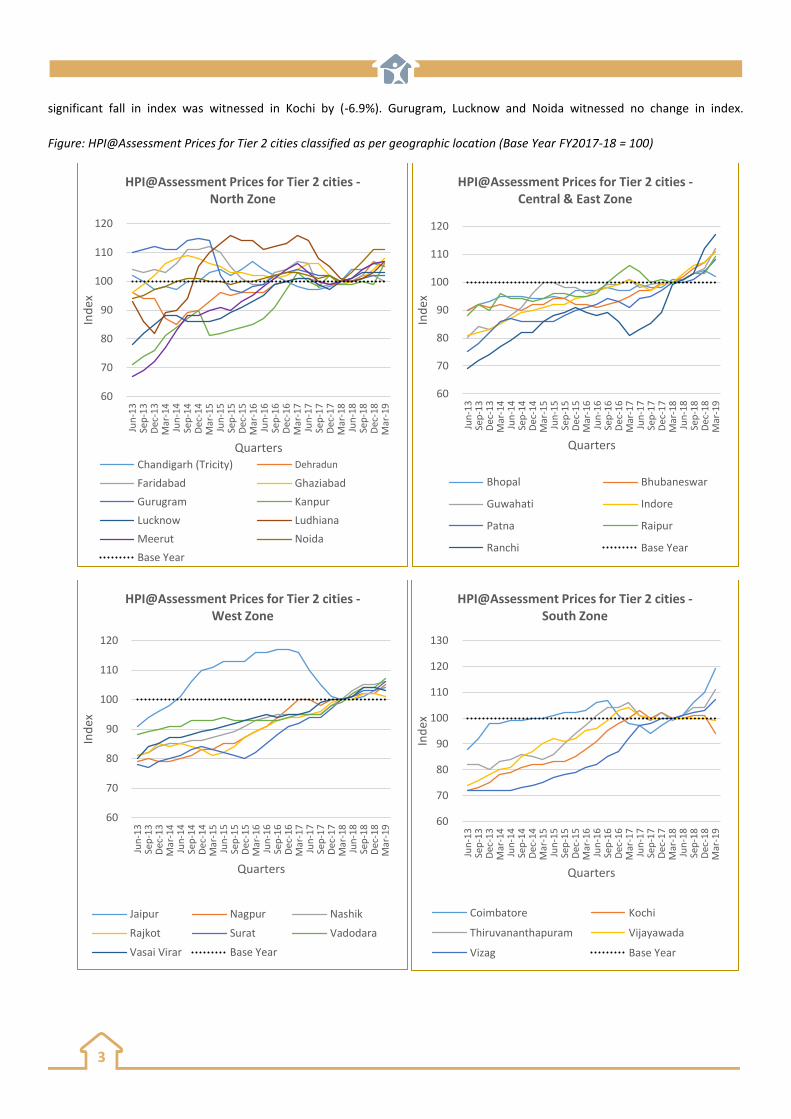
Of the 29 Tier-2 cities being covered, significant rise in indices was seen in Coimbatore (19.0%) followed by Ranchi (18.2%), Thiruvananthapuram by (12.1%), Guwahati by (12.0%), Bhubaneshwar, Indore and Noida by (11.0%), and Ghaziabad by (9.1%),
while significant fall in index was seen in Kochi (-6.0%) on Y-o-Y basis On the other hand, on Q-o-Q basis, Coimbatore witnessed
maximum increase in index by (8.2%) followed by Kanpur by (7.1%), Guwahati and Thiruvananthapuram by (6.7%), while
60
70
80
90
100
110
120
130
Ind
ex
Quarters
HPI@Assessment Prices for Tier 1 cities
Ahmedabad Bengaluru Chennai Delhi Hyderabad
Kolkata Mumbai Pune Base Year
3
significant fall in index was witnessed in Kochi by (-6.9%). Gurugram, Lucknow and Noida witnessed no change in index.
Figure: HPI@Assessment Prices for Tier 2 cities classified as per geographic location (Base Year FY2017-18 = 100)
60
70
80
90
100
110
120
Jun
-13
Sep
-13
Dec
-13
Mar
-14
Jun
-14
Sep
-14
Dec
-14
Mar
-15
Jun
-15
Sep
-15
Dec
-15
Mar
-16
Jun
-16
Sep
-16
Dec
-16
Mar
-17
Jun
-17
Sep
-17
Dec
-17
Mar
-18
Jun
-18
Sep
-18
Dec
-18
Mar
-19
Ind
ex
Quarters
HPI@Assessment Prices for Tier 2 cities -North Zone
Chandigarh (Tricity) Dehradun
Faridabad Ghaziabad
Gurugram Kanpur
Lucknow Ludhiana
Meerut Noida
Base Year
60
70
80
90
100
110
120
Jun
-13
Sep
-13
Dec
-13
Mar
-14
Jun
-14
Sep
-14
Dec
-14
Mar
-15
Jun
-15
Sep
-15
Dec
-15
Mar
-16
Jun
-16
Sep
-16
Dec
-16
Mar
-17
Jun
-17
Sep
-17
Dec
-17
Mar
-18
Jun
-18
Sep
-18
Dec
-18
Mar
-19
Ind
ex
Quarters
HPI@Assessment Prices for Tier 2 cities -Central & East Zone
Bhopal Bhubaneswar
Guwahati Indore
Patna Raipur
Ranchi Base Year
60
70
80
90
100
110
120
Jun
-13
Sep
-13
Dec
-13
Mar
-14
Jun
-14
Sep
-14
Dec
-14
Mar
-15
Jun
-15
Sep
-15
Dec
-15
Mar
-16
Jun
-16
Sep
-16
Dec
-16
Mar
-17
Jun
-17
Sep
-17
Dec
-17
Mar
-18
Jun
-18
Sep
-18
Dec
-18
Mar
-19
Ind
ex
Quarters
HPI@Assessment Prices for Tier 2 cities -West Zone
Jaipur Nagpur Nashik
Rajkot Surat Vadodara
Vasai Virar Base Year
60
70
80
90
100
110
120
130
Jun
-13
Sep
-13
Dec
-13
Mar
-14
Jun
-14
Sep
-14
Dec
-14
Mar
-15
Jun
-15
Sep
-15
Dec
-15
Mar
-16
Jun
-16
Sep
-16
Dec
-16
Mar
-17
Jun
-17
Sep
-17
Dec
-17
Mar
-18
Jun
-18
Sep
-18
Dec
-18
Mar
-19
Ind
ex
Quarters
HPI@Assessment Prices for Tier 2 cities -South Zone
Coimbatore Kochi
Thiruvananthapuram Vijayawada
Vizag Base Year
4
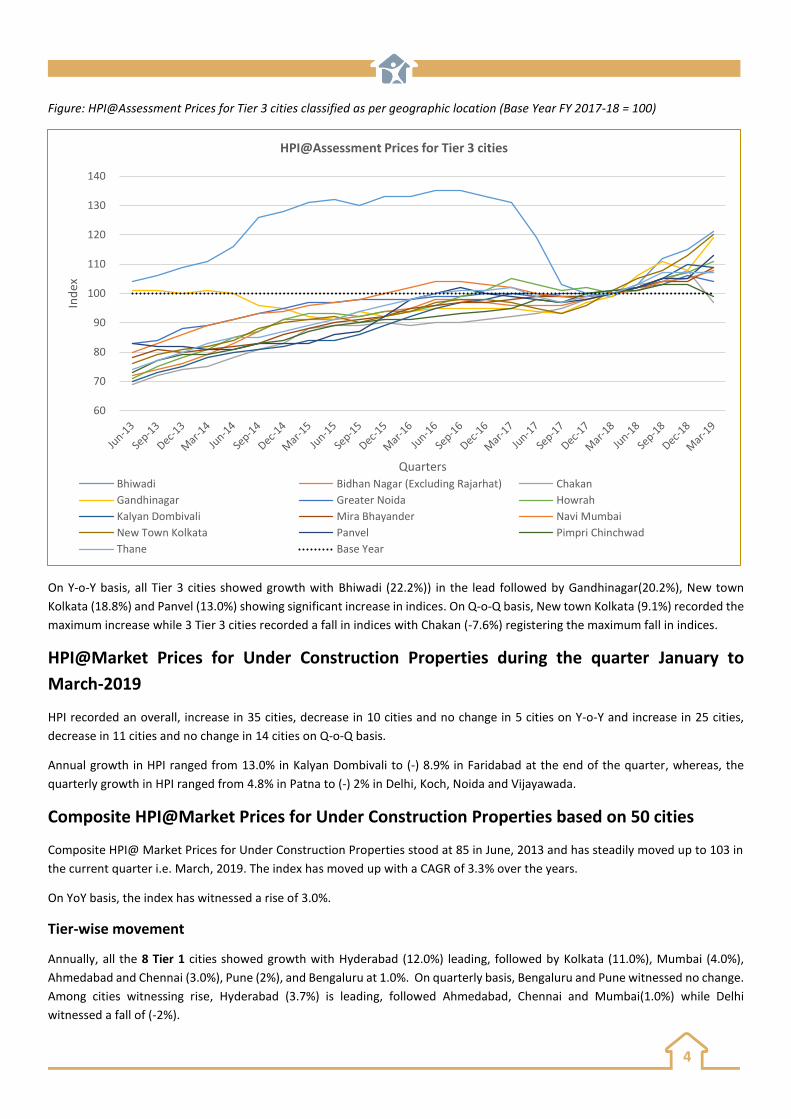
Figure: HPI@Assessment Prices for Tier 3 cities classified as per geographic location (Base Year FY 2017-18 = 100)
On Y-o-Y basis, all Tier 3 cities showed growth with Bhiwadi (22.2%)) in the lead followed by Gandhinagar(20.2%), New town
Kolkata (18.8%) and Panvel (13.0%) showing significant increase in indices. On Q-o-Q basis, New town Kolkata (9.1%) recorded the
maximum increase while 3 Tier 3 cities recorded a fall in indices with Chakan (-7.6%) registering the maximum fall in indices.
HPI@Market Prices for Under Construction Properties during the quarter January to
March-2019
HPI recorded an overall, increase in 35 cities, decrease in 10 cities and no change in 5 cities on Y-o-Y and increase in 25 cities,
decrease in 11 cities and no change in 14 cities on Q-o-Q basis.
Annual growth in HPI ranged from 13.0% in Kalyan Dombivali to (-) 8.9% in Faridabad at the end of the quarter, whereas, the
quarterly growth in HPI ranged from 4.8% in Patna to (-) 2% in Delhi, Koch, Noida and Vijayawada.
Composite HPI@Market Prices for Under Construction Properties based on 50 cities
Composite HPI@ Market Prices for Under Construction Properties stood at 85 in June, 2013 and has steadily moved up to 103 in
the current quarter i.e. March, 2019. The index has moved up with a CAGR of 3.3% over the years.
On YoY basis, the index has witnessed a rise of 3.0%.
Tier-wise movement
Annually, all the 8 Tier 1 cities showed growth with Hyderabad (12.0%) leading, followed by Kolkata (11.0%), Mumbai (4.0%),
Ahmedabad and Chennai (3.0%), Pune (2%), and Bengaluru at 1.0%. On quarterly basis, Bengaluru and Pune witnessed no change.
Among cities witnessing rise, Hyderabad (3.7%) is leading, followed Ahmedabad, Chennai and Mumbai(1.0%) while Delhi
witnessed a fall of (-2%).
60
70
80
90
100
110
120
130
140
Ind
ex
Quarters
HPI@Assessment Prices for Tier 3 cities
Bhiwadi Bidhan Nagar (Excluding Rajarhat) Chakan
Gandhinagar Greater Noida Howrah
Kalyan Dombivali Mira Bhayander Navi Mumbai
New Town Kolkata Panvel Pimpri Chinchwad
Thane Base Year
5
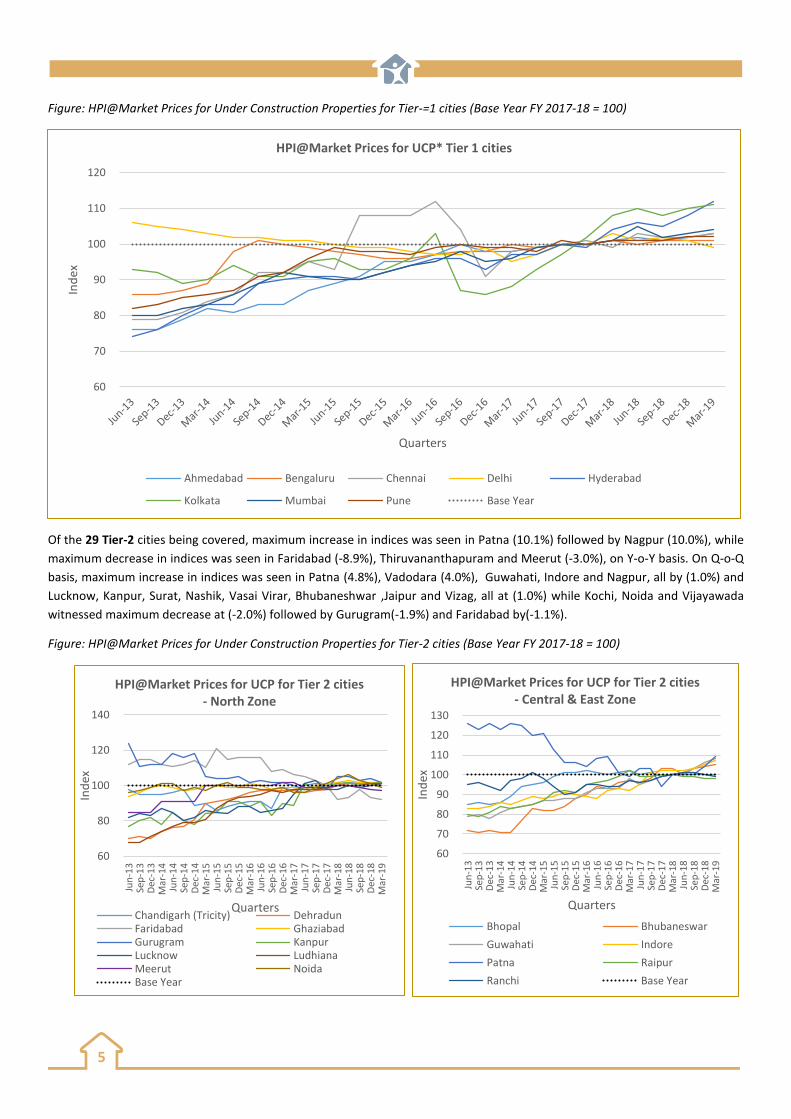
Figure: HPI@Market Prices for Under Construction Properties for Tier-=1 cities (Base Year FY 2017-18 = 100)
Of the 29 Tier-2 cities being covered, maximum increase in indices was seen in Patna (10.1%) followed by Nagpur (10.0%), while
maximum decrease in indices was seen in Faridabad (-8.9%), Thiruvananthapuram and Meerut (-3.0%), on Y-o-Y basis. On Q-o-Q
basis, maximum increase in indices was seen in Patna (4.8%), Vadodara (4.0%), Guwahati, Indore and Nagpur, all by (1.0%) and
Lucknow, Kanpur, Surat, Nashik, Vasai Virar, Bhubaneshwar ,Jaipur and Vizag, all at (1.0%) while Kochi, Noida and Vijayawada
witnessed maximum decrease at (-2.0%) followed by Gurugram(-1.9%) and Faridabad by(-1.1%).
Figure: HPI@Market Prices for Under Construction Properties for Tier-2 cities (Base Year FY 2017-18 = 100)
60
70
80
90
100
110
120
Ind
ex
Quarters
HPI@Market Prices for UCP* Tier 1 cities
Ahmedabad Bengaluru Chennai Delhi Hyderabad
Kolkata Mumbai Pune Base Year
60
80
100
120
140
Jun
-13
Sep
-13
Dec
-13
Mar
-14
Jun
-14
Sep
-14
Dec
-14
Mar
-15
Jun
-15
Sep
-15
Dec
-15
Mar
-16
Jun
-16
Sep
-16
Dec
-16
Mar
-17
Jun
-17
Sep
-17
Dec
-17
Mar
-18
Jun
-18
Sep
-18
Dec
-18
Mar
-19
Ind
ex
Quarters
HPI@Market Prices for UCP for Tier 2 cities - North Zone
Chandigarh (Tricity) DehradunFaridabad GhaziabadGurugram KanpurLucknow LudhianaMeerut NoidaBase Year
60
70
80
90
100
110
120
130
Jun
-13
Sep
-13
Dec
-13
Mar
-14
Jun
-14
Sep
-14
Dec
-14
Mar
-15
Jun
-15
Sep
-15
Dec
-15
Mar
-16
Jun
-16
Sep
-16
Dec
-16
Mar
-17
Jun
-17
Sep
-17
Dec
-17
Mar
-18
Jun
-18
Sep
-18
Dec
-18
Mar
-19
Ind
ex
Quarters
HPI@Market Prices for UCP for Tier 2 cities - Central & East Zone
Bhopal Bhubaneswar
Guwahati Indore
Patna Raipur
Ranchi Base Year
6
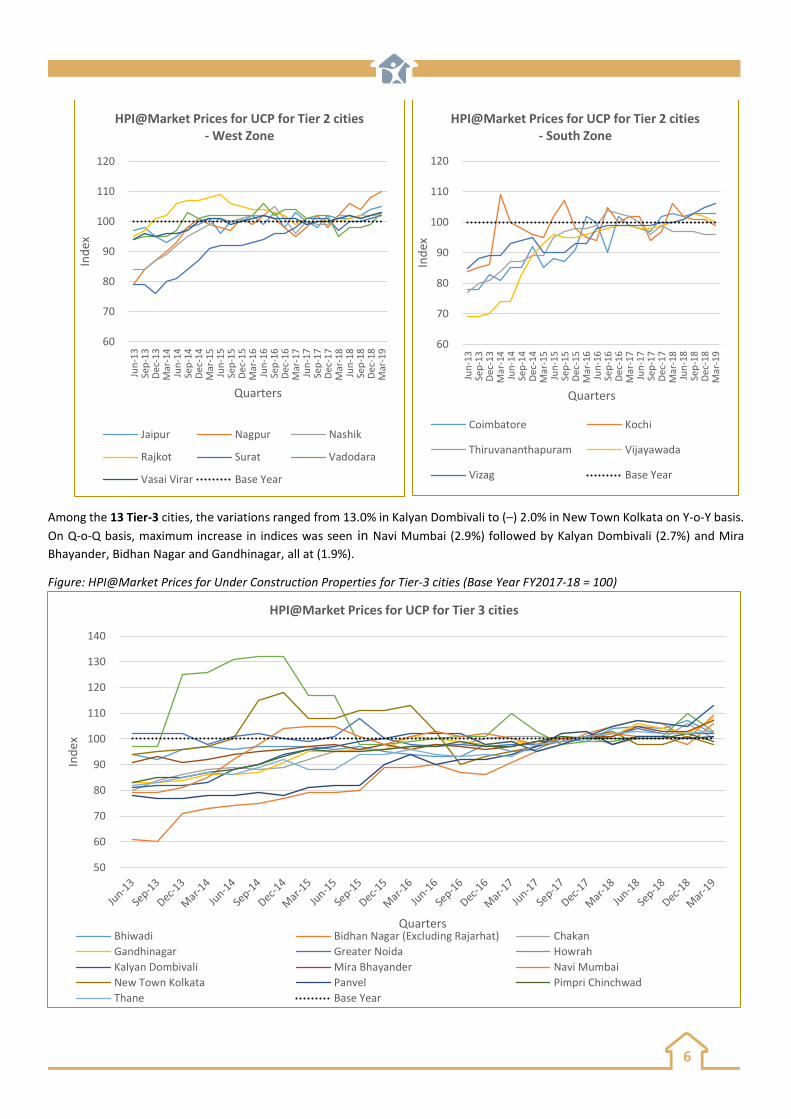
Among the 13 Tier-3 cities, the variations ranged from 13.0% in Kalyan Dombivali to (–) 2.0% in New Town Kolkata on Y-o-Y basis.
On Q-o-Q basis, maximum increase in indices was seen in Navi Mumbai (2.9%) followed by Kalyan Dombivali (2.7%) and Mira
Bhayander, Bidhan Nagar and Gandhinagar, all at (1.9%).
Figure: HPI@Market Prices for Under Construction Properties for Tier-3 cities (Base Year FY2017-18 = 100)
60
70
80
90
100
110
120
Jun
-13
Sep
-13
Dec
-13
Mar
-14
Jun
-14
Sep
-14
Dec
-14
Mar
-15
Jun
-15
Sep
-15
Dec
-15
Mar
-16
Jun
-16
Sep
-16
Dec
-16
Mar
-17
Jun
-17
Sep
-17
Dec
-17
Mar
-18
Jun
-18
Sep
-18
Dec
-18
Mar
-19
Ind
ex
Quarters
HPI@Market Prices for UCP for Tier 2 cities - West Zone
Jaipur Nagpur Nashik
Rajkot Surat Vadodara
Vasai Virar Base Year
60
70
80
90
100
110
120
Jun
-13
Sep
-13
Dec
-13
Mar
-14
Jun
-14
Sep
-14
Dec
-14
Mar
-15
Jun
-15
Sep
-15
Dec
-15
Mar
-16
Jun
-16
Sep
-16
Dec
-16
Mar
-17
Jun
-17
Sep
-17
Dec
-17
Mar
-18
Jun
-18
Sep
-18
Dec
-18
Mar
-19
Ind
ex
Quarters
HPI@Market Prices for UCP for Tier 2 cities - South Zone
Coimbatore Kochi
Thiruvananthapuram Vijayawada
Vizag Base Year
50
60
70
80
90
100
110
120
130
140
Ind
ex
Quarters
HPI@Market Prices for UCP for Tier 3 cities
Bhiwadi Bidhan Nagar (Excluding Rajarhat) Chakan
Gandhinagar Greater Noida Howrah
Kalyan Dombivali Mira Bhayander Navi Mumbai
New Town Kolkata Panvel Pimpri Chinchwad
Thane Base Year

7
Geographic Trend
Zone Wise movement under HPI@Assessment Prices during the quarter January to March-
2019
(Bhiwadi, Chandigarh, Dehradun, Delhi, Faridabad, Ghaziabad, Greater Noida, Gurugram, Kanpur, Lucknow, Ludhiana, Meerut
and Noida)
On Quarterly basis, the index has shown an overall increase in 5 cities, decrease in 3 cities and no change in 5 cities. Rise in
Housing Price Index was witnessed in Bhiwadi (7.1%), Kanpur (7.1%), Ludhiana (3.9%), Ghaziabad (3.8%), and Meerut
(0.9%).Chandigarh (Tricity) (-0.9%), Dehradun (-1.9%) and Faridabad (-2.0%) witnessed a fall and index while Noida, Lucknow,
Greater Noida, Gurugram and Delhi remained stable
On Annual basis, the index has shown increase in 11 cities, decrease in 1 cities and no change in 1 city. Rise in Housing Price
Index was witnessed in Bhiwadi (22.2%), Noida (11.0%), Ghaziabad (9.1%), Kanpur (7.1%), and Meerut (7.0%) Dehradun (6.1%),
Ludhiana (5.9%), Chandigarh (Tricity) (5.0%), Lucknow and Greater Noida (3.0%) and Gurugram (2.0%). Faridabad witnessed
no change. The city witnessing a fall in index is Delhi (-2%).
(Bidhan Nagar, Bhopal, Bhubaneswar, Guwahati, Howrah, Indore, Kolkata, New Town Kolkata, Patna, Raipur and Ranchi)
On Quarterly basis, the index has shown an overall increase in 9 cities and decline IN in 2 cities. New Town Kolkata (9.1%),
Guwahati (6.7%), Raipur (5.8%), Howrah (5.7%), Ranchi (4.5%), Patna (3.8%), Bhubaneshwar and Indore (3.7%) and Kolkata
(2.9%) witnessed a rise in prices. Bidhan Nagar (-0.9%) and Bhopal (-1.9%) witnessed a fall in housing index.
On Annual basis, the index has shown an overall increase in all 11 cities. The cities exhibiting increase in index are New Town
Kolkata (18.8%), Ranchi (18.2%), Guwahati (12.0%), Howrah, Indore and Bhubaneswar (11.0%), Raipur(9.0%), Patna (8.0%),
Kolkata and Bidhan Nagar(7.0% and Bhopal(1.0%).
(Ahmedabad, Chakan, Gandhinagar, Jaipur, Kalyan Dombivali, Mira Bhayander, Mumbai, Nagpur, Nashik, Navi Mumbai, Panvel,
Pimpri Chinchwad, Pune, Rajkot, Surat, Thane, Vadodara and Vasai Virar)
On Quarterly basis, the index has shown an overall increase in 11 cities, no change in 3 cities and fall in 4 cities. Rise in Housing
Price Index was witnessed in Panvel (5.6%), Gandhinagar (3.5%), Ahmedabad (3.4%), Vadodara, Surat and Nagpur (2.9%), Mira
Bhayander (2.8%) Jaipur and Nashik (1.0%), Kalyan Dombivali and Navi Mumbai (0.9%).index remained stable in Mumbai, Pune
and Thane. Whereas, a decrease in Housing Price Index was evident in Rajkot and Vasai Virar (-1.0%), Pimpri Chinchwad (-3.9%)
and Chakan (-7.6%).
On Annual basis, the index has shown an overall increase in 16 cities and decrease in 2 cities. The cities exhibiting increase in
index are Gandhinagar (20.2%), Ahmedabad (20.0%), Panvel (13.0%), Mira Bhayander and Kalyan Dombivali (9.0%), Vadodara
(8.1%), Navi Mumbai (8%), Pune Nagpur and Thane (7.0%), Surat and Nashik (6.0%), Nagpur and Mumbai (5.0%), Jaipur (4.0%),
Vasai Virar (3.0%) and Rajkot (1.0%). On the other hand, cities that witnessed a fall in index are Pimpri Chinchwad (-2.0%) and
Chakan (-3.0%).
North Zone
East & Central Zone
West Zone
South Zone
8
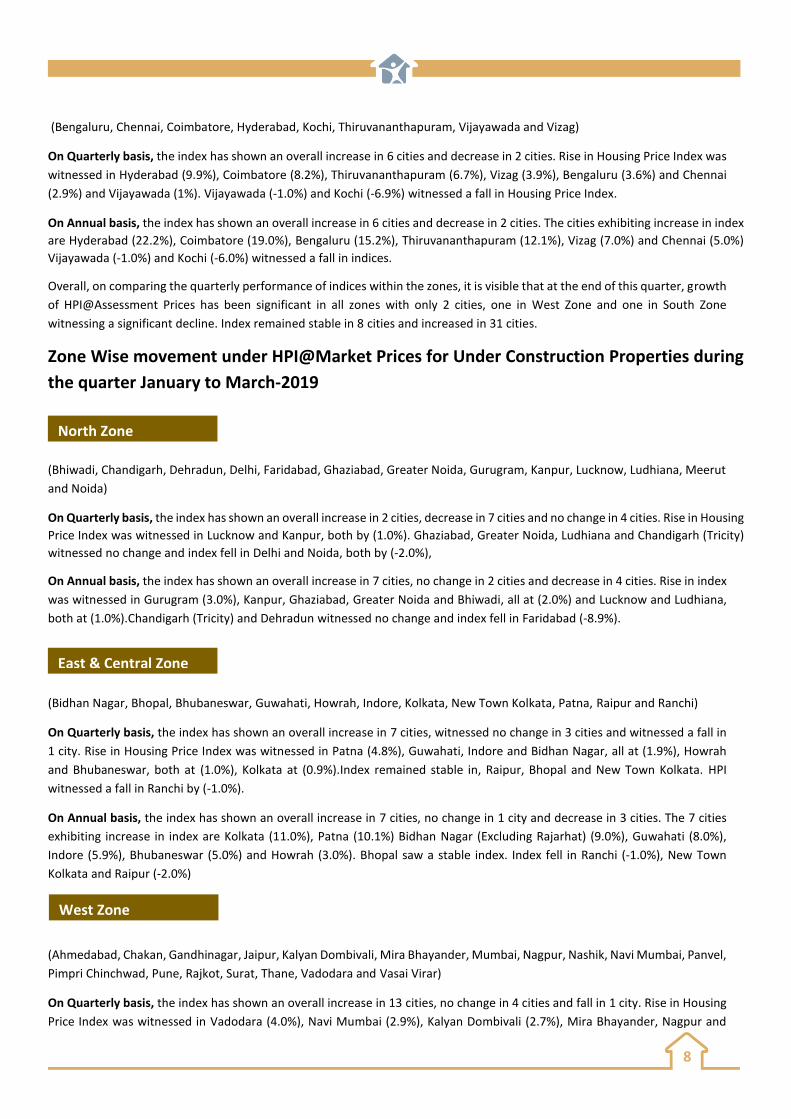
(Bengaluru, Chennai, Coimbatore, Hyderabad, Kochi, Thiruvananthapuram, Vijayawada and Vizag)
On Quarterly basis, the index has shown an overall increase in 6 cities and decrease in 2 cities. Rise in Housing Price Index was
witnessed in Hyderabad (9.9%), Coimbatore (8.2%), Thiruvananthapuram (6.7%), Vizag (3.9%), Bengaluru (3.6%) and Chennai
(2.9%) and Vijayawada (1%). Vijayawada (-1.0%) and Kochi (-6.9%) witnessed a fall in Housing Price Index.
On Annual basis, the index has shown an overall increase in 6 cities and decrease in 2 cities. The cities exhibiting increase in index
are Hyderabad (22.2%), Coimbatore (19.0%), Bengaluru (15.2%), Thiruvananthapuram (12.1%), Vizag (7.0%) and Chennai (5.0%)
Vijayawada (-1.0%) and Kochi (-6.0%) witnessed a fall in indices.
Overall, on comparing the quarterly performance of indices within the zones, it is visible that at the end of this quarter, growth
of HPI@Assessment Prices has been significant in all zones with only 2 cities, one in West Zone and one in South Zone
witnessing a significant decline. Index remained stable in 8 cities and increased in 31 cities.
Zone Wise movement under HPI@Market Prices for Under Construction Properties during
the quarter January to March-2019
(Bhiwadi, Chandigarh, Dehradun, Delhi, Faridabad, Ghaziabad, Greater Noida, Gurugram, Kanpur, Lucknow, Ludhiana, Meerut
and Noida)
On Quarterly basis, the index has shown an overall increase in 2 cities, decrease in 7 cities and no change in 4 cities. Rise in Housing
Price Index was witnessed in Lucknow and Kanpur, both by (1.0%). Ghaziabad, Greater Noida, Ludhiana and Chandigarh (Tricity)
witnessed no change and index fell in Delhi and Noida, both by (-2.0%),
On Annual basis, the index has shown an overall increase in 7 cities, no change in 2 cities and decrease in 4 cities. Rise in index
was witnessed in Gurugram (3.0%), Kanpur, Ghaziabad, Greater Noida and Bhiwadi, all at (2.0%) and Lucknow and Ludhiana,
both at (1.0%).Chandigarh (Tricity) and Dehradun witnessed no change and index fell in Faridabad (-8.9%).
(Bidhan Nagar, Bhopal, Bhubaneswar, Guwahati, Howrah, Indore, Kolkata, New Town Kolkata, Patna, Raipur and Ranchi)
On Quarterly basis, the index has shown an overall increase in 7 cities, witnessed no change in 3 cities and witnessed a fall in
1 city. Rise in Housing Price Index was witnessed in Patna (4.8%), Guwahati, Indore and Bidhan Nagar, all at (1.9%), Howrah
and Bhubaneswar, both at (1.0%), Kolkata at (0.9%).Index remained stable in, Raipur, Bhopal and New Town Kolkata. HPI
witnessed a fall in Ranchi by (-1.0%).
On Annual basis, the index has shown an overall increase in 7 cities, no change in 1 city and decrease in 3 cities. The 7 cities
exhibiting increase in index are Kolkata (11.0%), Patna (10.1%) Bidhan Nagar (Excluding Rajarhat) (9.0%), Guwahati (8.0%),
Indore (5.9%), Bhubaneswar (5.0%) and Howrah (3.0%). Bhopal saw a stable index. Index fell in Ranchi (-1.0%), New Town
Kolkata and Raipur (-2.0%)
(Ahmedabad, Chakan, Gandhinagar, Jaipur, Kalyan Dombivali, Mira Bhayander, Mumbai, Nagpur, Nashik, Navi Mumbai, Panvel,
Pimpri Chinchwad, Pune, Rajkot, Surat, Thane, Vadodara and Vasai Virar)
On Quarterly basis, the index has shown an overall increase in 13 cities, no change in 4 cities and fall in 1 city. Rise in Housing
Price Index was witnessed in Vadodara (4.0%), Navi Mumbai (2.9%), Kalyan Dombivali (2.7%), Mira Bhayander, Nagpur and
North Zone
East & Central Zone
West Zone
9
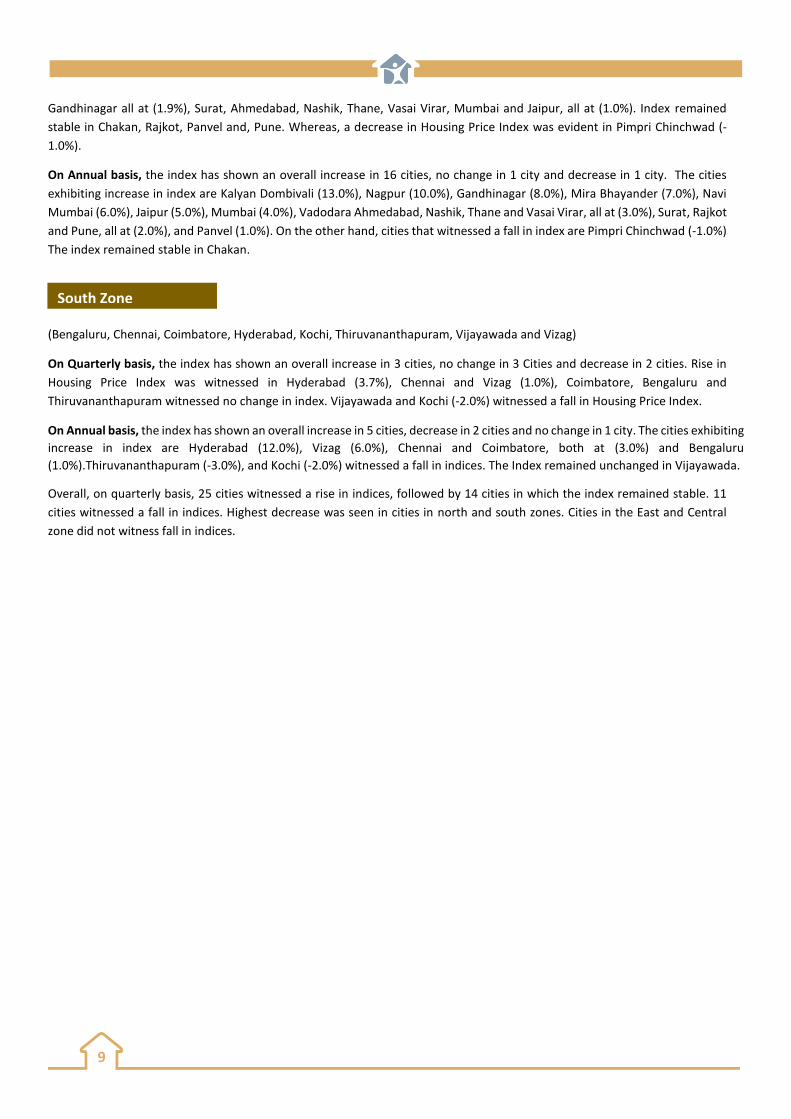
Gandhinagar all at (1.9%), Surat, Ahmedabad, Nashik, Thane, Vasai Virar, Mumbai and Jaipur, all at (1.0%). Index remained
stable in Chakan, Rajkot, Panvel and, Pune. Whereas, a decrease in Housing Price Index was evident in Pimpri Chinchwad (-
1.0%).
On Annual basis, the index has shown an overall increase in 16 cities, no change in 1 city and decrease in 1 city. The cities
exhibiting increase in index are Kalyan Dombivali (13.0%), Nagpur (10.0%), Gandhinagar (8.0%), Mira Bhayander (7.0%), Navi
Mumbai (6.0%), Jaipur (5.0%), Mumbai (4.0%), Vadodara Ahmedabad, Nashik, Thane and Vasai Virar, all at (3.0%), Surat, Rajkot
and Pune, all at (2.0%), and Panvel (1.0%). On the other hand, cities that witnessed a fall in index are Pimpri Chinchwad (-1.0%)
The index remained stable in Chakan.
(Bengaluru, Chennai, Coimbatore, Hyderabad, Kochi, Thiruvananthapuram, Vijayawada and Vizag)
On Quarterly basis, the index has shown an overall increase in 3 cities, no change in 3 Cities and decrease in 2 cities. Rise in
Housing Price Index was witnessed in Hyderabad (3.7%), Chennai and Vizag (1.0%), Coimbatore, Bengaluru and
Thiruvananthapuram witnessed no change in index. Vijayawada and Kochi (-2.0%) witnessed a fall in Housing Price Index.
On Annual basis, the index has shown an overall increase in 5 cities, decrease in 2 cities and no change in 1 city. The cities exhibiting
increase in index are Hyderabad (12.0%), Vizag (6.0%), Chennai and Coimbatore, both at (3.0%) and Bengaluru
(1.0%).Thiruvananthapuram (-3.0%), and Kochi (-2.0%) witnessed a fall in indices. The Index remained unchanged in Vijayawada.
Overall, on quarterly basis, 25 cities witnessed a rise in indices, followed by 14 cities in which the index remained stable. 11
cities witnessed a fall in indices. Highest decrease was seen in cities in north and south zones. Cities in the East and Central
zone did not witness fall in indices.
South Zone

APPENDIX 1 Table below comprises of Composite HPI@Assessment Prices computed on basis of 50 cities (Base Year FY 2017-18 =100)
Quarter Ending Jun-13 Sep-13 Dec-13 Mar-14 Jun-14 Sep-14 Dec-14 Mar-15 Jun-15 Sep-15 Dec-15 Mar-16 Jun-16 Sep-16 Dec-16 Mar-17 Jun-17 Sep-17 Dec-17 Mar-18 June-18 Sep-18 Dec-18 Mar-19
Composite HPI@Assessment
Prices 83 85 86 88 88 89 90 89 89 90 91 92 95 97 98 100 99 98 99 100 101 103 105 107
Table below comprises of HPI@Assessment Prices computed for 50 cities (Base Year FY 2017-18 =100)
Quarter Ending Jun-13 Sep-13 Dec-13 Mar-14 Jun-14 Sep-14 Dec-14 Mar-15 Jun-15 Sep-15 Dec-15 Mar-16 Jun-16 Sep-16 Dec-16 Mar-17 Jun-17 Sep-17 Dec-17 Mar-18 June-18 Sep-18 Dec-18 Mar-19 Ahmedabad 91 91 90 89 89 88 89 89 89 90 90 90 90 91 91 93 93 94 97 100 105 114 116 120 Bengaluru 76 77 78 79 80 81 83 85 86 88 90 92 95 98 100 102 100 97 99 99 102 109 110 114 Bhiwadi 104 106 109 111 116 126 128 131 132 130 133 133 135 135 133 131 119 103 100 99 103 112 113 121 Bhopal 90 92 93 95 95 95 94 94 95 94 97 97 97 98 97 97 99 98 98 101 101 103 104 102 Bhubaneswar 90 92 91 92 91 90 92 92 94 94 92 92 91 92 93 95 97 97 100 100 102 105 107 111
Bidhan Nagar 72 74 76 79 83 87 91 91 91 92 94 95 98 98 97 96 96 96 98 100 102 105 108 107 Chakan 69 72 74 75 78 81 83 88 89 89 90 89 90 90 91 92 93 95 98 100 103 104 105 97 Chandigarh (Tricity) 102 100 97 98 97 100 100 103 104 102 104 107 104 102 100 98 97 97 98 100 104 104 106 105 Chennai 78 79 80 82 83 84 84 85 87 89 91 92 94 96 99 102 101 100 101 100 101 101 102 105
Coimbatore 88 92 98 98 99 99 100 100 101 102 102 103 106 107 101 98 97 94 97 100 101 106 110 119 Dehradun 96 94 94 87 85 89 90 93 96 95 96 96 96 99 100 101 101 100 99 99 100 102 107 105 Delhi 103 108 110 109 107 107 100 92 87 85 86 89 96 98 102 105 104 101 100 100 99 98 98 98 Faridabad 104 103 104 103 106 111 111 112 110 105 101 99 99 103 104 107 106 98 99 100 100 102 102 100 Gandhinagar 101 101 100 101 100 96 95 92 91 94 92 94 95 95 95 95 94 93 97 99 106 111 115 119 Ghaziabad 96 99 102 106 108 109 108 106 105 103 103 102 102 101 102 104 106 106 102 99 100 101 104 108 Greater Noida 83 84 88 89 91 93 95 97 97 98 98 98 99 99 100 100 99 100 100 101 102 103 104 104 Gurugram 110 111 112 111 111 114 115 114 102 97 96 98 99 102 103 104 103 102 102 100 100 101 102 102 Guwahati 80 84 83 85 88 91 96 100 100 98 98 96 97 99 99 101 98 99 100 100 101 103 105 112 Howrah 71 75 78 81 85 87 91 93 93 92 94 94 96 99 101 105 103 101 102 100 102 105 105 111
Hyderabad 78 79 80 81 82 84 86 86 88 89 90 91 93 94 95 97 95 95 98 100 104 109 111 122 Indore 81 82 83 85 87 89 90 91 92 92 94 95 97 98 99 101 99 97 99 100 103 106 107 111 Jaipur 91 94 96 98 101 106 110 111 113 113 113 116 116 117 117 116 110 105 101 100 100 101 103 104 Kalyan Dombivali 70 73 75 78 80 81 82 84 84 86 89 92 95 97 98 100 100 99 99 100 102 105 108 109
Kanpur 71 74 76 81 84 87 90 81 82 83 84 85 87 91 97 103 100 98 102 99 99 100 99 106 Kochi 72 73 75 78 79 81 82 82 83 83 85 88 91 95 98 100 103 100 102 100 100 101 101 94 Kolkata 79 82 84 86 89 90 92 93 95 95 96 97 99 102 104 105 101 99 101 100 103 104 104 107 Lucknow 78 82 85 88 88 86 86 86 87 89 91 93 95 99 100 101 101 99 97 100 101 103 103 103 Ludhiana 93 86 82 89 90 94 105 110 113 116 114 114 111 112 113 116 114 108 105 101 100 101 103 107 Meerut 67 69 72 77 83 88 88 90 91 90 93 95 98 101 104 106 103 100 99 100 101 104 106 107 Mira Bhayander 78 81 80 81 82 83 86 88 90 91 92 95 96 97 97 98 99 99 99 100 102 104 106 109 Mumbai 73 75 76 78 79 80 81 82 83 86 88 91 93 95 95 96 97 97 99 100 102 104 105 105 Nagpur 79 80 79 79 80 81 83 83 85 85 87 89 91 94 97 100 100 98 100 100 101 102 102 105 Nashik 81 82 84 85 85 86 86 87 88 89 91 93 94 95 95 95 95 95 98 100 103 105 105 106 Navi Mumbai 80 83 86 89 91 93 94 96 97 98 100 102 104 104 103 102 100 99 98 100 101 104 107 108 New Town Kolkata 76 79 81 82 84 88 90 91 92 90 92 94 97 98 98 97 95 93 96 101 105 108 110 120 Noida 94 95 97 98 100 101 101 100 100 99 100 100 101 102 103 103 102 101 102 100 103 107 111 111 Panvel 83 82 82 81 81 83 83 83 86 87 92 98 100 102 100 99 98 97 98 100 102 105 107 113 Patna 75 78 82 86 87 86 86 86 86 88 90 91 92 94 93 91 94 95 97 100 100 101 104 108 Pimpri Chinchwad 73 77 79 79 81 83 84 87 89 90 91 91 92 93 94 95 98 97 100 101 101 103 103 99 Pune 71 73 75 77 79 81 83 85 87 89 89 90 91 92 94 96 97 97 99 100 104 106 107 107 Raipur 88 92 90 96 94 94 93 94 96 96 95 95 96 100 103 106 104 100 101 100 101 103 103 109 Rajkot 81 82 85 84 85 84 83 81 82 84 87 89 91 93 94 94 95 96 99 100 100 102 102 101 Ranchi 69 72 74 77 79 82 82 86 88 89 91 89 88 89 86 81 83 85 89 99 101 103 112 117 Surat 78 77 79 80 81 83 84 83 82 81 80 82 85 88 91 92 94 94 97 100 101 103 103 106
Thane 74 77 80 83 85 85 87 89 91 94 96 98 100 101 101 102 99 97 99 100 103 107 107 107 Thiruvananthapuram 82 82 80 83 84 86 85 84 86 90 94 97 101 104 104 106 101 99 102 99 101 104 104 111 Vadodara 88 89 90 91 91 93 93 93 94 93 93 93 93 93 94 95 95 95 98 99 102 104 104 107 Vasai Virar 80 84 85 87 87 88 89 90 91 92 93 94 95 94 95 95 96 99 100 100 101 104 104 103
Vijayawada 74 76 78 80 81 85 87 90 92 91 92 95 96 99 103 104 101 100 100 100 100 100 100 99 Vizag 72 72 72 72 72 73 74 75 77 78 79 81 82 85 87 92 97 98 100 100 101 102 103 107
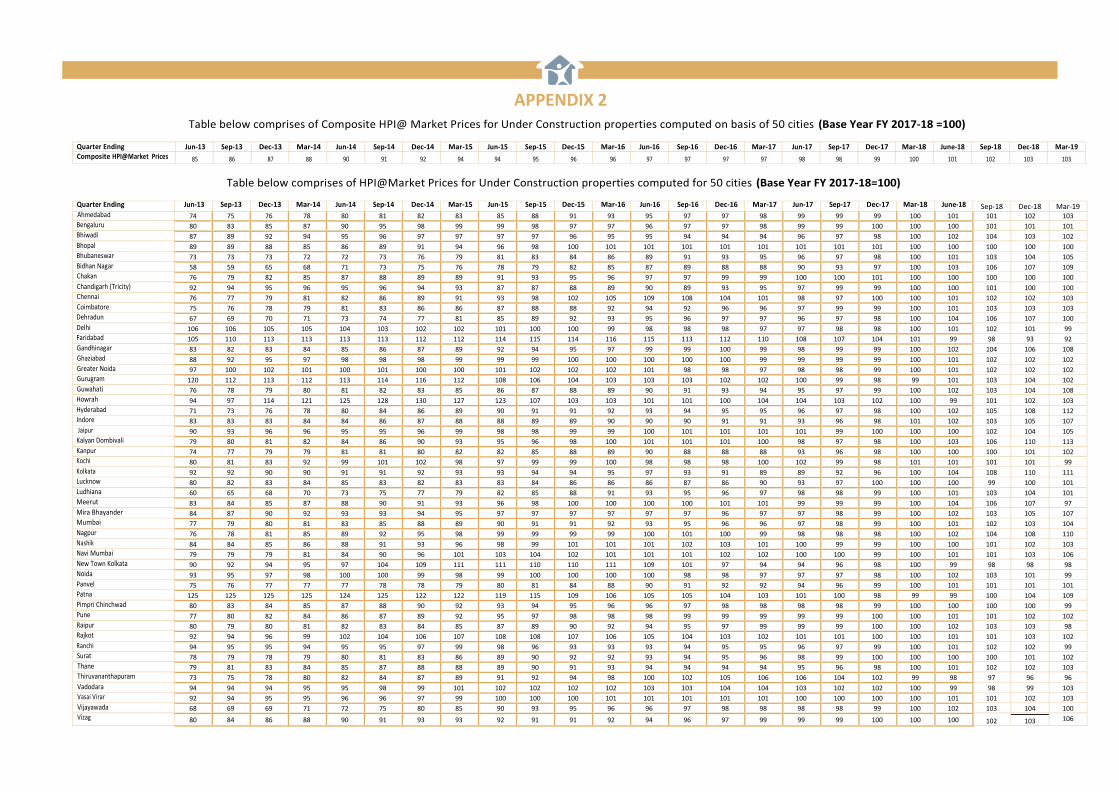
Table below comprises of Composite HPI@ Market Prices for Under Construction properties computed on basis of 50 cities (Base Year FY 2017-18 =100)
Quarter Ending Jun-13 Sep-13 Dec-13 Mar-14 Jun-14 Sep-14 Dec-14 Mar-15 Jun-15 Sep-15 Dec-15 Mar-16 Jun-16 Sep-16 Dec-16 Mar-17 Jun-17 Sep-17 Dec-17 Mar-18 June-18 Sep-18 Dec-18 Mar-19 Composite HPI@Market Prices 85 86 87 88 90 91 92 94 94 95 96 96 97 97 97 97 98 98 99 100 101 102 103 103
Table below comprises of HPI@Market Prices for Under Construction properties computed for 50 cities (Base Year FY 2017-18=100)
Quarter Ending Jun-13 Sep-13 Dec-13 Mar-14 Jun-14 Sep-14 Dec-14 Mar-15 Jun-15 Sep-15 Dec-15 Mar-16 Jun-16 Sep-16 Dec-16 Mar-17 Jun-17 Sep-17 Dec-17 Mar-18 June-18 Sep-18 Dec-18 Mar-19 Ahmedabad 74 75 76 78 80 81 82 83 85 88 91 93 95 97 97 98 99 99 99 100 101 101 102 103 Bengaluru 80 83 85 87 90 95 98 99 99 98 97 97 96 97 97 98 99 99 100 100 100 101 101 101 Bhiwadi 87 89 92 94 95 96 97 97 97 97 96 95 95 94 94 94 96 97 98 100 102 104 103 102
Bhopal 89 89 88 85 86 89 91 94 96 98 100 101 101 101 101 101 101 101 101 100 100 100 100 100 Bhubaneswar 73 73 73 72 72 73 76 79 81 83 84 86 89 91 93 95 96 97 98 100 101 103 104 105 Bidhan Nagar 58 59 65 68 71 73 75 76 78 79 82 85 87 89 88 88 90 93 97 100 103 106 107 109 Chakan 76 79 82 85 87 88 89 89 91 93 95 96 97 97 99 99 100 100 101 100 100 100 100 100
Chandigarh (Tricity) 92 94 95 96 95 96 94 93 87 87 88 89 90 89 93 95 97 99 99 100 100 101 100 100 Chennai 76 77 79 81 82 86 89 91 93 98 102 105 109 108 104 101 98 97 100 100 101 102 102 103 Coimbatore 75 76 78 79 81 83 86 86 87 88 88 92 94 92 96 96 97 99 99 100 101 103 103 103 Dehradun 67 69 70 71 73 74 77 81 85 89 92 93 95 96 97 97 96 97 98 100 104 106 107 100
Delhi 106 106 105 105 104 103 102 102 101 100 100 99 98 98 98 97 97 98 98 100 101 102 101 99 Faridabad 105 110 113 113 113 113 112 112 114 115 114 116 115 113 112 110 108 107 104 101 99 98 93 92 Gandhinagar 83 82 83 84 85 86 87 89 92 94 95 97 99 99 100 99 98 99 99 100 102 104 106 108 Ghaziabad 88 92 95 97 98 98 98 99 99 99 100 100 100 100 100 99 99 99 99 100 101 102 102 102 Greater Noida 97 100 102 101 100 101 100 100 101 102 102 102 101 98 98 97 98 98 99 100 101 102 102 102 Gurugram 120 112 113 112 113 114 116 112 108 106 104 103 103 103 102 102 100 99 98 99 101 103 104 102 Guwahati 76 78 79 80 81 82 83 85 86 87 88 89 90 91 93 94 95 97 99 100 102 103 104 108 Howrah 94 97 114 121 125 128 130 127 123 107 103 103 101 101 100 104 104 103 102 100 99 101 102 103 Hyderabad 71 73 76 78 80 84 86 89 90 91 91 92 93 94 95 95 96 97 98 100 102 105 108 112 Indore 83 83 83 84 84 86 87 88 88 89 89 90 90 90 91 91 93 96 98 101 102 103 105 107
Jaipur 90 93 96 96 95 95 96 99 98 98 99 99 100 101 101 101 101 99 100 100 100 102 104 105 Kalyan Dombivali 79 80 81 82 84 86 90 93 95 96 98 100 101 101 101 100 98 97 98 100 103 106 110 113 Kanpur 74 77 79 79 81 81 80 82 82 85 88 89 90 88 88 88 93 96 98 100 100 100 101 102 Kochi 80 81 83 92 99 101 102 98 97 99 99 100 98 98 98 100 102 99 98 101 101 101 101 99
Kolkata 92 92 90 90 91 91 92 93 93 94 94 95 97 93 91 89 89 92 96 100 104 108 110 111 Lucknow 80 82 83 84 85 83 82 83 83 84 86 86 86 87 86 90 93 97 100 100 100 99 100 101 Ludhiana 60 65 68 70 73 75 77 79 82 85 88 91 93 95 96 97 98 98 99 100 101 103 104 101 Meerut 83 84 85 87 88 90 91 93 96 98 100 100 100 100 101 101 99 99 99 100 104 106 107 97 Mira Bhayander 84 87 90 92 93 93 94 95 97 97 97 97 97 97 96 97 97 98 99 100 102 103 105 107 Mumbai 77 79 80 81 83 85 88 89 90 91 91 92 93 95 96 96 97 98 99 100 101 102 103 104 Nagpur 76 78 81 85 89 92 95 98 99 99 99 99 100 101 100 99 98 98 98 100 102 104 108 110 Nashik 84 84 85 86 88 91 93 96 98 99 101 101 101 102 103 101 100 99 99 100 100 101 102 103 Navi Mumbai 79 79 79 81 84 90 96 101 103 104 102 101 101 101 102 102 100 100 99 100 101 101 103 106 New Town Kolkata 90 92 94 95 97 104 109 111 111 110 110 111 109 101 97 94 94 96 98 100 99 98 98 98 Noida 93 95 97 98 100 100 99 98 99 100 100 100 100 98 98 97 97 97 98 100 102 103 101 99 Panvel 75 76 77 77 77 78 78 79 80 81 84 88 90 91 92 92 94 96 99 100 101 101 101 101 Patna 125 125 125 125 124 125 122 122 119 115 109 106 105 105 104 103 101 100 98 99 99 100 104 109 Pimpri Chinchwad 80 83 84 85 87 88 90 92 93 94 95 96 96 97 98 98 98 98 99 100 100 100 100 99 Pune 77 80 82 84 86 87 89 92 95 97 98 98 98 99 99 99 99 99 100 100 101 101 102 102 Raipur 80 79 80 81 82 83 84 85 87 89 90 92 94 95 97 99 99 99 100 100 102 103 103 98 Rajkot 92 94 96 99 102 104 106 107 108 108 107 106 105 104 103 102 101 101 100 100 101 101 103 102
Ranchi 94 95 95 94 95 95 97 99 98 96 93 93 93 94 95 95 96 97 99 100 101 102 102 99 Surat 78 79 78 79 80 81 83 86 89 90 92 92 93 94 95 96 98 99 100 100 100 100 101 102 Thane 79 81 83 84 85 87 88 88 89 90 91 93 94 94 94 94 95 96 98 100 101 102 102 103 Thiruvananthapuram 73 75 78 80 82 84 87 89 91 92 94 98 100 102 105 106 106 104 102 99 98 97 96 96
Vadodara 94 94 94 95 95 98 99 101 102 102 102 102 103 103 104 104 103 102 102 100 99 98 99 103 Vasai Virar 92 94 95 95 96 96 97 99 100 100 100 101 101 101 101 101 100 100 100 100 101 101 102 103 Vijayawada 68 69 69 71 72 75 80 85 90 93 95 96 96 97 98 98 98 98 99 100 102 103 104 100 Vizag 80 84 86 88 90 91 93 93 92 91 91 92 94 96 97 99 99 99 100 100 100 102 103 106
APPENDIX 2
Core 5-A, India Habitat Centre, Lodhi Road, New Delhi-110003,
(PBX) 011-2464 9031-35, Fax: 011-2464 9030,
E-mail: [email protected] | Website: www.nhb.org.in
GST