ni 43-101 blue river tantalum-niobium project …...commerce resources corp. ni 43-101 blue river...
TRANSCRIPT
NI 43-101 Blue River Tantalum-Niobium ProjectBritish Columbia, CanadaProject Update Report
Prepared for:Commerce Resources Corp.
Prepared by:Greg Kulla, P.Geo., Amec Foster Wheeler Americas LimitedJenna Hardy, P.Geo., Nimbus Management Ltd.
Effective Date: 18 March 2015
Amended
Project No.: 179115

Amec Foster Wheeler Americas Limited111 Dunsmuir Street, Suite 400Vancouver, B.C. V6B 5W3Tel (604) 664-4315 www.amecfw.com
CERTIFICATE OF QUALIFIED PERSON
Greg Kulla P.Geo.Principal Geologist, Amec Foster Wheeler Americas Limited
111 Dunsmuir Street, Suite 400Vancouver, BC, Canada V6B 5W3
Tel: (604) [email protected]
I, Gregory Kenneth Kulla, P.Geo., am employed as a Principal Geologist with Amec Foster WheelerAmericas Limited.
This certificate applies to the technical report entitled “NI 43-101 Blue River Tantalum-NiobiumProject, British Columbia, Canada, Project Update Report” that has an effective date of 18 March2015 (the “Technical Report”).
I am a member of the Association of Professional Engineers and Geoscientists of British Columbia.I graduated from the University of British Columbia with a Bachelor of Science in Geology degree in1988.
I have practiced my profession continuously since 1988 and have been involved in precious andbase metal disseminated sulphide deposit assessments in Canada, United States, Australia, Mexico,Chile, Peru, and India.
As a result of my experience and qualifications, I am a Qualified Person as defined in NationalInstrument 43–101 Standards of Disclosure for Mineral Projects (NI 43–101).
I have not visited the Blue River property.
I am responsible for the preparation of all sections of the Technical Report.
I am independent of Commerce Resources Corp. as independence is described in section 1.5 of NI43–101.
I have been involved in the Blue River project as senior advisor and Amec Foster Wheeler projectmanager for the Blue River project since 2010 and was Qualified Person for geology-relatedsections in the previous Technical Report.
I have read NI 43–101 and this Technical Report has been prepared in compliance with thatInstrument.
As of the date of this certificate, to the best of my knowledge, information and belief, the TechnicalReport contains all scientific and technical information that is required to be disclosed to make theTechnical Report not misleading.
“Signed and stamped”
Greg Kulla, P.Geo.
Dated: 19 March 2015

NIMBUS MANAGEMENT LTD535 East Tenth Street
North Vancouver, BC V7L 2E7604-986-8578
CERTIFICATE of QUALIFIED PERSON
I, Jenna Hardy, P.Geo., do certify that:
I am a Principal of Nimbus Management Ltd, 535 East Tenth St. North Vancouver, B.C, Canada,V7L 2E7.
This certificate applies to the technical report titled “NI 43-101 Blue River Tantalum-NiobiumProject, British Columbia, Canada, Project Update Report” with an effective date of the 18th ofMarch 2015 (the “Technical Report”).
I graduated with the degrees of BSc. (Geology) and M.Sc. (Economic Geology) from theUniversity of Toronto in Toronto, Ontario in 1974 and 1978, respectively, and received an M.B.A.from Simon Fraser University in Burnaby, British Columbia in 1988. I have practiced myprofession continuously since 1978.
I have over twenty years of experience in geological and environmental aspects of mineralexploration, project development and mining operations, encompassing technical, managementand corporate roles. I have experience in a variety of commodities at locations in North America,Mexico and South America.
I am registered with the Association of Professional Engineers and Geoscientists of BritishColumbia as a Professional Geoscientist.
As a result of my qualifications and experience, I am a Qualified Person as defined in NationalInstrument 43-101.
I last visited the Blue River Project on: May 23rd 2012, 9th-10th of July 2012 and the 17-18th ofJuly 2012.
I am responsible for the preparation of sections 1 to 12 and sections 15 to 19 of the TechnicalReport.
I am not independent of Commerce Resources Corp as described in Section 1.5 of NationalInstrument 43-101.
I have been involved with the Blue River Project since 2006, becoming Project Manager in 2007.
I have read NI 43–101 and the sections of this Technical Report that I am responsible for havebeen prepared in compliance with that Instrument.
As of the effective date of the Technical Report, to the best of my knowledge, information andbelief, the sections of the Technical Report, that I am responsible for, contain all scientific andtechnical information that is required to be disclosed to make the Technical Report notmisleading.
Dated this 19th day of March 2015.
“Signed and stamped”
Jenna Hardy. P.Geo.

IMPORTANT NOTICE
This report was prepared as a National Instrument 43-101 TechnicalReport for Commerce Resources Corp. (Commerce) by Amec FosterWheeler Americas Limited (Amec Foster Wheeler). The quality ofinformation, conclusions, and estimates contained herein is consistentwith the level of effort involved in Amec Foster Wheeler services, basedon: i) information available at the time of preparation, ii) data supplied byoutside sources, and iii) the assumptions, conditions, and qualificationsset forth in this report. This report is intended for use by Commercesubject to the terms and conditions of its contract with Amec FosterWheeler. Except for the purposes legislated under Canadian provincialsecurities law, any other uses of this report by any third party is at thatparty’s sole risk.

Commerce Resources Corp.NI 43-101 Blue River Tantalum–Niobium Project
British Columbia, CanadaProject Update Report
Project No.: 179115 TOC i18 March 2015
C O N T E N T S
TITLE PAGECERTIFICATES OF QUALIFIED PERSONS (signature page)
1.0 SUMMARY ................................................................................................................................... 1-11.1 Mineral Resources........................................................................................................... 1-11.2 Project Tenure ................................................................................................................. 1-11.3 Project Geology ............................................................................................................... 1-21.4 Project Exploration .......................................................................................................... 1-31.5 Project Drilling ................................................................................................................. 1-31.6 Metallurgical Testwork..................................................................................................... 1-41.7 Mineral Resource Estimation........................................................................................... 1-41.8 Interpretation and Conclusions........................................................................................ 1-51.9 Recommendations........................................................................................................... 1-6
2.0 INTRODUCTION .......................................................................................................................... 2-12.1 Terms of Reference......................................................................................................... 2-12.2 Qualified Persons ............................................................................................................ 2-12.3 Site Visit........................................................................................................................... 2-12.4 Effective Dates ................................................................................................................ 2-22.5 Information Sources and References.............................................................................. 2-22.6 Previous Technical Reports............................................................................................. 2-2
3.0 RELIANCE ON OTHER EXPERTS.............................................................................................. 3-13.1 Mineral Tenure ................................................................................................................ 3-13.2 Royalties and Agreements .............................................................................................. 3-13.3 Environmental, Permitting, and Liability Issues............................................................... 3-13.4 QP Comment................................................................................................................... 3-2
4.0 PROPERTY DESCRIPTION AND LOCATION ............................................................................ 4-14.1 Project Ownership ........................................................................................................... 4-14.2 Mineral Tenure ................................................................................................................ 4-14.3 Surface Rights ................................................................................................................. 4-44.4 Royalties and Agreements .............................................................................................. 4-44.5 Permits............................................................................................................................. 4-44.6 Other Factors and Risks.................................................................................................. 4-54.7 QP Comment................................................................................................................... 4-5
5.0 ACCESSIBILITY, CLIMATE, LOCAL RESOURCES, INFRASTRUCTURE, ANDPHYSIOGRAPHY......................................................................................................................... 5-15.1 Accessibility ..................................................................................................................... 5-15.2 Climate............................................................................................................................. 5-15.3 Local Resources and Infrastructure ................................................................................ 5-15.4 Physiography................................................................................................................... 5-25.5 QP Comment................................................................................................................... 5-2
6.0 History........................................................................................................................................... 6-16.1 Pre-Commerce ................................................................................................................ 6-16.2 Commerce History........................................................................................................... 6-1
7.0 GEOLOGICAL SETTING AND MINERALIZATION ..................................................................... 7-1

Commerce Resources Corp.NI 43-101 Blue River Tantalum–Niobium Project
British Columbia, CanadaProject Update Report
Project No.: 179115 TOC ii18 March 2015
7.1 Regional Geology ............................................................................................................ 7-17.2 Local Geology.................................................................................................................. 7-3
7.2.1 Lithology ......................................................................................................... 7-37.2.2 Structural Geology and Metamorphism.......................................................... 7-77.2.3 Geochronology ............................................................................................... 7-8
7.3 Deposit Geology .............................................................................................................. 7-87.3.1 Upper Fir and Bone Creek Carbonatites ........................................................ 7-87.3.2 Fir Carbonatite .............................................................................................. 7-217.3.3 Verity Carbonatite ......................................................................................... 7-22
7.4 QP Comment................................................................................................................. 7-22
8.0 DEPOSIT TYPES ......................................................................................................................... 8-1
9.0 EXPLORATION ............................................................................................................................ 9-19.1 Grids and Surveys ........................................................................................................... 9-19.2 Geological Mapping......................................................................................................... 9-19.3 Geochemical Sampling.................................................................................................... 9-1
9.3.1 Stream Sediment Sampling............................................................................ 9-19.3.2 Soil Sampling.................................................................................................. 9-29.3.3 Geochemical Targets ..................................................................................... 9-29.3.4 Rock Chip, Grab, and Channel Sampling ...................................................... 9-5
9.4 Bulk Sampling.................................................................................................................. 9-69.5 QP Comment................................................................................................................... 9-7
10.0 DRILLING ................................................................................................................................... 10-110.1 Drill Plan ........................................................................................................................ 10-110.2 Collar Surveys ............................................................................................................... 10-410.3 Down-Hole Surveys....................................................................................................... 10-410.4 Core Recovery............................................................................................................... 10-510.5 Geotechnical Drilling...................................................................................................... 10-510.6 Core Logging ................................................................................................................. 10-510.7 Core Sampling Methods ................................................................................................ 10-510.8 Drill Intercepts................................................................................................................ 10-610.9 Density Determination Methods .................................................................................... 10-710.10 Metallurgical Sampling Methods ................................................................................... 10-910.11 QP Comment................................................................................................................. 10-9
11.0 SAMPLE PREPARATION, ANALYSES, AND SECURITY ........................................................ 11-111.1 Sample Preparation....................................................................................................... 11-111.2 Sample Analyses........................................................................................................... 11-2
11.2.1 Quality Control .............................................................................................. 11-211.3 Sample Security ............................................................................................................ 11-911.4 QP Comments ............................................................................................................. 11-10
12.0 DATA VERIFICATION................................................................................................................ 12-112.1 Site Visits ....................................................................................................................... 12-112.2 Databases...................................................................................................................... 12-1
12.2.1 Database Transcription Error Checks .......................................................... 12-112.2.2 Drill Collar Location Check ........................................................................... 12-212.2.3 Down-hole Survey Check ............................................................................. 12-212.2.4 Logging Checks............................................................................................ 12-212.2.5 Mineralization Grade Checks ....................................................................... 12-2

Commerce Resources Corp.NI 43-101 Blue River Tantalum–Niobium Project
British Columbia, CanadaProject Update Report
Project No.: 179115 TOC iii18 March 2015
12.2.6 Assay Quality Control Checks ...................................................................... 12-212.3 QP Comment................................................................................................................. 12-2
13.0 MINERAL PROCESSING AND METALLURGICAL TESTING .................................................. 13-113.1 Head Samples for Initial Testing ................................................................................... 13-213.2 Phase I Testing.............................................................................................................. 13-3
13.2.1 Grinding Size ................................................................................................ 13-313.2.2 Roughing and Cleaning Gravity Concentration ............................................ 13-3
13.3 Phase II Testing............................................................................................................. 13-613.3.1 Flotation Tests .............................................................................................. 13-6
13.4 Phase III Testing............................................................................................................ 13-813.4.1 2011 and 2012 Work .................................................................................... 13-813.4.2 Review of Concentrate Treatment Options .................................................. 13-9
13.5 Variability Testing .......................................................................................................... 13-913.5.1 Selection of Samples.................................................................................... 13-913.5.2 Test Results.................................................................................................. 13-9
13.6 QP Comment............................................................................................................... 13-11
14.0 MINERAL RESOURCE ESTIMATES......................................................................................... 14-114.1 Carbonatite Wireframe Model........................................................................................ 14-114.2 Assay Data and Capping............................................................................................... 14-114.3 Composites.................................................................................................................... 14-114.4 Exploratory Data Analysis ............................................................................................. 14-214.5 Contact Analysis ............................................................................................................ 14-414.6 Variography ................................................................................................................... 14-714.7 Block Model Dimensions ............................................................................................... 14-714.8 Assignment of Lithology and Specific Gravity to Blocks ............................................... 14-814.9 Block Model Grade Estimate......................................................................................... 14-814.10 Block Model Validation .................................................................................................. 14-9
14.10.1 Visual Validation ........................................................................................... 14-914.10.2 Global Grade Bias Check ........................................................................... 14-1414.10.3 Local Grade Bias Check............................................................................. 14-1414.10.4 Selectivity Check ........................................................................................ 14-16
14.11 Mineral Resource Classification .................................................................................. 14-1814.12 Reasonable Prospects for Eventual Economic Extraction .......................................... 14-22
14.12.1 Commodity Price ........................................................................................ 14-2214.12.2 Mining Considerations ................................................................................ 14-2214.12.3 Block Unit Value ......................................................................................... 14-2314.12.4 Economic Cut-Off Assumptions.................................................................. 14-23
14.13 Mineral Resource Statement ....................................................................................... 14-2414.14 QP Comment............................................................................................................... 14-25
15.0 ADJACENT PROPERTIES ........................................................................................................ 15-1
16.0 OTHER RELEVANT DATA AND INFORMATION ..................................................................... 16-1
17.0 INTERPRETATION AND CONCLUSIONS ................................................................................ 17-1
18.0 RECOMMENDATIONS .............................................................................................................. 18-1
19.0 REFERENCES ........................................................................................................................... 19-1

Commerce Resources Corp.NI 43-101 Blue River Tantalum–Niobium Project
British Columbia, CanadaProject Update Report
Project No.: 179115 TOC iv18 March 2015
T A B L E S
Table 1-1: Summary of Proposed Work to Support a Prefeasibility Study ......................................... 1-6Table 6-1: Blue River Exploration History Summary........................................................................... 6-1Table 7-1: Upper Fir Deformation History ........................................................................................... 7-7Table 7-2: Carbonatite Types and Their Percent Occurrence within the Deposit............................. 7-19Table 7-3: Textural Classifications and Proportions of Drilled Magnesio-carbonatite Intersections. 7-19Table 9-1: Soil Sample Campaigns..................................................................................................... 9-2Table 9-2: Rock Sample Campaigns................................................................................................... 9-5Table 9-3: Upper Fir Deposit Trench and Bulk Samples..................................................................... 9-6Table 10-1: Drill Campaign Summary ................................................................................................. 10-2Table 10-2: Down-Hole Survey Methods by Year............................................................................... 10-4Table 10-3: Drill Hole Composite Summary Table.............................................................................. 10-6Table 10-4: Drill Hole Sample Summary Table................................................................................... 10-6Table 10-5: 2005 – 2011 Specific Gravity Measurements by Campaign............................................ 10-8Table 10-6: 2005 – 2011 Specific Gravity Statistics............................................................................ 10-8Table 11-1: 2005-2010 Duplicate Precision Summary........................................................................ 11-4Table 11-2: 2011 Blue River SRM Ta Control Chart Summary .......................................................... 11-6Table 11-3: 2011 Blue River SRM Nb Control Chart Summary.......................................................... 11-7Table 11-4: Summary of 2011 Bias Assessed Through RMA Charts................................................. 11-8Table 11-5: 2005 to 2011 Between-Laboratory Bias........................................................................... 11-9Table 13-1: Head Assay Grades, Bulk Samples BS-2F and BS-2G................................................... 13-3Table 13-2: Results from F81.............................................................................................................. 13-7Table 13-3: Results of a Sequential Hydrochloric Acid Leach of Flotation “Middling” ........................ 13-8Table 14-1: Capped Assays vs. 2.5 m Composites Statistics inside Carbonatite (assay values in
ppm) ................................................................................................................................. 14-2Table 14-2: Composite Statistics in Carbonatite (assay values in ppm)............................................. 14-2Table 14-3: Ta2O5 and Nb2O5 Correlogram Parameters in Carbonatite ............................................. 14-7Table 14-4: Block Model Dimensions.................................................................................................. 14-7Table 14-5: Estimation Parameters for Ta2O5 and Nb2O5................................................................... 14-9Table 14-6: Mean Grades for NN and ID3 Models............................................................................ 14-14Table 14-7: 2013 Economic Cut-Off Assumptions ............................................................................ 14-23Table 14-8: Blue River Project Estimated Mineral Resource; Effective Date 28 February 2015,
Greg Kulla P.Geo ........................................................................................................... 14-24Table 14-9: Blue River Project Sensitivity of Estimated Mineral Resources to Ta Price; Effective
Date 28 February 2015, Greg Kulla P.Geo.................................................................... 14-25Table 18-1: Proposed Drill-hole Summary .......................................................................................... 18-1Table 18-2: Proposed Mining Studies Budget..................................................................................... 18-2Table 18-3: Summary of Proposed Work to Support a Prefeasibility Study ....................................... 18-4
F I G U R E S
Figure 4-1: Project Location Map ......................................................................................................... 4-2Figure 4-2: Blue River Mineral Tenure Map ......................................................................................... 4-3Figure 7-1: Tectonic Belts of British Columbia and Carbonatite Occurrences ..................................... 7-2

Commerce Resources Corp.NI 43-101 Blue River Tantalum–Niobium Project
British Columbia, CanadaProject Update Report
Project No.: 179115 TOC v18 March 2015
Figure 7-2: Blue River Project Local Geology Map .............................................................................. 7-4Figure 7-3: Blue River Local Geology Legend (for Figure 7-2) ............................................................ 7-5Figure 7-4: Deposit Area Surface Geology Map .................................................................................. 7-9Figure 7-5: Longitudinal Section A – A’ (view SE).............................................................................. 7-10Figure 7-6: Geology Section B-B’ ....................................................................................................... 7-11Figure 7-7: Geology Section C-C’....................................................................................................... 7-12Figure 7-8: Recumbent Isoclinal Fold on Upper Drill Road................................................................ 7-14Figure 7-9: Fold Indicators (Hole F08-150: 121.8 m to 129.8 m) ....................................................... 7-14Figure 7-10: Fold Indicators (Hole F08-150: 143.5 m and 147.0 m) .................................................... 7-15Figure 7-11: Fold Indicators (Hole F08-151: 204.0 m to 204.5 m) ....................................................... 7-16Figure 7-12: Minor Drag Fault on Upper Drill Road.............................................................................. 7-17Figure 7-13: Gouge Zone on Upper Drill Road .................................................................................... 7-18Figure 9-1: Exploration Target Location Surface Map.......................................................................... 9-4Figure 10-1: Drill Collar Plan ................................................................................................................ 10-3Figure 11-1: Valemount Core Storage Facility ................................................................................... 11-10Figure 13-1: Sample BS-2F – Gravity Separation (Different Grinds) ................................................... 13-4Figure 13-2: Sample BS-2G – Gravity Separation (Different Grinds) .................................................. 13-5Figure 13-3: Overall Rougher and Cleaner Recovery vs. Grade by Centrifugal Gravity Concentration 13-
5Figure 13-4: Upgrading by Wilfley and Mozley Units ........................................................................... 13-6Figure 14-1: Ta2O5 Histograms and Probability Plot within Carbonatite .............................................. 14-3Figure 14-2: Nb2O5 Histograms and Probability Plot within Carbonatite.............................................. 14-4Figure 14-3: Ta2O5 Contact Plots between Carbonatite and Fenite..................................................... 14-5Figure 14-4: Nb2O5 Contact Plots between Carbonatite and Fenite .................................................... 14-6Figure 14-5: Ta2O5 ID3 Model within Carbonatite – Plan 1,146.25.................................................... 14-10Figure 14-6: Ta2O5 ID3 Model within Carbonatite – Section N 5,796,932.5 ...................................... 14-11Figure 14-7: Nb2O5 ID3 Model within Carbonatite – Plan 1,146.25 ................................................... 14-12Figure 14-8: Nb2O5 ID3 Model within Carbonatite – Section N 5,796,932.5 ...................................... 14-13Figure 14-9: Swath Plot for Ta2O5 ID3 Model ..................................................................................... 14-15Figure 14-10: Swath Plot for Nb2O5 ID3 Model..................................................................................... 14-16Figure 14-11: Herco Grade – Tonnage Curves for Ta2O5 ID3 Model................................................... 14-17Figure 14-12: Herco Grade – Tonnage Curves for Nb2O5 ID3 Model .................................................. 14-18Figure 14-13: Resource Classification – Plan 1,161.25 ....................................................................... 14-20Figure 14-14: Resource Classification – Section N 5,796,882.5.......................................................... 14-21
A P P E N D I C E S
A p p e n d i x A : List of Claims

Commerce Resources Corp.NI 43-101 Blue River Tantalum–Niobium Project
British Columbia, CanadaProject Update Report
Project No.: 179115 Page 1-118 March 2015
1.0 SUMMARY
1.1 Mineral Resources
This amended technical report was filed with a revised title, effective date of the technicalreport, section numberings, and Certificates of Qualified Persons. No other content ofthe Report has changed.
The Mineral Resources stated in this report are unchanged from those reported in June2013. The Mineral Resources are summarized as follows:
Indicated Category: 48.4 million tonnes @ 197 ppm Ta2O5 and 1,610 ppm Nb2O5
Inferred Category: 5.4 million tonnes @ 191 ppm Ta2O5 and 1,760 ppm Nb2O5
Since there has been no material change to the information used in the mineral resourceestimates since the last update, they are considered current and therefore they have aneffective date of 28 February 2015. They are constrained within an underground miningshape prepared using the following economic assumptions:
Mining cost – bulk mining method .................................$US27/tonne Mining cost – selective mining method..........................$US48/tonne Processing and refining cost .........................................$US15/tonne General and Administration.............................................$US3/tonne Base case scenario price of $US381/kg tantalum (Ta) metal in an oxide Base case scenario price of $US46/kg niobium (Nb) metal in an oxide Block Unit Value cut-off values of US$45/t for the bulk mining method and US$66/t
for the selective mining method were used.
1.2 Project Tenure
Commerce resources Corp. (Commerce) holds a 100% interest in the Blue Riverproperty mineral rights underlying approximately 1000 km2 of contiguous mineral claimssituated 250 km north of the city of Kamloops, British Columbia. The property isaccessed via a 4 km gravel road from BC Highway 5. Legal access to the property isprovided through provisions in the British Columbia Mineral Tenure Act. Within theproperty area, access is by forestry service and logging roads or by helicopter. A BCHydro 136,000 volt power transmission line and a Canadian National railway aresituated on the western margin of the property. A Transalta Corp 20 megawatt run-of-river hydroelectricity project is located on Bone Creek which runs through the property.

Commerce Resources Corp.NI 43-101 Blue River Tantalum–Niobium Project
British Columbia, CanadaProject Update Report
Project No.: 179115 Page 1-218 March 2015
Commerce has completed all exploration work under a government multi-year MineralExploration Activities and Reclamation Permit. For any future exploration an applicationto amend the permit will be submitted.
Commerce has initiated an assessment of nearby communities, as well as relevantregional government and planning organizations. First Nations engagement withrespect to exploration activities began in May 2007 and will be continuing for the durationof the project. Public engagement to date has included meetings with local councils andinformal discussions with local land-owners and in the town of Blue River.
Commerce initiated baseline environmental studies for the Blue River Project in 2006.Field studies were conducted in 2006 and 2007 and continued in 2008. Water qualityand water flow from monitoring by Summit Environmental Consultants Inc. began in2008 and continued to the end of 2012. In 2011 a vegetation and soils survey wasinitiated to assess metals uptake over the deposit and kinetic test work on selectsamples based on the prior static test results was initiated to assess Acid RockDrainage/Metal Leaching.
1.3 Project Geology
The property is located within the north-eastern margin of the Shuswap MetamorphicComplex in the Omineca Belt. The area comprises polyfolded, metamorphosed LateProterozoic supracrustal rocks of the Horsethief Creek Group and the overlying KazaGroup. The belt is continuous from the northern Selkirk Mountains in the southeast,through the Monashee Mountains, and into the Caribou Mountains in the northwest.
Eighteen dike- or sill-like carbonatite occurrences are hosted in the Mica Creekassemblage of the Horsethief Creek Group within the property. The carbonatites wereemplaced during the Devonian–Mississippian and were affected by regional deformationand metamorphism that occurred c.a. 170 Ma. Regional deformation has resulted incomplex folded carbonatite and host rocks.
The Upper Fir carbonatite is the largest carbonatite identified to date and has averagethicknesses of 30 m, ranging between 5 m to about 90 m thick, and with strike lengthsranging between 50 m to 1,100 m. Both dolomite carbonatite and calcite carbonatiteoccur within the Upper Fir carbonatite.
Mineralization comprises disseminated Ta- and Nb-bearing ferrocolumbite((Fe,Mn,Mg)(Nb,Ta)2O6,) and pyrochlore ((Ca,Na,U)2(Nb,Ti,Ta)2O6(OH,F)).

Commerce Resources Corp.NI 43-101 Blue River Tantalum–Niobium Project
British Columbia, CanadaProject Update Report
Project No.: 179115 Page 1-318 March 2015
1.4 Project Exploration
Commerce acquired the property in 2000 and discovered the Upper Fir carbonatite in2002. Since the property acquisition Commerce has completed surface mapping,trenching, soil, rock chip, grab and channel sampling, core drilling, metallurgical testing,bulk sampling, environmental baseline studies, and conceptual mining studies.
1.5 Project Drilling
The current database comprises a total of 303 diamond drill holes consisting of 62,780 mof HQ and NQ-diameter drilling. Core recovery is very good within the host andcarbonatite rocks. Oriented-core geotechnical drilling was completed on six holescomprising 1,271 m. Down-hole geophysical surveys using optical and acousticteleviewers were completed on 24 drill holes.
Core sampling methods are consistent with industry standards. Drill-hole samples forassaying are collected on approximately 1 m interval lengths and cover an areaapproximately 1,600 m north–south by 1,000 m east-west. The entire carbonatiteintersection and shoulder samples on each side of the intersection are sampled;geological contacts are generally respected during sampling. Average spacing betweenadjacent drill-holes is 40 m to 50 m; spacing between holes increases with depth.Specific gravity (SG) of core, generally taken at three-metre intervals, is measured usinga water immersion method. Independent wax-coated check sample SG measurementscorrelate well with field measurements.
PRA/Inspectorate of Richmond, B.C., has been the primary laboratory for samplepreparation since 2009. Acme has been the primary laboratory for analysis since 2005.For core collected between 2005 and 2008, Ta and Nb were analysed by inductivelycoupled plasma mass spectrometry (ICP-MS) following a lithium metaborate /tetraborate fusion and nitric acid digestion. For core collected between 2009 and 2011Ta and Nb were analysed by ICP-MS and X-Ray fluorescence methods following alithium metaborate fusion XRF(F). The sample quality control program has improvedsince the start of exploration by Commerce. Quality control sample insertion rates aresufficient to assess reliability of the assay results. The ICP-MS sample analysis resultsused for the 2005 to 2008 drill core analysis provide adequate confidence to supportmineral resource estimation but should only be used to support Indicated classificationconfidence. Problems with the ICP-MS procedures are apparent which suggest poorprecision, and periodic significant underestimation of Ta and Nb grades occurs.

Commerce Resources Corp.NI 43-101 Blue River Tantalum–Niobium Project
British Columbia, CanadaProject Update Report
Project No.: 179115 Page 1-418 March 2015
Based on independent verification through site visit inspections, procedure reviews anddata transcription error checks, the collar coordinates, down-hole surveys, lithologies,and assay data are considered sufficiently free of errors.
1.6 Metallurgical Testwork
The metallurgical testwork has shown that ferrocolumbite and pyrochlore are amenableto a two-stage process of conventional flotation and proven refining processes withestimated recoveries of 65% to 70%. The first step of the process uses grinding followedby flotation to produce a concentrate. The secondary treatment for metal extraction ofthe material is possible by an existing industry established method such asaluminothermic reduction followed by chlorine refining.
Variability work has confirmed the amenability of the material to the various componentsof the flowsheet. Although not optimized in the cleaning stages, the work indicates arange of 67.8% to 75% and 63.8% to 71.4% for the Ta and Nb recovery respectively toa final concentrate prior to the aluminothermic step. This open circuit variability workconfirms the potential to achieve the recoveries used in the mine modelling.
1.7 Mineral Resource Estimation
The mineral resource was estimated inside a 3D wireframe carbonatite shape using15,512 samples from 271 diamond drill holes totalling 59,110 m of HQ diameter core.The grade estimate is based on XRF(F) Ta and Nb results from 2009 to 2011 drillingand ICP-MS Ta and Nb results from drilling completed before 2009.
Capped drill core assays were composited down the hole to a fixed length of 2.5 mrespecting lithological boundaries. The capped composite coefficients of variation arelow and support the use of linear grade interpolation methods such as inverse distancemethods. Ta2O5 and Nb2O5 grades were estimated in the carbonatite using an inversedistance to the power of 3 (ID3) interpolation method. A four-pass grade interpolationapproach was used with each successive pass having greater search distances.Specific gravity values were assigned by lithological unit.
The block model grades were validated by visual inspection comparing composites toblock grades on-screen, declustered global statistics checks, local biases checks usingswath plots, and model selectivity checks. No issues were identified that wouldmaterially affect the Mineral Resource estimate.
The current mineral resource classification at Blue River is restricted to Indicated orInferred based on the following:
Commerce Resources Corp.NI 43-101 Blue River Tantalum–Niobium Project
British Columbia, CanadaProject Update Report
Project No.: 179115 Page 1-518 March 2015
Drill hole spacing is currently insufficient to support Measured Mineral Resources:the structural complexity of the carbonatite limits confidence in the estimatedtonnes
Metallurgical testwork to support proof-of-concept of the refining process has notbeen completed
ICP-MS precision and accuracy is insufficient to support Measured MineralResources; blocks estimated primarily with ICP-MS results are limited to Indicatedconfidence
To assess reasonable prospects for eventual economic extraction, the updated MineralResources have been constrained using a “Stope Analyzer” and assuming that the BlueRiver deposit would be mined utilizing self-supported, underground bulk mining methodsprocessing at a rate of 7,500 tonnes per day.
1.8 Interpretation and Conclusions
The Mineral Resource is based on information of reasonable quantity and quality. Thecollar location, down-hole survey, lithological, geotechnical, and drill core sample datawere collected using appropriate methods. The database is reasonably free oftranscription errors.
Ta and Nb occur within the minerals pyrochlore and ferrocolumbite and are amenableto conventional flotation and proven refining processes with estimated recoveries of 65%to 70%. The industrial processes proposed for the production of high-quality Ta and Nbproducts from the concentrates have not been tested using material from the Blue Riverproject but are known processes that are not expected to be difficult to develop for theproject.
The supply and demand of Ta is changing in response to market conditions includingreduced production, increased concerns about conflict-Ta production in Africa, depletionof known strategic stockpiles, and curtailed exports from China. Ta prices haveincreased and decreased coincident with this volatility. The market for Ta remainsvolatile; the current Ta metal price has increased since 2011 in response to the volatility.The economic effects of the decrease in prices in Ta2O5 as tantalite concentrate, scrapmetal, and pure pentoxide since 2013 are considered to be offset by a weaker Canadiandollar with respect to the US dollar.
The supply and demand for Nb is relatively stable compared to the Ta market. Theassumed Nb price is considered unchanged since 2011.

Commerce Resources Corp.NI 43-101 Blue River Tantalum–Niobium Project
British Columbia, CanadaProject Update Report
Project No.: 179115 Page 1-618 March 2015
Actual prices for these commodities are typically negotiated through contracts.Commerce have not initiated contract negotiations or requests for expressions ofinterests from potential buyers of the proposed Ta and Nb products but this is notunusual considering the early stage of the Blue River Project.
The base case prices assume a premium for preparation of a high purity Ta-pentoxideat site.
There are risks to the project including:
The Mineral Resource estimate is supported by current Ta and Nb prices and longterm prices may vary with changes to market conditions in the future.
The proposed refining methods have been used in commercial applications buthave not been demonstrated in test work of Blue River material.
1.9 Recommendations
Should Commerce decide to advance the project to a preliminary feasibility level ofstudy, then Amec Foster Wheeler recommends a $13.9M work program that consists ofinfill, step-out and condemnation drilling, and metallurgical test work, as well as mine,co-disposal facility, environmental, and marketing studies. The proposed work,estimated to take two years to complete, is summarized in Table 1-1. Details of theproposed work are provided in Section 26 of this report.
Table 1-1: Summary of Proposed Work to Support a Prefeasibility Study
TaskEstimated
Budget Comment
Assay Quality Control $50,000 Prepare Standards for Accuracy monitoringLocal Anisotropic Krigingmineral resource estimate
$40,000 Improve local grade estimate
Drilling $5,460,000 125 Infill, step-out, hydrological, and condemnationholes totalling 27,300m
Mineral Resource Update $400,000 Geologic interpretation and grade estimationincorporate all new drill hole results
Mining studies $750,000 Geotechnical and hydrological models, miningmethod, access, and ventilation
Metallurgical testwork $ 1,550,000 Flotation, filtration, and hardness testwork,Preparation of concentrate. Aluminothermic andChlorination testwork
Co-Disposal studies $400,000 Geotechnical/hydrological, designWaste RockCharacterization
$350,000 Static and kinetic geochemical testing
Environmental $400,000 Extend base line studies to local infrastructure

Commerce Resources Corp.NI 43-101 Blue River Tantalum–Niobium Project
British Columbia, CanadaProject Update Report
Project No.: 179115 Page 1-718 March 2015
Marketing Studies $100,000 Examine marketing requirementsProject Management $2,400,000SubTotal 11,900,000Contingency $2,000,000
Total $13,900,000

Commerce Resources Corp.NI 43-101 Blue River Tantalum–Niobium Project
British Columbia, CanadaProject Update Report
Project No.: 179115 Page 2-118 March 2015
2.0 INTRODUCTION
2.1 Terms of Reference
Commerce commissioned Amec Foster Wheeler to prepare this updated TechnicalReport (Report) to support Commerce’s March 9, 2015 Annual Information Form filing.The previous Technical Report, with an effective date of 21 June 2013, included resultsof a Preliminary Economic Assessment (PEA) initially reported in 2011. The economicinputs for that mining study are now considered outdated and the PEA results are nolonger relevant. No additional work has been completed on the property since theeffective date of the previous Technical Report. Any changes to the economic inputs tothe Mineral Resource estimates are considered offsetting and therefore the estimatesare unchanged since the last Technical report.
Commodity prices are quoted in US dollars. All other costs are in Canadian dollarsunless otherwise indicated. Volumes, weights, and distances are metric unlessotherwise indicated.
This amended technical report was filed with a revised title, effective date of the technicalreport, section numberings, and Certificates of Qualified Persons. No other content ofthe Report has changed.
2.2 Qualified Persons
Mr. Greg Kulla, P.Geo., Principal Geologist, Amec Foster Wheeler is the QualifiedPerson responsible for the preparation of this Report. Mr. Kulla has been Amec FosterWheeler’s project manager for the Blue River Project since 2010. The data verificationand Mineral Resource estimation was completed by senior Amec Foster Wheelerpersonnel under the supervision of Mr. Kulla.
Ms. Jenna Hardy, P. Geo, Principal, Nimbus Management Ltd. has been CommerceResource Corp.’s Project Manager for the Blue River Project since 2007, supervisingfield exploration, diamond drilling and other technical and environmental studies on theproject.
2.3 Site Visit
Ms. Jenna Hardy visited the site numerous times to review the geology and mineralogy,inspecting outcrops, bulk sample pits and diamond drill core, as well as reviewing drillhole collar locations, procedures for diamond drilling, down hole geophysics, corelogging, sampling, documentation, sample storage and shipment of analytical samples.

Commerce Resources Corp.NI 43-101 Blue River Tantalum–Niobium Project
British Columbia, CanadaProject Update Report
Project No.: 179115 Page 2-218 March 2015
She also completed aerial inspections of the property. Her most recent site visits were:May 23rd 2012, 9th-10th of July 2012 and the 17-18th of July 2012
2.4 Effective Dates
The effective date of the Technical Report is 18 March 2015. There has been nomaterial change to the information used in the mineral resource estimates since the lastupdate, so they are considered current and therefore they have an effective date ofFebruary 28, 2015.
2.5 Information Sources and References
Information for the Report was provided by Commerce, their consultants, and from workcompleted by Amec Foster Wheeler.
2.6 Previous Technical Reports
Commerce has previously filed the following Technical Reports on the project:
Kulla, G., Postolski, T., Mendoza, R., Lipiec, T., and Omidvar, B. 2013: CommerceResources Corporation, Blue River Tantalum–Niobium Project, British Columbia,Canada, NI 43-101 Technical Report on Mineral Resource Update: prepared by AMECAmericas Limited for Commerce Resources Corporation, effective date 21 June 2013.
Chong, A., Postolski, T., Mendoza, R., Lipiec, T., and Omidvar, B. 2012: CommerceResources Corporation, Blue River Tantalum–Niobium Project, British Columbia,Canada, NI 43-101 Technical Report on Mineral Resource Update: prepared by AMECAmericas Limited for Commerce Resources Corporation, effective date 22 June 2012.
Chong, A., Postolski, T., Mendoza, R., Lipiec, T., and Omidvar, B. 2011: CommerceResources Corporation, Blue River Tantalum–Niobium Project, British Columbia,Canada, NI 43-101 Technical Report on Preliminary Economic Assessment: preparedby AMEC Americas Limited for Commerce Resources Corporation, effective date 29September 2011.
Chong, A., and Postolski, T., 2011: Commerce Resources Corporation, Blue River Ta-Nb Project, NI 43-101 Technical Report, Blue River, British Columbia: prepared byAMEC Americas Limited for Commerce Resources Corporation, effective date 31January 2011.
Stone, M., and Selway, J., 2010: Independent Technical Report, Blue River Property,Blue River, British Columbia, Canada: prepared by Caracle Creek InternationalConsulting Inc. for Commerce Resources Corporation, effective date 24 August 2009.

Commerce Resources Corp.NI 43-101 Blue River Tantalum–Niobium Project
British Columbia, CanadaProject Update Report
Project No.: 179115 Page 2-318 March 2015
Gorham, J., 2007: Technical Report on the Upper Fir Ta-Nb Bearing Carbonatite:technical report prepared for Commerce Resources Corporation, effective date 20 June2007.
Commerce Resources Corp.NI 43-101 Blue River Tantalum–Niobium Project
British Columbia, CanadaProject Update Report
Project No.: 179115 Page 3-118 March 2015
3.0 RELIANCE ON OTHER EXPERTS
Amec Foster Wheeler has relied upon and disclaims responsibility for informationprovide by Commerce or it’s consultants pertaining to mineral tenure, surface rights,royalties and agreements, environment, and permitting.
3.1 Mineral Tenure
Amec Foster Wheeler has fully relied upon, and disclaims responsibility for informationregarding mineral tenure provided by experts through the following document:
Letter from Clark Wilson LLP titled “Commerce Resources Corp. – Mineral ClaimTitle Opinion", dated 25 February 2015.
Amec Foster Wheeler has not reviewed the mineral tenure, nor independently verifiedthe legal status, ownership of the project area or underlying property agreements.
Information from this letter has been used in Section 4.1, and 4.2, of this Report.
3.2 Royalties and Agreements
Amec Foster Wheeler has fully relied upon, and disclaims responsibility for informationprovided by experts through the following document:
Letter from Clark Wilson LLP titled Commerce Resources Corp. – Mineral ClaimTitle Opinion, dated 25 February 2015.
Amec Foster Wheeler has not reviewed the royalties and agreements for the property,nor independently verified the royalties and agreements status of the property.
This information has been used in Section 4.4 of this Report.
3.3 Environmental, Permitting, and Liability Issues
Amec Foster Wheeler has fully relied upon, and disclaims responsibility for, informationprovided by experts through the following document:
Letter from Nimbus Management titled “Commerce Resources Corp. Upper FirDeposit Mineral Resource Update – Independent Professional Opinion onEnvironmental Permitting and Liability Issues”, dated 24 February 2015.

Commerce Resources Corp.NI 43-101 Blue River Tantalum–Niobium Project
British Columbia, CanadaProject Update Report
Project No.: 179115 Page 3-218 March 2015
Amec Foster Wheeler has not reviewed the permitting requirements, nor independentlyverified the permitting status of the project area.
This information has been used in Section 4.5 of this Report.
3.4 QP Comment
Amec Foster Wheeler has reviewed these expert reports and considers them suitableto support the Mineral Resources disclosed in this Report.
Commerce Resources Corp.NI 43-101 Blue River Tantalum–Niobium Project
British Columbia, CanadaProject Update Report
Project No.: 179115 Page 4-118 March 2015
4.0 PROPERTY DESCRIPTION AND LOCATION
The Blue River property is located within the North Thompson River valley ofeast-central British Columbia 25 km to 60 km north and northeast of the community ofBlue River, British Columbia (Figure 4-1). The property is centered at approximately 52°19' N latitude and 119° 10' W longitude within NTS 1:50,000 scale map sheet 083D03.
4.1 Project Ownership
The property mineral rights are wholly-owned by Commerce and held in the name ofCommerce Resources Corp.
4.2 Mineral Tenure
The property comprises 248 two-post claim, four-post claim, and mineral cell titlesubmission (MCX) claims in good standing that encompass just over 1,000 km2
(105,373 ha) within the Kamloops Mining Division. The claim boundaries are shown inFigure 4-2. A table listing claim details is included in Appendix A. All of the mineralclaims are valid until 31 March 2023.
Property boundaries are established in accordance with the Mineral Tenure Act of BritishColumbia. Commerce has staked the claims by a combination of ground and on-linestaking. Two-post and four-post claims were established through a legacy system ofground staking which involved physically establishing claim posts on the ground. MCXclaims are established using the Government of British Columbia’s Mineral Titles Online(MTO) staking system. MTO is an Internet-based mineral titles administration systemthat allows the mineral exploration industry to acquire and maintain mineral titles byselecting the area on a seamless digital GIS map of British Columbia. The electronicInternet map allows selection of single or multiple adjoining cells. Cells range in sizefrom approximately 21 ha (457 m x 463 m) in the south to approximately 16 ha at thenorth of the province. All boundaries are oriented north-south and east–west.

Commerce Resources Corp.NI 43-101 Blue River Tantalum–Niobium Project
British Columbia, CanadaProject Update Report
Project No.: 179115 Page 4-218 March 2015
Figure 4-1: Project Location Map
Figure courtesy Commerce Resources Corp.

Commerce Resources Corp.NI 43-101 Blue River Tantalum–Niobium Project
British Columbia, CanadaProject Update Report
Project No.: 179115 Page 4-318 March 2015
Figure 4-2: Blue River Mineral Tenure Map
Note: Figure provided by Commerce Resources Corp.
Commerce Resources Corp.NI 43-101 Blue River Tantalum–Niobium Project
British Columbia, CanadaProject Update Report
Project No.: 179115 Page 4-418 March 2015
4.3 Surface Rights
Commerce holds no surface rights on the property. Legal access to the property isprovided through a provision of the British Columbia Mineral Tenure Act. The Actprovides for a recorded claim holder to use, enter and occupy the surface of a claim orlease for the exploration and development or production of minerals or placer minerals,including the treatment of ore and concentrates, and all operations related to theexploration and development or production of minerals or placer minerals and thebusiness of mining. Access to surface rights held by third parties typically requirescompensation to be paid.
There are surveyed parcels with surface rights held by other parties which overlap theproperty mineral tenure claims. These parcels occur along the western edge of theproperty and most are tree farm licences. These surveyed parcels do not host mineralresources, and currently no carbonatites are known within the parcels.
4.4 Royalties and Agreements
There are no royalties, back-in rights, payments, or other agreements or encumbrancesto which the Blue River property is subject other than the annual claim maintenance feesdue to the government as set out by the British Columbia Mineral Tenure Act andRegulations.
4.5 Permits
Commerce held a multi-year Mineral and Coal Exploration Activities and ReclamationPermit, permit number MX-15-138, which was issued by the British Columbia Ministryof Energy and Mines and Petroleum Resources under the Mines Act in September 2001and most recently amended in June 2010. This permit granted permission forCommerce to continue to carry out exploration activities that will support the ongoingeconomic evaluation of the Upper Fir deposit. The permit was valid until December 31,2012.
For subsequent exploration an application to amend the permit will be prepared andsubmitted, if required. There are no foreseeable reasons that additional permitamendments would not be approved by the British Columbia Ministry of Energy & Minesfor continued exploration activities.
Associated with permit MX-15-138 (and in place until the permit is rescinded) is areclamation security bond in the amount of $75,000. This bond is currently posted asSafekeeping Agreements held by both BMO and the BC Ministry of Finance.

Commerce Resources Corp.NI 43-101 Blue River Tantalum–Niobium Project
British Columbia, CanadaProject Update Report
Project No.: 179115 Page 4-518 March 2015
Commerce’s current reclamation practice is to reclaim disturbed areas, that are nolonger required for continuing work, during mineral exploration on an ongoing basis asthey become available, thereby limiting their environmental liability.
There are currently no other known active permits related to the Blue River project.
4.6 Other Factors and Risks
Commerce initiated baseline environmental studies for the Blue River Project in 2006.Field studies were conducted in 2006 and 2007 and continued in 2008. By the end ofthe 2008 field investigations, the larger part of the necessary baseline studies whichcould be carried out without a more certain understanding of final project footprint hadbeen completed. Water quality and water flow from monitoring began in 2008 andcontinued to the end of 2012. In 2011 a vegetation and soils survey was initiated toassess metals uptake over the deposit and kinetic test work on select samples basedon the prior static test results was initiated to assess Acid Rock Drainage/MetalLeaching.
First Nations engagement with respect to exploration activities began in May 2007 andwill be continuing for the duration of the project. Public engagement to date has includedmeetings with local councils and informal discussions with local land-owners and thetown of Blue River.
The Blue River property is situated in an area of active resource use including logging,power transmission line and railway right of ways, and a run-of-river operation.
4.7 QP Comment
Amec Foster Wheeler is not aware of any material issues that would limit the reported100% ownership of the mineral tenure or prevent negotiation for access or surface rightsof the Blue River property. Any proposed mining activity is expected to be achievablefollowing appropriate negotiation and compensation payments with existing landowners.Amec Foster Wheeler is unaware of any known environmental liabilities on the BlueRiver project.

Commerce Resources Corp.NI 43-101 Blue River Tantalum–Niobium Project
British Columbia, CanadaProject Update Report
Project No.: 179115 Page 5-118 March 2015
5.0 ACCESSIBILITY, CLIMATE, LOCAL RESOURCES,INFRASTRUCTURE, AND PHYSIOGRAPHY
5.1 Accessibility
The Blue River property is located 23 km north of the community of Blue River, BritishColumbia, approximately 250 km north of the city Kamloops and approximately 90 kmsouth of the town of Valemount. The property is accessed from B.C. Highway 5 via a4 km well-groomed gravel road.
The property can be reached from the Bone and Gum Creek forestry service roads whichbranch east from Highway 5 approximately 23 km north of Blue River. The east side ofthe property can be reached by forest service roads along the west side of KinbasketLake and up Howard Creek. Logging roads on Serpentine, Bone, Hellroar and MudCreeks allow four-wheel drive and quad bike access to most of the property. Access toremaining portions of the property is by helicopter.
5.2 Climate
The local climate is typical of the interior of British Columbia. The area is part of a “wetbelt” that occupies part of eastern British Columbia. Heavy snow falls almost everywinter, in which temperatures stay close to the freezing point when maritime airdominates. Rain is frequent in other seasons. Summer days are typically warm oroccasionally hot, with thunderstorms often spawning over the nearby mountains.
In July, the average daily temperature is 16.4°C and the average rainfall accumulationis 97.5 mm for Blue River (Environment Canada Climate Normals 1971–2000 web site:http://climate.weatheroffice.gc.ca/climate_normals/index_e.html. In January, theaverage daily temperature is -9°C and the average snowfall accumulation is 109 cm.Local rainfall and snowfall accumulations on parts of the property may be much higherdue to elevation and orographic effects. Snowfall can exceed 10 m on the propertymaking winter drilling very expensive and difficult, but not impracticable. It is expectedthat any future mining activity could be conducted year-round.
5.3 Local Resources and Infrastructure
Exploration activities are currently supplied from Kamloops, Clearwater and Valemount.The city of Kamloops currently supports mining operations at the New Afton andHighland Valley mines, and mineral exploration for the surrounding area. Services formining operations are reasonably available at Prince George, Vancouver, or Edmonton.

Commerce Resources Corp.NI 43-101 Blue River Tantalum–Niobium Project
British Columbia, CanadaProject Update Report
Project No.: 179115 Page 5-218 March 2015
Power transmission lines, rail, paved, and gravel roads are all adjacent to the westernedge of the property. Highway 5 runs sub-parallel to the North Thompson River. Thecommunity of Blue River has a municipal airport for light aircraft and helicopter support.
The main line of the Canadian National Railway passes through the western part of theproperty. Sidings currently exist at Lempriere and Blue River, located 16.5 km north and23.7 km south of the Upper Fir deposit respectively. A flat area immediately north ofBone Creek may be suitable for a siding and is 4.9 km from the Upper Fir deposit.
The BC Hydro 136,000 volt supply line for the North Thompson valley passes throughthe west side of the property adjacent to the rail line. The 20 megawatt Bone Creek run-of-river hydroelectricity project owned by Transalta Corp was commissioned in June2011, and is adjacent to the Property.
5.4 Physiography
The property topography ranges from 700 m to 3,100 m elevation above sea level andis located largely along the steep, west-facing slopes of the Monashee Mountains, to theeast of the North Thompson River. The highest peak, Mt. Lempriere, is 3,183 m. Icefields and glaciers dominate the higher elevations on the property. Significant majortributaries feeding into the North Thompson River in the area include Serpentine,Pyramid, Gum, Bone, Hellroar and Mud Creeks.
Mountain slopes are typically covered by thick undergrowth consisting of grasses, buckbrush, devil’s club, and shrubs of willow, alder, rhododendron, huckleberry, currants,gooseberry, thimbleberry, and raspberry. White spruce is common in replanted loggingareas. Former trails and flat wet areas are typically overgrown by dense alder andwillow. Areas not subjected to recent logging are covered by dense stands of hemlock,cedar, fir and white pine. Within the property, the tree line is at approximately 2,000 melevation. Except for the Paradise Lake, Felix, Howard Creek and Gum Creek localities,all other carbonatites are below the tree line, and outcrop exposure is generally poor.
5.5 QP Comment
There is sufficient area within the Blue River property to support construction of a miningoperation, including space for underground mine access, process facilities, mining-related facilities such as workshops, offices and roads, and tailings and waste facilities.
There is sufficient availability of workforce, power, water, and communication to supportdevelopment and mining of the deposit.

Commerce Resources Corp.NI 43-101 Blue River Tantalum–Niobium Project
British Columbia, CanadaProject Update Report
Project No.: 179115 Page 6-118 March 2015
6.0 HISTORY
6.1 Pre-Commerce
The Blue River area has been the subject of intermittent exploration since the discoveryof vermiculite-bearing carbonatite rock in 1949. A summary of exploration activities onthe Project is described below and summarized in Table 6-1.
Table 6-1: Blue River Exploration History SummaryYear Company Exploration
1949–1951 Oliver E.French
Staking and prospecting; discovered vermiculite-bearingcarbonatite near Blue River, discovered uranpyrochlore indolomitic carbonatite
1952–1955 St. Eugene Optioned property, geological mapping, prospecting, stripping,trenching, and sampling
1967-1968 Vestor Staking, reconnaissance surface mapping in the area south ofParadise Lake
1976 J. Kruszewski Re-staked the area as the Verity and AR claims
1977–1978 J. Kruszewski /E. Meyers
Magnetometer and scintillometer surveys, trenching andsampling
1980 AMC Optioned property, discovery of Fir and Bone Creek carbonatites1980–1982 AMC 3,954.2 m of NQ diamond drilling at Verity, Mill, Fir and Bone
Creek1989 Diegel et al. Government survey discovered two new carbonatite localities
near Serpentine Creek and Gum Creek
Abbreviations: St. Eugene = St. Eugene Mining Corporation Ltd.; Vestor = Vestor Exploration Ltd; AMC =Anschutz (Canada) Mining Ltd.; Commerce = Commerce Resources Corp.
6.2 Commerce History
In 2000, Commerce acquired the property, confirmed known Ta mineralization at the Firand Verity carbonatites, and explored for new carbonatite deposits. During the summerof 2002, the Upper Fir carbonatite showing was discovered and was delineated by coredrilling between 2005 and 2011. Additional work undertaken by Commerce includessurface mapping, trenching, soil, rock chip, grab and channel sampling, geophysics,metallurgical testing, bulk sampling, and mineral resource estimation.
An initial NI 43-101 compliant Mineral Resource estimate for the Upper Fir deposit wascompleted in early 2010 by CCIC. Amec Foster Wheeler prepared additional NI 43-101compliant Mineral Resource estimates with the effective dates of 30 June 2010, 29September 2011, 22 June 2012, and 21 June 2013. Results of a Preliminary Economic

Commerce Resources Corp.NI 43-101 Blue River Tantalum–Niobium Project
British Columbia, CanadaProject Update Report
Project No.: 179115 Page 6-218 March 2015
Assessment study were first presented in the 2011 report and were carried forward intothe 2012 and 2013 reports. The results of the PEA are now considered no longer currentand are not discussed in this current report.

Commerce Resources Corp.NI 43-101 Blue River Tantalum–Niobium Project
British Columbia, CanadaProject Update Report
Project No.: 179115 Page 7-118 March 2015
7.0 GEOLOGICAL SETTING AND MINERALIZATION
7.1 Regional Geology
The regional geology is taken largely from Currie (1976), Pell (1987 and 1994), Gorham(2007), and Stone and Selway (2010).
Carbonatites and alkaline rocks occur in three sub-parallel areas in British Columbia.These are:
The Eastern Area: the Foreland Belt, east of the Rocky Mountain Trench The Central Area: the eastern edge of the Omineca Belt The Western Area: the core of the Omineca Belt
British Columbia carbonatite occurrences are shown in (Figure 7-1).
The Eastern Area hosts northwest to southeast trending carbonatite occurrences oftenassociated with syenite intrusions. Most of the Eastern Area carbonatites have relativelyhigh Nb and rare earth element (REE) levels, and little or no Ta. Some known EasternArea carbonatite or carbonatite-associated properties are: Aley, Prince, Ice River andRock Canyon Creek.
The Central Area carbonatite intrusions occur along the eastern edge of the OminecaBelt and commonly have high concentrations of Nb but low rare earth element (REE)values. Some known carbonatite complexes include the Blue River (Upper Fir, Fir, andVerity) and Mud Lake.
The Western Area includes both intrusive and extrusive carbonatites and syeniticgneisses in the core of the Omineca Belt. Examples are Mount Copeland, Mount Grace,and Three Valley Gap.
The age of emplacement for carbonatites and alkaline rocks of the Eastern and CentralAreas typically range between Devonian–Mississippian (ca. 330–380 Ma). Someoccurrences from the core, or Western Area of the Omineca Belt might be older (ca. 570to 770 Ma). The carbonatites were emplaced as dikes or sills into the metasedimentaryrocks prior to the regional deformation and metamorphism that occurred c.a. 170 Ma.
All of the alkaline and carbonatite complexes and their host rocks within the OminecaBelt rocks were deformed and metamorphosed during the Jurassic-CretaceousColumbian Orogeny and have been subjected, in many cases, to upper amphibolitefacies metamorphism.

Commerce Resources Corp.NI 43-101 Blue River Tantalum–Niobium Project
British Columbia, CanadaProject Update Report
Project No.: 179115 Page 7-218 March 2015
Figure 7-1: Tectonic Belts of British Columbia and Carbonatite Occurrences
Note: Adapted after Pell (1994). Figure courtesy of Dahrouge Geological Consulting Ltd.

Commerce Resources Corp.NI 43-101 Blue River Tantalum–Niobium Project
British Columbia, CanadaProject Update Report
Project No.: 179115 Page 7-318 March 2015
7.2 Local Geology
The Blue River property is located in the Central Area within the north-eastern marginof the Shuswap Metamorphic Complex. The area comprises polyfolded,metamorphosed Late Proterozoic (ca. 700–550 Ma) supracrustal rocks and is boundedon both sides by steep, Eocene age, west-side down normal faults in the southern RockyMountain Trench to the east and the North Thompson valley to the west. The Maltongneissic complex lies to the north.
The supracrustal rocks are part of a belt dominated by the Late Proterozoic HorsethiefCreek Group and the overlying Kaza Group. The belt is continuous from the northernSelkirk Mountains in the southeast, through the Monashee Mountains, and into theCariboo Mountains in the northwest.
Eighteen carbonatite occurrences are hosted in the Mica Creek assemblage of theHorsethief Creek Group on the Blue River property (Figure 7-2 and Figure 7-3).
7.2.1 Lithology
Two units of the Mica Creek assemblage underlie much of the study area. The units areat least 1,000 m thick and comprise the lower pelite unit, and the stratigraphicallyoverlying semipelite–amphibolite unit. The Mica Creek metasedimentary rock typesinclude biotite gneiss, muscovite–biotite schist and gneiss, garnet–muscovite–biotiteschist and gneiss, calc-silicate–biotite gneiss, amphibolite, garnet amphibolite, and calc-amphibolite.
The high intensity of deformation precludes determination of tops in metasedimentaryrocks, thus relative ages of individual units are not clear. Layering in the gneiss hasbeen previously interpreted as relict bedding, but likely is dominantly compositionalsegregation due to the metamorphic grade.

Commerce Resources Corp.NI 43-101 Blue River Tantalum–Niobium Project
British Columbia, CanadaProject Update Report
Project No.: 179115 Page 7-418 March 2015
Figure 7-2: Blue River Project Local Geology Map
Note: Figure courtesy Dahrouge Geological Consulting Ltd.

Commerce Resources Corp.NI 43-101 Blue River Tantalum–Niobium Project
British Columbia, CanadaProject Update Report
Project No.: 179115 Page 7-518 March 2015
Figure 7-3: Blue River Local Geology Legend (for Figure 7-2)
Note: Figure courtesy Dahrouge Geological Consulting Ltd.
Gneisses and Schists
Metamorphosed quartzo-feldspathic biotite gneiss is the most abundant lithology thatoutcrops and it is inter-layered with all other lithologies on the property. Outcrops aremoderately weathered with characteristic 0.2 to >1 m thick layers of uniform, massive,medium grained quartz–feldspar–biotite ± muscovite divided by recessive schistosebands or fine partings. Fresh surfaces have a uniform, equigranular, salt and peppertexture of quartz, feldspar and biotite. Muscovite occurs as thin schistose partingsranging from trace to abundant amounts. Sub-one millimetre to several centimetrediameter red garnet porphyroblasts occur in varying amounts. These units areinterpreted to represent deformed and moderately re-crystallized turbidite. Calc-silicate-bearing biotite gneiss has pale green bands a few centimetres thick that may be relatedto microscopic traces of actinolite ± diopside.
Commerce Resources Corp.NI 43-101 Blue River Tantalum–Niobium Project
British Columbia, CanadaProject Update Report
Project No.: 179115 Page 7-618 March 2015
Amphibolites
The amphibolite units occur as lenses within all gneiss and schist units. They aretypically medium-grained, massive to moderately foliated amphibolites and can containred garnets (almandine) typically <1 cm in diameter. Plagioclase and hornblende occurin varying proportions forming rocks ranging from tonalite to hornblendite composition(<10% hornblende to >90% hornblende respectively). Weak mineral lineations arepresent as observed by the alignment of hornblende. Rare banding is observed atcentimetre scale.
Locally, calc-amphibolite units are distinguished by an increase in mineral grain size, astrong contrasting black and white colour, local presence of garnets, and effervescentreaction with dilute hydrochloric acid. The amphibolite units are interpreted asmetamorphosed mafic sills, dikes, and possibly subaqueous flows.
Intrusive Rocks
Ultramafic rocks associated with the carbonatites include fine- to medium-grainedpyroxenite and cumulate pyroxene–hornblendite. The ultramafic units likely representmetamorphosed ultramafic intrusions associated with either mafic volcanism(amphibolite) of roughly the same age as the intruded metasedimentary rocks orintrusion of carbonatite.
Both dolomite carbonatite and calcite carbonatite occur at Blue River. Dolomitecarbonatite is often referred to as magnesio-carbonatite, rauhaugite, or beforsite.Coarse-grained, calcite carbonatite is also often referred to as calcio-carbonatite orsövite. The carbonatites are discussed in more detail in Section 7.3
Pegmatite Dykes
Pegmatite dykes and pods up to 500 m long and 15 m thick crosscut all lithologiesthroughout the property. At least some of the pegmatite dykes are folded. Among thepegmatite dykes, two mineralogically-distinct types exist:
Two-mica (± garnet, ± tourmaline) granitic pegmatite
Syenitic pegmatite with minor biotite (± amphibole, ± pyroxene).
A coarse-grained skarn assemblage of calcite, amphibole and/or diopside is developedwhere pegmatite cross-cuts carbonatite.
Commerce Resources Corp.NI 43-101 Blue River Tantalum–Niobium Project
British Columbia, CanadaProject Update Report
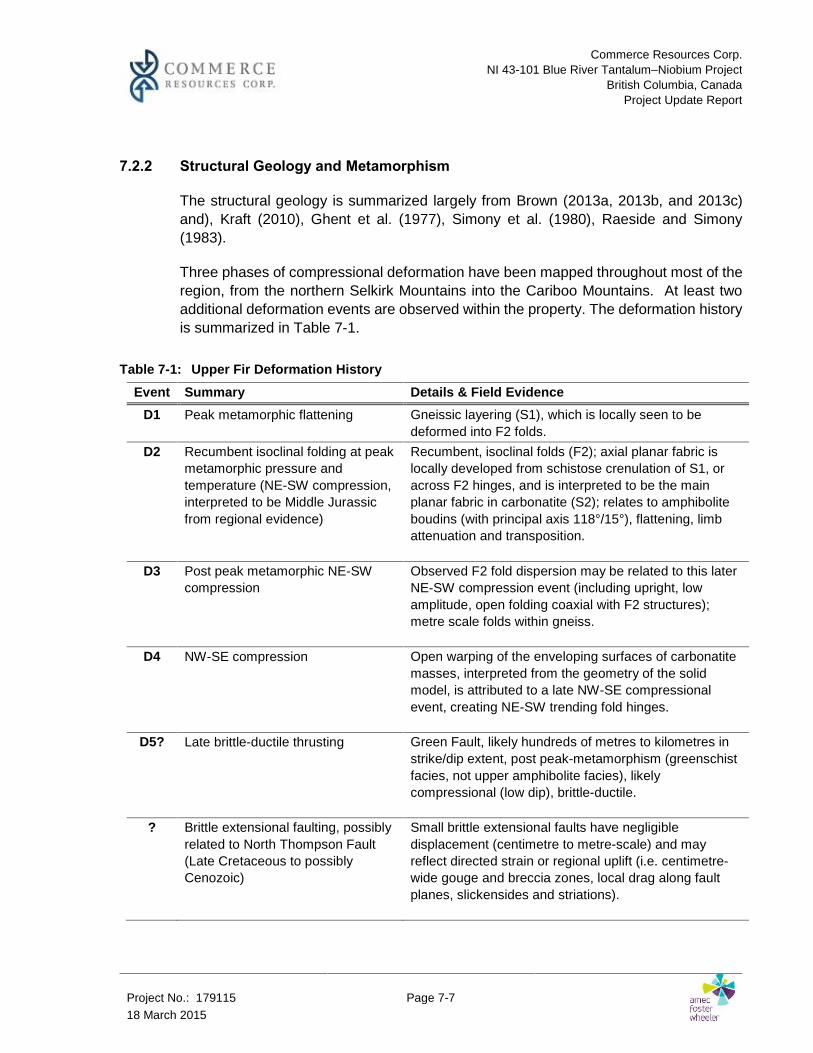
Project No.: 179115 Page 7-718 March 2015
7.2.2 Structural Geology and Metamorphism
The structural geology is summarized largely from Brown (2013a, 2013b, and 2013c)and), Kraft (2010), Ghent et al. (1977), Simony et al. (1980), Raeside and Simony(1983).
Three phases of compressional deformation have been mapped throughout most of theregion, from the northern Selkirk Mountains into the Cariboo Mountains. At least twoadditional deformation events are observed within the property. The deformation historyis summarized in Table 7-1.
Table 7-1: Upper Fir Deformation HistoryEvent Summary Details & Field Evidence
D1 Peak metamorphic flattening Gneissic layering (S1), which is locally seen to bedeformed into F2 folds.
D2 Recumbent isoclinal folding at peakmetamorphic pressure andtemperature (NE-SW compression,interpreted to be Middle Jurassicfrom regional evidence)
Recumbent, isoclinal folds (F2); axial planar fabric islocally developed from schistose crenulation of S1, oracross F2 hinges, and is interpreted to be the mainplanar fabric in carbonatite (S2); relates to amphiboliteboudins (with principal axis 118°/15°), flattening, limbattenuation and transposition.
D3 Post peak metamorphic NE-SWcompression
Observed F2 fold dispersion may be related to this laterNE-SW compression event (including upright, lowamplitude, open folding coaxial with F2 structures);metre scale folds within gneiss.
D4 NW-SE compression Open warping of the enveloping surfaces of carbonatitemasses, interpreted from the geometry of the solidmodel, is attributed to a late NW-SE compressionalevent, creating NE-SW trending fold hinges.
D5? Late brittle-ductile thrusting Green Fault, likely hundreds of metres to kilometres instrike/dip extent, post peak-metamorphism (greenschistfacies, not upper amphibolite facies), likelycompressional (low dip), brittle-ductile.
? Brittle extensional faulting, possiblyrelated to North Thompson Fault(Late Cretaceous to possiblyCenozoic)
Small brittle extensional faults have negligibledisplacement (centimetre to metre-scale) and mayreflect directed strain or regional uplift (i.e. centimetre-wide gouge and breccia zones, local drag along faultplanes, slickensides and striations).
Commerce Resources Corp.NI 43-101 Blue River Tantalum–Niobium Project
British Columbia, CanadaProject Update Report
Project No.: 179115 Page 7-818 March 2015
Folding occurs at the centimetre to kilometre scale. The thickness and massive natureof carbonatites makes observation of folding indicators within the carbonatitecomparatively difficult to observe in outcrop and drill core. Folding is observed in wallrocks adjacent to carbonatites in outcrop and in drill core. Within the carbonatites,compressional deformation with weak southeast elongation is suggested by cataclasticto mylonitic foliation zones and weakly to moderately developed mineral lineationsdefined by amphiboles.
Distinctive augen gneiss intersected by drilling below the Upper Fir and Bone Creekcarbonatites may represent a high strain zone defining a lower boundary for thesecarbonatites.
7.2.3 Geochronology
The geochronology is summarized largely from Pell (1994), Simonetti (2008), andGervais (2009).
A uranium–lead date of approximately 325 Ma was obtained from zircons from the Veritycarbonatite. A lead–lead date of 332.5 ± 5.7 Ma age was obtained from zircons for theUpper Fir carbonatite. A preliminary uranium–lead date of 328 ± 30 Ma was obtainedfrom zircons from the Mud Lake carbonatite. Zircons separated from syenite at ParadiseLake yielded a uranium–lead age of about 340 Ma and lead-lead ages of about 351 and363 Ma.
Research on U/Th/Pb dating of zircons and monazites from the property shows acomplex thermal history, indicating that the age of emplacement of the Blue River areacarbonatites may be older than initial results have shown (pers. comm. L. Millonig to J.Gorham).
7.3 Deposit Geology
Of the 18 carbonatite occurrences known on the property only the Upper Fir and BoneCreek have had sufficient exploration to support mineral resource estimates.
7.3.1 Upper Fir and Bone Creek Carbonatites
Dimensions
The Upper Fir and Bone Creek carbonatites form sill-like bodies with averagethicknesses of 30 m, ranging between 5 m to about 90 m thick, and with strike lengthsranging between 50 m to 1,100 m (Figure 7-4 to Figure 7-7). Bedding-parallel foliation

Commerce Resources Corp.NI 43-101 Blue River Tantalum–Niobium Project
British Columbia, CanadaProject Update Report
Project No.: 179115 Page 7-918 March 2015
in metasedimentary gneisses hosting the carbonatites and the contacts of carbonatiteintrusions generally strike 335° and 155° with shallow to moderate northeast andsoutheast dips.
Figure 7-4: Deposit Area Surface Geology Map
Note: Bulk sample locations are noted at BS1 and BS2. Figure courtesy Dahrouge Geological ConsultingLtd.

Commerce Resources Corp.NI 43-101 Blue River Tantalum–Niobium Project
British Columbia, CanadaProject Update Report
Project No.: 179115 Page 7-1018 March 2015
Figure 7-5: Longitudinal Section A – A’ (view SE)
Note: View is to the south-east. Section influence is +/- 25 m. Figure courtesy Dahrouge Geological Consulting Ltd. See Table 10.3 for example of carbonatite intersection grades

Commerce Resources Corp.NI 43-101 Blue River Tantalum–Niobium Project
British Columbia, CanadaProject Update Report
Project No.: 179115 Page 7-1118 March 2015
Figure 7-6: Geology Section B-B’
Note: View is to the northeast. Section influence is +/- 25 m. Figure courtesy Dahrouge Geological Consulting Ltd.See Table 10.3 for example of carbonatite intersection grades
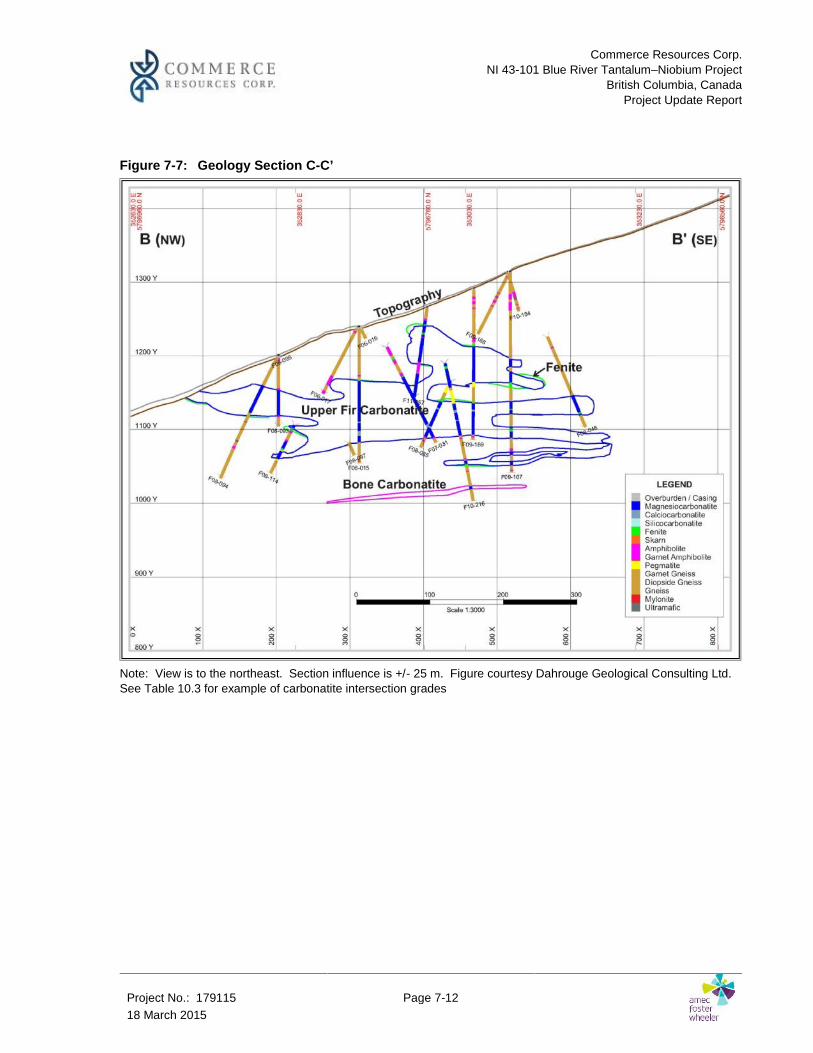
Commerce Resources Corp.NI 43-101 Blue River Tantalum–Niobium Project
British Columbia, CanadaProject Update Report
Project No.: 179115 Page 7-1218 March 2015
Figure 7-7: Geology Section C-C’
Note: View is to the northeast. Section influence is +/- 25 m. Figure courtesy Dahrouge Geological Consulting Ltd.See Table 10.3 for example of carbonatite intersection grades

Commerce Resources Corp.NI 43-101 Blue River Tantalum–Niobium Project
British Columbia, CanadaProject Update Report
Project No.: 179115 Page 7-1318 March 2015
Lithology
The main rock units in the Upper Fir and Bone Creek area are dolomite and calcitecarbonatite, associated alteration rocks (calcite amphibolite, calcite gneiss, skarn andfenite), and carbonatite-host rocks (metapelitic gneiss and schist; amphibolite; quartzo-feldspathic intrusive and ultramafic rocks).
Dolomite and calcite carbonatite form separate bodies but usually occur interbeddedtogether within single intervals. Dolomite carbonatite is dominant and typicallycomprises the cores of the carbonatite bodies but crosscutting or gradationalrelationships with calcite carbonatite are observed. The carbonatites are fine to coarse-grained and have cataclastic (porphyroclastic) texture. Foliation defined by varyingquantities of accessory minerals is common.
Contacts between carbonatite and the host metasedimentary rocks are typically sharpand mantled by zones of fenite. The fenite rocks commonly, but not always, envelopthe carbonatite rocks and can extend up to 50 m from the carbonatite intrusion. Thedegree of fenitization is variable and has resulted in a discontinuous and irregularthickness of fenite around the carbonatite. Fenite contacts with host rocks vary fromsharp to gradational. Metamorphic textures associated with the Mesozoic deformationare absent in the fenite, calcite amphibolite, and calcite gneiss, implying that thesealteration rocks resulted from remobilization of the carbonatite after peakmetamorphism.
Two types of skarn have been observed in drill core and outcrop: (1) an in situ skarn‘mass’ with irregular contacts, sometimes showing relict banding; and (2) a vein-typeskarn with sharp contacts which locally cross-cuts the carbonatite. Skarn is a minor rocktype.
Structure
The Upper Fir and Bone Creek area is structurally complex and has been stronglydeformed by folding. The average trend and plunge of interpreted fold hinges is 117°and 15°, respectively, with a southwest vergence. Variable small-scale folds observedin the host rocks are not observed in the carbonatite.
The carbonatite geometry can be described as a ‘stack of isoclinal recumbent folds’similar to a folded pegmatite observed on the Upper drill road (Figure 7-8).
Long wave length, low-amplitude second order open folds (F4) with projected fold axestrending 030° have been interpreted from the gentle wave of the upper and lower

Commerce Resources Corp.NI 43-101 Blue River Tantalum–Niobium Project
British Columbia, CanadaProject Update Report
Project No.: 179115 Page 7-1418 March 2015
carbonatite contacts in the 3D wire frame model used in the Mineral Resource estimatebut have not been observed in outcrop. This open warping of the carbonatite envelopingsurfaces provides good support for the existence of NW-SE compression (D4). Typicalfold indicators in core intersections are shown in Figure 7-9 to Figure 7-11.
Figure 7-8: Recumbent Isoclinal Fold on Upper Drill Road
A pegmatite located along the Upper drill road (0615SW01), with yellow field notebook for scale) is a good visualanalogue for carbonatite folding where there are isoclinal recumbent folds, detached hinges, and significant limbattenuation.
Figure 7-9: Fold Indicators (Hole F08-150: 121.8 m to 129.8 m)

Commerce Resources Corp.NI 43-101 Blue River Tantalum–Niobium Project
British Columbia, CanadaProject Update Report
Project No.: 179115 Page 7-1518 March 2015
Notes: Left: Hole F08-150: 121.8m to 129.8m. HQ diameter diamond drill core. Hole was drilled vertical.Compositional layering (L) of biotite gneiss is typically at a high angle to the core axis indicating a sub-horizontalattitude when related to the sub-vertical dip of the drill hole. A ptygmatic fold is also observed (T). Top of hole istowards the top left of photo. Right: Hole F08-150: 125 m. Indications of folding include asymmetric parasitic foldswith short and long limbs (P) bracketed by sub-horizontal compositional layering. Centimetre scale ptygmatic folds(T) are noted. Photos from Chong (2010).
Figure 7-10: Fold Indicators (Hole F08-150: 143.5 m and 147.0 m)
Note: Left: F08-150: 143.5 m. Right: F08-150: 147.0 m. Indications of folding include high and low angle layeringindicating possible fold closures. Top of hole is towards the top left of photos. Photos from Chong (2010).
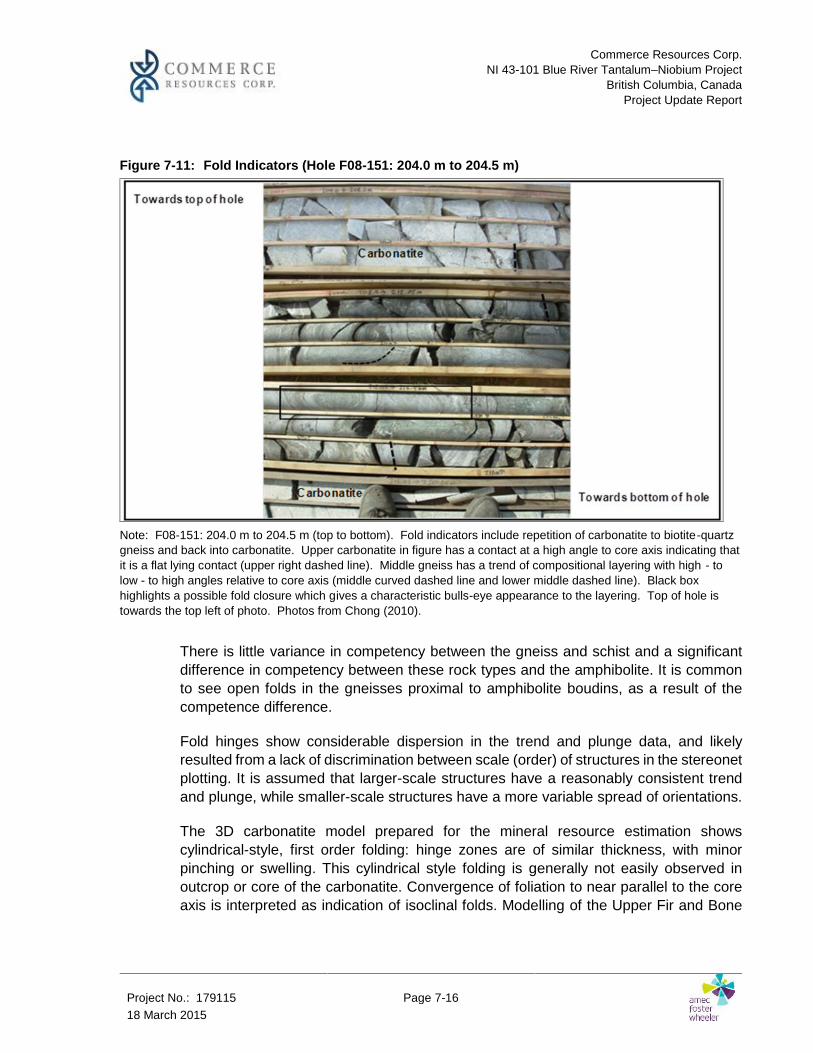
Commerce Resources Corp.NI 43-101 Blue River Tantalum–Niobium Project
British Columbia, CanadaProject Update Report
Project No.: 179115 Page 7-1618 March 2015
Figure 7-11: Fold Indicators (Hole F08-151: 204.0 m to 204.5 m)
Note: F08-151: 204.0 m to 204.5 m (top to bottom). Fold indicators include repetition of carbonatite to biotite-quartzgneiss and back into carbonatite. Upper carbonatite in figure has a contact at a high angle to core axis indicating thatit is a flat lying contact (upper right dashed line). Middle gneiss has a trend of compositional layering with high - tolow - to high angles relative to core axis (middle curved dashed line and lower middle dashed line). Black boxhighlights a possible fold closure which gives a characteristic bulls-eye appearance to the layering. Top of hole istowards the top left of photo. Photos from Chong (2010).
There is little variance in competency between the gneiss and schist and a significantdifference in competency between these rock types and the amphibolite. It is commonto see open folds in the gneisses proximal to amphibolite boudins, as a result of thecompetence difference.
Fold hinges show considerable dispersion in the trend and plunge data, and likelyresulted from a lack of discrimination between scale (order) of structures in the stereonetplotting. It is assumed that larger-scale structures have a reasonably consistent trendand plunge, while smaller-scale structures have a more variable spread of orientations.
The 3D carbonatite model prepared for the mineral resource estimation showscylindrical-style, first order folding: hinge zones are of similar thickness, with minorpinching or swelling. This cylindrical style folding is generally not easily observed inoutcrop or core of the carbonatite. Convergence of foliation to near parallel to the coreaxis is interpreted as indication of isoclinal folds. Modelling of the Upper Fir and Bone

Commerce Resources Corp.NI 43-101 Blue River Tantalum–Niobium Project
British Columbia, CanadaProject Update Report
Project No.: 179115 Page 7-1718 March 2015
Creek carbonatites between 2009 and 2011 was completed on east-west orientedvertical cross sections. Modelling in 2012 was completed using 3D rings on 030°oriented sections, perpendicular to the dominant trend of fold axes.
Defining faults that potentially offset the Upper Fir and Bone Creek carbonatites hasproved difficult. An attempt made to link surface mapped faults with fault zones loggedin drill holes was unsuccessful. Subsurface fault zones logged in drill holes appear to bediscontinuous and lack consistent characteristics. Furthermore, there is typically nochange in rock type across these logged fault zones. Many of the logged fault zones aremore likely fractures zones, the result of brittle jointing or local fracturing in response totectonic uplift, and reflect negligible displacement.
The BS1 Fault was previously interpreted as a brittle extensional fault truncating the topof the carbonatite body and the Folded Fault, as a folded brittle reverse fault. In 2012Dr. Philippe Erdmer observed that faults such as the BS1 Fault and Folded Fault arelikely not faults, as they only seem to show competence contrasts between rock units(fenite and carbonatite; gneiss/schist and amphibolite), and no change in rock type orsignificant displacement. A few other surface faults have been identified, such as onewith a drag fold and another with a 20 cm thick zone of gouge and breccia on the UpperDrill road (Figure 7-12 and Figure 7-13) but they cannot be traced to other outcropswhen projected along strike; and are therefore, considered not to have significantdisplacement. Dr. Erdmer concluded that these faults likely represent local, outcrop-scale faults or folding representing only minor displacement events.
Figure 7-12: Minor Drag Fault on Upper Drill Road
A local drag fault with minimal displacement (10s of cm’s) is viewed along the Upper drill road (10JK187).Drag folds are kinematic indicators for normal faulting.

Commerce Resources Corp.NI 43-101 Blue River Tantalum–Niobium Project
British Columbia, CanadaProject Update Report
Project No.: 179115 Page 7-1818 March 2015
Figure 7-13: Gouge Zone on Upper Drill Road
A fault with potential for more significant displacement is viewed along the Upper Drill Road (10JK046).The fault is characterized by a 20 cm thick gouge and breccia zone (inside red dashed lines).
The Green Fault is the only fault interpreted to show significant displacement in theUpper Fir and Bone Creek area. It is a northwest, ~30° dipping, brittle-ductile reversefault characterized by chlorite-rich shear zones, and ultramylonite. It has beenintersected in nine drill holes and ranges from two to ten meters thick. The Green Faultis interpreted to dip beneath the Upper Fir and Bone Creek carbonatites and does notintersect the carbonatites. It has not been identified in outcrop; the projected surfaceintersection is uphill and significantly east of the map area shown in Figure 7-4. Furtherdrilling is required to accurately determine the orientation of the fault.
Mineralization
The discussion in this section is summarized largely from observations during AmecFoster Wheeler’s site visits, Chudy (2008 and 2010), Chudy and Ulry (2012), Ulry(2012), Woolley and Kempe (1989), Aaquist (1982a), and Mariano (2000).
The Upper Fir and Bone Creek carbonatites are divided into approximately 96%magnesio-carbonatite (beforsite), with minor contained bodies of calcio-carbonatite

Commerce Resources Corp.NI 43-101 Blue River Tantalum–Niobium Project
British Columbia, CanadaProject Update Report
Project No.: 179115 Page 7-1918 March 2015
(sövite) silico-carbonatite (amphibole-rich), carbonatite breccia and fenite up to severalmetres thick (Table 7-2).
Table 7-2: Carbonatite Types and Their Percent Occurrence within the DepositCarbonatite Type Carbonatite Type Occurrence (%)
Magnesiocarbonatite (Beforsite) 96%Calciocarbonatite (Sövite) 3%Silicocarbonatite (amphibole-rich) <1%Carbonatite Breccia <1%Total Carbonatite 100%
The magnesio-carbonatite displays three main textures: coarse-grained gneissic,porphyroclastic and fine-grained foliated (Table 7-3).
Table 7-3: Textural Classifications and Proportions of Drilled Magnesio-carbonatiteIntersections
Magnesio-carbonatite(Beforsite) Divisions Texture Type
% of TotalMagnesio-carbonatite
coarse-grained gneissic (carb) 51%intermediate porphyroclastic 25%fine-grained fine-grained foliated 23%undefined undefined (does not fall under main texture types) <1%Total 100%
The coarse-grained (gneissic) magnesio-carbonatite group tends to have a high Nb:Taratio whereas the fine-grained (foliated) magnesio-carbonatite group tends to have a lowNb:Ta ratio. The calcite carbonatite is characterized by medium- to coarse-grainedporphyroclastic texture, and a has a low Nb:Ta ratio.
Preliminary metallurgical variability testing indicates similar metallurgical recoveries forthe coarse and fine grained magnesio-carbonatite. The current distribution of calcio-carbonatite remains restricted to the central and northern regions and represents lessthan 4% of the mineralized deposit. Individual continuity of these separate carbonatitegroups has not been confirmed and as such these variable carbonatite domains havenot been incorporated into the 3D carbonatite model used in the resource estimation.
Accessory minerals include amphibole, pyroxene, phlogopite, olivine, magnetite,apatite, pyrite/pyrrhotite, ilmenite, zircon, and the Ta and Nb bearing minerals pyrochloreand ferrocolumbite. There are two principal and one minor Ta- or Nb-bearing minerals

Commerce Resources Corp.NI 43-101 Blue River Tantalum–Niobium Project
British Columbia, CanadaProject Update Report
Project No.: 179115 Page 7-2018 March 2015
known at the Upper Fir and Bone Creek. Using generic end-member compositions, theyare:
Ferrocolumbite........................ (Fe,Mn,Mg)(Nb,Ta)2O6
Pyrochlore................. (Ca,Na,U)2(Nb,Ti,Ta)2O6(OH,F) Fersmite..................(Ca,Ce,Na)(Nb,Ta,Ti)2(O,OH,F)6.
Ferrocolumbite occurs predominantly in the medium to coarse-grained, gneissicdolomite carbonatite, which commonly occurs at the margins of carbonatite intervals andcan be up to nearly 50 m thick. This carbonatite contains the amphibole mineralswinchite and barroisite. Ferrocolumbite forms subhedral to anhedral, sometimesstrongly poikilitic, individual grains and composite grains with pyrochlore. Mineralliberation analyses show that the majority (~80%) of liberated grains are less than110 μm in diameter. Locally, individual and composite grains of ferrocolumbite mayexceed 2 cm in diameter.
Ferrocolumbite grains from marginal zones may contain large amounts of tiny inclusionssuch as thorite (Th-silicate), monazite (La, Ce-phosphate) and pyrochlore.Ferrocolumbite may also occur sporadically as inclusions in apatite and amphibole. Itis often associated with layers and micro-veins of apatite that fill the interstices betweenanhedral ferroan-dolomite grains.
Pyrochlore occurs predominantly in the fine-grained foliated and porphyroclasticdolomite carbonatite containing the amphibole richterite, which is commonly developedin the central portions of carbonatite intervals greater than 10 m thick. Such zones areless abundant or absent in thinner carbonatite intersections. Pyrochlore is the only Tamineral in the calcite carbonatite. Black and brownish-yellow coloured varieties ofpyrochlore are present.
The majority of the pyrochlore occurs as liberated grains in the dolomitic matrix. Thevast majority (~ 85%) of pyrochlore forms subhedral to anhedral, rounded grains lessthan 200 μm in diameter. There are local larger and composite grains, as well asaccumulations or veins less than a few tens of centimetres in width with high pyrochloreabundance. This style of mineralization can result in locally high Ta values (> 450 ppmTa).
Pyrochlore also occurs as inclusions in amphibole (richterite), fluorapatite, and inferrocolumbite. In some rare cases the pyrochlore grains can be coated with a thin filmof pyrrhotite or pyrite.

Commerce Resources Corp.NI 43-101 Blue River Tantalum–Niobium Project
British Columbia, CanadaProject Update Report
Project No.: 179115 Page 7-2118 March 2015
Fersmite occurs as anhedral inclusions in apatite, primarily at the Verity carbonatite andis considered a minor economic mineral at the Project.
Mineralization in the fenite is dominantly ferrocolumbite, concentrated in apatite-richlayers. Ilmenite, with ferrocolumbite inclusions, appears to be a subdominant source ofboth Ta and Nb. The Ta and Nb grades within fenite are considered sub-economic, butlocally fenite may provide grade-bearing mining-dilution material.
Mineral zoning of ferrocolumbite and pyrochlore within the carbonatites is not clear dueto the variable thicknesses and polyfolded geometry of the carbonatite. Researchsupports the association of dominantly pyrochlore mineralization with richterite-bearing,fine-grained, foliated carbonatite defining zones of retrograde deformation.Ferrocolumbite mineralization is dominant in winchite–barroisite-bearing,coarse-grained gneissic carbonatite. Carbonatite of intermediate porphyroclastictextures may contain both minerals. Further work is required to improve theunderstanding of the mineral zoning and to locate potential material end-member typesrequired to support metallurgical testwork.
7.3.2 Fir Carbonatite
Information summarized on the Fir deposit is from the British Columbia GeologicalSurvey website and from recent studies completed by Commerce.
The Fir carbonatite is located 1.25 km north of the Bone Creek carbonatite. Presently itis believed that the dolomite and lesser calcite carbonatite occur as sill-like tabularbodies within a hornblende-mica schist of the semipelite-amphibolite division of theHorsethief Creek Group. Other lithologies include amphibole-biotite schist, biotite-muscovite gneiss and amphibole-biotite-garnet gneiss.
The Fir carbonatite has a strike extent of at least 400 m in a northerly direction basedon outcrop exposures. A 2 m exposure of dolomite carbonatite was located 400 m northof the discovery outcrops. Additional exploration potential exists south of the Firdiscovery outcrops based on Ta and Nb soil anomalies. Dolomite carbonatite outcropsare coarsely crystalline and typically weather white. Accessory minerals in the Fircarbonatite include apatite, amphibole, olivine, magnetite, pyrite, pyrrhotite, pyrochlore,and columbite. The dolomite carbonatite is almost devoid of biotite and magnetite. Thesame main three textures exhibited in the Upper Fir carbonatite are also seen in the Fircarbonatite: gneissic, porphyroclastic and fine-grained foliated.
Ta and Nb mineralization in the Fir carbonatite occurs as the minerals pyrochlore andferrocolumbite. The Fir carbonatite has the highest background Ta and Nb values of all

Commerce Resources Corp.NI 43-101 Blue River Tantalum–Niobium Project
British Columbia, CanadaProject Update Report
Project No.: 179115 Page 7-2218 March 2015
carbonatites in the area. Sampling of the discovery outcrops returned assays of 1.02%Nb2O5, 0.06% Ta2O5, and 6.31% P2O5. A sample from drill hole BC19 returned valuesof 0.18% Ta and 8.51% phosphate from 119.0–119.6 m. The anomalous value may bethe result of a pyrochlore–apatite-rich band in the sample.
7.3.3 Verity Carbonatite
The Verity carbonatite is located about 40 km north of the community of Blue River. TheVerity carbonatite has the most varied stratigraphy of all the carbonatites in the areaconsisting of banded dolomite and calcite carbonatite that locally intrude each other. Itis interpreted to be a 15 m to 30 m thick sill within a hornblende-mica schist of theHorsethief Creek Group and can be traced up the hillside for 800 m to theeast-northeast.
A tectonic breccia showing hairline fractures is common in the dolomite carbonatite. Abanded texture caused by layering of the accessory minerals apatite, amphibole, olivine,magnetite, vermiculite, biotite, pyrite, pyrrhotite, pyrochlore, columbite, and zircon iscommon in the calcite carbonatite and less developed in the dolomitic carbonatite.Coarse olivine and apatite in the calcite dolomite form bands 1 cm to 5 cm thick.Magnetite occurs as discontinuous lenses in the calcite carbonatite layers; the lensescan be as much as 20 cm in diameter.
Ta and Nb mineralization in the Verity carbonatite occurs in the minerals pyrochlore andcolumbite. The pyrochlore and columbite crystals occur as octahedrons that can reach4 cm diameter. Calcite carbonatite at the Verity occurrence also contains greater than10.8% phosphate and has abundant apatite relative to other nearby carbonatites at theProject. Rare earth elements are interpreted to be hosted in fluorine-rich carbonate.
7.4 QP Comment
The knowledge of Upper Fir deposit setting, lithologies, and structural and alterationcontrols on mineralization is sufficient to support mineral resource estimation. TheUpper Fir and Bone Creek deposits are Ta and Nb rich carbonatites which also haveassociated uranium and thorium present in low levels in mineralized and waste rocks.Estimated concentrations average 42 ppm U and 6 ppm Th. Any radon that might beproduced as a consequence of mining and processing would likely be manageable withventilation, dust control, and monitoring.
Other Blue River prospects are at an early stage of exploration, and the knowledge oftheir lithologies, and structural and alteration controls on mineralization is not sufficientto support mineral resource estimation at present.

Commerce Resources Corp.NI 43-101 Blue River Tantalum–Niobium Project
British Columbia, CanadaProject Update Report
Project No.: 179115 Page 8-118 March 2015
8.0 DEPOSIT TYPES
The mineralization identified to date within the property boundaries is consistent withmagmatic, carbonatite-associated deposits. Carbonatite-associated deposits areclassified as either magmatic, replacement, or residual. Global examples of magmaticcarbonatite complexes or deposits include: Oka and Niobec (St. Honore) (Quebec);Kovdor (Russia); Iron Hill (Colorado); and Gardiner (Greenland) (Mitchell, 2010).Examples of replacement carbonatite deposits are Rock Canyon (B.C.), Bayan Obo(China), and Palabora (South Africa). Araxa and Catalao (Brazil) are classified asresidual carbonatite deposits due to the degree of lateritic weathering. Carbonatites arethe main source of Nb +/- Ta, and important sources of rare earth elements.
Magmatic carbonatite deposits have the following common features (Birkett andSimandl, 1999).
Commodities: Ta, Nb, rare earth elements, phosphate, vermiculite, copper,titanium, strontium, fluorine, thorium, uranium, magnetite.
Geological Setting: Carbonatites intrude all types of rocks and are emplaced at avariety of depths. Carbonatites occur mainly in a continental environment, rarely inoceanic environments (Canary Islands) and are generally related to large-scale,intra-plate fractures, grabens or rifts that correlate with periods of extension andmay be associated with broad zones of uplift.
Age of Mineralization: Carbonatite intrusions are early Precambrian to Recent inage; they appear to be increasingly abundant with decreasing age. In BritishColumbia, carbonatites are mostly Eocambrian, upper Devonian, or Mississippianin age.
Host Rocks: Host rocks are varied, including calcite carbonatite (sövite), dolomitecarbonatite (beforsite), ferroan or ankeritic calcite-rich carbonatite(ferrocarbonatite), magnetite-olivine-apatite ± phlogopite rock, nephelinite, syenite,pyroxenite, peridotite and phonolite. Carbonatite lava flows and pyroclastic rocksare not known to contain economic mineralization. Country rocks are of varioustypes and metamorphic grades.
Deposit Form: Carbonatites commonly occur as small, pipe-like bodies, dikes,sills, small plugs or irregular masses. The typical pipe-like bodies havesub-circular or elliptical cross sections and are up to 3-4 km in diameter. Magmaticmineralization within pipe-like carbonatites is commonly found in crescent-shapedand steeply-dipping zones. Metasomatic mineralization occurs as irregular formsor veins. Residual and other weathering-related deposits are controlled bytopography, depth of weathering and drainage development.
Commerce Resources Corp.NI 43-101 Blue River Tantalum–Niobium Project
British Columbia, CanadaProject Update Report
Project No.: 179115 Page 8-218 March 2015
Deposit Mineralogy:
o Magmatic: bastnaesite, pyrochlore, columbite, apatite, anatase, zircon,baddeleyite, magnetite, monazite, parisite, fersmite.
o Replacement/Veins: fluorite, vermiculite, bornite, chalcopyrite and othersulphides, hematite.
o Residual: anatase, pyrochlore and apatite, locally crandallite-group mineralscontaining rare earth elements.
Gangue Mineralogy: calcite, dolomite, siderite, ferroan calcite, ankerite, hematite,biotite, titanite, olivine, quartz.
Alteration: A fenite halo (alkali metasomatized country rocks) commonly surroundscarbonatite intrusions; alteration mineralogy depends largely on the composition ofthe host rock. Most fenites are zones of desilicification with addition of Fe3+, Naand K.
Mineralization Controls: Intrusive form and cooling history control primary igneousdeposits (fractional crystallization). Tectonic and local structural controls influencethe forms of metasomatic mineralization. The depth of weathering and drainagepatterns control residual pyrochlore and apatite deposits, and vermiculite deposits.
Many features of the mineralization identified within the property are analogous tomagmatic carbonatite deposits, in particular the Oka (Husereau Hill) and Niobec (St.Honoré) deposits in Quebec. Key features of the Blue River deposits supporting amagmatic carbonatite model are:
Commodities: Ta and Nb
Geological Setting: occurs along the eastern portion of the Omineca CrystallineBelt and hence its tectonic setting is along a large scale zone with associated uplift
Age of Mineralization: data yields results of about 330 Ma which is consistent withother British Columbia carbonatite deposits
Host Rocks: dolomite and calcite-rich carbonatite intrusive rocks
Deposit Form: the Blue River carbonatites occur as sills and dykes
Deposit Mineralogy: ferrocolumbite and pyrochlore
Gangue Mineralogy: dolomite, calcite, amphibole (richterite), quartz, pyroxene,phlogopite, olivine, magnetite, apatite, pyrite/pyrrhotite, ilmenite, and zircon
Geochemistry: high strontium levels (>5,000 ppm)
Alteration: Fenite halos occur around most carbonatites at Blue River

Commerce Resources Corp.NI 43-101 Blue River Tantalum–Niobium Project
British Columbia, CanadaProject Update Report
Project No.: 179115 Page 8-318 March 2015
Mineralization Controls: Carbonatites are the main host rocks to the Ta and Nbrich minerals pyrochlore and ferrocolumbite. The Blue River carbonatites havebeen deformed by multiple episodes of folding and faulting. The internal coolinghistory of the deposit is not clear. The spatial distribution of the Ta and Nb richminerals varies throughout the carbonatite.

Commerce Resources Corp.NI 43-101 Blue River Tantalum–Niobium Project
British Columbia, CanadaProject Update Report
Project No.: 179115 Page 9-118 March 2015
9.0 EXPLORATION
Commerce acquired parts of the current property in 2000 and initiated exploration fornew carbonatite deposits which culminated in the drilling of the Upper Fir carbonatiteand delineation of the Fir and Upper Fir–Bone Creek carbonatite system.
9.1 Grids and Surveys
All surveys to date are in UTM NAD83 Zone 11 coordinates. In 2007, orthophotographyand Lidar surveys were flown to create a 1:2,000 base map of the Upper Fir area. Atopography map with 2 m contour intervals was created by Eagle Mapping Ltd.
9.2 Geological Mapping
Mapping was used to determine the outcrop of carbonatite and provide geological andstructural data and has been completed at 1:2,500 scale on a continuous basis since2006. The mapping area coverage is between Bone and Gum Creeks; and from theNorth Thompson River to the ridge top located about 3 km east on the slope that isknown locally as either Fir or Cedar Mountain. The mapping area includes the Fir, UpperFir, Bone Creek (considered a single system) and Gum carbonatites plus the nearbyHodgie Zone.
9.3 Geochemical Sampling
9.3.1 Stream Sediment Sampling
Reconnaissance stream sediment sampling was completed during 2001 to 2003, and2006 to 2007. During 2008, 531 stream sediment samples were collected and analysedfor the streams throughout the entire property. The key exploration elements are Ta,Nb, and rare earth elements. Detailed sample analysis using microscopic mineralcharacterization was utilized, focusing on identifying pyrochlore, apatite, richterite, andmonazite as pathfinder minerals.
During the 2009 field season, a total of 20 stream pan concentrate samples were takenin the Fir and Mud Creek areas to follow up on creek-mouth areas inaccessible duringthe 2008 field season. Samples were analyzed primarily for Ta, Nb, rare earth elements,phosphate, and carbonate. Several samples anomalous in Ta and Nb indicate that theFir carbonatite likely extends further south.
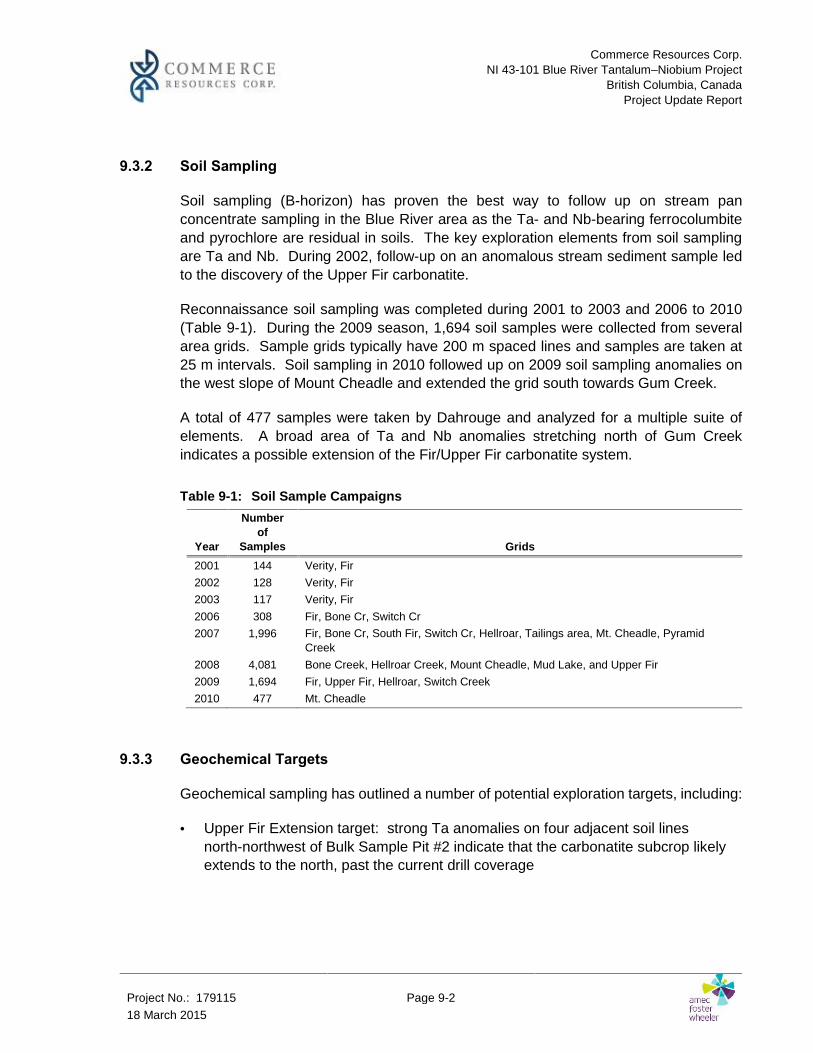
Commerce Resources Corp.NI 43-101 Blue River Tantalum–Niobium Project
British Columbia, CanadaProject Update Report
Project No.: 179115 Page 9-218 March 2015
9.3.2 Soil Sampling
Soil sampling (B-horizon) has proven the best way to follow up on stream panconcentrate sampling in the Blue River area as the Ta- and Nb-bearing ferrocolumbiteand pyrochlore are residual in soils. The key exploration elements from soil samplingare Ta and Nb. During 2002, follow-up on an anomalous stream sediment sample ledto the discovery of the Upper Fir carbonatite.
Reconnaissance soil sampling was completed during 2001 to 2003 and 2006 to 2010(Table 9-1). During the 2009 season, 1,694 soil samples were collected from severalarea grids. Sample grids typically have 200 m spaced lines and samples are taken at25 m intervals. Soil sampling in 2010 followed up on 2009 soil sampling anomalies onthe west slope of Mount Cheadle and extended the grid south towards Gum Creek.
A total of 477 samples were taken by Dahrouge and analyzed for a multiple suite ofelements. A broad area of Ta and Nb anomalies stretching north of Gum Creekindicates a possible extension of the Fir/Upper Fir carbonatite system.
Table 9-1: Soil Sample Campaigns
Year
Numberof
Samples Grids2001 144 Verity, Fir2002 128 Verity, Fir2003 117 Verity, Fir2006 308 Fir, Bone Cr, Switch Cr2007 1,996 Fir, Bone Cr, South Fir, Switch Cr, Hellroar, Tailings area, Mt. Cheadle, Pyramid
Creek2008 4,081 Bone Creek, Hellroar Creek, Mount Cheadle, Mud Lake, and Upper Fir2009 1,694 Fir, Upper Fir, Hellroar, Switch Creek2010 477 Mt. Cheadle
9.3.3 Geochemical Targets
Geochemical sampling has outlined a number of potential exploration targets, including:
Upper Fir Extension target: strong Ta anomalies on four adjacent soil linesnorth-northwest of Bulk Sample Pit #2 indicate that the carbonatite subcrop likelyextends to the north, past the current drill coverage

Commerce Resources Corp.NI 43-101 Blue River Tantalum–Niobium Project
British Columbia, CanadaProject Update Report
Project No.: 179115 Page 9-318 March 2015
Bone Creek Extension target: strong Ta-in-soil anomalies on two widely-spacedlines centered at UTM 5,797,000 N indicate a near surface carbonatite body that ison strike with the Bone Creek carbonatite
Fir Exploration target: strong Ta-in-soil anomalies on widely-spaced lines locatednorth, south and above the known Fir showing indicate possible extensions of theFir carbonatite
Mt. Cheadle Exploration target: a large diffuse Ta-in-soil anomaly, with severalspikes, stretching over 2 km, is located north of Gum Creek and along strike fromthe Upper Fir carbonatite
3050 Road target: Strong Ta anomalies on soil lines to the north and east ofcurrent drilling on the Upper Fir deposit near 3050 Road indicate anothercarbonatite body may be located above the known extents of the deposit.
Target locations are indicated on Figure 9-1.

Commerce Resources Corp.NI 43-101 Blue River Tantalum–Niobium Project
British Columbia, CanadaProject Update Report
Project No.: 179115 Page 9-418 March 2015
Figure 9-1: Exploration Target Location Surface Map
Note: Figure courtesy Dahrouge Geological Consulting Ltd.
Commerce Resources Corp.NI 43-101 Blue River Tantalum–Niobium Project
British Columbia, CanadaProject Update Report
Project No.: 179115 Page 9-518 March 2015
9.3.4 Rock Chip, Grab, and Channel Sampling
Rock samples have been collected as part of prospecting and mapping activities since2000 (Table 9-2). Rock samples from various new and known localities, primarily onthe Wasted claims located west of the North Thompson River, were taken during 2010prospecting to test for or verify the presence and abundance of Ta and Nb and rare earthmineralization. Twenty-five in situ bedrock grab and chip samples were taken at MiledgeCreek, the Hodgie Zone, the Felix, and the Mona carbonatites.
The Mona carbonatite, south of the Fir carbonatite, is interpreted to be a late stageremobilization of carbonatite from the Fir system. One continuous chip sample of feniteat the Mona carbonatite averaged 1,474 ppm Nb and 0.66% total rare earth elements(TREE) over 28 cm. Two grab samples of carbonatite from the Mona averaged1,743 ppm Nb and 1.36% TREE and 6 ppm Nb and 3.66% TREE respectively.
Table 9-2: Rock Sample Campaigns
YearNumber ofSamples Type Area
2000 15 Chip, grab Verity, Roadside2001 17 Chip, grab, float Fir, Bone Creek, Roadside2002 20 Grab, float Fir, Bone Cr, Serpentine, Gum Cr2003 3 Grab Upper Fir2006 131 Chip, grab, float Upper Fir, Bone Cr, Mt Cheadle, Gum Cr,
Paradise L, Verity, Switch Cr, Serpentine2007 110 Chip, grab, float Upper Fir, Bone Cr, Serpentine, Paradise L, Mt
Cheadle, Windfall Cr, Howard Cr, Gum Cr,Pancake Cr
2008 117 Chip, grab, float, channel Upper Fir, Bone Cr ultramafic, Felix, Gum Cr,Hodgie, Little Chicago, Mud Cr, Serpentine
2009 113 Chip, grab, float, channel Fir, Gum, Mud Cr, Howard Cr, Paradise,Switch Cr-Roadside,
2010 25 Chip, grab, regolith Wasted Claims, Felix, Mona, Hodgie
Three samples of the Felix carbonatite confirmed that it is not a Ta-bearing unit, with Tavalues below 1 ppm and TREE values below 0.01%. One sample of clinopyroxene-amphibole schist from the Hodgie Zone returned only 0.02% TREE.
Sampling on the Wasted claims along Miledge Creek on the west side of the NorthThompson River was undertaken to aid in condemnation of potential waste rock ortailings storage sites. The highest value found was a pyrite-muscovite schist yielding49.5 ppm Nb, 3.3 ppm Ta, and 0.05% TREE.

Commerce Resources Corp.NI 43-101 Blue River Tantalum–Niobium Project
British Columbia, CanadaProject Update Report
Project No.: 179115 Page 9-618 March 2015
9.4 Bulk Sampling
A bulk sample program was undertaken in the fall of 2008 by Dahrouge as part of on-going evaluation of the Upper Fir carbonatite. Approximately 2,000 t from a 10,000 tpermitted volume were extracted from three bulk sample pits (BS-1, BS-2, and BS-3;refer to locations shown in Figure 7-4) and placed into 75 t to 150 t stockpiles that werecomprised largely of -50 cm carbonatite material. The stockpiles were stored on a lined,well-drained pad at the site for later metallurgical testing.
For each pit area, geological mapping was completed along with sampling of blast-holematerial and channel samples of the bench walls. Both gneissic and porphyroclasticmetamorphic textures and structures were exposed in the sample pits. Microscopicexamination of oxide phases in the bulk sample material indicated that pyrochlore wasthe dominant mineral in pit BS-1 with the exception of benches at the upper and lowercontacts. Ferrocolumbite with subordinate amounts of pyrochlore forms themineralization in pits BS-2 and BS-3.
Pit BS-1 was excavated in dominantly fine- to medium-grained, granular, foliated,apatite-bearing, dolomite carbonatite. Pits BS-2 and BS-3 were excavated in dominantlylight-grey, coarse-grained, porphyroclastic, apatite-bearing, dolomite carbonatite.Crosscutting veins of dark green actinolite–calcite–diopside that are as much as 20 cmwide are common. Contacts in each pit are marked by approximately 1 m of fenite, withcontorted layers of dolomite carbonatite up to 10 cm thick.
Material from the 2008 bulk sampling program appears to provide a sufficient range ofTa and Nb grades to represent the Upper Fir carbonatite mineralization for initialmetallurgical testing.
Both pits, BS-1 and BS-2, were stabilized and grass seeded, while pit BS-3 wasbackfilled and reclaimed during 2009 and 2010. The bulk sampling permit expired on31 December 2009 and has not been renewed, although bulk sample material remainsstockpiled on the site for future testwork.
Table 9-3 lists the three bulk sample pits and four trenches (TR0, 0A, 1, and 1A) whichhave been sampled. These were only used for geological interpretation, domainmodeling, and metallurgical sampling, and not for grade interpolation.
Table 9-3: Upper Fir Deposit Trench and Bulk Samples
Category Deposit Operator Year Number Series Type#
(m)
Metallurgy Upper Fir Commerce 2008 3 BS01 to BS03 Bulk Sample 138

Commerce Resources Corp.NI 43-101 Blue River Tantalum–Niobium Project
British Columbia, CanadaProject Update Report
Project No.: 179115 Page 9-718 March 2015
Exploration Upper Fir Commerce 2006 4 TR0, 0A, 1, 1A Trench-Chip 73
9.5 QP Comment
The exploration programs completed to date are appropriate to the style of the depositsand prospects within the Blue River Project area.

Commerce Resources Corp.NI 43-101 Blue River Tantalum–Niobium Project
British Columbia, CanadaProject Update Report
Project No.: 179115 Page 10-118 March 2015
10.0 DRILLING
10.1 Drill Plan
Diamond drilling is the most extensively used exploration tool at the Blue River property.Vertical and inclined drill holes were collared on three primary drill roads. Holes weredrilled on approximately 50 m spaced east-west oriented sections and at approximately50 m to 100 m along the sections. Sets of vertical and east or west oriented inclinedholes were drilled from common collar locations. Inclined holes are orientedapproximately east or west, sub-perpendicular to the trend of the deposit and have dipsthat range from -60° to -80°. Approximately 45% of the holes are vertical. Drill holedepths range from a minimum of 32 m and a maximum of 388 m, averaging about 200 m.Drilling from 2005 to 2011 focused on an area approximately 1,600 m north-south by1,000 m east-west. Holes are typically HQ diameter (96 mm) producing core with adiameter of 63.5 mm; some historical holes are NQ diameter (47.6 mm diameter core).
Upon completion of a drill hole, 4" x 4" wooden posts were placed into the hole. Steelplates with the drill-hole names were cemented into the ground adjacent to the holecollars making hole identification relatively easy.
The current database comprises a total of 303 drill holes consisting of 62,780 m ofdrilling. Table 10-1 summarises the drilling campaigns and Figure 10-1 shows a planview of the drill collars. Twenty-one holes drilled by previous operators are consideredlegacy holes, as well as assays from 11 holes drilled by Commerce in 2002 were notused to estimate grades in this mineral resource update. The 11 Commerce holes wereused to interpret geology.

Commerce Resources Corp.NI 43-101 Blue River Tantalum–Niobium Project
British Columbia, CanadaProject Update Report
Project No.: 179115 Page 10-218 March 2015
Table 10-1: Drill Campaign SummaryCategory Deposit Operator Year # Holes Series Type # Metres # Samples % Samples
Resource Bone Creek Commerce 2005 4 CF05-01 to CF05-04 HQ 300 14 <1%Resource Upper Fir Commerce 2005 4 CF0505 to CF0508 HQ 505 44 <1%Resource Upper Fir Commerce 2006 17 CF0601 to CF0617 HQ 3,021 1139 7%Resource Upper Fir Commerce 2007 18 F0718 to F0735 HQ 4,310 1053 7%Resource Upper Fir Commerce 2008 118 F08-36 to F08-153 HQ 23,723 5,126 33%Resource Upper Fir Commerce 2009 22 F09-154 to F09-176 HQ 5,587 842 5%Resource Upper Fir Commerce 2010 54 F10-177 to F10-230 HQ 12,949 4468 29%Resource Upper Fir Commerce 2011 34 F11-231 to F11-264 HQ 8,715 2,776 18%Resource Subtotal 271 59,110 15,462 100%Historical Bone Creek AMC 1980-1981 17 BC-1 to BC-17 NQ 697 na-Historical Fir AMC 1981 4 BC1-18 to BC-21 NQ 829 na-Non-resource drilling Fir Commerce 2001-2002 11 F-01 to F-11 HQ 2,144 na-Target Subtotal 32 3,670Total Drilling 303 62,780
Notes: AMC = Anschutz Mining Corp.

Commerce Resources Corp.NI 43-101 Blue River Tantalum–Niobium Project
British Columbia, CanadaProject Report Update
Project No.: 179115 Page 10-318 March 2015
Figure 10-1: Drill Collar Plan
Note: Figure courtesy of Dahrouge Geological Ltd. Contour interval is 5 m.

Commerce Resources Corp.NI 43-101 Blue River Tantalum–Niobium Project
British Columbia, CanadaProject Update Report
Project No.: 179115 Page 10-418 March 2015
10.2 Collar Surveys
Prior to 2011 Commerce established planned drill-hole collars in the field with a hand-held global positioning system (GPS) instrument and the hole orientation wasestablished with a Brunton compass. In 2011, a Reflex Azimuth Positioning System(APS) was introduced to aid in positioning and orienting the drill.
Align Surveys of Louis Creek, B.C surveyed completed 2008 and 2009 drill-hole collarsusing a laser theodolite system. McElhanney Associates of Vancouver (McElhanney)surveyed completed 2010 and 2011 drill-hole collars using a differential GPS (DGPS).At the same time McElhanney resurveyed most pre-2010 drill-hole collars; monumentsfor 51 holes had been destroyed by road and drill site preparation activities and werenot resurveyed.
10.3 Down-Hole Surveys
A summary of survey methods used to measure down-hole deviation by drill campaignsis provided in Table 10-2.
Table 10-2: Down-Hole Survey Methods by YearYear Method
2005 No Surveys2006 Acid Etched Tube2007 Reflex Single Shot2008 Reflex Single Shot2009 Reflex Single Shot2010 Reflex Multi Shot2011 Reflex Gyro
Acid etched tube tests were typically taken at the end of inclined holes. Vertical holeswere not surveyed down the hole during 2005 and 2006. Flexit Single Shot dip andazimuth measurements of vertical holes were typically taken at up to five points downeach hole; measurements for inclined holes were typically taken at up to 10 points downeach hole. Flexit Multi Shot tool measurements were taken every 3 m down-hole. TheFlexit instruments were calibrated at the start of each field season. Reflex Gyromeasurements were taken at 5 m intervals. The Multi Shot tool was used when theGyro tool was not available; the Single Shot tool was used when the Multi Shot Tool wasnot available.

Commerce Resources Corp.NI 43-101 Blue River Tantalum–Niobium Project
British Columbia, CanadaProject Update Report
Project No.: 179115 Page 10-518 March 2015
10.4 Core Recovery
Core recovery was measured before sampling and detailed logging was initiated.Standard core recovery forms were usually completed for each hole by the field assistantor geologist. Core recovery is very good within the waste and carbonatite rocks (typically>95%). Poor recovery was periodically encountered for the fenite rocks located in theimmediate hanging wall to the carbonatite.
10.5 Geotechnical Drilling
Six oriented-core geotechnical drill holes comprising 1,271 m of HQ diameter werecompleted during 2010. Also in 2010, DGI Geoscience Inc., Mississauga, Ontario,conducted an orientation survey using optical and acoustic televiewers. This surveyprovided oriented drill-hole information for two 2010 holes and four pre-2010 holes. Theoptical and acoustic televiewer surveys were also completed on 18 drill holes during the2011 campaign.
10.6 Core Logging
Drillers placed drill core in wooden core boxes. The core boxes were marked with thedrill-hole name and box number. The end of every drill run was marked by a woodenblock depth marker. The core boxes were transported by pick-up truck to the corelogging facility at the community of Blue River, B.C.
Core logging involved both geotechnical and geological information. Geotechnicallogging included measuring rock quality designation (RQD), fracture roughness andorientation. The geological logging included observations of colour, lithology, texture,structure, mineralization, and alteration. All drill core was digitally photographed undernatural outdoor, or fluorescent indoor lighting prior to splitting. In 2011, additionalultraviolet light digital photography of core was introduced to better characterizestructure and mineral variation within the carbonatite. All digital photos are stored in acomputerized archiving system.
10.7 Core Sampling Methods
Drill core was sampled at 1 m intervals. The drill-hole spacing and orientations haveproduced a sample spacing of approximately 50 m, increasing with depth.
The sampling procedure used to collect core at Blue River is as follows:
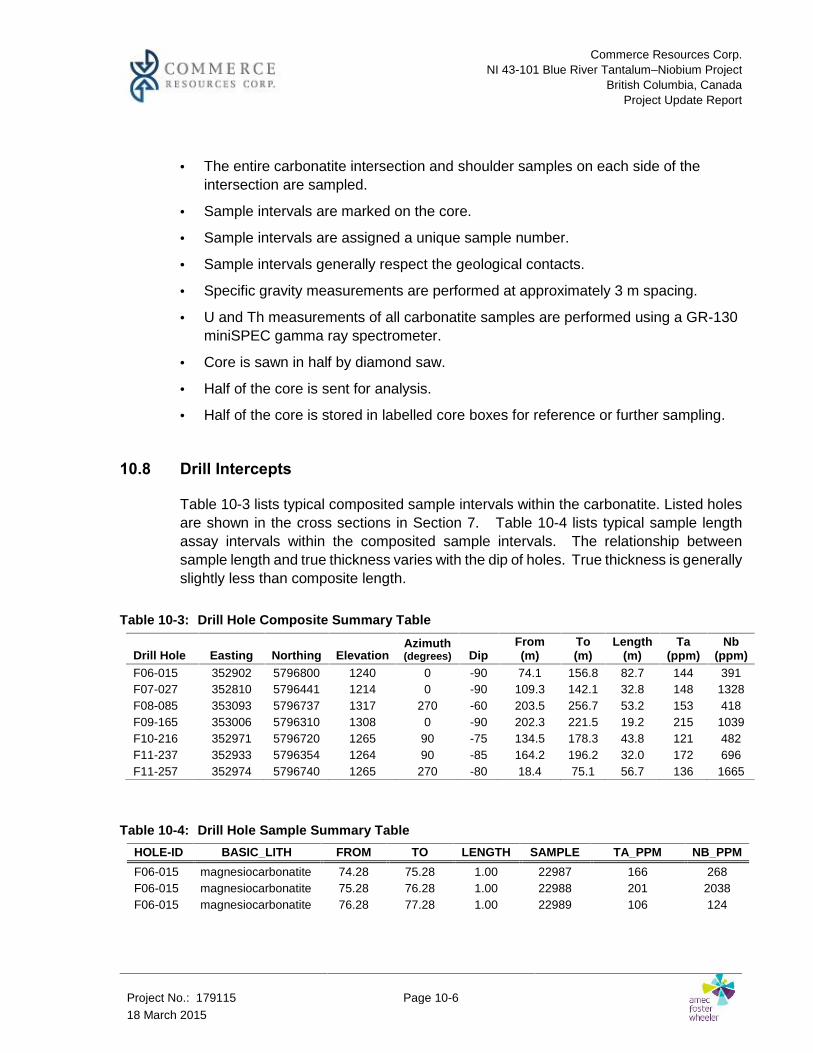
Commerce Resources Corp.NI 43-101 Blue River Tantalum–Niobium Project
British Columbia, CanadaProject Update Report
Project No.: 179115 Page 10-618 March 2015
The entire carbonatite intersection and shoulder samples on each side of theintersection are sampled.
Sample intervals are marked on the core.
Sample intervals are assigned a unique sample number.
Sample intervals generally respect the geological contacts.
Specific gravity measurements are performed at approximately 3 m spacing.
U and Th measurements of all carbonatite samples are performed using a GR-130miniSPEC gamma ray spectrometer.
Core is sawn in half by diamond saw.
Half of the core is sent for analysis.
Half of the core is stored in labelled core boxes for reference or further sampling.
10.8 Drill Intercepts
Table 10-3 lists typical composited sample intervals within the carbonatite. Listed holesare shown in the cross sections in Section 7. Table 10-4 lists typical sample lengthassay intervals within the composited sample intervals. The relationship betweensample length and true thickness varies with the dip of holes. True thickness is generallyslightly less than composite length.
Table 10-3: Drill Hole Composite Summary Table
Drill Hole Easting Northing ElevationAzimuth(degrees) Dip
From(m)
To(m)
Length(m)
Ta(ppm)
Nb(ppm)
F06-015 352902 5796800 1240 0 -90 74.1 156.8 82.7 144 391F07-027 352810 5796441 1214 0 -90 109.3 142.1 32.8 148 1328F08-085 353093 5796737 1317 270 -60 203.5 256.7 53.2 153 418F09-165 353006 5796310 1308 0 -90 202.3 221.5 19.2 215 1039F10-216 352971 5796720 1265 90 -75 134.5 178.3 43.8 121 482F11-237 352933 5796354 1264 90 -85 164.2 196.2 32.0 172 696F11-257 352974 5796740 1265 270 -80 18.4 75.1 56.7 136 1665
Table 10-4: Drill Hole Sample Summary TableHOLE-ID BASIC_LITH FROM TO LENGTH SAMPLE TA_PPM NB_PPMF06-015 magnesiocarbonatite 74.28 75.28 1.00 22987 166 268F06-015 magnesiocarbonatite 75.28 76.28 1.00 22988 201 2038F06-015 magnesiocarbonatite 76.28 77.28 1.00 22989 106 124
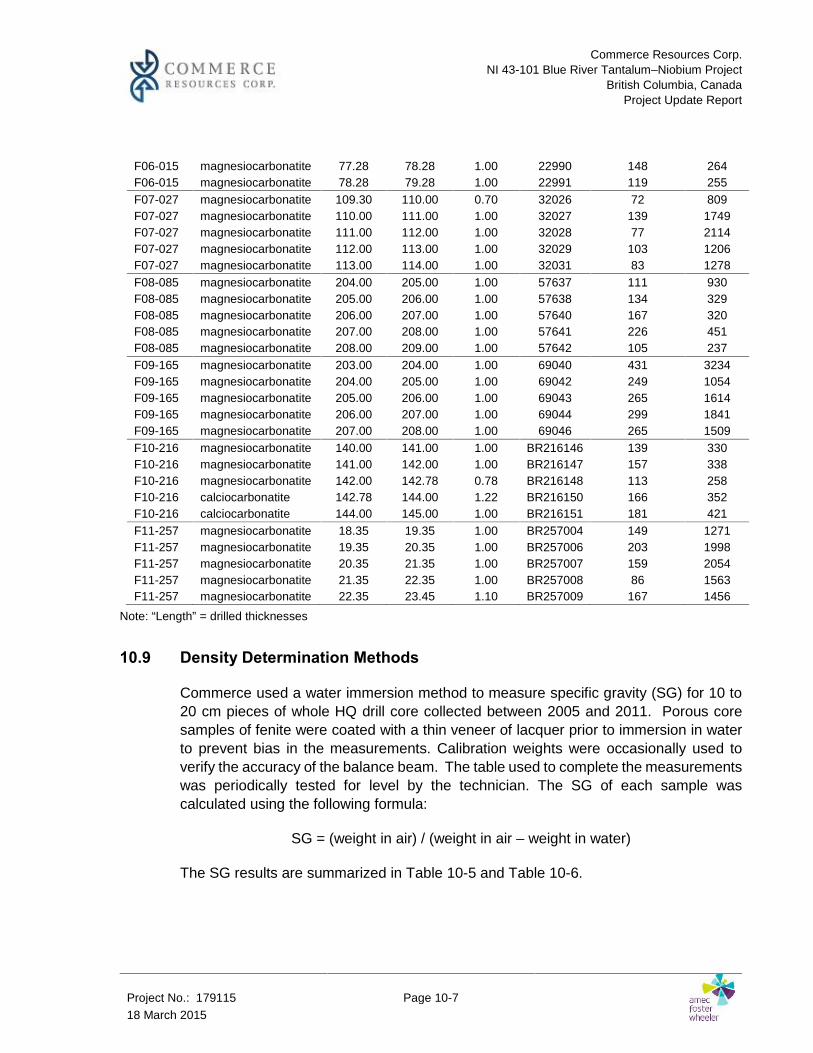
Commerce Resources Corp.NI 43-101 Blue River Tantalum–Niobium Project
British Columbia, CanadaProject Update Report
Project No.: 179115 Page 10-718 March 2015
F06-015 magnesiocarbonatite 77.28 78.28 1.00 22990 148 264F06-015 magnesiocarbonatite 78.28 79.28 1.00 22991 119 255F07-027 magnesiocarbonatite 109.30 110.00 0.70 32026 72 809F07-027 magnesiocarbonatite 110.00 111.00 1.00 32027 139 1749F07-027 magnesiocarbonatite 111.00 112.00 1.00 32028 77 2114F07-027 magnesiocarbonatite 112.00 113.00 1.00 32029 103 1206F07-027 magnesiocarbonatite 113.00 114.00 1.00 32031 83 1278F08-085 magnesiocarbonatite 204.00 205.00 1.00 57637 111 930F08-085 magnesiocarbonatite 205.00 206.00 1.00 57638 134 329F08-085 magnesiocarbonatite 206.00 207.00 1.00 57640 167 320F08-085 magnesiocarbonatite 207.00 208.00 1.00 57641 226 451F08-085 magnesiocarbonatite 208.00 209.00 1.00 57642 105 237F09-165 magnesiocarbonatite 203.00 204.00 1.00 69040 431 3234F09-165 magnesiocarbonatite 204.00 205.00 1.00 69042 249 1054F09-165 magnesiocarbonatite 205.00 206.00 1.00 69043 265 1614F09-165 magnesiocarbonatite 206.00 207.00 1.00 69044 299 1841F09-165 magnesiocarbonatite 207.00 208.00 1.00 69046 265 1509F10-216 magnesiocarbonatite 140.00 141.00 1.00 BR216146 139 330F10-216 magnesiocarbonatite 141.00 142.00 1.00 BR216147 157 338F10-216 magnesiocarbonatite 142.00 142.78 0.78 BR216148 113 258F10-216 calciocarbonatite 142.78 144.00 1.22 BR216150 166 352F10-216 calciocarbonatite 144.00 145.00 1.00 BR216151 181 421F11-257 magnesiocarbonatite 18.35 19.35 1.00 BR257004 149 1271F11-257 magnesiocarbonatite 19.35 20.35 1.00 BR257006 203 1998F11-257 magnesiocarbonatite 20.35 21.35 1.00 BR257007 159 2054F11-257 magnesiocarbonatite 21.35 22.35 1.00 BR257008 86 1563F11-257 magnesiocarbonatite 22.35 23.45 1.10 BR257009 167 1456
Note: “Length” = drilled thicknesses
10.9 Density Determination Methods
Commerce used a water immersion method to measure specific gravity (SG) for 10 to20 cm pieces of whole HQ drill core collected between 2005 and 2011. Porous coresamples of fenite were coated with a thin veneer of lacquer prior to immersion in waterto prevent bias in the measurements. Calibration weights were occasionally used toverify the accuracy of the balance beam. The table used to complete the measurementswas periodically tested for level by the technician. The SG of each sample wascalculated using the following formula:
SG = (weight in air) / (weight in air – weight in water)
The SG results are summarized in Table 10-5 and Table 10-6.

Commerce Resources Corp.NI 43-101 Blue River Tantalum–Niobium Project
British Columbia, CanadaProject Update Report
Project No.: 179115 Page 10-818 March 2015
Table 10-5: 2005 – 2011 Specific Gravity Measurements by Campaign
YearNo. of
SamplesPercent of Total
Samples
2005 10 0.3%2006 45 1.3%2007 97 2.9%2008 214 6.4%2009 51 1.5%2010 1,502 45.0%2011 1,421 42.5%Total 3,340 100.0%
Table 10-6: 2005 – 2011 Specific Gravity Statistics
Rock Type Rock CodeSamples
CountTotal
Length Min Max Median
Mean(length
weighted)
Carbonatite 100 1,644 350.00 2.61 3.98 2.97 2.97Fenite 200 140 28.42 2.72 3.09 2.96 2.96Skarn 250 90 16.75 2.63 3.24 3.04 3.03Amphibolite 300 325 68.20 2.44 3.36 3.02 3.02Pegmatite 400 76 14.89 2.54 2.95 2.62 2.63Gneiss 500 970 196.86 2.17 3.91 2.80 2.81Mylonite 700 2 0.44 2.67 2.75 2.71 2.71Ultramafic 800 19 3.57 2.81 3.21 3.04 3.04Schist 900 60 11.53 2.42 3.09 2.83 2.85Quartzite qzte 14 3.18 2.58 3.08 2.63 2.66
Total 3,340 693.84 2.47 3.80 2.92 2.92
One-hundred nine samples of drill core from the 2005 to 2009 drill campaigns weresubmitted as check samples to Metsolve for SG determinations by wax coat preparationfollowed by the water immersion method. The check values compared well to the waterimmersion field measurements collected by Commerce.
Fifty-five samples of drill core from the 2011 drill campaign were submitted as checksamples to PRA laboratory at Richmond, B.C. for SG determinations by the waximmersion method. These checks also compared well with the water immersion fieldmeasurements collected by Commerce.

Commerce Resources Corp.NI 43-101 Blue River Tantalum–Niobium Project
British Columbia, CanadaProject Update Report
Project No.: 179115 Page 10-918 March 2015
10.10 Metallurgical Sampling Methods
Commerce collected metallurgical samples from bulk sample material originating fromBS-2 (approximately 173 t) during January 2009 and from BS-1 (approximately 6 t)during November 2009. BS-2 samples were ferrocolumbite dominant and selected torepresent the average Ta and Nb grades for the carbonatite. BS-1 samples wereselected to reflect pyrochlore dominant mineralization.
Fraser Pacific Enterprises, Abbottsford B.C., crushed the two bulk samples to a particlesize of <1 inch diameter. After crushing, each group of samples was homogenizedseparately by a standard coning and quartering procedure. The blended samples werebagged into one tonne bags and put into storage. One tonne of each sample wasdelivered to Met-Solve Laboratories (Metsolve) in Burnaby in B.C. to air dry and furtherreduce the size to -10 mesh for bench testing.
10.11 QP Comment
Commerce has used generally accepted drilling procedures for delineating the UpperFir and Bone Creek deposits. These procedures have allowed for collection ofreasonably accurate sample locations, good core recovery, and good geological andgeotechnical information. Drill-hole orientation and spacing is sufficient to allowreasonable interpretation of the geometry and variability of the Upper Fir and BoneCreek carbonatites. Amec Foster Wheeler is not aware of any factors related tocollection of the drill-hole data that could materially affect mineral resource estimation.

Commerce Resources Corp.NI 43-101 Blue River Tantalum–Niobium Project
British Columbia, CanadaProject Update Report
Project No.: 179115 Page 11-118 March 2015
11.0 SAMPLE PREPARATION, ANALYSES, AND SECURITY
Acme Analytical Laboratories (Acme) in Vancouver was the primary laboratory forsample preparation of the 2005 to 2008 drill core samples. PRA/InspectorateLaboratories (Inspectorate) in Richmond, B.C., was the primary laboratory for samplepreparation of the 2009 to 2011 drill core samples. Acme was the primary laboratory forsample analysis since 2005 up to and including 2011 drill core samples. GlobalDiscovery Laboratory in Vancouver, (later purchased by Acme Laboratories) andH.C.Starck in Goslar, Germany were the secondary laboratories.
Acme is an independent mineral testing laboratory which, in 1996, became the firstcommercial geochemical analysis and assaying laboratory in North America registeredunder ISO 9001. Acme regularly participates in proficiency testing and in October 2011the Vancouver laboratory received formal approval of its ISO/IEC 17025:2005accreditation from the Standards Council of Canada for Au by fire assay.
Inspectorate is an independent mineral testing laboratory that reportedly works tointernationally-recognized standards such as ISO and ASTM. The Vancouverlaboratory received ISO9001:2000 accreditation in 2006 and 2009 and participates inproficiency testing programs.
Global Discovery Laboratory was an independent facility specialized in X-rayFluorescence, X-ray Diffraction, and Scanning Electron Microscopy prior to beingpurchased by Acme in 2009. Their accreditation at the time used is unknown.
The H.C. Starck is an independent laboratory providing commercial services. Thelaboratory accreditation standing is unknown but Starck is a leading premium supplierof the technology metals tungsten, molybdenum, tantalum, niobium, and rhenium,high-performance ceramics, and thermal spray powders.
Met-Solve Laboratory (Met-Solve) in Burnaby, B.C., Canada was the metallurgicallaboratory for testwork completed between 2009 and 2011. Acme Metallurgical Ltd.(AcmeMet), in Vancouver, B.C., Canada was the metallurgical laboratory for testworkcompleted in 2012 and 2013. Met-Solve and AcmeMet are commercial mineral andmetallurgical testing facilities that are independent of Commerce, and specialize inmineral beneficiation and hydrometallurgical testwork.
11.1 Sample Preparation
Between 2005 and 2008 sawn core samples were shipped to Acme where the entiresample was crushed in a jaw crusher to 70% passing -10 mesh (2 mm) from which a
Commerce Resources Corp.NI 43-101 Blue River Tantalum–Niobium Project
British Columbia, CanadaProject Update Report
Project No.: 179115 Page 11-218 March 2015
250 g riffle split sample was pulverized in a ring-and-puck mill to 85% passing 200 mesh(75 µm).
Sawn core samples from the 2009 to 2011 drill programs were shipped to Inspectoratewhere the entire sample was crushed to 80% passing 10 mesh and a 300 g split of thecrushed material was pulverized to 100% passing 200 mesh. In 2011, pulverization wasto 95% passing 200 mesh.
11.2 Sample Analyses
Between 2005 and 2011 all drill core samples were analyzed at Acme for 31 elementsincluding Ta and Nb by inductively coupled plasma mass spectrometry (ICP-MS)following a lithium metaborate/tetraborate fusion of a 0.2 g sample followed by dilutenitric acid digestion of the fused pellet.
Starting in 2007, in addition to the 31 element ICP-MS analysis, 11 major oxides and Niand Sc were analyzed by inductively coupled plasma emission spectrometry (ICP-ES)following a lithium metaborate/tetraborate fusion of a 0.2 g sample followed by dilutenitric acid digestion of the fused pellet. Starting in 2008, samples were also analysedfor 14 base and precious metal related elements by ICP-MS following hot Aqua Regiadigestion of a 0.5 g sample and for carbon and sulphur by LECO methods. Starting in2009 samples were also analyzed for Ta and Nb by X-ray fluorescence analysisfollowing a lithium metaborate fusion of a 2.0 g sample (XRF(F)).
All samples collected between 2005 and 2011 were analysed for Ta and Nb by ICP-MSwith detection limits reported at 0.1 ppm; all samples collected since 2009 were analysedalso for Ta and Nb by XRF(F) with detection limits reported at 5 to 10 ppm.
11.2.1 Quality Control
The quality control program used by Commerce to monitor assays results from the BlueRiver project is described in detail in previous Technical Reports.
Assessing the accuracy of Ta and Nb results presents challenges not encountered withother commonly analysed metals. Some host minerals of these elements may beresistant to strong acid dissolution and/or form unstable solutions in dilute acid take-upafter dissolution, which may impact ICP-MS results. XRF(F) determinations may beimpacted by background corrections that impact instrument calibration, particularly atlow concentrations or short counting times. Unlike base and precious metal assayswhich have a wide selection of certified reference materials (CRMs) to supportassociated round robins and proficiency assessment programs, there is a lack ofcommercially available Ta and Nb CRMs. Without such feedback and control

Commerce Resources Corp.NI 43-101 Blue River Tantalum–Niobium Project
British Columbia, CanadaProject Update Report
Project No.: 179115 Page 11-318 March 2015
mechanisms, assay laboratories can be expected to show poorer agreement for the lesscommonly analysed element such as Ta and Nb.
Quality control procedures used by Commerce to monitor Blue River assay resultsevolved over the life of the project. Between 2005 and 2007 Commerce inserted veryfew blank, duplicate, or standard reference material (SRM) control samples. In 2008the control sample insertion frequency was increased to an average of 3% for each ofblanks, quarter core field duplicates, and SRM control samples. In 2009 control sampleinsertion rates were increased to an average of 5% per control sample type and pulpduplicates were added. Similar control sample insertion rates were used for analysis of2010 and 2011 drill core samples. Between-laboratory bias was assessed using checksamples.
Assessment of Precision
The absolute relative difference between duplicate pair results was used to assessassay precision. Pulp, coarse reject, and field (¼ core) duplicate pairs were used toassess the impact of the various sample preparation stages on assay precision. Targetprecision thresholds are:
90% of pulp duplicate pairs having absolute relative differences <10% 90% of coarse reject duplicate pairs having absolute relative differences <20% 90% of field duplicate pairs having absolute relative differences <30%
Precision results summarized in Table 11-1 indicate:
The 2010 and 2011 Ta and Nb XRF(F) assay results have acceptable precision. The 2009 Nb XRF(F) assay results have acceptable precision. The 2009 Ta XRF(F) assay results have poor precision. The 2005 to 2008 ICP-MS precision is acceptable but assessment is limited to only
field duplicates.
A 50 ppm Ta and Nb cut-off was used in this assessment due to poor precision returnedfor results below this grade threshold. Pulp and coarse reject results achieved, or verynearly achieved, targeted thresholds. Field duplicate results were generally below thetargeted threshold but within an acceptable range. The 2009 assays represent only 5%of the total assay database, mitigating concerns of poor pulp precision returned for thissubset of assays.

Commerce Resources Corp.NI 43-101 Blue River Tantalum–Niobium Project
British Columbia, CanadaProject Update Report
Project No.: 179115 Page 11-418 March 2015
Table 11-1: 2005-2010 Duplicate Precision SummaryPulp Duplicates
Cumulative Frequencyat 10% ARD
(50 ppm cut-off)
Coarse RejectDuplicates CumulativeFrequency at 20% ARD
(50 ppm cut-off)
Field DuplicatesCumulative Frequency
at 30% ARD(50 ppm cut-off)
2005-2008 Ta ICP-MS - - 81%2005-2008 Nb ICP-MS - - 78%2009 Ta XRF(F) 33% - 73%2009 Nb XRF(F) 91% - 85%2010 Ta XRF(F) 87% 87% 77%2010 Nb XRF(F) 96% 93% 81%2010 Ta ICP-MS 87% 85% 81%2010 Nb ICP-MS 89% 88% 84%2011 Ta XRF(F) 94% 85% 78%2011 Nb XRF(F) 100% 86% 74%2011 Ta ICP-MS 81% 78% 78%2011 Nb ICP-MS 80% 82% 75%
Note: precision below 50 ppm Ta and Nb was poor
Assessment of Accuracy
Accuracy was assessed using the relative difference between Standard ReferenceMaterial (SRM) expected values and values received through batch analyses. Typicaltarget accuracy thresholds are:
<± 5% of the expected value – acceptable ± 5% - 10% of the expected value – marginal > 10% of the expected value – unacceptable
Commerce prepared the SRMs used for assessing assay accuracy. The quality of theBlue River SRM control samples were reviewed previously in two internal memos(AMEC 2010a, AMEC 2012a). These reviews concluded that expected values for BlueRiver SRMs have relatively wide 95% confidence intervals (CI). The 95% CI provides ameasure of the uncertainty of the expected value. For Ta the 95% CI ranged from 6%to 24% of the expected value; For Nb the CI ranged from 3% to 12%. Goodcommercially available CRMs typically have 95% CI ranging from 1% to 3% of theexpected value. The wider CIs returned for the Commerce SRMs may reflect the pooreragreement expected between laboratories for the less commonly analysed elementsuch as Ta and Nb.
The 2011 assay accuracy results are summarized in Table 11-2 and Table 11-3. Targetaccuracy thresholds were not achieved for several of the Ta and Nb XRF(F) and ICP-

Commerce Resources Corp.NI 43-101 Blue River Tantalum–Niobium Project
British Columbia, CanadaProject Update Report
Project No.: 179115 Page 11-518 March 2015
MS results. The uncertainty in the expected value of the SRMs limits the ability to assessaccuracy in a typical manner. When the uncertainty in the SRM expected values areconsidered, no unacceptable biases are observed for Ta and Nb XRF(F) results. Whenthe Ta and Nb XRF(F) results are considered globally (weighted average) nounacceptable biases are observed. Unacceptable low biases are evident for Ta and NbICP MS results in all cases.
Control check samples sent to the Starck Laboratory included Blue River SRMs. Thenumber of SRM analyses at the Starck lab is small limiting the ability to interpret theresults but in general the results indicate acceptable bias was achieved if 95% CI orglobal averages are considered.
The 2010 SRM results were similar to 2011. The 2009 SRM results indicate there is anunacceptable low bias for Ta results greater than 150 ppm and an acceptable bias forNb results. A single SRM was used to monitor the 2005 to 2008 results. Results indicatean acceptable level of accuracy was achieved.
These results indicate:
The 2010 and 2011 Ta and Nb XRF(F) are reasonably accurate. The 2009 Nb XRF(F) results are reasonably accurate. The 2009 Ta XRF(F) results are marginally accurate. The 2005 to 2008 ICP-MS results are reasonably accurate.
The conclusion of reasonable accuracy for XRF(F) results is considered in context ofthe quality of the SRMs where expected values are not known with typically expectedconfidence. Marginally acceptable biases could be hidden in the relatively wide 95%confidence intervals but have not been observed.

Commerce Resources Corp.NI 43-101 Blue River Tantalum–Niobium Project
British Columbia, CanadaProject Update Report
Project No.: 179115 Page 11-618 March 2015
Table 11-2: 2011 Blue River SRM Ta Control Chart Summary
LabStandardSample
AssayType
BestValue 95% CI 95%CI/BV
MeanValue Bias
Number ofSamples
Acme Uf-STD-03 XRF(F) 74 ±18 24% 75 1.1% 18Acme Uf-STD-04 XRF(F) 122 ±17 14% 133 9.2% 20Acme Uf-STD-06 XRF(F) 172 ±20 12% 173 0.6% 5Acme Uf-STD-07 XRF(F) 179 ±17 10% 176 -1.2% 17Acme Uf-STD-08 XRF(F) 175 ±11 6% 159 -9.2% 6Acme Uf-STD-09 XRF(F) 193 ±15 8% 171 -11.4% 17Acme Uf-STD-10 XRF(F) 221 ±14 7% 201 -9.2% 15Acme Uf-STD-12 XRF(F) 241 ±17 7% 232 -3.6% 14Acme Uf-STD-13 XRF(F) 280 ±28 10% 283 1.0% 10Acme Uf-STD-14 XRF(F) 256 ±20 8% 231 -9.8% 16Acme Uf-STD-15 XRF(F) 377 ±31 8% 373 -1.1% 11
Average bias weighted by number of samples -3.8%
Acme Uf-STD-03 ICP-MS 74 ±18 24% 57 -22.9% 18Acme Uf-STD-04 ICP-MS 122 ±17 14% 91 -25.1% 20Acme Uf-STD-06 ICP-MS 172 ±20 12% 116 -32.9% 5Acme Uf-STD-07 ICP-MS 179 ±17 10% 138 -23.0% 17Acme Uf-STD-08 ICP-MS 175 ±11 6% 170 -2.6% 6Acme Uf-STD-09 ICP-MS 193 ±15 8% 187 -2.9% 17Acme Uf-STD-10 ICP-MS 221 ±14 7% 189 -14.3% 15Acme Uf-STD-12 ICP-MS 241 ±17 7% 195 -18.9% 14Acme Uf-STD-13 ICP-MS 280 ±28 10% 212 -24.5% 10Acme Uf-STD-14 ICP-MS 256 ±20 8% 242 -5.5% 16Acme Uf-STD-15 ICP-MS 377 ±31 8% 260 -31.2% 11
Average bias weighted by number of samples -18.0%
STARK Uf-STD-03 ICPAES 74 ±18 24% 69 -6.1% 3STARK Uf-STD-04 ICPAES 122 ±17 14% 152 25.0% 1STARK Uf-STD-06 ICPAES 172 ±20 12% 142 -17.7% 2STARK Uf-STD-07 ICPAES 179 ±17 10% 196 10.6% 2STARK Uf-STD-08 ICPAES 175 ±11 6% 185 5.7% 1STARK Uf-STD-09 ICPAES 193 ±15 8% 220 14.0% 4STARK Uf-STD-10 ICPAES 221 ±14 7% 213 -3.5% 4STARK Uf-STD-12 ICPAES 241 ±17 7% 225 -6.7% 3STARK Uf-STD-13 ICPAES 280 ±28 10% 283 0.9% 3STARK Uf-STD-14 ICPAES 256 ±20 8% 254 -7.0% 4STARK Uf-STD-15 ICPAES 377 ±31 8% 396 4.9% 2
Average bias weighted by number of samples 1.1%

Commerce Resources Corp.NI 43-101 Blue River Tantalum–Niobium Project
British Columbia, CanadaProject Update Report
Project No.: 179115 Page 11-718 March 2015
Table 11-3: 2011 Blue River SRM Nb Control Chart Summary
LabStandardSample
AssayType
BestValue 95% CI 95%C/BV
MeanValue Bias
Number ofSamples
Acme Uf-STD-03 XRF(F) 3048 ±83 3% 3105 1.8% 18Acme Uf-STD-04 XRF(F) 3907 ±117 3% 4015 2.8% 20Acme Uf-STD-06 XRF(F) 2297 ±86 4% 2312 0.7% 5Acme Uf-STD-07 XRF(F) 1753 ±72 4% 1822 3.9% 17Acme Uf-STD-08 XRF(F) 244 ±29 12% 253 3.5% 6Acme Uf-STD-09 XRF(F) 313 ±29 9% 332 6.1% 17Acme Uf-STD-10 XRF(F) 956 ±92 10% 952 -0.4% 15Acme Uf-STD-12 XRF(F) 1478 ±85 6% 1546 4.6% 14Acme Uf-STD-13 XRF(F) 1744 ±74 4% 1837 5.5% 10Acme Uf-STD-14 XRF(F) 282 ±35 12% 294 4.3% 16Acme Uf-STD-15 XRF(F) 2524 ±95 4% 2586 2.4% 11
Average bias weighted by number of samples 2.8%
Acme Uf-STD-03 ICP-MS 3048 ±83 3% 2831 -7.1% 18Acme Uf-STD-04 ICP-MS 3907 ±117 3% 3437 -12.0% 20Acme Uf-STD-06 ICP-MS 2297 ±86 4% 2135 -7.1% 5Acme Uf-STD-07 ICP-MS 1753 ±72 4% 1646 -6.1% 17Acme Uf-STD-08 ICP-MS 244 ±29 12% 242 -0.7% 6Acme Uf-STD-09 ICP-MS 313 ±29 9% 330 5.4% 17Acme Uf-STD-10 ICP-MS 956 ±92 10% 922 -3.6% 15Acme Uf-STD-12 ICP-MS 1478 ±85 6% 1434 -3.0% 14Acme Uf-STD-13 ICP-MS 1744 ±74 4% 1671 -4.1% 10Acme Uf-STD-14 ICP-MS 282 ±35 12% 284 0.7% 16Acme Uf-STD-15 ICP-MS 2524 ±95 4% 2218 -12.1% 11
Average bias weighted by number of samples -7.8%
STARK Uf-STD-03 ICPAES 3048 ±83 3% 2454 -19.5% 3STARK Uf-STD-04 ICPAES 3907 ±117 3% 4623 18.3% 1STARK Uf-STD-06 ICPAES 2297 ±86 4% 1874 -18.4% 2STARK Uf-STD-07 ICPAES 1753 ±72 4% 1893 8.0% 2STARK Uf-STD-08 ICPAES 244 ±29 12% 264 8.2% 1STARK Uf-STD-09 ICPAES 313 ±29 9% 379 21.2% 4STARK Uf-STD-10 ICPAES 956 ±92 10% 993 3.8% 4STARK Uf-STD-12 ICPAES 1478 ±85 6% 1493 1.0% 3STARK Uf-STD-13 ICPAES 1744 ±74 4% 1796 3.0% 3STARK Uf-STD-14 ICPAES 282 ±35 12% 293 4.1% 4STARK Uf-STD-15 ICPAES 2524 ±95 4% 2608 3.3% 2
Average bias weighted by number of samples -1.9%

Commerce Resources Corp.NI 43-101 Blue River Tantalum–Niobium Project
British Columbia, CanadaProject Update Report
Project No.: 179115 Page 11-818 March 2015
Assessment of Laboratory Bias
Pulp check samples were used to assess laboratory bias. Results were assessed usingReduced Major Axis (RMA) regression charts. The relative difference between anexpected slope of 1 and the slope of the RMA regression line was used to quantify bias.Typical target bias thresholds are:
<± 5% - acceptable
± 5 - 10% - marginal
>10% - unacceptable
The 2011 check sample results are summarised in Table 11-4 and include a between-laboratory bias check and between-assay method bias check. Between-laboratorycheck compares Acme XRF(F) results with Stark ICP-AES results. Between-assaymethod compares Acme XRF(F) results with Acme ICP-MS results.
Table 11-4: Summary of 2011 Bias Assessed Through RMA Charts
RMA RegressionTa
BiasNo. of
ExclusionsNb
BiasNo. of
Exclusions
ICP-AES vs XRF(F) 0% 11 -6% 10ICP-MS vs XRF(F) 6% 65 14% 25ICP-MS vs XRF(F)* 5% 10ICP-MS vs XRF(F)** 33% 12
Note:*paired mean grade <= 1,500 ppm Nb; ** Paired mean grade > 1,500 ppm Nb; Exclusions representoutliers in the paired data that are excluded before calculating the bias.
An acceptable level of between-assay method and between-lab bias is achieved for the2011 drill core Ta XRF(F) assay results across all grades and for Nb XRF(F) assayresults less than 1,500 ppm Nb. The Acme ICP-MS method appears to underestimateNb grades greater than 1,500 ppm and periodically underestimate Ta grades across theentire grade range. This is supported with SRM results where high grade Acme NbXRF(F) SRM results show no significant bias while high grade Acme Nb ICP-MS resultsshow significant low bias. Round Robin results show the high grade Nb SRMs have asmallest 95% confidence interval lending support for the accuracy of the high grade NbXRF(F) results.
Laboratory bias for 2005 to 2010 is summarized in Table 11-5. A general improvementin agreement between laboratories for Ta and Nb from 2005 to 2010 is evident.

Commerce Resources Corp.NI 43-101 Blue River Tantalum–Niobium Project
British Columbia, CanadaProject Update Report
Project No.: 179115 Page 11-918 March 2015
Table 11-5: 2005 to 2011 Between-Laboratory Bias
Year Ta Bias (%) Nb Bias (%)Check
Laboratory
2005 -43.6 11.6 GDL2006 -1.9 - Becquerel2007 -6.6 36.8 ActLabs2007 -0.6 22.0 ALS2008 -3.4 -9.4 GDL2008 4.0 5.0 Acme2009 -0.2 2.6 Starck2010 -5.0 -1.0 Starck
Assessment of Contamination
Contamination was assessed using Blank control samples. Blank results were assessedrelative to a practical detection limit and an assumed 50 ppm Ta and Nb economic cut-off grade. A significant number of Blank results are greater than the detection limit butall were well below 50 ppm Ta or Nb. These results indicate the 2011 drill core assayresults are free of any systematic contamination that could impact the mineral resourceestimate. However, there is indication of periodic minor contamination. Assays from2005 to 2010 showed similar results.
11.3 Sample Security
Commerce geologists and technicians log and sample the drill core. Samples areplaced in pails and stored in a locked Quonset hut for security prior to shipping.A commercial delivery service, Monashee Painting and Services of Blue River, B.C.,transports the samples, to the preparation laboratory in Richmond, B.C. Sample sheetmanifests are submitted with the core samples. The manifests include information onthe operator, sample preparation laboratory, and a sample list. Sample rejects returnedfrom the laboratory are stored in the onsite Quonset hut.
All core is archived at the fenced cold storage facility at the Valemount, B.C. (Figure11-1). Exploration holes from other parts of the property are stored in the fenced yardoutside the cold storage building, as are palletted pails of rejects. The pulps are storedin a locked building in the Blue River yard. There are six holes stored in locked coreracks as a core library in the Blue River yard.

Commerce Resources Corp.NI 43-101 Blue River Tantalum–Niobium Project
British Columbia, CanadaProject Update Report
Project No.: 179115 Page 11-1018 March 2015
Figure 11-1: Valemount Core Storage Facility
11.4 QP Comments
The sample preparation procedures are consistent with industry standards. The qualitycontrol sample insertion rates for duplicates, standards, checks and blanks areconsistent with industry standards and provide sufficient information to assess precision,accuracy and contamination.
The XRF(F) sample analysis procedures used for 2009 and 2011 drill core provideadequate confidence to support mineral resource estimation. No grade biases wereobserved but the quality of the SRM limits the ability to confirm that a grade bias doesnot exist.
Problems with the ICP-MS procedures are apparent which suggests poor precision andperiodic significant underestimation of Ta and Nb grades occurs. The ICP-MS sampleanalysis procedures used for the 2005 to 2008 drill core analysis provide adequateconfidence to support mineral resource estimation but should only be used to supportIndicated classification confidence.
The sample security is consistent with industry practice and provides sufficientconfidence on the reliability of the results.

Commerce Resources Corp.NI 43-101 Blue River Tantalum–Niobium Project
British Columbia, CanadaProject Update Report
Project No.: 179115 Page 12-118 March 2015
12.0 DATA VERIFICATION
Amec Foster Wheeler completed a database verification check and concluded the collarcoordinates, down-hole surveys, lithologies, assay, and specific gravity databases arereasonably free of errors. Verification included site visits, checks for databasetranscription errors, re-calculation of specific gravity, rock quality designation, and totalcore recovery using original records. Down-hole survey data quality was checked forproper magnetic declination adjustments and for local excessive drill-hole deviation thatcould result in kinks in the drill traces.
12.1 Site Visits
Ms Jenna Hardy has visited the Blue River property numerous times since 2007,supervising field exploration, diamond drilling and other technical and environmentalstudies on the project, While at site she reviewed geology and mineralogy, drill holecollar locations, procedures for diamond drilling, down hole geophysics, core logging,sampling, documentation, sample storage and shipment of analytical samples, andinspecting outcrops, bulk sample pits and diamond drill core. Her most recent site visitswere: May 23rd 2012, 9th-10th of July 2012 and the 17-18th of July 2012
Mr. Greg Kulla, has not visited the Blue River property.
12.2 Databases
Collar, down-hole survey, geology, specific gravity and assays are stored in a CenturySystems Technologies Inc. Fusion data management system. Assay data are receivedfrom the laboratories via comma-separated value (CSV) data files. Collected data aresubjected to validation prior to upload into the database using built-in program triggersthat automatically check the data. Verification checks include collar co-ordinates,surveys, lithology, and assay data. Data are exported to a GEMS™, database for modelbuilding and estimation. Visual checks are completed to ensure that data placementwas correct within the various database fields.
12.2.1 Database Transcription Error Checks
Amec Foster Wheeler completed database transcription error checks in 2010, 2011, and2012. Drill-hole database collar, down-hole survey, RQD, recovery, lithology, specificgravity, and assay database records compare reasonably well with original supportingdocuments.

Commerce Resources Corp.NI 43-101 Blue River Tantalum–Niobium Project
British Columbia, CanadaProject Update Report
Project No.: 179115 Page 12-218 March 2015
12.2.2 Drill Collar Location Check
Amec Foster Wheeler relocated 34 drill collars from the 2005 – 2011 drill campaignsusing a hand-held Garmin GPS Map 60 CSX unit. All holes checked were within ±8 mof the database results and most were within ±3 m. These results are within the generalaccuracy expected from the hand-held GPS unit.
12.2.3 Down-hole Survey Check
Amec Foster Wheeler checked all down-hole survey records reported in the drill-holedatabase for anomalous records that could cause unusual kinks or bends in the drillholes. This check identified less than 1% suspect down-hole survey records. This is anacceptable level of discrepancies. Magnetic influence of azimuth readings was the mostlikely cause of a record being flagged as suspect.
12.2.4 Logging Checks
Amec Foster Wheeler inspected lithology, structure, mineralization, and core recoveryfrom 19 Upper Fir deposit drill holes. Observations from this inspection comparedreasonably well with the Commerce drill-hole database records.
12.2.5 Mineralization Grade Checks
Amec Foster Wheeler collected and submitted 59 quarter-core samples to Acme foranalysis. The Ta and Nb results of the analysis compared reasonably well, matchinginterval results reported in the Commerce drill-hole database.
12.2.6 Assay Quality Control Checks
Quality control sample result checks made by Amec Foster Wheeler is discussed inSection 11
12.3 QP Comment
The drill-hole database is sufficiently free of transcription errors, the logging informationreported in the database reasonably reflects the geology and mineralization in the UpperFir and Bone Creek carbonatites, and the assay sample results are reasonably free ofbiases. The database is considered suitable to support mineral resource estimation.

Commerce Resources Corp.NI 43-101 Blue River Tantalum–Niobium Project
British Columbia, CanadaProject Update Report
Project No.: 179115 Page 13-118 March 2015
13.0 MINERAL PROCESSING AND METALLURGICAL TESTING
Testwork to develop a process flowsheet and address deposit variability for the BlueRiver Project began in 2009 and continued into 2013. The process developmenttestwork was based on material produced from two bulk samples, BS-2F and BS–2Gwhile the variability work took place on 36 samples from 5 domains selected byCommerce to represent the variability of the mineralogy within the Upper Fir deposit.Mineralogical analysis was performed to obtain knowledge regarding the occurrence ofthe Ta and Nb within the material. Given the complexities with assaying for the Ta, afair amount of effort also went into developing the appropriate routine for the assayingof samples.
The process development work took place between 2009 and 2012 in three phases:
Phase I – concentrated on the recovery of the Ta and Nb bearing minerals bygravity, although grinding and mineralogical investigations were also performed.
Phase II – concentrated on the recovery and upgrading of the Ta and Nb mineralsby flotation.
Phase III – continued optimization of the process flowsheet at the laboratory scalefor the production of a Ta and Nb mineral concentrate.
A large amount of work was performed in Phase I that showed gravity could concentratethe material to a low-grade product, but that upgrading increasingly gave lower levels ofbenefit as grade was sought. Mineralogical work completed before and during thisphase of work showed that Ta was not present as tantalite but rather as content in theminerals ferrocolumbite and pyrochlore, which limits recovery by gravitational separationdue to the low differential specific gravity between pyrochlore and gangue minerals.
Work in Phase II saw the use of flotation concentration technology similar to that beingused for Nb-bearing carbonatites at Iamgold’s Niobec Mine in Quebec, Canada. Therewas immediate success in the first phases of the work. Although there are severalstages to the concentration, the overall level of equipment, risk, and complexity toproduce a saleable or treatable concentrate is lower than the gravity concentration route.Process development work is continuing in this area, but for the purposes of assessingreasonable prospects of eventual economic extraction and cut-off grade determination,the process suggested by Test F81 was selected as the basis of initial concentrationdesign because recoveries were good (approx. 70% for Ta) for this type of mineralizationand because a combined grade of 10% Ta–Nb was achieved. It is expected that withfurther work, a combined grade of 30% Ta–Nb should be achievable.

Commerce Resources Corp.NI 43-101 Blue River Tantalum–Niobium Project
British Columbia, CanadaProject Update Report
Project No.: 179115 Page 13-218 March 2015
In both work phases, the emphasis of concentration techniques was to create a materialwhich would be easily upgraded by hydrometallurgical methods, pyrometallurgicalmethods, or a combination of both. These processes would permit the separation of Tafrom Nb, allowing payment for both products. To this end, an in-depth review wascompleted of those technologies for the production of high-value intermediate productsand final products. There is confidence that the concentrate could be reduced to metalby the aluminothermic process. Subsequently there would be chlorination of thegranulated metal alloy product and distillation of the anhydrous metal chloride productsto produce high purity Nb and Ta chlorides. Ta chloride is the precursor to capacitorgrade Ta powder and can be marketed as such. However, both Ta and Nb chloridescan also be hydrolyzed and calcined to generate high purity oxide products for otherapplications.
In 2011 and 2012, work has continued into Phase III which was the optimization of workconducted in Phase II. This optimization work has concentrated on de-sliming offlotation feed, rejection flotation of carbonates and pyrrhotite, and subsequent flotationof a Ta and Nb concentrate for processing through extractive metallurgy. Althoughprogress has been made in the testwork, there was no material change from the resultsindicated by the Phase I and II testwork.
Variability testwork took place in 2012 and 2013. The purpose of this work was todetermine the level of variability between different mineralogical domains.
13.1 Head Samples for Initial Testing
In 2009, two bulk samples, BS-2F and BS–2G, sourced from a small pit in the Upper Firzone, and weighing approximately 200 t in total, were contract-crushed to a particle sizeof <1 inch diameter. After crushing, each group of samples was homogenized separatelyby a standard coning and quartering procedure. The well-mixed samples were baggedinto one tonne bags and put into storage. One tonne of each sample was delivered toMet-Solve Laboratory (Met-Solve) in Burnaby B.C. to air dry and further reduce the sizeto -10 mesh for bench testing. These samples were utilized for the process developmentwork.
Met-Solve is a commercial mineral and metallurgical testing facility that is independentof Commerce, and specializes in mineral beneficiation and hydrometallurgical testwork.
The mineralogical examinations of all the bulk samples taken during the 2009exploration program are described by Chudy (2009). Additional mineralogicalexaminations were performed on some of the test products during the mineralprocessing investigations.

Commerce Resources Corp.NI 43-101 Blue River Tantalum–Niobium Project
British Columbia, CanadaProject Update Report
Project No.: 179115 Page 13-318 March 2015
The head assays, established using X-ray fluorescence (XRF) analysis, for the two bulksamples are tabulated in Table 13-1.
Table 13-1: Head Assay Grades, Bulk Samples BS-2F and BS-2GSample Ta (ppm) Nb (ppm)BS-2F 194 1,300BS -2G 114 764
13.2 Phase I Testing
13.2.1 Grinding Size
Each sample was subjected to gravity separation tests at five different grind sizes of80% passing 500 µm, 230 µm, 100 µm, 74 µm and 45 µm to determine the liberationsize using a centrifugal concentrator. A standard seven-pass procedure was used tosimulate continuous gravity concentrator action.
This work indicates that the liberation size for both samples is coarser than P80 of76 µm. The relative position of the curves (Figure 13-1 and Figure 13-2) indicates thateffective liberation for gravity is likely achievable at a grind size slightly coarser than 120µm. The results for Nb are similar.
Assaying of the individual size fractions of the tailings from the BS-2G tests indicate thatthere are still a few locked particles between 74 µm and 106 µm when ground to P80112 µm but that material coarser than 150 µm does not contain any Ta. Given thenatural size distribution obtained in grinding, this implies that effective liberation forprocessing, is about P80 of 125 µm for gravity treatment and slightly coarser for flotation(P80 up to 160 µm). These numbers are in line with independent findings from themineralogical examination of all bulk samples of the 2009 exploration program.
13.2.2 Roughing and Cleaning Gravity Concentration
With the establishment of the grind size and initial gravity results, it was decided toprogress with the gravity concentration work. The two samples were treated with acentrifugal concentrator, using 10 consecutive stages for rougher concentration followedby three cleaning stages of the combined rougher concentrates. Four different grindsizes were tested for each sample. All results were similar, with recoveries falling offquickly in cleaning and inability to raise the grades any higher than Ta 3,500 ppm (0.35%Ta). Results from sample BS-2G are shown on Figure 13-3.

Commerce Resources Corp.NI 43-101 Blue River Tantalum–Niobium Project
British Columbia, CanadaProject Update Report
Project No.: 179115 Page 13-418 March 2015
Large batch samples of 60 kg were tested using a Falcon Centrifugal GravityConcentrator in 10 consecutive stages to produce a rougher and a scavengerconcentrate at a grind size of P80 100 µm. The rougher concentrate only was screenedto produce three size fractions as follows:
+74 µm 37 to 74 µm -37 µm.
Figure 13-1: Sample BS-2F – Gravity Separation (Different Grinds)
0
10
20
30
40
50
60
70
80
90
100
0 500 1000 1500 2000
Rec
over
y (%
)
Grade Ta (ppm)
BS-2F - Gravity SeparationTantalum Grade/Recovery Curves
P80 500 um
P80 233 um
P80 112 um
P80 76 um
P80 45 um
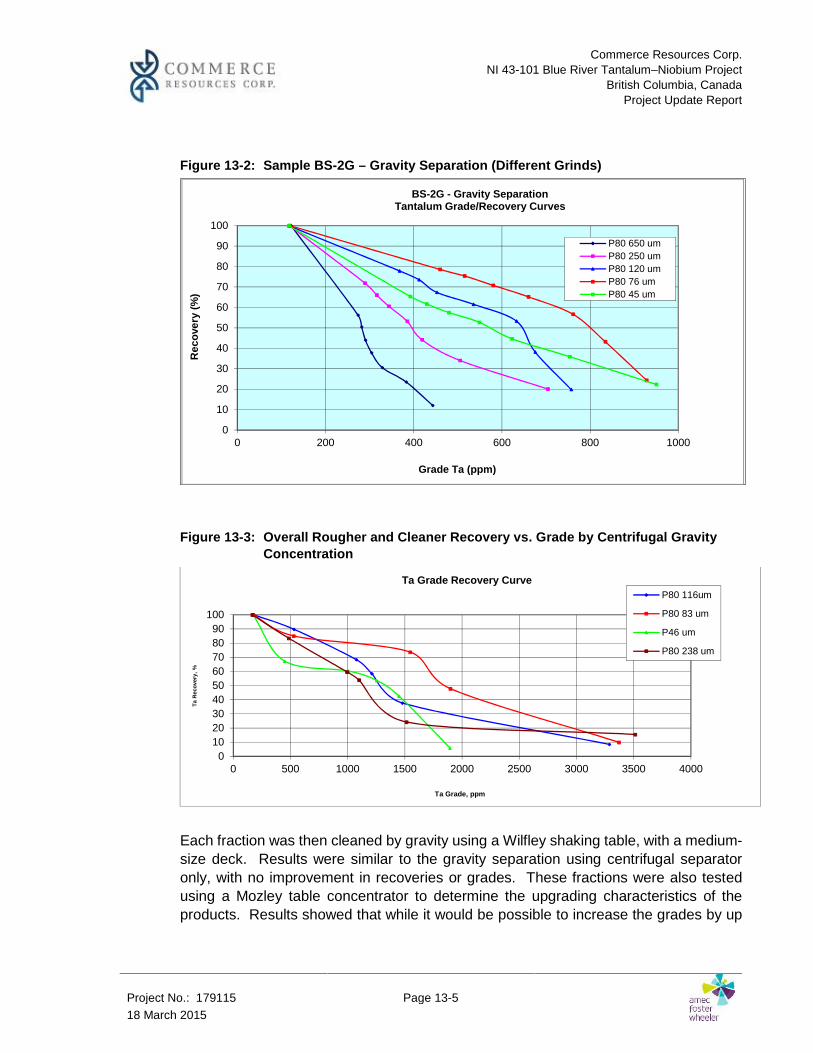
Commerce Resources Corp.NI 43-101 Blue River Tantalum–Niobium Project
British Columbia, CanadaProject Update Report
Project No.: 179115 Page 13-518 March 2015
Figure 13-2: Sample BS-2G – Gravity Separation (Different Grinds)
Figure 13-3: Overall Rougher and Cleaner Recovery vs. Grade by Centrifugal GravityConcentration
Each fraction was then cleaned by gravity using a Wilfley shaking table, with a medium-size deck. Results were similar to the gravity separation using centrifugal separatoronly, with no improvement in recoveries or grades. These fractions were also testedusing a Mozley table concentrator to determine the upgrading characteristics of theproducts. Results showed that while it would be possible to increase the grades by up
0
10
20
30
40
50
60
70
80
90
100
0 200 400 600 800 1000
Rec
over
y (%
)
Grade Ta (ppm)
BS-2G - Gravity SeparationTantalum Grade/Recovery Curves
P80 650 umP80 250 umP80 120 umP80 76 umP80 45 um
0102030405060708090
100
0 500 1000 1500 2000 2500 3000 3500 4000
Ta R
ecov
ery,
%
Ta Grade, ppm
Ta Grade Recovery CurveP80 116um
P80 83 um
P46 um
P80 238 um
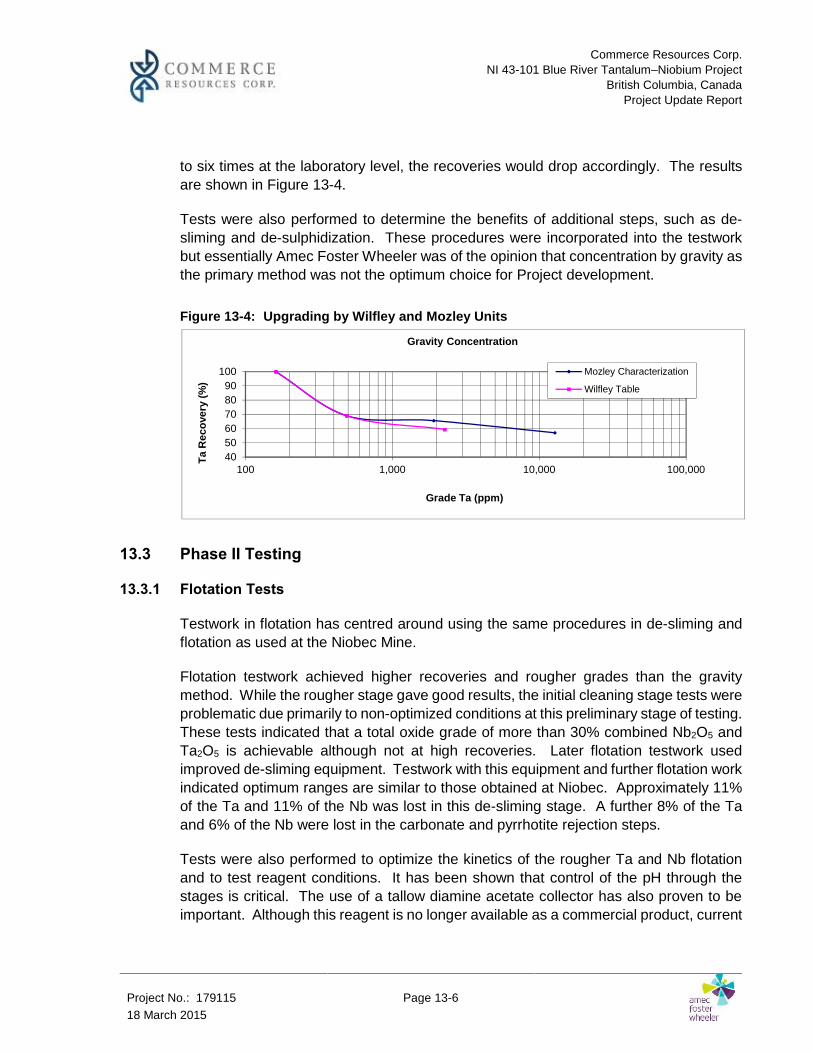
Commerce Resources Corp.NI 43-101 Blue River Tantalum–Niobium Project
British Columbia, CanadaProject Update Report
Project No.: 179115 Page 13-618 March 2015
to six times at the laboratory level, the recoveries would drop accordingly. The resultsare shown in Figure 13-4.
Tests were also performed to determine the benefits of additional steps, such as de-sliming and de-sulphidization. These procedures were incorporated into the testworkbut essentially Amec Foster Wheeler was of the opinion that concentration by gravity asthe primary method was not the optimum choice for Project development.
Figure 13-4: Upgrading by Wilfley and Mozley Units
13.3 Phase II Testing
13.3.1 Flotation Tests
Testwork in flotation has centred around using the same procedures in de-sliming andflotation as used at the Niobec Mine.
Flotation testwork achieved higher recoveries and rougher grades than the gravitymethod. While the rougher stage gave good results, the initial cleaning stage tests wereproblematic due primarily to non-optimized conditions at this preliminary stage of testing.These tests indicated that a total oxide grade of more than 30% combined Nb2O5 andTa2O5 is achievable although not at high recoveries. Later flotation testwork usedimproved de-sliming equipment. Testwork with this equipment and further flotation workindicated optimum ranges are similar to those obtained at Niobec. Approximately 11%of the Ta and 11% of the Nb was lost in this de-sliming stage. A further 8% of the Taand 6% of the Nb were lost in the carbonate and pyrrhotite rejection steps.
Tests were also performed to optimize the kinetics of the rougher Ta and Nb flotationand to test reagent conditions. It has been shown that control of the pH through thestages is critical. The use of a tallow diamine acetate collector has also proven to beimportant. Although this reagent is no longer available as a commercial product, current
405060708090
100
100 1,000 10,000 100,000
Ta R
ecov
ery
(%)
Grade Ta (ppm)
Gravity Concentration
Mozley Characterization
Wilfley Table

Commerce Resources Corp.NI 43-101 Blue River Tantalum–Niobium Project
British Columbia, CanadaProject Update Report
Project No.: 179115 Page 13-718 March 2015
practitioners such as the Niobec Mine now purchase the two main reagents (the amineand acetic acid) and prepare the collector at site.
Process development work is continuing in this area, but for this report, the processsuggested by Test F81 (see Table 13-2) has been chosen as the basis of initialconcentration design as recoveries were good (approx. 70% Ta) for this type ofmineralization and due to a combined grade of 10% Ta–Nb (equivalent to approximately14% combined oxides) being achieved. It is expected that with further work, a combinedgrade of 30% combined oxides should be achievable.
Table 13-2: Results from F81Mass Assay Recovery
Ta Nb S Ta Nb SProducts % ppm ppm % % % %
Cyclone Overflow #1 16.5 49 338 0.35 6.9 7.4 9.0Cyclone Overflow #2 7.1 73 410 0.41 4.4 3.8 4.5Carbonate Concentrate 28.0 25 151 0.17 5.9 5.6 7.3Pyrrhotite Concentrate 1.7 152 275 27.38 2.2 0.6 73.5Magnetic product 0.1 56 395 21.59 0.0 0.0 2.3Stage 5 Pyrochlore Cleaner Con 0.6 12,839 86,732 1.14 69.8 72.7 1.1Stage 5 Pyrochlore Cleaner Tail 0.4 228 1816 0.15 0.7 0.9 0.1Stage 4 Pyrochlore Cleaner Con 1.0 8,121 54,962 0.77 70.6 73.6 1.2Stage 4 Pyrochlore Cleaner Tail 3.9 179 1397 0.06 6.0 7.3 0.4Stage 3 Pyrochlore Cleaner Con 5.0 1,806 12,372 0.21 76.6 80.8 1.6Stage 3 Pyrochlore Cleaner Tail 1.0 63 499 0.08 0.5 0.6 0.1Stage 2 Pyrochlore Cleaner Con 5.9 1,525 10,459 0.19 77.1 81.5 1.7Stage 2 Pyrochlore Cleaner Tail 5.3 10 96 0.02 0.5 0.7 0.2Stage 1 Pyrochlore Cleaner Con 11.2 8,10 5,570 0.11 77.6 82.1 1.9Stage 1 Pyrochlore Cleaner Tail 13.9 10 10 0.04 1.2 0.2 0.9Total Pyrochlore Rougher Concentrate 25.1 367 2,492 0.07 78.7 82.3 2.8Flotation Tails 21.5 10 10 0.02 1.8 0.3 0.7Calculated Feed 117 760 0.64 100 100 100Assayed Feed 113 764
In addition to flotation tests, preliminary dilute hydrochloric acid leaching tests wereperformed. These indicated that low- to intermediate-grade gravity and flotationproducts can be upgraded significantly with negligible loss of Ta + Nb. The upgradingflowsheet will be based on an economic comparison between pay metal losses from
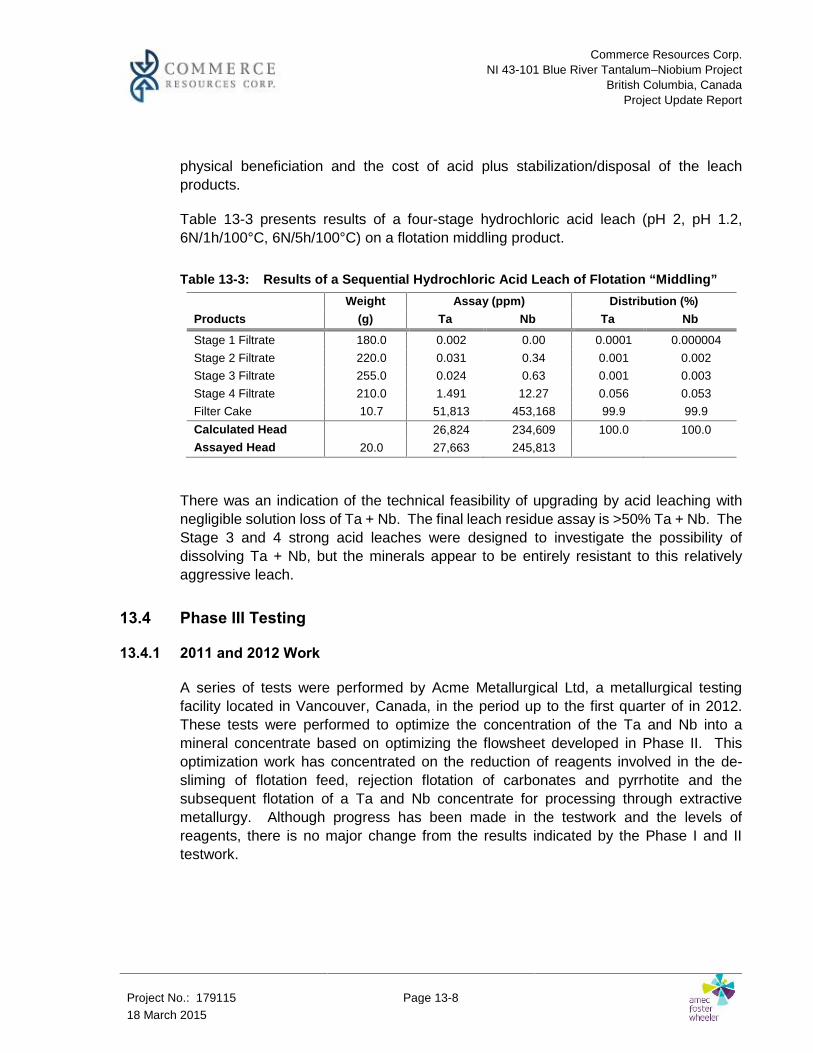
Commerce Resources Corp.NI 43-101 Blue River Tantalum–Niobium Project
British Columbia, CanadaProject Update Report
Project No.: 179115 Page 13-818 March 2015
physical beneficiation and the cost of acid plus stabilization/disposal of the leachproducts.
Table 13-3 presents results of a four-stage hydrochloric acid leach (pH 2, pH 1.2,6N/1h/100°C, 6N/5h/100°C) on a flotation middling product.
Table 13-3: Results of a Sequential Hydrochloric Acid Leach of Flotation “Middling”Weight Assay (ppm) Distribution (%)
Products (g) Ta Nb Ta Nb
Stage 1 Filtrate 180.0 0.002 0.00 0.0001 0.000004Stage 2 Filtrate 220.0 0.031 0.34 0.001 0.002Stage 3 Filtrate 255.0 0.024 0.63 0.001 0.003Stage 4 Filtrate 210.0 1.491 12.27 0.056 0.053Filter Cake 10.7 51,813 453,168 99.9 99.9Calculated Head 26,824 234,609 100.0 100.0Assayed Head 20.0 27,663 245,813
There was an indication of the technical feasibility of upgrading by acid leaching withnegligible solution loss of Ta + Nb. The final leach residue assay is >50% Ta + Nb. TheStage 3 and 4 strong acid leaches were designed to investigate the possibility ofdissolving Ta + Nb, but the minerals appear to be entirely resistant to this relativelyaggressive leach.
13.4 Phase III Testing
13.4.1 2011 and 2012 Work
A series of tests were performed by Acme Metallurgical Ltd, a metallurgical testingfacility located in Vancouver, Canada, in the period up to the first quarter of in 2012.These tests were performed to optimize the concentration of the Ta and Nb into amineral concentrate based on optimizing the flowsheet developed in Phase II. Thisoptimization work has concentrated on the reduction of reagents involved in the de-sliming of flotation feed, rejection flotation of carbonates and pyrrhotite and thesubsequent flotation of a Ta and Nb concentrate for processing through extractivemetallurgy. Although progress has been made in the testwork and the levels ofreagents, there is no major change from the results indicated by the Phase I and IItestwork.
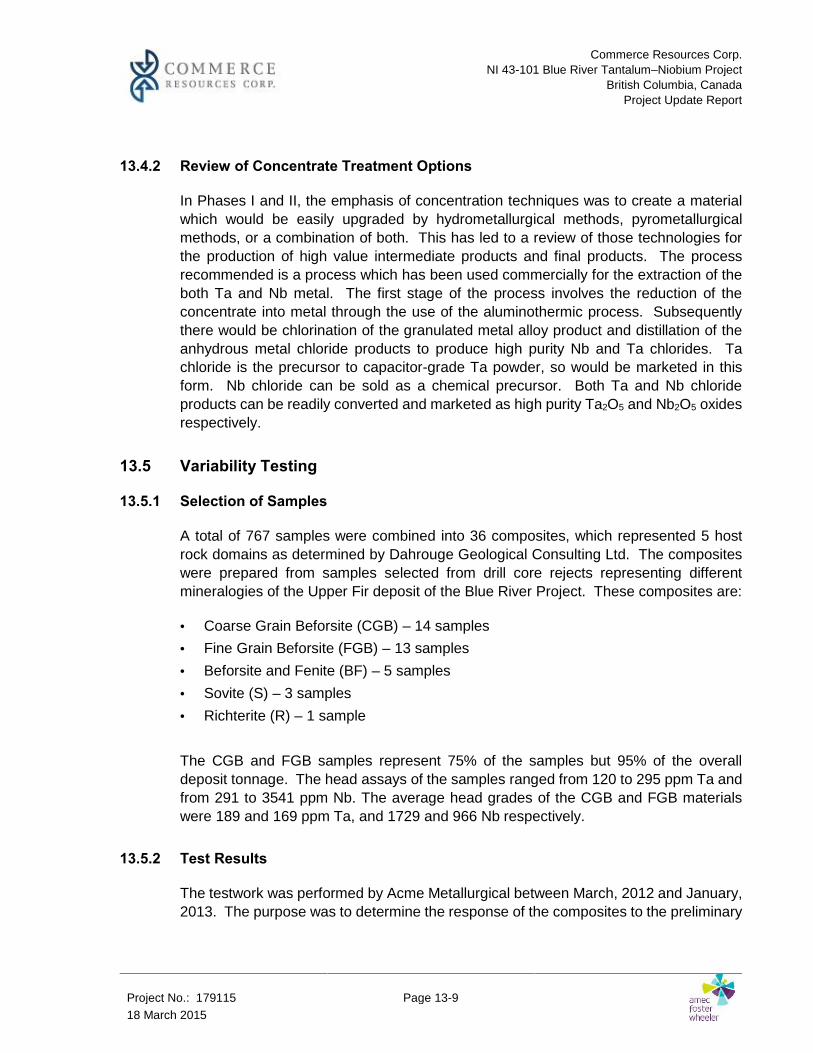
Commerce Resources Corp.NI 43-101 Blue River Tantalum–Niobium Project
British Columbia, CanadaProject Update Report
Project No.: 179115 Page 13-918 March 2015
13.4.2 Review of Concentrate Treatment Options
In Phases I and II, the emphasis of concentration techniques was to create a materialwhich would be easily upgraded by hydrometallurgical methods, pyrometallurgicalmethods, or a combination of both. This has led to a review of those technologies forthe production of high value intermediate products and final products. The processrecommended is a process which has been used commercially for the extraction of theboth Ta and Nb metal. The first stage of the process involves the reduction of theconcentrate into metal through the use of the aluminothermic process. Subsequentlythere would be chlorination of the granulated metal alloy product and distillation of theanhydrous metal chloride products to produce high purity Nb and Ta chlorides. Tachloride is the precursor to capacitor-grade Ta powder, so would be marketed in thisform. Nb chloride can be sold as a chemical precursor. Both Ta and Nb chlorideproducts can be readily converted and marketed as high purity Ta2O5 and Nb2O5 oxidesrespectively.
13.5 Variability Testing
13.5.1 Selection of Samples
A total of 767 samples were combined into 36 composites, which represented 5 hostrock domains as determined by Dahrouge Geological Consulting Ltd. The compositeswere prepared from samples selected from drill core rejects representing differentmineralogies of the Upper Fir deposit of the Blue River Project. These composites are:
Coarse Grain Beforsite (CGB) – 14 samples Fine Grain Beforsite (FGB) – 13 samples Beforsite and Fenite (BF) – 5 samples Sovite (S) – 3 samples Richterite (R) – 1 sample
The CGB and FGB samples represent 75% of the samples but 95% of the overalldeposit tonnage. The head assays of the samples ranged from 120 to 295 ppm Ta andfrom 291 to 3541 ppm Nb. The average head grades of the CGB and FGB materialswere 189 and 169 ppm Ta, and 1729 and 966 Nb respectively.
13.5.2 Test Results
The testwork was performed by Acme Metallurgical between March, 2012 and January,2013. The purpose was to determine the response of the composites to the preliminary

Commerce Resources Corp.NI 43-101 Blue River Tantalum–Niobium Project
British Columbia, CanadaProject Update Report
Project No.: 179115 Page 13-1018 March 2015
flotation procedure developed in Phase 1 and 2. The work included grinding, desliming,and flotation. Analytical work was performed by ACME Analytical based in Vancouver,Canada.
Desliming was performed in one stage in the laboratory and is indicative of the resultsthat would be obtained in a 2 stage industrial desliming circuit. The losses at this stagewere along the lines of that encountered in the process development work.
Unlike Test F81, no pyrrhotite flotation was performed prior to the carbonate flotation.Instead after desliming, conditioning at high density was followed by a two stagecarbonate flotation process. For both the CGB and FGB materials, the first stagerejected 25 to 40% of the mass with minor losses of Ta and Nb. In the second stage,cumulative mass rejection reached approximately 70% but with approximately doublethe losses of Ta and Nb seen in the first stage. It is believed that cleaning of thescavenger concentrate would be of benefit in allowing Ta and Nb in the scavengercleaner tails to be recombined with scavenger tails to reduce the losses at this stage.The performance of the various composites at this step indicates that the majority of thematerial responds well to the carbonate flotation and that this process will work for thelarge majority of the resource material at Blue River.
Conditioning ahead of Ta-Nb rougher flotation consists primarily of a solution exchange.Testwork indicated high recoveries while reducing the weight of the material toapproximately half the initial value. As with the carbonate flotation, performance wasconsistently good for all mineralogical domains although not optimized for grade andrecovery. However, performance was variable for the BF material which is not a majorconcern given its minor proportion of the total.
First stage Ta-Nb cleaning was performed with a starting pH of 6.0 and an end pH of7.0 to 7.5 resulting in high recoveries but poor mass rejection. The second stage wasperformed with a starting pH of 5.0 but again allowed to drift higher resulting in less thanoptimum results. At a starting pH of 4.0 we begin to see the rejection of more mass butalso more Ta and Nb. In the fourth stage of cleaning, Ta and Nb recovery performanceis highly variable for CGB but less so for CGF. To attain similar recoveries to what wasachieved in F81, it was necessary to utilize a scavenger stage for each of the cleaningsteps. As further work is done in process design, it will be necessary to optimize reagentadditions and slurry pH conditions as well as re-examining the cleaning steps. It is likelythat further cleaning steps will be required.
Finally low intensity magnetic separation was used to upgrade the final product. Apartfrom one sample, the mass rejection ranged from 15.3 % to 61.3% of the final cleanerconcentrate while maintaining losses at 3.2% and 3.5% respectively This procedurediffers from the flowsheet based on the F81 test as that incorporates pyrrhotite and

Commerce Resources Corp.NI 43-101 Blue River Tantalum–Niobium Project
British Columbia, CanadaProject Update Report
Project No.: 179115 Page 13-1118 March 2015
magnetite rejection by flotation and low intensity magnetic separation prior to Ta-Nbflotation.
The variability work indicates that the key portions of the design process should be ableto cope with the material coming from different locations in the deposit. Approximately95% of the material lies within 2 domains, CBG and FGB, which have very similarresponses to the flowsheet. Of the remaining 5% of deposit material, only the BFmaterial is a concern and the plant’s exposure to that can be limited through ore controlin the mine.
13.6 QP Comment
The metallurgical testwork has shown that it is possible to collect the Ta and Nb mineralsinto a concentrate suitable for extraction of the metals into saleable products. Variabilitywork has confirmed the amenability of the material to the various components of anassumed flowsheet. Although not optimized in the cleaning stages, the work indicatesa range of 67.8% to 75% and 63.8% to 71.4% for the Ta and Nb recovery respectivelyto a final concentrate prior to the aluminothermic step.
Bulk sample composites used in the phase 1 and 2 testwork provide a range of Ta andNb grades representative of the Upper Fir carbonatite mineralization. Drill corecomposites used in phase 3 testwork provide a spatial and range of gradesrepresentative of the deposit.
The secondary treatment of metal extraction from the concentrate is possible by anexisting method such as aluminothermic reduction followed by chlorine refining. Theassumed methods for refining the concentrate have been used in commercialapplications but have not been demonstrated in test work of Blue River material.

Commerce Resources Corp.NI 43-101 Blue River Tantalum–Niobium Project
British Columbia, CanadaProject Update Report
Project No.: 179115 Page 14-118 March 2015
14.0 MINERAL RESOURCE ESTIMATES
The resource block model was constructed inside a 3D wireframe interpretation of theUpper Fir and Bone Creek carbonatites. All lithologies surrounding the carbonatites,including fenite, carry fairly low Ta and Nb grades and are considered sub-economic.Generally assay data exist only for carbonatite. There are some assay values for feniteand other wall rocks but not in sufficient numbers to support creation of a block modelfor these lithologies.
The 3D wireframe carbonatite model was constructed using 271 diamond drill holes.Collar, survey, lithology and assay files were exported from a GEMS® database as csvfiles, imported into MineSight®, and combined into a drill hole assay file.
14.1 Carbonatite Wireframe Model
Geological interpretations were provided by Commerce in the form of 3D wireframes inDXF format. The wireframes were created using GEMS™ geological modeling softwarefor carbonatite and fenite lithologies. Gneiss was not modeled. The carbonatitewireframes were provided as 63 structural (different strike, dip and / or pitch) domains.The 3D model included internal waste lithology wireframes. Amec Foster Wheelerreviewed the geological interpretations and 3D wireframes and considers them to beappropriate for resource estimation work.
14.2 Assay Data and Capping
Elemental Ta and Nb assay results provided by the laboratory were converted to Ta2O5
and Nb2O5 grades. Capping was required to limit the influence of outliers. Amec FosterWheeler conducted grade capping on original samples that are mostly 1 m long. Thechoice of capping was based on visual inspection of histograms and probability plots.The amount of capping was small; top-cuts of 1,000 ppm Ta2O5 and 10,000 ppm Nb2O5
were used. Only nine Ta2O5 samples and 14 Nb2O5 samples were capped resulting inan expected metal removal of 0.30% Ta2O5 and 0.55% Nb2O5.
14.3 Composites
Capped drill core assays were composited down the hole to a fixed length of 2.5 m.Compositing of Ta2O5 and Nb2O5 honoured geological boundaries. Composites withlength less than 1.25 m were merged with the previous composite. Pre- and post-compositing Ta2O5 and Nb2O5 means were identical and compositing resulted in areduced variability as indicated by lower CV (CV=coefficient of variation; CV=standard
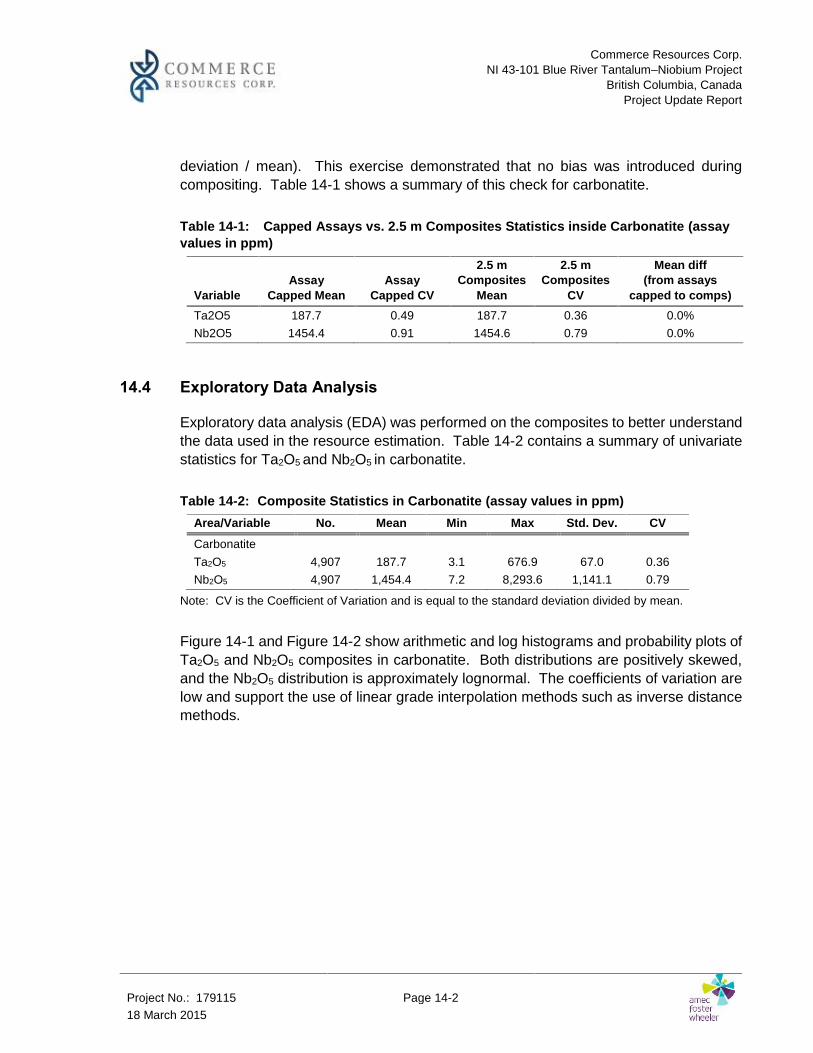
Commerce Resources Corp.NI 43-101 Blue River Tantalum–Niobium Project
British Columbia, CanadaProject Update Report
Project No.: 179115 Page 14-218 March 2015
deviation / mean). This exercise demonstrated that no bias was introduced duringcompositing. Table 14-1 shows a summary of this check for carbonatite.
Table 14-1: Capped Assays vs. 2.5 m Composites Statistics inside Carbonatite (assayvalues in ppm)
VariableAssay
Capped MeanAssay
Capped CV
2.5 mComposites
Mean
2.5 mComposites
CV
Mean diff(from assays
capped to comps)Ta2O5 187.7 0.49 187.7 0.36 0.0%Nb2O5 1454.4 0.91 1454.6 0.79 0.0%
14.4 Exploratory Data Analysis
Exploratory data analysis (EDA) was performed on the composites to better understandthe data used in the resource estimation. Table 14-2 contains a summary of univariatestatistics for Ta2O5 and Nb2O5 in carbonatite.
Table 14-2: Composite Statistics in Carbonatite (assay values in ppm)Area/Variable No. Mean Min Max Std. Dev. CV
CarbonatiteTa2O5 4,907 187.7 3.1 676.9 67.0 0.36Nb2O5 4,907 1,454.4 7.2 8,293.6 1,141.1 0.79
Note: CV is the Coefficient of Variation and is equal to the standard deviation divided by mean.
Figure 14-1 and Figure 14-2 show arithmetic and log histograms and probability plots ofTa2O5 and Nb2O5 composites in carbonatite. Both distributions are positively skewed,and the Nb2O5 distribution is approximately lognormal. The coefficients of variation arelow and support the use of linear grade interpolation methods such as inverse distancemethods.

Commerce Resources Corp.NI 43-101 Blue River Tantalum–Niobium Project
British Columbia, CanadaProject Update Report
Project No.: 179115 Page 14-318 March 2015
Figure 14-1: Ta2O5 Histograms and Probability Plot within Carbonatite
Note: Figure prepared by Amec Foster Wheeler.

Commerce Resources Corp.NI 43-101 Blue River Tantalum–Niobium Project
British Columbia, CanadaProject Update Report
Project No.: 179115 Page 14-418 March 2015
Figure 14-2: Nb2O5 Histograms and Probability Plot within Carbonatite
Note: Figure prepared by Amec Foster Wheeler.
14.5 Contact Analysis
Contact profiles on composite data were used to analyze grade behaviour at lithologyboundaries. There were sharp differences in grade for each of the variables at thecarbonatite/fenite boundary, meaning that values from outside the carbonatite should bedisregarded in the interpolation process of Ta2O5 and Nb2O5 grade inside thecarbonatite. Figure 14-3 and Figure 14-4 show contact profiles for respectively Ta2O5
and Nb2O5 grade at carbonatite and fenite boundary.

Commerce Resources Corp.NI 43-101 Blue River Tantalum–Niobium Project
British Columbia, CanadaProject Update Report
Project No.: 179115 Page 14-518 March 2015
Figure 14-3: Ta2O5 Contact Plots between Carbonatite and Fenite
Note: Figure prepared by Amec Foster Wheeler.

Commerce Resources Corp.NI 43-101 Blue River Tantalum–Niobium Project
British Columbia, CanadaProject Update Report
Project No.: 179115 Page 14-618 March 2015
Figure 14-4: Nb2O5 Contact Plots between Carbonatite and Fenite
Note: Figure prepared by Amec Foster Wheeler.

Commerce Resources Corp.NI 43-101 Blue River Tantalum–Niobium Project
British Columbia, CanadaProject Update Report
Project No.: 179115 Page 14-718 March 2015
14.6 Variography
Variograms and correlograms are tools used to quantify the spatial variability of avariable in a geological domain. Both in-house software and commercially availableSage2001 software were used to produce variogram maps, and to construct down-the-hole and directional correlograms for carbonatite composites. Ta2O5 and Nb2O5
correlograms were created within the entire carbonatite zone. Two spherical modelswere used to fit the experimental correlograms; a summary of their parameters is shownin Table 14-3.
Table 14-3: Ta2O5 and Nb2O5 Correlogram Parameters in Carbonatite
Metal C0*
1st Structure 2nd StructureRotation (°) Range (m) Rotation (°) Range (m)
C1* Z X Y X Y Z C2* Z X Y X Y ZTa2O5 0.328 0.552 -45 1 81 10.1 28.0 20.3 0.120 -45 1 81 32.3 153.1 88.9Nb2O5 0.122 0.310 -56 3 -11 11.7 16.3 8.2 0.568 -56 3 -11 235.0 387.6 58.4
*C0 – nugget effect; C1-contribution of the 1st structure to the sill; C2-contribution of the 2nd structure to the sill; sillhas been standardized to value of 1.
The first rotation uses a left hand rule around positive Z axis, the second rotation is aright hand rule around positive X axis and finally the third rotation is a right hand rulearound positive Y axis. The nugget effects (C0) were modelled from the down-holecorrelograms.
14.7 Block Model Dimensions
The block model consists of unrotated regular blocks. The block model frameworkparameters are listed in Table 14-4.
Table 14-4: Block Model DimensionsAxis Origin* Block Size (m) No. of Blocks Model Extension (m)
X 352,350 5 250 1,250Y 5,795,850 5 390 1,950Z 925 2.5 244 610
Note: *Origin is defined as the bottom southwest corner of the model, located at the lowest combinednorthing and easting coordinates and the lowest elevation.

Commerce Resources Corp.NI 43-101 Blue River Tantalum–Niobium Project
British Columbia, CanadaProject Update Report
Project No.: 179115 Page 14-818 March 2015
14.8 Assignment of Lithology and Specific Gravity to Blocks
Blocks were coded by lithology wireframes domain. A block was tagged with a particulardomain code if at least 50% of the block was within the wireframe domain. The volumeof each lithology wireframe was then compared with the volume of the blocks inside aparticular wireframe. The block model and corresponding lithology wireframe volumescompared within ±0.5%.
A specific gravity value was assigned by lithology to all blocks in the block model(including blocks outside of carbonatite) as follows:
2.97 value was assigned to all blocks in carbonatite 2.96 value was assigned to all blocks in fenite 2.81 value was assigned to all blocks in gneiss 3.02 value was assigned to all blocks in amphibolite 2.63 value was assigned to all blocks in pegmatite 3.03 value was assigned to all blocks in skarn
All the above specific gravity values were derived as described in Section 10.
14.9 Block Model Grade Estimate
Ta2O5 and Nb2O5 grades were estimated in the carbonatite using an inverse distance tothe power of 3 (ID3) interpolation method. A four-pass interpolation approach was usedwith each successive pass having greater search distances. A hard boundary was used,meaning that composites from outside the carbonatite were not used in the interpolationof grade within the carbonatite. Estimation was done separately within each carbonatitedomain. Sixty-three different carbonatite domains were identified and used in theestimation process.

Commerce Resources Corp.NI 43-101 Blue River Tantalum–Niobium Project
British Columbia, CanadaProject Update Report
Project No.: 179115 Page 14-918 March 2015
Table 14-5 shows the estimation search parameters for Ta2O5 and Nb2O5.
Table 14-5: Estimation Parameters for Ta2O5 and Nb2O5
Domain Pass
Search EllipseMin.No.
Comp
Max.No.
Comp
Max.Comp./Hole
Rotation (°) Ranges(m)Z X Z X Y Z
Common toall domains
1differ
bydomain
differby
domain
differby
domain
50 50 5 5 8 22 100 100 5 3 8 23 150 150 5 2 8 24 300 300 50 2 8 2
The rotation angles of the search ellipse are the same for each pass, but they aredifferent for each of the 63 structural domains. They reflect average strike, dip, and pitchof each fold limb / domain.
14.10 Block Model Validation
The block model grades were validated by visual inspection comparing composites toblock grades on-screen, declustered global statistics checks, local biases checks usingswath plots, and finally model selectivity checks.
14.10.1 Visual Validation
Visual validation comprised inspection of composites and blocks in vertical sections andplan views. Figure 14-5 to Figure 14-8 show colour-coded Ta2O5 or Nb2O5 compositesand corresponding ID3 block models on plan and in section. The model generallyhonours both Ta2O5 and Nb2O5 data well, and grade extrapolation is well-controlledwhere sufficient data exist.

Commerce Resources Corp.NI 43-101 Blue River Tantalum–Niobium Project
British Columbia, CanadaProject Update Report
Project No.: 179115 Page 14-1018 March 2015
Figure 14-5: Ta2O5 ID3 Model within Carbonatite – Plan 1,146.25
Figure prepared by Amec Foster Wheeler.
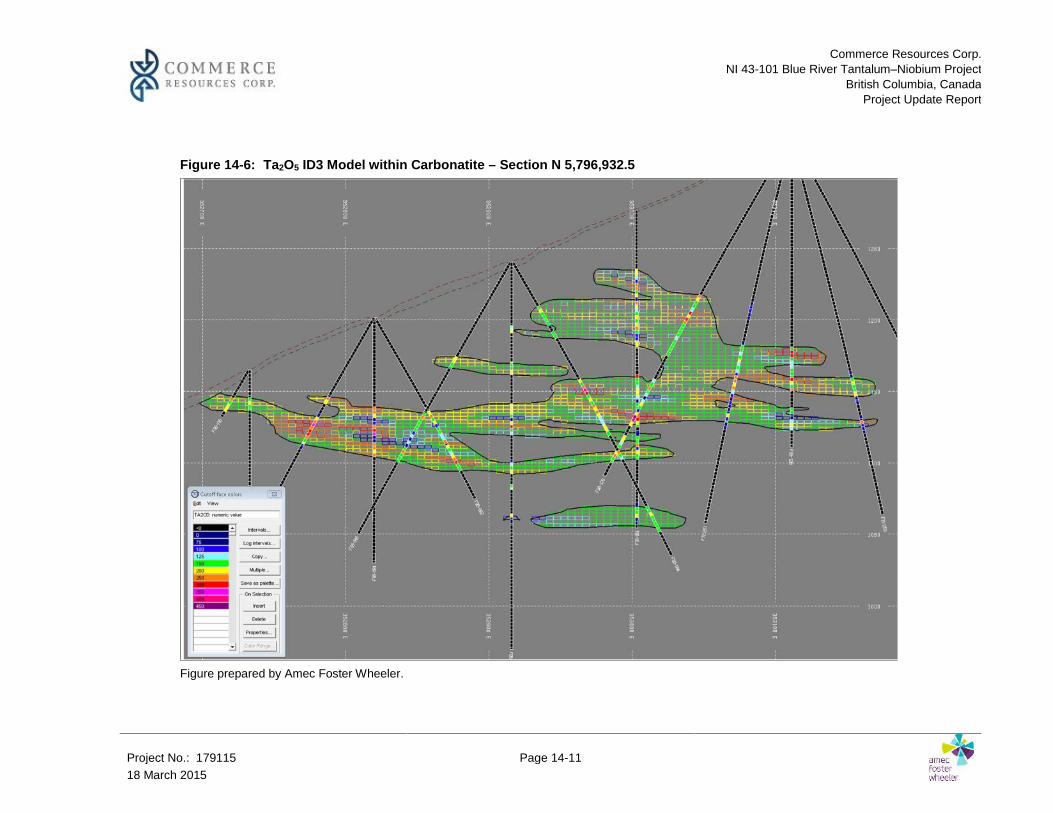
Commerce Resources Corp.NI 43-101 Blue River Tantalum–Niobium Project
British Columbia, CanadaProject Update Report
Project No.: 179115 Page 14-1118 March 2015
Figure 14-6: Ta2O5 ID3 Model within Carbonatite – Section N 5,796,932.5
Figure prepared by Amec Foster Wheeler.

Commerce Resources Corp.NI 43-101 Blue River Tantalum–Niobium Project
British Columbia, CanadaProject Update Report
Project No.: 179115 Page 14-1218 March 2015
Figure 14-7: Nb2O5 ID3 Model within Carbonatite – Plan 1,146.25
Figure prepared by Amec Foster Wheeler.
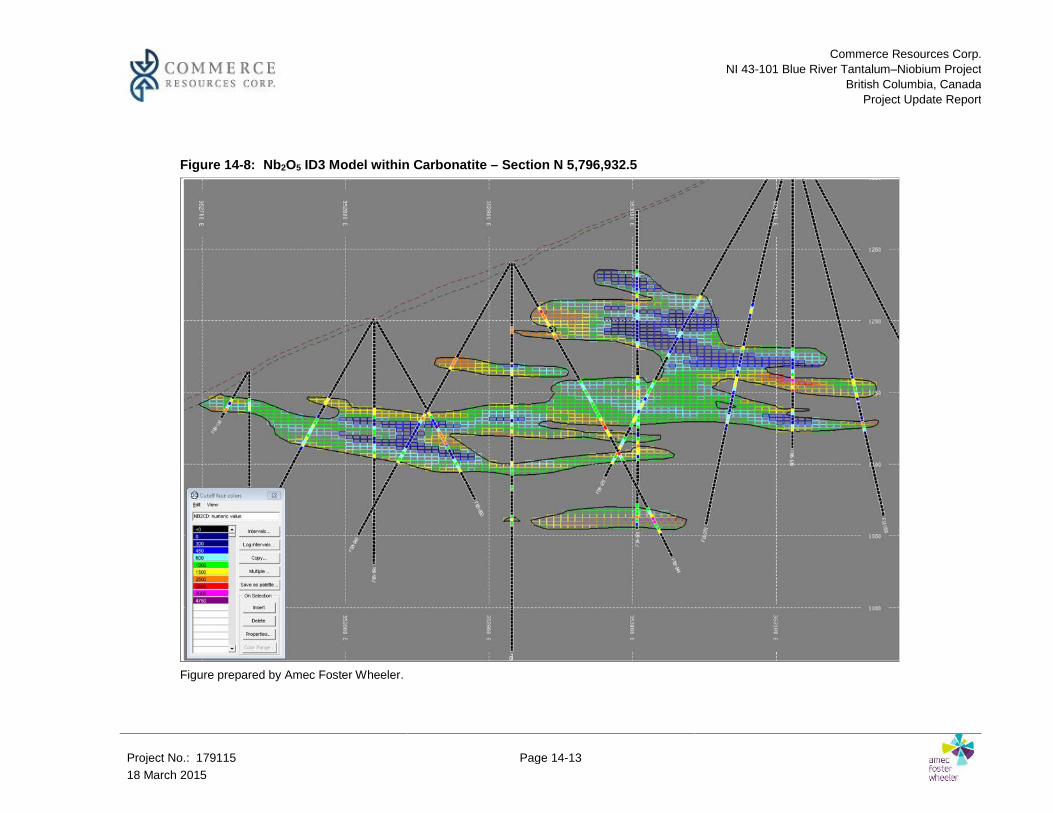
Commerce Resources Corp.NI 43-101 Blue River Tantalum–Niobium Project
British Columbia, CanadaProject Update Report
Project No.: 179115 Page 14-1318 March 2015
Figure 14-8: Nb2O5 ID3 Model within Carbonatite – Section N 5,796,932.5
Figure prepared by Amec Foster Wheeler.
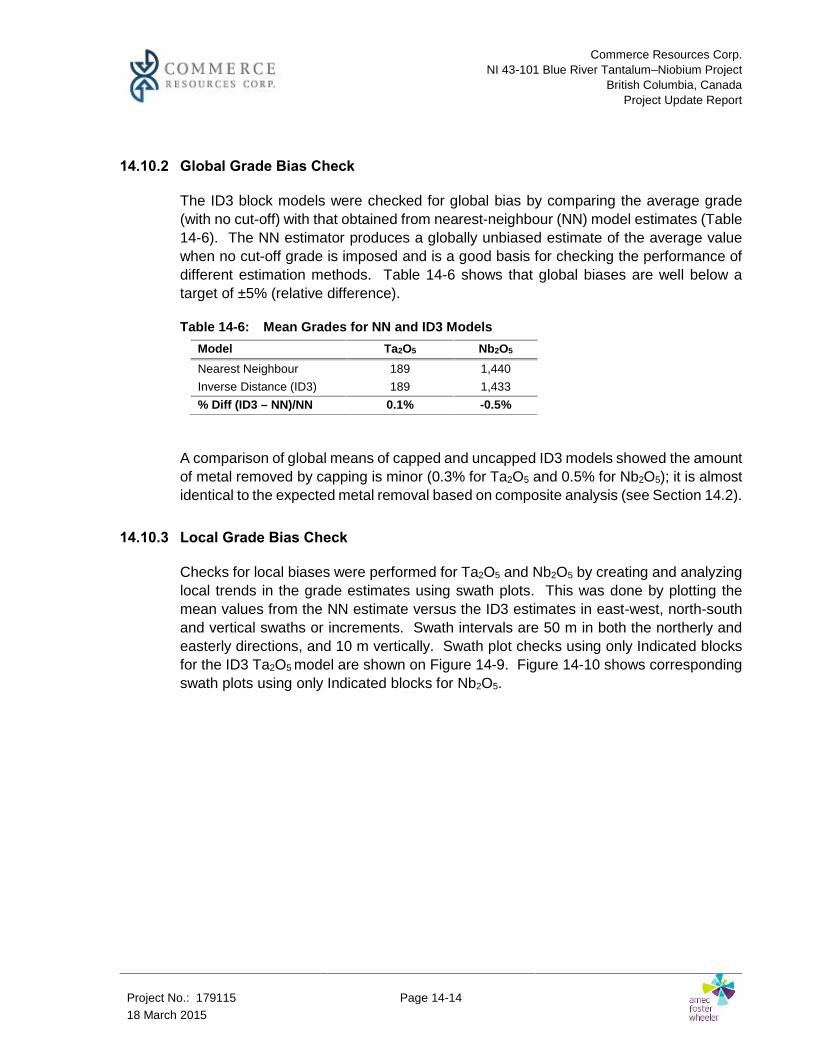
Commerce Resources Corp.NI 43-101 Blue River Tantalum–Niobium Project
British Columbia, CanadaProject Update Report
Project No.: 179115 Page 14-1418 March 2015
14.10.2 Global Grade Bias Check
The ID3 block models were checked for global bias by comparing the average grade(with no cut-off) with that obtained from nearest-neighbour (NN) model estimates (Table14-6). The NN estimator produces a globally unbiased estimate of the average valuewhen no cut-off grade is imposed and is a good basis for checking the performance ofdifferent estimation methods. Table 14-6 shows that global biases are well below atarget of ±5% (relative difference).
Table 14-6: Mean Grades for NN and ID3 ModelsModel Ta2O5 Nb2O5
Nearest Neighbour 189 1,440Inverse Distance (ID3) 189 1,433% Diff (ID3 – NN)/NN 0.1% -0.5%
A comparison of global means of capped and uncapped ID3 models showed the amountof metal removed by capping is minor (0.3% for Ta2O5 and 0.5% for Nb2O5); it is almostidentical to the expected metal removal based on composite analysis (see Section 14.2).
14.10.3 Local Grade Bias Check
Checks for local biases were performed for Ta2O5 and Nb2O5 by creating and analyzinglocal trends in the grade estimates using swath plots. This was done by plotting themean values from the NN estimate versus the ID3 estimates in east-west, north-southand vertical swaths or increments. Swath intervals are 50 m in both the northerly andeasterly directions, and 10 m vertically. Swath plot checks using only Indicated blocksfor the ID3 Ta2O5 model are shown on Figure 14-9. Figure 14-10 shows correspondingswath plots using only Indicated blocks for Nb2O5.

Commerce Resources Corp.NI 43-101 Blue River Tantalum–Niobium Project
British Columbia, CanadaProject Update Report
Project No.: 179115 Page 14-1518 March 2015
Figure 14-9: Swath Plot for Ta2O5 ID3 Model
Figure prepared by Amec Foster Wheeler.

Commerce Resources Corp.NI 43-101 Blue River Tantalum–Niobium Project
British Columbia, CanadaProject Update Report
Project No.: 179115 Page 14-1618 March 2015
Figure 14-10: Swath Plot for Nb2O5 ID3 Model
Figure prepared by Amec Foster Wheeler.
In the upper row of the swath plots, the black line represents the ID3 model grades, thered line represents the NN model grades, and the blue line represents the compositegrades. In the lower row of swath plots, the lines represent the number of blockscontained in each swath, and the number of composites. Because the NN model isdeclustered, it is a better reference than composites for validating the resource blockmodel. Composites are not declustered and only provide an indicative check. Swathplot checks show that there are no local biases between ID3 and NN models forestimated Ta2O5 and Nb2O5 in the carbonatite.
14.10.4 Selectivity Check
Selectivity analysis for Ta2O5 and Nb2O5 was completed using the Discrete GaussianModel for change of support from composite size to a selective mining unit (SMU) size.This was done using in-house software (Herco). The aim of this analysis was to assesswhether the estimated resource reasonably represents the recoverable resources(represented by Herco curves) relative to the proposed mining method. The selectivityanalysis assumed a 10 m by 10 m by 5 m block as the smallest SMU size for Blue River.

Commerce Resources Corp.NI 43-101 Blue River Tantalum–Niobium Project
British Columbia, CanadaProject Update Report
Project No.: 179115 Page 14-1718 March 2015
The results of the Herco analysis are generally discussed in terms of smoothness. Anover-smoothed model may over-estimate the tonnes and under-estimate the grade. Themodel with an appropriate amount of smoothing will follow the Herco grade and tonnagecurves for values corresponding to different economic, or grade cut-offs.
The Herco analyses were undertaken using only Indicated blocks in order to obtain agood understanding of the model selectivity, or smoothness. Inferred blocks are oftenextrapolated and over-smoothed for lack of data and are not recommended for use inthis analysis. Herco grade–tonnage curve checks using only Indicated blocks for ID3Ta2O5 model are shown in Figure 14-11. Figure 14-12 shows the corresponding Hercochecks for Nb2O5. On both graphs, the upward-trending blue line represents the ID3model grades, while the paired red line represents the Herco model grades. Thedownward trending blue line represents the ID3 model tonnage, while the paired red linerepresents the Herco model tonnes.
The Herco selectivity analyses show that the Ta2O5 and Nb2O5 ID3 models have theappropriate level of smoothing for the cut-offs of interest.
Figure 14-11: Herco Grade – Tonnage Curves for Ta2O5 ID3 Model
Figure prepared by Amec Foster Wheeler.

Commerce Resources Corp.NI 43-101 Blue River Tantalum–Niobium Project
British Columbia, CanadaProject Update Report
Project No.: 179115 Page 14-1818 March 2015
Figure 14-12: Herco Grade – Tonnage Curves for Nb2O5 ID3 Model
Figure prepared by Amec Foster Wheeler.
14.11 Mineral Resource Classification
The Mineral Resource is classified in accordance with the Canadian Institute of Mining,Metallurgy, and Petroleum (CIM) Definition Standards for Mineral Resources andMineral Reserves (May 10, 2014), whose definitions are incorporated by reference intoNI 43-101.
Mineral resources are required to be classified as Inferred, Indicated, and Measuredaccording to increasing confidence in geological information, grade continuity, and otheraspects impacting the resources.
In addition to criteria such as sufficient geological continuity, grade continuity, and dataintegrity, another guideline that Amec Foster Wheeler uses for resource classification isto have drill hole spacing sufficient to predict potential production with reasonableprobability of precision over a selected period of time. As such Amec Foster Wheelerconducted drill hole spacing studies taking into account both grade continuity andresource tonnage / volume uncertainty.

Commerce Resources Corp.NI 43-101 Blue River Tantalum–Niobium Project
British Columbia, CanadaProject Update Report
Project No.: 179115 Page 14-1918 March 2015
Based on these drill-hole spacing studies the following criteria for classification ofmineral resources at Blue River were established:
Inferred Mineral Resources:
Minimum one drill hole Distance to the closest composite less than 100 m
Indicated Mineral Resources:
Minimum two drill holes Distance to the closest composite less than 40 m Distance to the second closest composite less than 60 m
Measured Mineral Resources:
Minimum three drill holes Distance to the closest composite less than 20 m Distance to the second closest composite less than 30 m
The current mineral resource classification at Blue River is restricted to Indicated orInferred, based on the following:
Confidence limits drill hole spacing studies Concerns over analytical precision and provisional accuracy for the sample dataset
from 2005 to 2008 Required metallurgical testwork on the final stage of the proposed metallurgical
process is still ongoing to support proof-of–concept.
Eighty-eight per cent of the carbonatite blocks are classified as Indicated. Eleven percent of the carbonatite blocks are classified as Inferred. Less than one per cent of theblock model in carbonatite is unclassified. Blocks that fall into the unclassified categoryare within carbonatite domains that were intersected typically by one isolated drill hole.The geological continuity and volume of those solids cannot be reasonably assumed.
Figure 14-13 and Figure 14-14 show examples of the classified Mineral Resource.

Commerce Resources Corp.NI 43-101 Blue River Tantalum–Niobium Project
British Columbia, CanadaProject Update Report
Project No.: 179115 Page 14-2018 March 2015
Figure 14-13: Resource Classification – Plan 1,161.25
Note: The following block colour scheme is used in the figure: Green – Indicated; Yellow – Inferred; Red – Unclassified; drill hole projection ± 2.5 m.Figure prepared by Amec Foster Wheeler.

Commerce Resources Corp.NI 43-101 Blue River Tantalum–Niobium Project
British Columbia, CanadaProject Update Report
Project No.: 179115 Page 14-2118 March 2015
Figure 14-14: Resource Classification – Section N 5,796,882.5
Note: The following block colour scheme is used in the figure: Green – Indicated; Yellow – Inferred; Red – Unclassified; drill hole projection ± 20 m;view north. Figure prepared by Amec Foster Wheeler.

Commerce Resources Corp.Blue River Tantalum–Niobium Project
British Columbia, CanadaNI 43-101 Technical Report on Mineral Resource Update
Project No.: 179115 Page 14-2218 March 2015
14.12 Reasonable Prospects for Eventual Economic Extraction
To assess reasonable prospects for eventual economic extraction, Amec FosterWheeler assumed that the Blue River deposit would be mined utilizing self-supportedmining methods under a conceptual scenario that considers mining and processing at arate of 7,500 tonnes per day.
14.12.1 Commodity Price
Ta is commonly quoted in two separate forms:
Ta2O5 in tantalite concentrate: a non-refined, Ta-bearing concentrate of variablecomposition and trace element content
Ta metal scrap (99.9% pure Ta): this form of Ta product receives a premium pricein the market relative to tantalite concentrate
A base case metal price of US$381/kg Ta2O5 was used to constrain the MineralResource estimate.
Nb generally trades as Nb metal, or ferroalloy, and the price has remained relativelyconstant at US$50/kg Nb metal over the last several years. A base case price ofUS$46/kg Nb metal was assumed for consistency with previous estimates.
14.12.2 Mining Considerations
Steep topography provides access to the mineralized areas in the form of adits onthe hillsides.
Mineralized areas 20 m to 70 m in height are expected in several zones. Fair to good rock conditions are expected in the majority of the deposit. The underground mining methods envisaged are sublevel open stoping and room
and pillar without backfill. Mining recovery is assumed to vary from 65% to 85%. A bulk mining method with minimum stope size of 10 m x 10 m rooms with 15 m
height is assumed in order to attain a relatively high production rate of 7,500tonnes per day.
A more selective method with stopes size of 10 m x 10 m rooms with 5 m height isassumed to capture higher-grade material located on the thinner edges of themineralized zones.
An external dilution factor was not considered during this resource estimation.

Commerce Resources Corp.Blue River Tantalum–Niobium Project
British Columbia, CanadaNI 43-101 Technical Report on Mineral Resource Update
Project No.: 179115 Page 14-2318 March 2015
Internal dilution within the minimum stope size is considered. The concentration method considered is flotation followed by a refining process on
site; global metallurgical recoveries to obtain metal grade products were assumedto be 65.4% for Ta and 68.2% for Nb.
14.12.3 Block Unit Value
A block model was adapted to represent the two payable metal contents in terms ofBlock Unit Value (BUV) in US$/t using the following formula:
BUV = (Ta2O5 grade in ppm * Ta recovery factor * Ta price in US$/g * proportion of2Ta:Ta2O5) + (Nb2O5 grade in ppm * Nb recovery factor * Nb price in US$/g * proportionof 2Nb:Nb2O5)
For the base case scenario:
BUV = (Ta2O5 * 0.654 * 0.381 * 0.819) + (Nb2O5 * 0.682 * 0.046 * 0.699)
The tool “Stope Analyzer” from Vulcan® was utilized to identify the blocks that exceedthe cut-off value while complying with the aggregation constraint of minimum stope size.This tool “floats” a stope with the specified dimensions and flags each block when theaverage block unit value of the contained blocks within a stope exceeds the designatedcut-off value.
For constraining resources deemed to be mined by underground methods, the use ofthis tool as an alternative to a conventional economic grade-shell provides an advantagebased on the ability to aggregate blocks into the minimum stope dimensions and theautomatic elimination of outliers that do not comply with this condition.
14.12.4 Economic Cut-Off Assumptions
The Mineral Resources have been assessed for reasonable prospects for eventualeconomic extraction using assumptions based on similar deposits. The operating costand price assumptions used to constrain the current mineral resource estimate are listedin Table 14-7.
Table 14-7: 2013 Economic Cut-Off Assumptions
Cost ItemBulk MiningUS$/tonne
Selective MiningUS$/tonne
Total Mining Costs $27 $48Total Processing Costs $15 $15

Commerce Resources Corp.Blue River Tantalum–Niobium Project
British Columbia, CanadaNI 43-101 Technical Report on Mineral Resource Update
Project No.: 179115 Page 14-2418 March 2015
G&A $3 $3Total Costs $45 $66
Notes:1. Exchange Rate is US$0.95 = CAD$1.002. Base case scenario price of $US381/kg Ta metal in an oxide product3. Base case scenario price of $US46/kg Nb metal in an oxide product
Any changes in the metal prices or mining costs that may have occurred between 2013and 28 February 2015 are assumed to be offset by a weaker Canadian dollar comparedto the US dollar. For purposes of estimating the current Mineral Resources, anunderground mining cut-off value of US$45/t BUV is assumed for the material amenableto be mined by bulk methods; an underground mining cut-off value of US$66/t BUV isassumed for the material amenable to be mined by selective methods.
14.13 Mineral Resource Statement
Table 14-8 shows the estimated mineral resources. The Indicated Mineral Resourcesare 48.41 million tonnes at 197 ppm Ta2O5 and 1,610 ppm Nb2O5. Inferred MineralResources are 5.4 million tonnes at 191 ppm Ta2O5 and 1,760 ppm Nb2O5.
Table 14-8: Blue River Project Estimated Mineral Resource; Effective Date 28 February2015, Greg Kulla P.Geo
Ta price[US$/kg]
ConfidenceCategory Tonnes
Ta2O5
[ppm]Nb2O5
[ppm]
ContainedTa2O5
[1000s of kg]
ContainedNb2O5
[1000s of kg]
381 Indicated 48,410,000 197 1,610 9,560 77,810Inferred 5,400,000 191 1,760 1,000 9,600
Notes:1. Assumptions include commodity prices of US$381/kg Ta, US$46/kg Nb, process recoveries of 65.4%
for Ta2O5 and 68.2% for Nb2O5, US$27/tonne bulk mining cost and US$48/tonne selective mining cost,US$15/tonne process and refining cost, US$3/tonne G&A cost
2. Mineral resources are amenable to underground mining methods and have been constrained to amineable shape using a “Stope Analyzer”
3. An economic cut-off was based on the estimated operating costs assuming either the bulk or selectivemining method. The block unit value cut-off was either US$45/t (bulk) or US$66/t (selective)
4. No allowances were made for mining losses or external dilution; planned internal dilution within theminimum stope size is included
5. In situ contained oxide reported. Discrepancies in contained oxide values are due to rounding.
Table 14-9 shows the sensitivity of the Blue River Mineral Resource to Ta metal price.Sensitivity to variable Ta metal prices are shown but could also represent sensitivity to

Commerce Resources Corp.Blue River Tantalum–Niobium Project
British Columbia, CanadaNI 43-101 Technical Report on Mineral Resource Update
Project No.: 179115 Page 14-2518 March 2015
varying mining or processing costs, or varying metallurgical recoveries, or a combinationof all of these factors.
Table 14-9: Blue River Project Sensitivity of Estimated Mineral Resources to Ta Price;Effective Date 28 February 2015, Greg Kulla P.Geo
Ta price[US$/kg]
ConfidenceCategory Tonnes
Ta2O5
[ppm]Nb2O5
[ppm]
ContainedTa2O5
[1000s ofkg]
ContainedNb2O5
[1000s of kg]
564 Indicated 56,570,000 191 1,460 10,800 82,350Inferred 6,600,000 187 1,670 1,200 11,000
470 Indicated 54,400,000 193 1,490 10,500 81,250
Inferred 6,200,000 189 1,690 1,200 10,500
381 Indicated 48,410,000 197 1,610 9,560 77,810Inferred 5,400,000 191 1,760 1,000 9,600
317 Indicated 41,189,000 201 1,760 8,280 72,670
Inferred 4,600,000 194 1,870 900 8,500272 Indicated 35,138,000 203 1,910 7,130 67,240
Inferred 3,800,000 196 1,990 700 7,600238 Indicated 29,916,000 204 2,030 6,110 60,740
Inferred 2,800,000 198 2,060 600 5,800
Note: Base case is in bold.
14.14 QP Comment
The supply and demand of Ta is changing in response to market conditions includingreduced mine production, increased concerns about conflict-Ta production in Africa,depletion of known strategic stockpiles, and curtailed exports from China. Ta priceshave increased and decreased coincident with this volatility. The US$381/kg base caseprice is approximately 10% greater than the current price for Ta metal scrap andrepresents approximately a $80/kg premium on tantalite concentrate. The higher pricefor Ta metal scrap compared to the price for Ta2O5 in concentrate is considered a proxyto the added value Commerce could recognize by refining the Blue River concentrate tohigh purity Ta2O5. There is a risk that the long term Ta price used in the base case maynot be obtained over the life of the project.
The exchange rate assumption used in determining the cut-off grade is greater than thecurrent exchange rate. A sustained lower exchange rate may allow for a reduction in themining, processing and G&A cost assumptions.

Commerce Resources Corp.Blue River Tantalum–Niobium Project
British Columbia, CanadaNI 43-101 Technical Report on Mineral Resource Update
Project No.: 179115 Page 14-2618 March 2015
Commerce has not initiated requests for expression of interests from potential buyers ofthe proposed Blue River products and has not negotiated any purchases or off-takeagreements but given the relatively early stage of evaluation of the project this is notunusual.
Amec Foster Wheeler is not aware of any environmental, permitting, legal, title, taxation,socio-economic or political factors that could materially affect the Mineral Resourceestimate.
Commerce Resources Corp.NI 43-101 Blue River Tantalum–Niobium Project
British Columbia, CanadaProject Update Report
Project No.: 179115 Page 15-118 March 2015
15.0 ADJACENT PROPERTIES
There are no adjacent properties that are relevant to the project.
Commerce Resources Corp.NI 43-101 Blue River Tantalum–Niobium Project
British Columbia, CanadaProject Update Report
Project No.: 179115 Page 16-118 March 2015
16.0 OTHER RELEVANT DATA AND INFORMATION
Amec Foster Wheeler is not aware of any other relevant data or required information forinclusion to make the report not misleading.

Commerce Resources Corp.NI 43-101 Blue River Tantalum–Niobium Project
British Columbia, CanadaProject Update Report
Project No.: 179115 Page 17-118 March 2015
17.0 INTERPRETATION AND CONCLUSIONS
Commerce has delineated a significant Ta- and Nb-rich carbonatite deposit near thecommunity of Blue River in central eastern British Columbia. The company holds 100%interest in the project which has very good access and supporting infrastructure.
Permitting, Environment, and Social
The Blue River project will require approval under the federal and provincialenvironmental assessment processes prior to receiving the necessary permits andauthorizations for construction and mine operation. Overall the environmental review ofa project is a process that can take 24 months to complete. TraditionalKnowledge/Traditional Use studies, as well as a detailed archaeological impactassessment will need to be undertaken.
Commerce has been pro-active with regard to environmental and socio-economicissues. Environmental monitoring, baseline studies and site investigations have beenongoing at the Blue River project site since the summer season of 2006. Kinetic testwork for acid rock drainage and metals leaching was initiated in 2010. First Nationsengagement, with respect to exploration activities, began in 2007, and will continue forthe duration of the Project.
Geological Setting, Mineralization, and Deposit Type
The geologic setting, mineralization and deposit type are well understood. Reviews byseveral structural geology experts, independent of Commerce, support the interpretationof a complexly folded carbonatite body. Careful logging has helped identify differingcarbonatite hosts and mineralization styles which have been examined throughmetallurgical testing.
Exploration and Drilling
Exploration and deposit delineation work has been completed in a professional manor.The quantity and quality of the drill collar location, down-hole survey, lithological,geotechnical, and, assay data collected is adequate to support the Mineral Resourceestimate.
Sample Preparation, Analyses, and Security
Due-diligence exercised by Commerce regarding the quality of the assays collected forthe 2010 and 2011 holes has resulted in increased confidence in XRF(F) results usedto support the Mineral Resource estimate.

Commerce Resources Corp.NI 43-101 Blue River Tantalum–Niobium Project
British Columbia, CanadaProject Update Report
Project No.: 179115 Page 17-218 March 2015
Mineral Processing and Metallurgical Test
Metallurgical testwork support the preparation of a Ta and Nb bearing concentrate withrecoveries of 65% and 68%. The proposed methods for refining the concentrate havebeen used in commercial applications but have not been demonstrated in test workdirectly on Blue River material. Testwork to date has not considered factors such aswater recycling.
Mineral Resources
The current grade estimation plan relied on multiple search orientations to account forthe structural complexity of the Upper Fir carbonatite, however, improvements in local-scale grade estimations may be possible, particularly within the limbs of folds.
While the 2009 to 2011 XRF(F) results are considered sufficiently accurate to supportclassification of Measured Mineral Resources, the current drill-hole spacing andmetallurgical testwork is considered sufficient to support classification of IndicatedMineral Resources.

Commerce Resources Corp.NI 43-101 Blue River Tantalum–Niobium Project
British Columbia, CanadaProject Update Report
Project No.: 179115 Page 18-118 March 2015
18.0 RECOMMENDATIONS
Amec Foster Wheeler recommends the following work program to support aPrefeasibility Study if Commerce decides to advance the project:
Assay Quality Control
Prepare new Standards supported by an industry-acceptable round robin program tosupport future assay work. This work is expected to require input from a geochemicalexpert plus support for collection of sample material. Total costs are estimated at $50K.
Resource Estimation
Use Local Anisotropy Kriging (LAK) to examine potential for improved local confidencein the grade estimate. The LAK estimate would take 2 months to complete and costapproximately $40,000. This cost assumes no additional drill-hole information is addedand the carbonatite shape used in the 2013 Mineral resource estimate is unchanged.
Drilling
Complete additional infill drilling to support classification of Measured MineralResources targeted in areas that would support the first five years of a proposed mineplan, as well as exploration/step-out holes, infrastructure condemnation holes, andhydrogeology holes. The program consists of 125 holes totalling 27,300 m assummarized in Table 18-1. Drilling is expected to take two years to complete and isestimated to cost $5.46M. Drilling costs are estimated at $200/m and includes directdrilling costs only.
Table 18-1: Proposed Drill-hole Summary
Hole Type# of
Holes Metres Cost
Condemnation 20 5,000 $ 1,000,000Condemnation-Hydrogeology 7 1,100 $ 200,0006” Pump test hole 1 100 $ 20,000Confidence / Haulage Infrastructure 9 2,100 $ 420,000Geology 11 3,000 $ 600,000Infill 77 16,000 $ 3,200,000Totals 125 27,300 $ 5,460,000

Commerce Resources Corp.NI 43-101 Blue River Tantalum–Niobium Project
British Columbia, CanadaProject Update Report
Project No.: 179115 Page 18-218 March 2015
Mineral Resource Update
Complete a Mineral Resource update incorporating new drilling results. This work isexpected to take four months and estimated to cost $450K
Mining Studies
Complete geotechnical and mining studies to develop geotechnical and hydrologicalmodels, refine mining method, development, and ventilation design. This work isexpected to take 12 months and is estimated to cost $750,000 (Table 18-2)
Table 18-2: Proposed Mining Studies BudgetGeotechnical Studies
Field Data Collection from drillingGeotechnical Model $ 80,000Geohydrological Model $ 150,000Rock Engineering Studies $ 80,000
Mining StudiesMining Method Selection $ 80,000Underground Access Selection $ 130,000Ventilation Study $ 130,000
Materials Handling Study $ 100,000
Total Estimate $ 750,000
Mineral Processing and Metallurgical Testing
Complete process and metallurgical testwork on Blue River metallurgical samples to:
Develop a six stage cleaning approach for Ta-Nb flotation, targeting recovery fromthe carbonate scavenger flotation stage and the optimization of reagents within thecarbonate stages as well as cleaning of carbonate concentrate.
Apply the optimized process flowsheet to composites representing the two principalmineralogical domains (CGB & FGB) to the locked cycle stage of testworkproviding a better indication of recovery and cleaner performance.
Complete settling and filtration tests on process tailings products to develop theinformation proposed in early design stages.
Determine the level of hardness variability within the deposit by Bond Work Index(BWI) testing of spatial samples.
Produce sufficient concentrate for proof of concept aluminothermic and chlorinationtests.

Commerce Resources Corp.NI 43-101 Blue River Tantalum–Niobium Project
British Columbia, CanadaProject Update Report
Project No.: 179115 Page 18-318 March 2015
Process concentrates through the aluminothermic procedure in order to confirmprocess selection and to provide sufficient material for final product chlorinationtesting.
Confirm the chlorination approach to producing final Ta and Nb products and toprovide process conditions for design.
Flotation, filtration, and hardness testwork is estimated at $500K. Preparation ofconcentrate is estimated at $400k. Aluminothermic testwork is estimated at $150K.Chlorination testwork is estimated at $500K.
Co-Disposal Studies
Complete a study of the co-disposal facility investigating the following items:
Alternatives Review Field Studies and Laboratory Testing Site Characterization and Design Criteria Hydrological and Surface Water Assessment Tailings Management Facility (TMF) Design Closure Plan
The work is expected to take five months to complete and is estimated to cost $400K.
Waste Rock Characterization
Review Additional Static Tests Additional Kinetic Tests Water Quality Effects Model
This work is expected to take 24 months to complete and to cost $350K
Environmental
Complete baseline studies to extend support local infrastructure. This work is expectedto take two years to complete and is estimated to cost $400K.
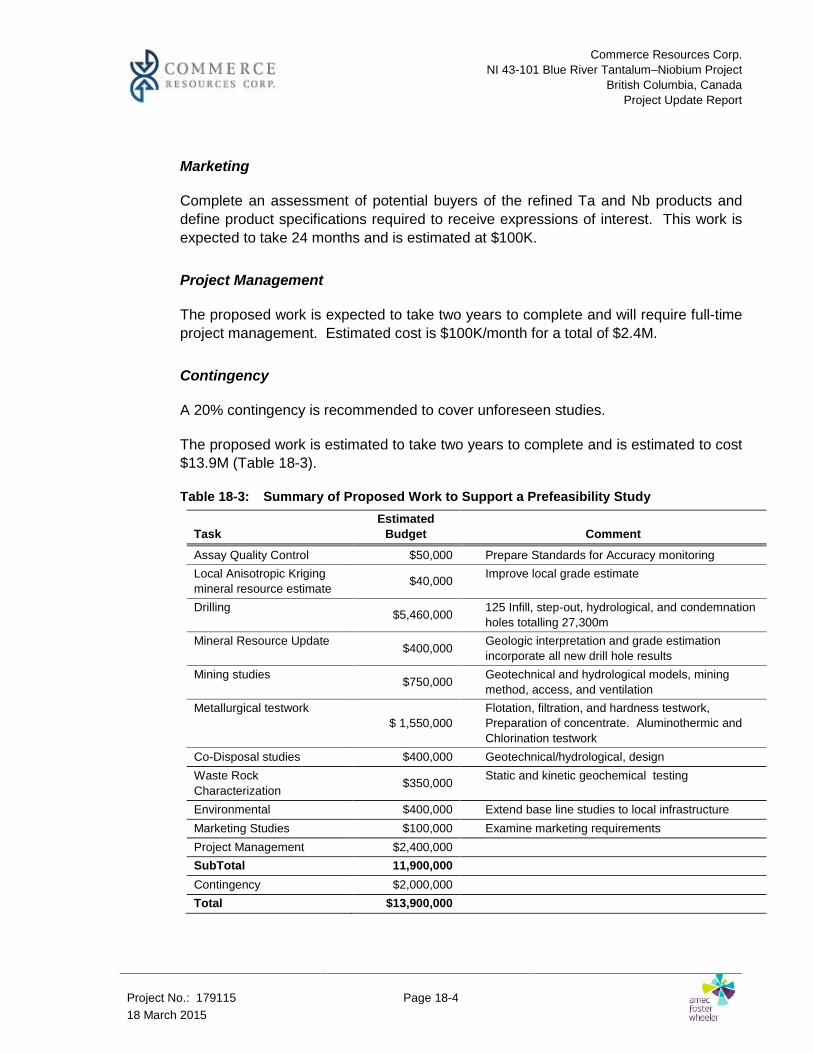
Commerce Resources Corp.NI 43-101 Blue River Tantalum–Niobium Project
British Columbia, CanadaProject Update Report
Project No.: 179115 Page 18-418 March 2015
Marketing
Complete an assessment of potential buyers of the refined Ta and Nb products anddefine product specifications required to receive expressions of interest. This work isexpected to take 24 months and is estimated at $100K.
Project Management
The proposed work is expected to take two years to complete and will require full-timeproject management. Estimated cost is $100K/month for a total of $2.4M.
Contingency
A 20% contingency is recommended to cover unforeseen studies.
The proposed work is estimated to take two years to complete and is estimated to cost$13.9M (Table 18-3).
Table 18-3: Summary of Proposed Work to Support a Prefeasibility Study
TaskEstimated
Budget Comment
Assay Quality Control $50,000 Prepare Standards for Accuracy monitoringLocal Anisotropic Krigingmineral resource estimate $40,000 Improve local grade estimate
Drilling $5,460,000 125 Infill, step-out, hydrological, and condemnationholes totalling 27,300m
Mineral Resource Update $400,000 Geologic interpretation and grade estimationincorporate all new drill hole results
Mining studies $750,000 Geotechnical and hydrological models, miningmethod, access, and ventilation
Metallurgical testwork$ 1,550,000
Flotation, filtration, and hardness testwork,Preparation of concentrate. Aluminothermic andChlorination testwork
Co-Disposal studies $400,000 Geotechnical/hydrological, designWaste RockCharacterization $350,000 Static and kinetic geochemical testing
Environmental $400,000 Extend base line studies to local infrastructureMarketing Studies $100,000 Examine marketing requirementsProject Management $2,400,000SubTotal 11,900,000Contingency $2,000,000Total $13,900,000

Commerce Resources Corp.NI 43-101 Blue River Tantalum–Niobium Project
British Columbia, CanadaProject Update Report
Project No.: 179115 Page 19-118 March 2015
19.0 REFERENCES
Aaquist, B., 1982a: Blue River Carbonatites, British Columbia: Final Report. B.C. Min.Energy, Mines Petr. Res. Ass. Rept. 10 274, 30 p.
Aaquist, B., 1982b: Assessment Report Blue River Carbonatites, British Columbia: B.C.Min. Energy Mines Petr. Res. Ass. Rept. 11 130, 15 p.
Aaquist, B., 1982c: Assessment Report on Verity First 1,2,3, Claims, Blue River BritishColumbia: B.C. Min. Energy Mines Petr. Res. Ass. Rept. 10 955.
AMEC, 2010a: Blue River Tantalum and Niobium Standards Round Robin Results Review.Internal memo prepared by AMEC for Commerce Resources Corp.
AMEC, 2012a: Blue River 2010 Drill Core Assay Program QC Sample Review. Internalmemo prepared by AMEC for Commerce Resources Corp.
AMEC, 2012b: Blue River 2011 Drill Core Assay Program QC Sample Review. Internalmemo prepared by AMEC for Commerce Resources Corp.
Birkett, T.C. and Simandl, G.J., 1999: Carbonatite-associated Deposits: Magmatic,Replacement and Residual: in Selected British Columbia Mineral Deposit Profiles,Volume 3, Industrial Minerals, G.J. Simandl, Z.D. Hora and D.V. Lefebure, Editors,British Columbia Ministry of Energy and Mines.
Brown, J., (2013a). Geological Nomenclature and Abbreviations. Internal memo preparedfor Commerce Resources Corp.
Brown, J., (2013b). Geological Units. Internal memo prepared for Commerce ResourcesCorp.
Brown, J., (2013c). Blue River – Structural Interpretation. Internal memo prepared forCommerce Resources Corp.
Canadian Institute of Mining, Metallurgy and Petroleum (CIM), (2014). Definition Standardsfor Mineral Resources and Mineral Reserves: May 10, 2014
Canadian Institute of Mining, Metallurgy and Petroleum (CIM), (2003). Estimation of MineralResources and Mineral Reserves Best Practice Guidelines.
Chong, A., 2010. Upper Fir Ta-Nb Project, Blue River, B.C., Site Visit Report – July 2010.Confidential AMEC Americas Ltd. report for Commerce Resources Corporation. 31p.

Commerce Resources Corp.NI 43-101 Blue River Tantalum–Niobium Project
British Columbia, CanadaProject Update Report
Project No.: 179115 Page 19-218 March 2015
Chong, A., 2011. Upper Fir Ta-Nb Project, Blue River, B.C., Site Visit Report – September2011. Confidential AMEC Americas Ltd. report for Commerce ResourcesCorporation. 43 p.
Chong, A., and Postolski, T., 2011: NI 43-101 Technical Report, Blue River Ta-Nb Project,Blue River, British Columbia. 145 p.
Chong, A., Postolski, P., Mendoza, R., Lipiec, T., and Omidvar, B., 2011. NI 43-101Technical Report on Preliminary Economic Assessment, Blue River Ta-Nb Project,Blue River, British Columbia, Canada. 208 p.
Chudy, T., 2008: Mineralogical Report on samples from the Upper Fir Carbonatite, BlueRiver, British Columbia. PART A: Petrographic description; PART B: MineralLiberation Analysis, December 2008.
Chudy, T., 2010: The Niobium-Tantalum Mineralization In The Upper Fir Carbonatite: ASummary Of Current Knowledge, 4 p.
Chudy, T. and Ulry, B., 2012. The Petrogrphy, Geochemistry and Mineral Chemistry of theUpper Fir Carbonatite System: an Update of Current Knowledge with Implicationsfor Exploration. Confidential report for Commerce Resource Corporation. 54p.
Couture, J.F. and Nash, I., 2011a: Upper Fir Site Visit Report. Confidential SRKmemorandum for Commerce Resources Corporation. 5p.
Couture, J.F. and Nash, I., 2011b. Blue River Site Visit. Confidential SRK memorandum forCommerce Resources Corporation. 10p.
Currie, K.L. 1976: The Alkaline Rocks of Canada: Geol. Surv. Can., Bull. 239, 228 p.
Dahrouge, J., 2001a: 2000 Geologic Mapping and Sampling on the Verity Property: B.C.Min. Energy, Mines Petr. Res. Ass. Rept 26550, 7 p.
Dahrouge, J., 2001b: 2000 Geologic Mapping and Sampling on the Fir Property: B.C. Min.Energy, Mines Petr. Res. Ass. Rept 26549, 7 p.
Dahrouge, J. and Reeder J., 2001: 2001 Geologic Mapping, Sampling and GeophysicalSurveys on the Mara Property: B.C. Min. Energy, Mines Petr. Res. Ass. Rept.26733, 14 p.
Dahrouge, J. and Reeder J., 2002: 2001 Geologic Mapping, Sampling and GeophysicalSurveys on the Fir Property: B.C. Min. Energy, Mines Petr. Res. Ass. Rept. 26781,9 p.

Commerce Resources Corp.NI 43-101 Blue River Tantalum–Niobium Project
British Columbia, CanadaProject Update Report
Project No.: 179115 Page 19-318 March 2015
Davis, C., 2006: 2005 Diamond Drilling and Exploration at the Blue River Property: B.C.Min. Energy Mines Petr. Res. Ass. Rept, 10 p.
Diegel, S.G., Ghent, E.D., and Simony, P.S., 1989: Metamorphism and Structure of theMount Cheadle area, Monashee Mountains: in Current Research, Part E, Geol.Surv. Can., Paper 89–1E, pp. 95–100.
Ghent, E.D., Simony, P.S., Mitchell, W., Perry, J., Robbins, D. and Wagner, J., 1977:Structure and Metamorphism in the Southeast Canoe River area, British Columbia:in Report of Activities, Part C, Geological Survey of Canada, Paper 77–1C, pp. 13–17.
Gervais, F., 2011. Summary Report - Integration of Surface and Underground Geology ofthe Upper Fir Carbonatite Deposit, Blue River, B.C., 4p.
Gervais, F., 2009: Personal Communication to John Gorham.
Gorham, J., 2007: Technical Report on the Upper Fir Ta-Nb Bearing Carbonatite 20 June2007, 48 p. plus appendices.
Gorham, J., 2008: Report on 2007 Diamond Drilling and Exploration at the Blue RiverProperty 20 June 2008: 48 p. plus appendices and maps.
Gorham, J., Ulry, B. And Brown, J., 2009: 2008 Diamond Drilling and Exploration at the BlueRiver Property, Kamloops Mining Division B.C Ministry of Energy, Mines andPetroleum Resources, Assessment Report 31174, 79 p (plus appendices andmaps)..
Klohn, Crippen Berger, 2009a: Blue River-Upper Fir Deposit Tailings and Waste RockScoping Study: Prepared for Commerce Resources Corp.
Klohn, Crippen Berger, 2009b: Valemount Tailings Storage Options Scoping Study:Prepared for Commerce Resources Corp.
Kraft, J., 2010: Structural geology of the Upper Fir carbonatite deposit, Blue River, BritishColumbia: Confidential report for Dahrouge Geological Consulting Ltd. andCommerce Resources Corp., 15 p.
Kulla, G., Postolski, P., Mendoza, R., Lipiec, T., and Omidvar, B., 2013: CommerceResources Corporation, Blue River Tantalum–Niobium Project, British Columbia,Canada, NI 43-101 Technical Report on Mineral Resource Update

Commerce Resources Corp.NI 43-101 Blue River Tantalum–Niobium Project
British Columbia, CanadaProject Update Report
Project No.: 179115 Page 19-418 March 2015
Lee, C., 2012. Blue River Ta-Nb Project – Structural Geology Review. ConfidentialTouchstone Geoscience Inc. memorandum prepared for AMEC Americas Ltd. 5 p.
Mariano, A.N., 1982: Petrology, Mineralogy and Geochemistry of the Blue RiverCarbonatites: Confidential report, 130 p.
Mariano, A.N. 2000: Personal communication to J. Dahrouge.
MESH Environmental Inc. 2008: Static Test Characterization of Rock Units from the UpperFir Deposit, Blue River Tantalum-Niobium Project: Confidential report prepared forCommerce Resources, August 2008.
MESH Environmental Inc. 2009: Static Test Characterization Of Rock Units From The UpperFir Deposit, Blue River Tantalum-Niobium Project. Phase 2 Static Test Report:Confidential report prepared for Commerce Resources, April 2009.
McCrea, J. 2001: Summary Report on the Blue River Carbonatite Property, East-CentralBritish Columbia: Prepared for Commerce Resources Corp., 34 p.
McCrea, J. 2002: Fir Carbonatite Property, Resource Estimate: Prepared for CommerceResources Corp.
Mitchell, R.H., 2010: Niobium Mineralization in Carbonatites: Paragenesis and Origins: inInternational Workshop of Geology of Rare Metals, edited by Simandl, G.J. andLefebure, D.V., extended abstracts volume, November 9–10, 2010, Victoria, CanadaBritish Columbia Geological Survey, Open File 2010-10, pp 13–14.
Nicholas, D., 1992: SME Mining Engineering Handbook, 2nd Edition, Volume 2
Pell, J. 1987: Alkaline Ultrabasic Rocks in British Columbia: Carbonatites, NephelineSyenites, Kimberlites and Related Rocks: B.C. Min. Energy, Mines Petr. Res. OpenFile 1987-17, 109 p.
Pell, J. 1994: Carbonatites, Nepheline Syenites, Kimberlites and Related Rocks in BritishColumbia: B.C. Min. Energy, Mines, Petr. Res., Bulletin 88, 136 p.
Pell, J. and Hoy, T. 1989: Carbonatites in a Continental Margin Environment - the CanadianCordillera: in: Carbonatites: Genesis and Evolution (K. Bell, ed.). Unwin Hyman,London, UK. pp. 200–220.
Postolski, T. 2013: Blue River Project – 2013 Drillhole Spacing Study
Postolski, T. 2012: Blue River Project – Enhanced Drill Hole Spacing Study Results:Confidential report prepared for Commerce Resources Corp.

Commerce Resources Corp.NI 43-101 Blue River Tantalum–Niobium Project
British Columbia, CanadaProject Update Report
Project No.: 179115 Page 19-518 March 2015
Raeside, R.P. and Simony, P.S. 1983: Stratigraphy and Deformational History of the ScrippNappe, Monashee Mountains, British Columbia: Canadian Journal of EarthSciences, 20, pp. 639–650.
Rukhlov, A and Gorham, J. 2007: 2006 Diamond Drilling and Exploration at the Blue RiverProperty: B.C., Min. Energy, Mines Petr. Res. Ass. Rept. 29024, 383 p. withappendices.
Simonetti, A. 2008: Personal communication to John Gorham.
Simony, P.S., Ghent, E.D., Craw, D, Mitchell, W., and Robbins, D.B. 1980: Structural andMetamorphic Evolution of the Northeast Flank of the Shuswap Complex, SouthernCanoe River Area, British Columbia: Geological Society of America, Memoir 153,pp. 445-461.
Smith, M. and Dahrouge, J. 2002a: 2001 Diamond Drilling on the Fir Property: B.C. Min.Energy, Mines Petr. Res. Ass. Rept. 26911, 13 p. with appendices.
Smith, M. and Dahrouge, J. 2003: 2002 Diamond Drilling and Exploration on the Blue RiverProperty: B.C. Min. Energy, Mines Petr. Res. Ass. Rept. 27131, 20 p. withappendices.
Smith, T., 2008: Terrain stability study for the development of an environmental baseline forthe Fir Property near Blue River B.C: Confidential report prepared for CommerceResources Corp.
Stone, M., and Selway, J., 2010: Independent Technical Report, Blue River Property, BlueRiver, British Columbia, Canada. 116 p.
Thompson, G., 2011. Drill Hole Database Review and Audit of 2010 Drill Holes in the BlueRiver Ta-Nb Project. 16 p.
White, G.P.E. 1985: Further Notes on Carbonatites in Central British Columbia: B.C.Ministry of Energy, Mines and Petroleum Resources, Geological Fieldwork, 1984,Paper 1985-1, pp. 95-100.
Woolley, A.R. and Kempe, D.R.C. 1989: Carbonatites: Nomenclature, Average ChemicalCompositions, and Element Distribution: in: Carbonatites, Genesis and Evolution (K.Bell, ed.). Unwin Hyman, London. pp. 1–37.

Commerce Resources Corp.NI 43-101 Blue River Tantalum–Niobium Project
British Columbia, CanadaProject Update Report
Project No.: 179115 Appendix18 March 2015
A P P E N D I X ALIST OF C L A I M S

SCHEDULE A: BLUE RIVER MINERAL CLAIMS2015-Feb-23
Title Number Claim Name Owner Title Type Title Sub Type Map Number Issue Date Good To Date Status Area (ha)374665 FIR 3 142572 (100%) Mineral Claim 083D025 2000/feb/16 2023/mar/31 GOOD 25.0374670 FIR 8 142572 (100%) Mineral Claim 083D035 2000/feb/16 2023/mar/31 GOOD 25.0380034 MARA 5 142572 (100%) Mineral Claim 083D045 2000/aug/18 2023/mar/31 GOOD 25.0382164 FIR 11 142572 (100%) Mineral Claim 083D035 2000/oct/28 2023/mar/31 GOOD 500.0506262 142572 (100%) Mineral Claim 083D 2005/feb/08 2023/mar/31 GOOD 98.623506263 142572 (100%) Mineral Claim 083D 2005/feb/08 2023/mar/31 GOOD 295.727506264 142572 (100%) Mineral Claim 083D 2005/feb/08 2023/mar/31 GOOD 236.8506265 142572 (100%) Mineral Claim 083D 2005/feb/08 2023/mar/31 GOOD 79.069506267 142572 (100%) Mineral Claim 083D 2005/feb/08 2023/mar/31 GOOD 98.817506270 142572 (100%) Mineral Claim 083D 2005/feb/08 2023/mar/31 GOOD 1225.766506273 142572 (100%) Mineral Claim 083D 2005/feb/08 2023/mar/31 GOOD 1619.061506274 142572 (100%) Mineral Claim 083D 2005/feb/08 2023/mar/31 GOOD 1244.47506387 142572 (100%) Mineral Claim 083D 2005/feb/09 2023/mar/31 GOOD 98.638506391 142572 (100%) Mineral Claim 083D 2005/feb/09 2023/mar/31 GOOD 39.459506392 142572 (100%) Mineral Claim 083D 2005/feb/09 2023/mar/31 GOOD 39.46506393 142572 (100%) Mineral Claim 083D 2005/feb/09 2023/mar/31 GOOD 39.447506395 142572 (100%) Mineral Claim 083D 2005/feb/09 2023/mar/31 GOOD 39.452506397 142572 (100%) Mineral Claim 083D 2005/feb/09 2023/mar/31 GOOD 19.728506399 142572 (100%) Mineral Claim 083D 2005/feb/09 2023/mar/31 GOOD 79.084506401 142572 (100%) Mineral Claim 083D 2005/feb/09 2023/mar/31 GOOD 39.542506402 142572 (100%) Mineral Claim 083D 2005/feb/09 2023/mar/31 GOOD 19.768506403 142572 (100%) Mineral Claim 083D 2005/feb/09 2023/mar/31 GOOD 19.766506405 142572 (100%) Mineral Claim 083D 2005/feb/09 2023/mar/31 GOOD 19.765506407 142572 (100%) Mineral Claim 083D 2005/feb/09 2023/mar/31 GOOD 591.699506408 142572 (100%) Mineral Claim 083D 2005/feb/09 2023/mar/31 GOOD 118.38506423 142572 (100%) Mineral Claim 083D 2005/feb/09 2023/mar/31 GOOD 591.653506425 142572 (100%) Mineral Claim 083D 2005/feb/09 2023/mar/31 GOOD 157.847506426 142572 (100%) Mineral Claim 083D 2005/feb/09 2023/mar/31 GOOD 39.439506427 142572 (100%) Mineral Claim 083D 2005/feb/09 2023/mar/31 GOOD 19.717506428 142572 (100%) Mineral Claim 083D 2005/feb/09 2023/mar/31 GOOD 551.916506429 142572 (100%) Mineral Claim 083D 2005/feb/09 2023/mar/31 GOOD 78.924506430 142572 (100%) Mineral Claim 083D 2005/feb/09 2023/mar/31 GOOD 414.436506431 142572 (100%) Mineral Claim 083D 2005/feb/09 2023/mar/31 GOOD 315.765506433 142572 (100%) Mineral Claim 083D 2005/feb/09 2023/mar/31 GOOD 533.482506445 142572 (100%) Mineral Claim 083D 2005/feb/09 2023/mar/31 GOOD 355.921506450 142572 (100%) Mineral Claim 083D 2005/feb/09 2023/mar/31 GOOD 236.589506459 142572 (100%) Mineral Claim 083D 2005/feb/09 2023/mar/31 GOOD 473.37506461 142572 (100%) Mineral Claim 083D 2005/feb/09 2023/mar/31 GOOD 315.725506464 142572 (100%) Mineral Claim 083D 2005/feb/09 2023/mar/31 GOOD 78.95506466 142572 (100%) Mineral Claim 083D 2005/feb/09 2023/mar/31 GOOD 217.118506468 142572 (100%) Mineral Claim 083D 2005/feb/09 2023/mar/31 GOOD 355.271506473 142572 (100%) Mineral Claim 083D 2005/feb/09 2023/mar/31 GOOD 474.81506475 142572 (100%) Mineral Claim 083D 2005/feb/09 2023/mar/31 GOOD 395.675507391 142572 (100%) Mineral Claim 083D 2005/feb/17 2023/mar/31 GOOD 553.698530510 LIGHTNING 142572 (100%) Mineral Claim 083D 2006/mar/24 2023/mar/31 GOOD 494.525530511 LIGHTNING 2 142572 (100%) Mineral Claim 083D 2006/mar/24 2023/mar/31 GOOD 395.741530513 LIGHTNING 3 142572 (100%) Mineral Claim 083D 2006/mar/24 2023/mar/31 GOOD 217.556537452 PYRAMID 1 142572 (100%) Mineral Claim 083D 2006/jul/20 2023/mar/31 GOOD 493.795537454 PYRAMID 2 142572 (100%) Mineral Claim 083D 2006/jul/20 2023/mar/31 GOOD 494.024537456 PYRAMID 3 142572 (100%) Mineral Claim 083D 2006/jul/20 2023/mar/31 GOOD 197.674550560 MUD 10 142572 (100%) Mineral Claim 083D 2007/jan/29 2023/mar/31 GOOD 495.976550562 MUD 11 142572 (100%) Mineral Claim 083D 2007/jan/29 2023/mar/31 GOOD 475.2631550563 MUD 13 142572 (100%) Mineral Claim 083D 2007/jan/29 2023/mar/31 GOOD 454.3769550565 MUD 14 142572 (100%) Mineral Claim 083D 2007/jan/29 2023/mar/31 GOOD 376.8803550568 MUD15 142572 (100%) Mineral Claim 083D 2007/jan/29 2023/mar/31 GOOD 178.5237550603 ARIANE1 142572 (100%) Mineral Claim 083D 2007/jan/30 2023/mar/31 GOOD 493.6076550605 ARIANE2 142572 (100%) Mineral Claim 083D 2007/jan/30 2023/mar/31 GOOD 493.8371550607 ARIANE3 142572 (100%) Mineral Claim 083D 2007/jan/30 2023/mar/31 GOOD 493.6181550608 ARIANE4 142572 (100%) Mineral Claim 083D 2007/jan/30 2023/mar/31 GOOD 493.8457550609 ARIANE5 142572 (100%) Mineral Claim 083D 2007/jan/30 2023/mar/31 GOOD 493.6292550610 ARIANE6 142572 (100%) Mineral Claim 083D 2007/jan/30 2023/mar/31 GOOD 493.8557550612 ARIANE7 142572 (100%) Mineral Claim 083D 2007/jan/30 2023/mar/31 GOOD 473.8467550613 ARIANE8 142572 (100%) Mineral Claim 083D 2007/jan/30 2023/mar/31 GOOD 473.8462550614 ARIANE9 142572 (100%) Mineral Claim 083D 2007/jan/30 2023/mar/31 GOOD 493.7679550615 ARIANE10 142572 (100%) Mineral Claim 083D 2007/jan/30 2023/mar/31 GOOD 474.1587550616 ARIANE11 142572 (100%) Mineral Claim 083D 2007/jan/30 2023/mar/31 GOOD 493.4837550620 ARIANE12 142572 (100%) Mineral Claim 083D 2007/jan/30 2023/mar/31 GOOD 494.1158
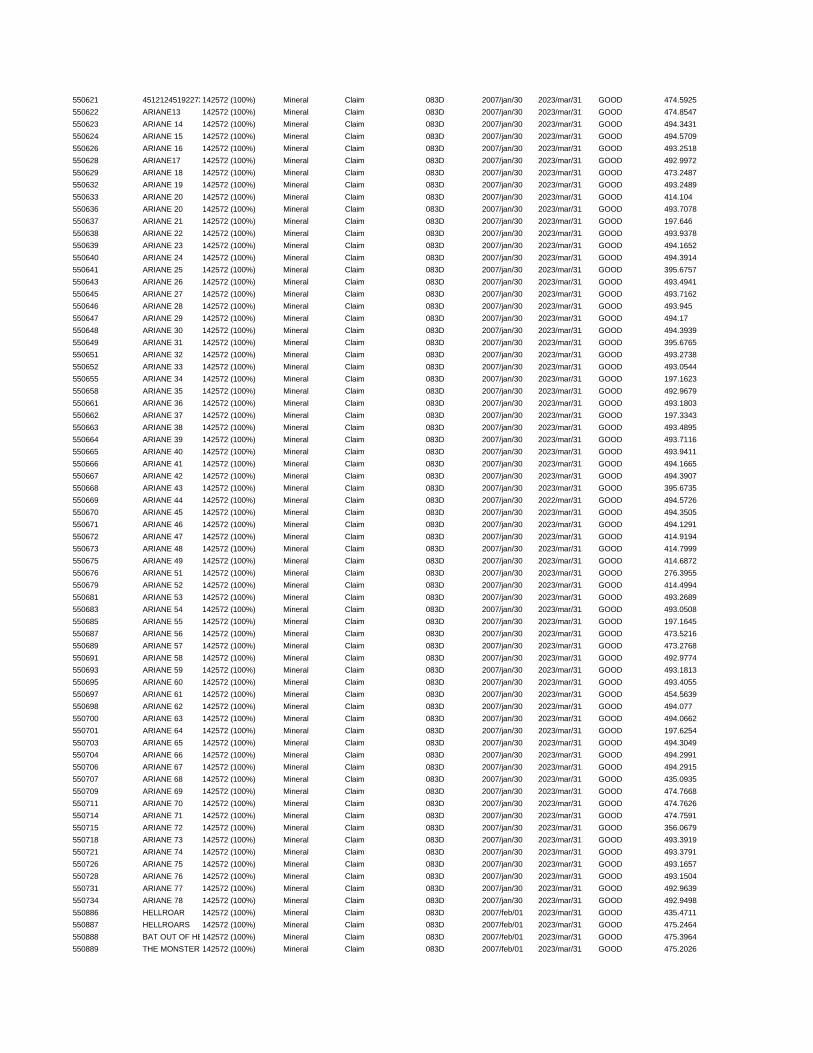
550621 45121245192273142572 (100%) Mineral Claim 083D 2007/jan/30 2023/mar/31 GOOD 474.5925550622 ARIANE13 142572 (100%) Mineral Claim 083D 2007/jan/30 2023/mar/31 GOOD 474.8547550623 ARIANE 14 142572 (100%) Mineral Claim 083D 2007/jan/30 2023/mar/31 GOOD 494.3431550624 ARIANE 15 142572 (100%) Mineral Claim 083D 2007/jan/30 2023/mar/31 GOOD 494.5709550626 ARIANE 16 142572 (100%) Mineral Claim 083D 2007/jan/30 2023/mar/31 GOOD 493.2518550628 ARIANE17 142572 (100%) Mineral Claim 083D 2007/jan/30 2023/mar/31 GOOD 492.9972550629 ARIANE 18 142572 (100%) Mineral Claim 083D 2007/jan/30 2023/mar/31 GOOD 473.2487550632 ARIANE 19 142572 (100%) Mineral Claim 083D 2007/jan/30 2023/mar/31 GOOD 493.2489550633 ARIANE 20 142572 (100%) Mineral Claim 083D 2007/jan/30 2023/mar/31 GOOD 414.104550636 ARIANE 20 142572 (100%) Mineral Claim 083D 2007/jan/30 2023/mar/31 GOOD 493.7078550637 ARIANE 21 142572 (100%) Mineral Claim 083D 2007/jan/30 2023/mar/31 GOOD 197.646550638 ARIANE 22 142572 (100%) Mineral Claim 083D 2007/jan/30 2023/mar/31 GOOD 493.9378550639 ARIANE 23 142572 (100%) Mineral Claim 083D 2007/jan/30 2023/mar/31 GOOD 494.1652550640 ARIANE 24 142572 (100%) Mineral Claim 083D 2007/jan/30 2023/mar/31 GOOD 494.3914550641 ARIANE 25 142572 (100%) Mineral Claim 083D 2007/jan/30 2023/mar/31 GOOD 395.6757550643 ARIANE 26 142572 (100%) Mineral Claim 083D 2007/jan/30 2023/mar/31 GOOD 493.4941550645 ARIANE 27 142572 (100%) Mineral Claim 083D 2007/jan/30 2023/mar/31 GOOD 493.7162550646 ARIANE 28 142572 (100%) Mineral Claim 083D 2007/jan/30 2023/mar/31 GOOD 493.945550647 ARIANE 29 142572 (100%) Mineral Claim 083D 2007/jan/30 2023/mar/31 GOOD 494.17550648 ARIANE 30 142572 (100%) Mineral Claim 083D 2007/jan/30 2023/mar/31 GOOD 494.3939550649 ARIANE 31 142572 (100%) Mineral Claim 083D 2007/jan/30 2023/mar/31 GOOD 395.6765550651 ARIANE 32 142572 (100%) Mineral Claim 083D 2007/jan/30 2023/mar/31 GOOD 493.2738550652 ARIANE 33 142572 (100%) Mineral Claim 083D 2007/jan/30 2023/mar/31 GOOD 493.0544550655 ARIANE 34 142572 (100%) Mineral Claim 083D 2007/jan/30 2023/mar/31 GOOD 197.1623550658 ARIANE 35 142572 (100%) Mineral Claim 083D 2007/jan/30 2023/mar/31 GOOD 492.9679550661 ARIANE 36 142572 (100%) Mineral Claim 083D 2007/jan/30 2023/mar/31 GOOD 493.1803550662 ARIANE 37 142572 (100%) Mineral Claim 083D 2007/jan/30 2023/mar/31 GOOD 197.3343550663 ARIANE 38 142572 (100%) Mineral Claim 083D 2007/jan/30 2023/mar/31 GOOD 493.4895550664 ARIANE 39 142572 (100%) Mineral Claim 083D 2007/jan/30 2023/mar/31 GOOD 493.7116550665 ARIANE 40 142572 (100%) Mineral Claim 083D 2007/jan/30 2023/mar/31 GOOD 493.9411550666 ARIANE 41 142572 (100%) Mineral Claim 083D 2007/jan/30 2023/mar/31 GOOD 494.1665550667 ARIANE 42 142572 (100%) Mineral Claim 083D 2007/jan/30 2023/mar/31 GOOD 494.3907550668 ARIANE 43 142572 (100%) Mineral Claim 083D 2007/jan/30 2023/mar/31 GOOD 395.6735550669 ARIANE 44 142572 (100%) Mineral Claim 083D 2007/jan/30 2022/mar/31 GOOD 494.5726550670 ARIANE 45 142572 (100%) Mineral Claim 083D 2007/jan/30 2023/mar/31 GOOD 494.3505550671 ARIANE 46 142572 (100%) Mineral Claim 083D 2007/jan/30 2023/mar/31 GOOD 494.1291550672 ARIANE 47 142572 (100%) Mineral Claim 083D 2007/jan/30 2023/mar/31 GOOD 414.9194550673 ARIANE 48 142572 (100%) Mineral Claim 083D 2007/jan/30 2023/mar/31 GOOD 414.7999550675 ARIANE 49 142572 (100%) Mineral Claim 083D 2007/jan/30 2023/mar/31 GOOD 414.6872550676 ARIANE 51 142572 (100%) Mineral Claim 083D 2007/jan/30 2023/mar/31 GOOD 276.3955550679 ARIANE 52 142572 (100%) Mineral Claim 083D 2007/jan/30 2023/mar/31 GOOD 414.4994550681 ARIANE 53 142572 (100%) Mineral Claim 083D 2007/jan/30 2023/mar/31 GOOD 493.2689550683 ARIANE 54 142572 (100%) Mineral Claim 083D 2007/jan/30 2023/mar/31 GOOD 493.0508550685 ARIANE 55 142572 (100%) Mineral Claim 083D 2007/jan/30 2023/mar/31 GOOD 197.1645550687 ARIANE 56 142572 (100%) Mineral Claim 083D 2007/jan/30 2023/mar/31 GOOD 473.5216550689 ARIANE 57 142572 (100%) Mineral Claim 083D 2007/jan/30 2023/mar/31 GOOD 473.2768550691 ARIANE 58 142572 (100%) Mineral Claim 083D 2007/jan/30 2023/mar/31 GOOD 492.9774550693 ARIANE 59 142572 (100%) Mineral Claim 083D 2007/jan/30 2023/mar/31 GOOD 493.1813550695 ARIANE 60 142572 (100%) Mineral Claim 083D 2007/jan/30 2023/mar/31 GOOD 493.4055550697 ARIANE 61 142572 (100%) Mineral Claim 083D 2007/jan/30 2023/mar/31 GOOD 454.5639550698 ARIANE 62 142572 (100%) Mineral Claim 083D 2007/jan/30 2023/mar/31 GOOD 494.077550700 ARIANE 63 142572 (100%) Mineral Claim 083D 2007/jan/30 2023/mar/31 GOOD 494.0662550701 ARIANE 64 142572 (100%) Mineral Claim 083D 2007/jan/30 2023/mar/31 GOOD 197.6254550703 ARIANE 65 142572 (100%) Mineral Claim 083D 2007/jan/30 2023/mar/31 GOOD 494.3049550704 ARIANE 66 142572 (100%) Mineral Claim 083D 2007/jan/30 2023/mar/31 GOOD 494.2991550706 ARIANE 67 142572 (100%) Mineral Claim 083D 2007/jan/30 2023/mar/31 GOOD 494.2915550707 ARIANE 68 142572 (100%) Mineral Claim 083D 2007/jan/30 2023/mar/31 GOOD 435.0935550709 ARIANE 69 142572 (100%) Mineral Claim 083D 2007/jan/30 2023/mar/31 GOOD 474.7668550711 ARIANE 70 142572 (100%) Mineral Claim 083D 2007/jan/30 2023/mar/31 GOOD 474.7626550714 ARIANE 71 142572 (100%) Mineral Claim 083D 2007/jan/30 2023/mar/31 GOOD 474.7591550715 ARIANE 72 142572 (100%) Mineral Claim 083D 2007/jan/30 2023/mar/31 GOOD 356.0679550718 ARIANE 73 142572 (100%) Mineral Claim 083D 2007/jan/30 2023/mar/31 GOOD 493.3919550721 ARIANE 74 142572 (100%) Mineral Claim 083D 2007/jan/30 2023/mar/31 GOOD 493.3791550726 ARIANE 75 142572 (100%) Mineral Claim 083D 2007/jan/30 2023/mar/31 GOOD 493.1657550728 ARIANE 76 142572 (100%) Mineral Claim 083D 2007/jan/30 2023/mar/31 GOOD 493.1504550731 ARIANE 77 142572 (100%) Mineral Claim 083D 2007/jan/30 2023/mar/31 GOOD 492.9639550734 ARIANE 78 142572 (100%) Mineral Claim 083D 2007/jan/30 2023/mar/31 GOOD 492.9498550886 HELLROAR 142572 (100%) Mineral Claim 083D 2007/feb/01 2023/mar/31 GOOD 435.4711550887 HELLROARS 142572 (100%) Mineral Claim 083D 2007/feb/01 2023/mar/31 GOOD 475.2464550888 BAT OUT OF HE142572 (100%) Mineral Claim 083D 2007/feb/01 2023/mar/31 GOOD 475.3964550889 THE MONSTER 142572 (100%) Mineral Claim 083D 2007/feb/01 2023/mar/31 GOOD 475.2026

565127 PROSPER 1 142572 (100%) Mineral Claim 083D 2007/aug/28 2023/mar/31 GOOD 475.099565128 PROSPER 2 142572 (100%) Mineral Claim 083D 2007/aug/28 2023/mar/31 GOOD 474.9845565129 PROPSER 3 142572 (100%) Mineral Claim 083D 2007/aug/28 2023/mar/31 GOOD 494.7982565130 PROSPER 4 142572 (100%) Mineral Claim 083D 2007/aug/28 2023/mar/31 GOOD 237.5248565131 PROSPER 5 142572 (100%) Mineral Claim 083D 2007/aug/28 2023/mar/31 GOOD 494.798565132 PROSPER 6 142572 (100%) Mineral Claim 083D 2007/aug/28 2023/mar/31 GOOD 494.799565133 PROSPER 7 142572 (100%) Mineral Claim 083D 2007/aug/28 2023/mar/31 GOOD 494.7994565135 PROSPER 8 142572 (100%) Mineral Claim 083D 2007/aug/28 2023/mar/31 GOOD 494.7979565136 PROSPER 9 142572 (100%) Mineral Claim 083D 2007/aug/28 2023/mar/31 GOOD 494.8015565138 PROSPER 10 142572 (100%) Mineral Claim 083D 2007/aug/28 2023/mar/31 GOOD 494.8003565139 PROSPER 11 142572 (100%) Mineral Claim 083D 2007/aug/28 2023/mar/31 GOOD 494.7982565140 PROSPER 12 142572 (100%) Mineral Claim 083D 2007/aug/28 2023/mar/31 GOOD 475.1588565141 PROSPER 13 142572 (100%) Mineral Claim 083D 2007/aug/28 2023/mar/31 GOOD 475.1812565143 PROSPER 14 142572 (100%) Mineral Claim 083D 2007/aug/28 2023/mar/31 GOOD 475.1819565144 PROSPER 15 142572 (100%) Mineral Claim 083D 2007/aug/28 2023/mar/31 GOOD 475.1839565145 PROSPER 15 142572 (100%) Mineral Claim 083D 2007/aug/28 2023/mar/31 GOOD 475.1849565146 PROSPER 16 142572 (100%) Mineral Claim 083D 2007/aug/28 2023/mar/31 GOOD 475.1878565147 PROSPER 17 142572 (100%) Mineral Claim 083D 2007/aug/28 2023/mar/31 GOOD 178.195565148 PROSPER 18 142572 (100%) Mineral Claim 083D 2007/aug/28 2023/mar/31 GOOD 336.7507565149 PROSPER 19 142572 (100%) Mineral Claim 083D 2007/aug/28 2023/mar/31 GOOD 495.1628565150 PROSPER 20 142572 (100%) Mineral Claim 083D 2007/aug/28 2023/mar/31 GOOD 495.1627565152 PROSPER 21 142572 (100%) Mineral Claim 083D 2007/aug/28 2023/mar/31 GOOD 495.164565153 PROSPER 22 142572 (100%) Mineral Claim 083D 2007/aug/28 2023/mar/31 GOOD 396.1312565154 PROSPER 23 142572 (100%) Mineral Claim 083D 2007/aug/28 2023/mar/31 GOOD 396.1312565156 PROSPER 25 142572 (100%) Mineral Claim 083D 2007/aug/28 2023/mar/31 GOOD 495.1664565157 PROSPER 26 142572 (100%) Mineral Claim 083D 2007/aug/28 2023/mar/31 GOOD 396.1327565158 PROSPER 27 142572 (100%) Mineral Claim 083D 2007/aug/28 2023/mar/31 GOOD 396.1328565159 PROSPER 28 142572 (100%) Mineral Claim 083D 2007/aug/28 2023/mar/31 GOOD 455.5466565160 PROSPER 29 142572 (100%) Mineral Claim 083D 2007/aug/28 2023/mar/31 GOOD 495.4003565161 PROSPER 30 142572 (100%) Mineral Claim 083D 2007/aug/28 2023/mar/31 GOOD 495.3904565162 PROSPER 31 142572 (100%) Mineral Claim 083D 2007/aug/28 2023/mar/31 GOOD 495.3914565163 PROSPER 31 142572 (100%) Mineral Claim 083D 2007/aug/28 2023/mar/31 GOOD 495.3913565164 PROSPER 32 142572 (100%) Mineral Claim 083D 2007/aug/28 2023/mar/31 GOOD 495.3917565165 PROSPER 33 142572 (100%) Mineral Claim 083D 2007/aug/28 2023/mar/31 GOOD 495.393565166 PROSPER 34 142572 (100%) Mineral Claim 083D 2007/aug/28 2023/mar/31 GOOD 495.393565167 PROSPER 35 142572 (100%) Mineral Claim 083D 2007/aug/28 2023/mar/31 GOOD 495.3941565168 PROSPER 35 142572 (100%) Mineral Claim 083D 2007/aug/28 2023/mar/31 GOOD 495.3947565169 PROSPER 36 142572 (100%) Mineral Claim 083D 2007/aug/28 2023/mar/31 GOOD 495.3944565170 PROSPER 37 142572 (100%) Mineral Claim 083D 2007/aug/28 2023/mar/31 GOOD 495.5681565171 SHADOW1 142572 (100%) Mineral Claim 083D 2007/aug/28 2023/mar/31 GOOD 495.6504565172 SHADOW 2 142572 (100%) Mineral Claim 083D 2007/aug/28 2023/mar/31 GOOD 436.1667565173 SHADOW 3 142572 (100%) Mineral Claim 083D 2007/aug/28 2023/mar/31 GOOD 495.6211565174 SHADOW 4 142572 (100%) Mineral Claim 083D 2007/aug/28 2023/mar/31 GOOD 495.6207565175 SHADOW 5 142572 (100%) Mineral Claim 083D 2007/aug/28 2023/mar/31 GOOD 495.6219565176 SHADOW 6 142572 (100%) Mineral Claim 083D 2007/aug/28 2023/mar/31 GOOD 495.6221565177 SHADOW 7 142572 (100%) Mineral Claim 083D 2007/aug/28 2023/mar/31 GOOD 495.6222565178 SHADOW 8 142572 (100%) Mineral Claim 083D 2007/aug/28 2023/mar/31 GOOD 495.6232565179 SHADOW 8 142572 (100%) Mineral Claim 083D 2007/aug/28 2023/mar/31 GOOD 317.1876565180 SHADOW 9 142572 (100%) Mineral Claim 083D 2007/aug/28 2023/mar/31 GOOD 475.9524565181 SHADOW 10 142572 (100%) Mineral Claim 083D 2007/aug/28 2023/mar/31 GOOD 475.9516565182 SHADOW 11 142572 (100%) Mineral Claim 083D 2007/aug/28 2023/mar/31 GOOD 495.8402565183 SHADOW 12 142572 (100%) Mineral Claim 083D 2007/aug/28 2023/mar/31 GOOD 495.9419565184 SHADOW 13 142572 (100%) Mineral Claim 083D 2007/aug/28 2023/mar/31 GOOD 495.9423565185 SHADOW 13 142572 (100%) Mineral Claim 083D 2007/aug/28 2023/mar/31 GOOD 495.9411565186 SHADOW 15 142572 (100%) Mineral Claim 083D 2007/aug/28 2023/mar/31 GOOD 456.3659565187 FALKOR 1 142572 (100%) Mineral Claim 083D 2007/aug/28 2023/mar/31 GOOD 456.0848565188 FALKOR 2 142572 (100%) Mineral Claim 083D 2007/aug/28 2023/mar/31 GOOD 495.763565189 FALKOR 3 142572 (100%) Mineral Claim 083D 2007/aug/28 2023/mar/31 GOOD 396.7453565190 FALKOR 4 142572 (100%) Mineral Claim 083D 2007/aug/28 2023/mar/31 GOOD 495.993565191 FALKOR 5 142572 (100%) Mineral Claim 083D 2007/aug/28 2023/mar/31 GOOD 374.6441565192 FALKOR 6 142572 (100%) Mineral Claim 083D 2007/aug/28 2023/mar/31 GOOD 496.1392565193 FALKOR 7 142572 (100%) Mineral Claim 083D 2007/aug/28 2023/mar/31 GOOD 473.7231565194 FALKOR 8 142572 (100%) Mineral Claim 083D 2007/aug/28 2023/mar/31 GOOD 496.4453565195 FALKOR 9 142572 (100%) Mineral Claim 083D 2007/aug/28 2023/mar/31 GOOD 496.3699565196 FALKOR 10 142572 (100%) Mineral Claim 083D 2007/aug/28 2023/mar/31 GOOD 476.5252565197 FALKOR 11 142572 (100%) Mineral Claim 083D 2007/aug/28 2023/mar/31 GOOD 496.401565198 FALKOR 12 142572 (100%) Mineral Claim 083D 2007/aug/28 2023/mar/31 GOOD 495.497565199 MINI 142572 (100%) Mineral Claim 083D 2007/aug/28 2023/mar/31 GOOD 39.7012565200 FALKOR 13 142572 (100%) Mineral Claim 083D 2007/aug/28 2023/mar/31 GOOD 476.5167565201 FALKOR 14 142572 (100%) Mineral Claim 083D 2007/aug/28 2023/mar/31 GOOD 357.3435565202 FALKOR 15 142572 (100%) Mineral Claim 083D 2007/aug/28 2023/mar/31 GOOD 496.1679

565203 FALKOR 15 142572 (100%) Mineral Claim 083D 2007/aug/28 2023/mar/31 GOOD 496.169565204 FALKOR 16 142572 (100%) Mineral Claim 083D 2007/aug/28 2023/mar/31 GOOD 377.0984565205 FALKOR 17 142572 (100%) Mineral Claim 083D 2007/aug/28 2023/mar/31 GOOD 476.7777565206 MINI 2 142572 (100%) Mineral Claim 083D 2007/aug/28 2023/mar/31 GOOD 39.6939565207 FALKOR 18 142572 (100%) Mineral Claim 083D 2007/aug/28 2023/mar/31 GOOD 437.0555565208 FALKOR 19 142572 (100%) Mineral Claim 083D 2007/aug/28 2023/mar/31 GOOD 496.5879565209 FALKOR 20 142572 (100%) Mineral Claim 083D 2007/aug/28 2023/mar/31 GOOD 496.3959565210 FALKOR 21 142572 (100%) Mineral Claim 083D 2007/aug/28 2023/mar/31 GOOD 476.7461565211 FALKOR 22 142572 (100%) Mineral Claim 083D 2007/aug/28 2023/mar/31 GOOD 476.9548565212 FALKOR 23 142572 (100%) Mineral Claim 083D 2007/aug/28 2023/mar/31 GOOD 496.3943565213 FALKOR 24 142572 (100%) Mineral Claim 083D 2007/aug/28 2023/mar/31 GOOD 238.4882565214 FALKOR 25 142572 (100%) Mineral Claim 083D 2007/aug/28 2023/mar/31 GOOD 496.6332565215 FALKOR 26 142572 (100%) Mineral Claim 083D 2007/aug/28 2023/mar/31 GOOD 397.4372565216 FALKOR 27 142572 (100%) Mineral Claim 083D 2007/aug/28 2023/mar/31 GOOD 496.6269565217 FALKOR 28 142572 (100%) Mineral Claim 083D 2007/aug/28 2023/mar/31 GOOD 476.9699565218 FALKOR 29 142572 (100%) Mineral Claim 083D 2007/aug/28 2023/mar/31 GOOD 496.626565219 FALKOR 30 142572 (100%) Mineral Claim 083D 2007/aug/28 2023/mar/31 GOOD 496.863565220 FALKOR 31 142572 (100%) Mineral Claim 083D 2007/aug/28 2023/mar/31 GOOD 496.6276565221 FALKOR 32 142572 (100%) Mineral Claim 083D 2007/aug/28 2023/mar/31 GOOD 496.859565222 FALKOR 33 142572 (100%) Mineral Claim 083D 2007/aug/28 2023/mar/31 GOOD 397.1157565223 FALKOR 34 142572 (100%) Mineral Claim 083D 2007/aug/28 2023/mar/31 GOOD 496.8588565224 FALKOR 35 142572 (100%) Mineral Claim 083D 2007/aug/28 2023/mar/31 GOOD 496.6289588427 WASTED 1 142572 (100%) Mineral Claim 083D 2008/jul/18 2023/mar/31 GOOD 494.2937588428 WASTED 2 142572 (100%) Mineral Claim 083D 2008/jul/18 2023/mar/31 GOOD 474.3304588429 WASTED 3 142572 (100%) Mineral Claim 083D 2008/jul/18 2023/mar/31 GOOD 474.1507588430 WASTED 4 142572 (100%) Mineral Claim 083D 2008/jul/18 2023/mar/31 GOOD 473.977589537 FELIX1 142572 (100%) Mineral Claim 083D 2008/aug/05 2023/mar/31 GOOD 496.3964589538 FELIX2 142572 (100%) Mineral Claim 083D 2008/aug/05 2023/mar/31 GOOD 496.3976589539 FELIX3 142572 (100%) Mineral Claim 083D 2008/aug/05 2023/mar/31 GOOD 377.1036589540 FELIX4 142572 (100%) Mineral Claim 083D 2008/aug/05 2023/mar/31 GOOD 496.1697589541 FELIX5 142572 (100%) Mineral Claim 083D 2008/aug/05 2023/mar/31 GOOD 495.9655589542 FELIX6 142572 (100%) Mineral Claim 083D 2008/aug/05 2023/mar/31 GOOD 436.3101589544 FELIX7 142572 (100%) Mineral Claim 083D 2008/aug/05 2023/mar/31 GOOD 376.6839589551 FELIX8 142572 (100%) Mineral Claim 083D 2008/aug/05 2023/mar/31 GOOD 475.8199589554 FELIX9 142572 (100%) Mineral Claim 083D 2008/aug/05 2023/mar/31 GOOD 396.317589556 FELIX10 142572 (100%) Mineral Claim 083D 2008/aug/05 2023/mar/31 GOOD 495.4715589557 FELIX11 142572 (100%) Mineral Claim 083D 2008/aug/05 2023/mar/31 GOOD 415.9727589559 FELIX12 142572 (100%) Mineral Claim 083D 2008/aug/05 2023/mar/31 GOOD 495.1674589563 FELIX13 142572 (100%) Mineral Claim 083D 2008/aug/05 2023/mar/31 GOOD 356.6787