ni 43-101 technical report on a preliminary ... - encanto potash …€¦ · muskowekwan potash...
TRANSCRIPT
NI 43-101 Technical Report on a Preliminary Economic Assessment and Preliminary Feasibility Study of the
Muskowekwan Potash Project, South-Eastern Saskatchewan, Canada
Effective date: 24 May 2017
Prepared for:
Prepared by:
Encanto Potash Corp.
David M. Myers, P.Eng., Amec Foster Wheeler
Paul M. O’Hara, P.Eng. Amec Foster Wheeler
Tabetha A. Stirrett, P.Geo., CPG, North Rim
Douglas F. Hambley, Ph.D., P.E., P.Eng., P.G., Agapito Associates, Inc.
James Brebner, Eng., Novopro Projects Inc.
Preliminary Economic Assessment and Preliminary Feasibility Study
NI 43-101 Technical Report
Project No.: 194379
ii
Important Notice
This report was prepared as a NI 43-101 Technical Report for Encanto Potash Corp. by Amec Foster Wheeler Americas Limited (Amec Foster Wheeler). The quality of information, conclusions, and estimates contained within the Amec Foster Wheeler prepared content is consistent with the terms of reference, constraints, and circumstances under which the report was prepared by Amec Foster Wheeler and the report is based on: i) information available at the time of preparation, ii) data supplied by outside sources, and iii) the assumptions, conditions, and qualifications set forth in this report. This report is intended to be used by Encanto Potash Corp., subject to the terms and conditions of its contract with Amec Foster Wheeler. That contract permits Encanto Potash Corp. to file this report as with Canadian Securities Regulatory Authorities pursuant to Canadian provincial securities legislation. Except for the purposes legislated under Canadian provincial securities law, any use of this report by any third party is at that party's sole risk.

Preliminary Economic Assessment and Preliminary Feasibility Study
NI 43-101 Technical Report
Project No.: 194379
iii
Table of Contents
1 Summary ..................................................................................................................... 1-1
1.1 Introduction .................................................................................................................. 1-1
1.2 Terms of Reference ..................................................................................................... 1-1
1.3 Project Setting ............................................................................................................. 1-1
1.4 Mineral Tenure, Surface Rights, Royalties, and Agreements ....................................... 1-2
1.5 Geology and Mineralization ......................................................................................... 1-2
1.6 History ......................................................................................................................... 1-2
1.7 Drilling and Sampling ................................................................................................... 1-3
1.8 Data Verification .......................................................................................................... 1-3
1.9 Metallurgical Testwork ................................................................................................. 1-3
1.10 Mineral Resource Estimation ....................................................................................... 1-4
1.11 Mineral Resource Statement – PEA 2017 .................................................................... 1-5
1.12 Mineral Reserve Estimation ......................................................................................... 1-7
1.13 Mining Methods ........................................................................................................... 1-7
1.14 Recovery Methods ....................................................................................................... 1-7
1.15 Project Infrastructure ................................................................................................... 1-8
1.16 Market Studies and Contracts ...................................................................................... 1-8
1.17 Environmental Studies, Permitting, and Social or Community Impact .......................... 1-8
1.18 Capital and Operating Costs ........................................................................................ 1-9
1.19 Economic Analysis ....................................................................................................... 1-9
1.20 Adjacent Properties ................................................................................................... 1-10
1.21 Conclusions ............................................................................................................... 1-10
1.22 Recommendations ..................................................................................................... 1-11
1.23 2013 Pre-Feasibility Study ......................................................................................... 1-11
2 Introduction .................................................................................................................. 2-1
2.1 Introduction .................................................................................................................. 2-1
2.2 Terms of Reference ..................................................................................................... 2-1
2.3 Qualified Persons ........................................................................................................ 2-1
2.4 Site Visits and Scope of Personal Inspection ............................................................... 2-2
2.5 Effective Dates ............................................................................................................ 2-2
2.6 Information Sources and References ........................................................................... 2-2
2.7 Previous Technical Reports ......................................................................................... 2-2

Preliminary Economic Assessment and Preliminary Feasibility Study
NI 43-101 Technical Report
Project No.: 194379
iv
3 Reliance on Other Experts ........................................................................................... 3-1
3.1 Introduction .................................................................................................................. 3-1
3.2 Mineral Tenure ............................................................................................................ 3-1
3.3 Surface Rights ............................................................................................................. 3-1
3.4 Environmental .............................................................................................................. 3-1
3.5 Social and Community Impacts .................................................................................... 3-1
3.6 Taxation ....................................................................................................................... 3-2
3.7 Markets ........................................................................................................................ 3-2
4 Property Description and Location ............................................................................... 4-1
4.1 Introduction .................................................................................................................. 4-1
4.2 Property and Title in Saskatchewan ............................................................................. 4-1
4.3 Project Ownership ....................................................................................................... 4-1
4.4 Mineral Tenure ............................................................................................................ 4-3
4.5 Surface Rights ............................................................................................................. 4-3
4.6 Water Rights ................................................................................................................ 4-4
4.7 Royalties ...................................................................................................................... 4-4
4.8 Agreements ................................................................................................................. 4-4
4.9 Permitting Considerations ............................................................................................ 4-4
4.10 Environmental Considerations ..................................................................................... 4-5
4.11 Social License Considerations ..................................................................................... 4-6
5 Accessibility, Climate, Local Resources, Infrastructure, and Physiography .................. 5-1
5.1 Topography and Vegetation ......................................................................................... 5-1
5.2 Accessibility and Local Resources ............................................................................... 5-1
5.3 Climate ........................................................................................................................ 5-1
5.4 Infrastructure ............................................................................................................... 5-2
6 History.......................................................................................................................... 6-1
6.1 Project History ............................................................................................................. 6-1
6.2 2009 Seismic Program ................................................................................................ 6-1
6.3 2010 Seismic Program ................................................................................................ 6-2
6.4 2010 Drilling Program .................................................................................................. 6-7
6.5 2011 Resource Estimation ........................................................................................... 6-8
6.6 2011 Drilling Program .................................................................................................. 6-8
6.7 2012 Resource Estimation ........................................................................................... 6-9
6.8 2013 Preliminary Feasibility Study ............................................................................... 6-9

Preliminary Economic Assessment and Preliminary Feasibility Study
NI 43-101 Technical Report
Project No.: 194379
v
7 Geological Setting and Mineralization .......................................................................... 7-1
7.1 Regional Geology ........................................................................................................ 7-1
7.2 Local Geology and Potash Bearing Members .............................................................. 7-6
7.2.1 Patience Lake Member .................................................................................... 7-9
7.2.2 Belle Plaine Member ........................................................................................ 7-9
7.2.3 Esterhazy Member ......................................................................................... 7-10
7.3 Geological Cross Sections ......................................................................................... 7-13
7.4 Disturbances Affecting Geology of the Potash Bearing Members .............................. 7-15
7.5 Property Mineralization .............................................................................................. 7-17
7.5.1 Favorable Solution Mining Conditions ............................................................ 7-17
7.5.2 Carnallite Distribution ..................................................................................... 7-18
7.6 Additional Mineralization Comments .......................................................................... 7-18
8 Deposit Type ................................................................................................................ 8-1
9 Exploration ................................................................................................................... 9-1
9.1 Davidson Halite Interpretation and Potential Wet Dawson Bay .................................... 9-1
9.2 Second Red Bed Structural Dip ................................................................................... 9-4
9.3 Prairie Evaporite Collapse Interpretation ...................................................................... 9-4
9.4 Belle Plaine Carnallite .................................................................................................. 9-4
10 Drilling ........................................................................................................................ 10-1
10.1 2009 Drilling Program ................................................................................................ 10-1
10.2 2009 Drilling Procedures............................................................................................ 10-1
10.3 2009 Core Retrieval ................................................................................................... 10-1
10.4 2010 Drilling Program ................................................................................................ 10-2
10.5 2010 Drilling Procedures............................................................................................ 10-3
10.6 2010 Core Retrieval ................................................................................................... 10-4
10.7 2011 Drilling Program ................................................................................................ 10-5
10.8 2011 Drilling Procedures............................................................................................ 10-6
10.9 2011 Core Retrieval ................................................................................................... 10-7
11 Sample Preparation, Analyses, and Security.............................................................. 11-9
11.1 Geochemical Sampling .............................................................................................. 11-9
11.2 Controls on Sample Interval Determination ................................................................ 11-9
11.3 Sampling Method and Approach .............................................................................. 11-12
11.4 Sampling Method and Approach – For Geomechanical and Dissolution Samples ... 11-12
11.5 Sample Quantities and Dimensions ......................................................................... 11-13
Preliminary Economic Assessment and Preliminary Feasibility Study
NI 43-101 Technical Report
Project No.: 194379
vi
11.6 Sample Preparation, Analysis, and Security ............................................................ 11-13
12 Data Verification ......................................................................................................... 12-1
12.1 Assay-to-Gamma Data Verification ............................................................................ 12-1
12.2 Historical Drill Holes ................................................................................................... 12-3
13 Mineral Processing and Metallurgical Testing ............................................................ 13-1
13.1 Dissolution Test Work ................................................................................................ 13-1
14 Mineral Resource Estimates ...................................................................................... 14-1
14.1 Indian Mineral Lands ................................................................................................. 14-1
14.2 Assumptions and Methodology .................................................................................. 14-1
14.3 Regions Affected by Anomalies ................................................................................. 14-2
14.4 Mineral Resource....................................................................................................... 14-5
14.4.1 Inferred Mineral Resource .............................................................................. 14-5
14.4.2 Indicated Mineral Resource ............................................................................ 14-5
14.4.3 Measured Mineral Resource .......................................................................... 14-6
14.5 Potential Solution Mining Intervals ............................................................................. 14-6
15 Mineral Reserve Estimates ........................................................................................ 15-1
16 Mining Methods .......................................................................................................... 16-1
16.1 Geotechnical Testing ................................................................................................. 16-1
16.2 Laboratory Sylvinite Dissolution Testing .................................................................... 16-4
16.3 Mining Sequence ....................................................................................................... 16-4
17 Recovery Methods ..................................................................................................... 17-1
17.1 Introduction ................................................................................................................ 17-1
17.2 Major Process Design Criteria ................................................................................... 17-3
17.3 Process Plant Description .......................................................................................... 17-4
17.3.1 Well Field and Solution Mining ....................................................................... 17-4
17.3.2 Evaporation .................................................................................................... 17-4
17.3.3 Crystallization ................................................................................................. 17-4
17.3.4 Crystallization Pond ....................................................................................... 17-4
17.3.5 Debrining........................................................................................................ 17-5
17.3.6 Drying ............................................................................................................ 17-5
17.3.7 Screening ....................................................................................................... 17-5
17.3.8 Compaction .................................................................................................... 17-5
17.3.9 Loadout and Product Storage ......................................................................... 17-5
17.3.10 Reagent Storage and Preparation .............................................................. 17-6

Preliminary Economic Assessment and Preliminary Feasibility Study
NI 43-101 Technical Report
Project No.: 194379
vii
17.3.11 Brine Disposal ............................................................................................ 17-6
17.3.12 Tailings Management Area ......................................................................... 17-6
17.3.13 Process Water ............................................................................................ 17-6
17.3.14 Energy ........................................................................................................ 17-7
18 Project Infrastructure .................................................................................................. 18-1
18.1 Plant Site ................................................................................................................... 18-1
18.2 Utilities ....................................................................................................................... 18-3
18.2.1 Electrical Power ............................................................................................. 18-3
18.2.2 Steam Generation .......................................................................................... 18-3
18.2.3 Raw Water Supply ......................................................................................... 18-3
18.2.4 Natural Gas Supply ........................................................................................ 18-3
18.2.5 Telecommunications ...................................................................................... 18-3
18.3 Site Infrastructure ...................................................................................................... 18-4
18.4 Brinefield Piping ......................................................................................................... 18-4
18.5 Raw Water, Firewater, and Storm Water ................................................................... 18-4
18.6 Potable Water ............................................................................................................ 18-4
18.7 Cooling Towers .......................................................................................................... 18-5
18.8 Sewage Treatment Plant ........................................................................................... 18-5
18.9 Roads ........................................................................................................................ 18-5
18.10 Rail ............................................................................................................................ 18-5
18.11 Temporary Facilities .................................................................................................. 18-5
19 Market Studies and Contracts .................................................................................... 19-1
19.1 Preamble ................................................................................................................... 19-1
19.1.1 Demand for Potash (KCl) ............................................................................... 19-1
20 Environmental Studies, Permitting, and Social or Community Impact ........................ 20-1
20.1 Environmental Impact Assessment ............................................................................ 20-1
20.2 Environmental Management Framework ................................................................... 20-1
20.3 Waste, Tailings Management, and Water Management ............................................. 20-2
20.4 Permitting Requirements ........................................................................................... 20-3
20.5 Social and Community Impacts .................................................................................. 20-3
20.6 Site Closure and Reclamation ................................................................................... 20-4
21 Capital and Operating Costs ...................................................................................... 21-1
21.1 Capital Cost Estimate ................................................................................................ 21-1
21.1.1 Scope of Capital Cost Estimate ...................................................................... 21-1

Preliminary Economic Assessment and Preliminary Feasibility Study
NI 43-101 Technical Report
Project No.: 194379
viii
21.1.2 Basis of Estimate ........................................................................................... 21-1
21.1.3 Capital Cost Estimate Summary ..................................................................... 21-2
21.2 Operating Cost Estimate ............................................................................................ 21-2
21.2.1 Scope of Operating Cost Estimate ................................................................. 21-2
21.2.2 Labour ............................................................................................................ 21-3
21.2.3 Power ............................................................................................................. 21-3
21.2.4 Natural Gas .................................................................................................... 21-3
21.2.5 Rail Costs....................................................................................................... 21-3
21.2.6 Port Charges .................................................................................................. 21-3
21.2.7 Summary of Operating Costs ......................................................................... 21-4
22 Economic Analysis ..................................................................................................... 22-1
22.1.1 Scope ............................................................................................................. 22-1
22.1.2 Economic Model ............................................................................................. 22-1
22.1.3 Time Scale ..................................................................................................... 22-3
22.1.4 Outputs of the Economic Model ..................................................................... 22-4
23 Adjacent Properties .................................................................................................... 23-1
24 Other Relevant Data and Information ......................................................................... 24-1
24.14 Mineral Resource Estimates ...................................................................................... 24-1
24.14.1 Indian Mineral Lands .................................................................................. 24-1
24.14.2 Assumptions and Methodology ................................................................... 24-1
24.14.3 Regions Affected By Anomalies ................................................................. 24-2
24.14.4 Mineral Resource ....................................................................................... 24-5
24.14.5 Potential Solution Mining Intervals .............................................................. 24-5
24.15 Mineral Reserve Estimates ........................................................................................ 24-1
24.16 Mining Methods ......................................................................................................... 24-1
24.16.1 Geotechnical Testing .................................................................................. 24-1
24.16.2 Laboratory Sylvinite Dissolution Testing ..................................................... 24-4
24.16.3 Mining Sequence ........................................................................................ 24-4
24.17 Recovery Methods ..................................................................................................... 24-9
24.17.1 Introduction ................................................................................................ 24-9
24.17.2 Crystallization and Evaporation ................................................................ 24-10
24.17.3 Compaction, Screening, and Loadout ....................................................... 24-12
24.17.4 Storage Tanks and Pumps ....................................................................... 24-13
24.17.5 Brine Disposal .......................................................................................... 24-14

Preliminary Economic Assessment and Preliminary Feasibility Study
NI 43-101 Technical Report
Project No.: 194379
ix
24.17.6 Tailings Management Area ....................................................................... 24-14
24.17.7 Process Water .......................................................................................... 24-14
24.17.8 Crystallization Pond .................................................................................. 24-14
24.17.9 Energy ...................................................................................................... 24-15
24.18 Project Infrastructure ............................................................................................... 24-15
24.18.1 Plant Site .................................................................................................. 24-15
24.18.2 Utilities...................................................................................................... 24-15
24.18.3 Site Infrastructure ..................................................................................... 24-17
24.18.4 Brinefield Piping ....................................................................................... 24-17
24.18.5 Raw Water, Firewater, and Storm Water .................................................. 24-17
24.18.6 Potable Water........................................................................................... 24-18
24.18.7 Cooling Towers ........................................................................................ 24-18
24.18.8 Sewage Treatment Plant .......................................................................... 24-18
24.18.9 Roads ....................................................................................................... 24-18
24.18.10 Rail ......................................................................................................... 24-19
24.18.11 Temporary Facilities ............................................................................... 24-19
24.19 Market Studies and Contracts .................................................................................. 24-19
24.19.1 Preamble .................................................................................................. 24-19
24.19.2 Demand for Potash (KCl) .......................................................................... 24-19
24.21 Capital and Operating Costs .................................................................................... 24-22
24.21.1 Capex Estimate Scope and Methodology ................................................. 24-22
24.21.2 Basis of Estimate ...................................................................................... 24-22
24.21.3 Project Cost Summary .............................................................................. 24-22
24.21.4 Operating Cost Estimate ........................................................................... 24-23
24.22 Economic Analysis ................................................................................................... 24-24
24.22.1 Scope ....................................................................................................... 24-24
24.22.2 Economic Model ....................................................................................... 24-25
24.22.3 Outputs of the Economic Model ................................................................ 24-27
25 Interpretation and Conclusions ................................................................................... 25-1
25.1 Introduction ................................................................................................................ 25-1
25.2 Interpretations and Conclusions from 2017 PEA ........................................................ 25-1
25.2.1 Mineral Tenure, Surface Rights, Water Rights, Royalties, and Agreements ... 25-1
25.2.2 Geology and Mineralization ............................................................................ 25-1
25.2.3 Exploration, Drilling, and Analytical Data Collection in Support of Mineral Resource Estimation ...................................................................................... 25-1

Preliminary Economic Assessment and Preliminary Feasibility Study
NI 43-101 Technical Report
Project No.: 194379
x
25.2.4 Metallurgical Testwork.................................................................................... 25-2
25.2.5 Mineral Resource Estimates........................................................................... 25-2
25.2.6 Mineral Reserve Estimates ............................................................................ 25-2
25.2.7 Mine Plan ....................................................................................................... 25-2
25.2.8 Recovery Methods ......................................................................................... 25-2
25.2.9 Infrastructure .................................................................................................. 25-3
25.2.10 Environmental, Permitting and Social Considerations................................. 25-3
25.2.11 Capital Cost Estimates ............................................................................... 25-3
25.2.12 Operating Cost Estimates ........................................................................... 25-3
25.2.13 Economic Analysis ..................................................................................... 25-3
25.2.14 Risks and Opportunities ............................................................................. 25-4
25.2.15 Conclusions ................................................................................................ 25-4
25.3 Interpretations and Conclusions from 2013 PFS ........................................................ 25-4
25.3.1 2013 Mineral Resource .................................................................................. 25-4
25.3.2 2013 Mineral Reserves .................................................................................. 25-5
25.3.3 2013 Prefeasibility Study ................................................................................ 25-5
25.3.4 Additional Work .............................................................................................. 25-5
26 Recommendations ..................................................................................................... 26-1
26.1 Introduction ................................................................................................................ 26-1
26.2 Recommendations from 2017 PEA ............................................................................ 26-1
26.3 Recommendations from 2013 PFS ............................................................................ 26-1
27 References ................................................................................................................ 27-2
Tables
Table 1-1: Summary of 2009-2011 exploration programs (Source: North Rim) ............................ 1-3
Table 1-2: Average thickness and weighted-average mineralogical parameters of the potash zone (Source: North Rim) .................................................................................................... 1-4
Table 1-3: 2017 PEA Measured, Indicated and Inferred Resource Summary (Source: North Rim) ... .................................................................................................................................... 1-6
Table 1-4: Before and after income tax NPV and IRR for a 50 year life of potash production (Source: Novopro) ..................................................................................................... 1-14
Table 1-5: Measured, Indicated, and Inferred Mineral Resource summary for 2013 PFS (Source: North Rim) ................................................................................................................. 1-15
Table 6-1: Summary of 2009-2013 exploration programs (Source: North Rim) ............................ 6-1
Table 7-1: Solution intervals, KCl grade, total carnallite, and insolubles of project area drill holes (Source: North Rim) .................................................................................................. 7-12
Preliminary Economic Assessment and Preliminary Feasibility Study
NI 43-101 Technical Report
Project No.: 194379
xi
Table 12-1: Encanto drill holes with Assay vs. GREC correlation (Source: North Rim) ................ 12-1
Table 13-1: Salt content of primary production brine at 60°C cavern temperature (Source: Agapito) .................................................................................................................................. 13-2
Table 14-1: Areas affected by anomalies or buffers in the Belle Plaine Member (Source: North Rim) .................................................................................................................................. 14-2
Table 14-2: Deductible anomaly buffer sizes (Source: North Rim) ................................................ 14-2
Table 14-3: Resource summary for 2017 PEA– effective date 24 May 2017 (Source: North Rim) 14-8
Table 17-1: Major design criteria ................................................................................................... 17-3
Table 21-1: Capital costs .............................................................................................................. 21-2
Table 21-2: Labour force ............................................................................................................... 21-3
Table 21-3: Operating costs .......................................................................................................... 21-4
Table 22-1: Factors assumed in Royalty Estimate ........................................................................ 22-3
Table 22-2: Before and after income tax NPV and IRR for a 50 Year life of potash production ..... 22-4
Table 24-1: Areas affected by anomalies or buffers in the Belle Plaine Member (Source: North Rim) .................................................................................................................................. 24-2
Table 24-2: Deductible anomaly buffer sizes (Source: North Rim) ............................................... 24-3
Table 24-3: PFS Solution mining scenario resource summary – effective 31 January 2013 (Source: North Rim) ................................................................................................................. 24-1
Table 24-4: Proven and Probable Mineral Reserves (Source: Agapito)........................................ 24-2
Table 24-5: Project cost summary by major area ........................................................................ 24-23
Table 24-6: Labour force to operate facility ................................................................................. 24-23
Table 24-7: Estimated OPEX to produce 2.8 Mtpa of MOP ......................................................... 24-24
Table 24-8: Before and after income tax NPV and IRR for a 50 year life of potash production .... 24-27
Table 25-1: Resource thickness and grade parameters (Source: North Rim) ............................... 25-1
Figures
Figure 4-1: Regional location map of the Muskowekwan First Nations lands ................................. 4-2
Figure 5-1: General topographic features of the area along the matted 07-02-027-15W2 lease access road. Drill rig ensign 25 is shown in the distance. (Source: North Rim) ................................ 5-2
Figure 6-1: Features identified from seismic (RPS 2010, 2011 and 2012)...................................... 6-3
Figure 6-2: Second red bed structure map ..................................................................................... 6-4
Figure 6-3: Examples of collapse anomalies in the project area (RPS, 2010) ................................ 6-5
Figure 6-4: Second red beds depth surface viewed with 10 times vertical exaggeration (RPS, 2012)6-6
Figure 6-5: Map view of second red beds dip with mound outlines (Source: North Rim) ............... 6-7
Figure 7-1: Saskatchewan phanerozoic stratigraphic correlation chart. Modified from the Government of Saskatchewan website (Government of Saskatchewan Publications, 2014) ............... 7-2

Preliminary Economic Assessment and Preliminary Feasibility Study
NI 43-101 Technical Report
Project No.: 194379
xii
Figure 7-2: Regional Saskatchewan Prairie Evaporite Formation geological cross section ............ 7-4
Figure 7-3: Stratigraphy of the upper Prairie Evaporite Formation showing correlation between lithology and mineralogy of the Patience Lake and Belle Plaine Members and gamma-ray neutron geophysical wireline logs (Modified from (Fuzesy, 1982)) ................................................................... 7-5
Figure 7-4: Interpreted Stratigraphic column of the phanerozoic cover in the Lestock area. Note: Test holes did not penetrate geological bodies underlying the Prairie Evaporite Formation. ............... 7-7
Figure 7-5: Correlation of the Prairie Evaporite formation lithology and mineralogical character to gamma-ray and neutron geophysical wireline log signatures in well 15-16-027-15W2. ....................... 7-8
Figure 7-6: Interpreted isopach map of the top of the Patience Lake Member to the base of the Belle Plaine Member in the project area .................................................................................................... 7-11
Figure 7-7: East-west geological cross section (A – A’) through the five project area drill holes ... 7-14
Figure 7-8: Disturbances affecting the continuity of the potash-bearing members (Modified from (Halabura & Hardy, 2007)). ............................................................................................................... 7-16
Figure 9-1: Amplitude slice at Souris River Marker minus 2 ms with an area of thick Davidson halite outlined in brown (RPS, 2013) ............................................................................................................ 9-2
Figure 9-2: 2EB -13 ms amplitude slice illustrating localized zones of increased porosity (RPS, 2013) ......................................................................................................................... 9-3
Figure 9-3: Probability of BP carnallite and collapses (RPS, 2012) ................................................ 9-5
Figure 11-1: Photograph inside North Rim’s core lab and storage warehouse (Source: North Rim)11-9
Figure 11-2: Dry 2-horsepower band saw with dust collection system (Source: North Rim) ........ 11-11
Figure 11-3: Sampling interval from Encanto drill hole 02-30-027-14W2 (core 5, boxes 3 and 4) (Source: North Rim) ..................................................................................................................... 11-11
Figure 12-1: Estimated %K2O values 15-14-27-16W2 from Bannatyne estimation compared to SRC values (Source: North Rim) .............................................................................................................. 12-2
Figure 14-1: Area extent and mineral resource areas for the BP Member (Source: North Rim) .... 14-4
Figure 16-1: Mining steps from sump development to secondary mining planned for the Muskowekwan Project (Source: Agapito) ......................................................................................... 16-2
Figure 16-2: Life of mine plan showing range of recoverable tonnages per cavern (Source: Agapito)16-5
Figure 16-3: Cavern and pillar dimensions (Source: Agapito) ....................................................... 16-6
Figure 16-4: Typical well pad and cavern layout showing 14 caverns (28 wells) (Source: Agapito)16-7
Figure 16-5: Diagram of a submersible pump installed in the production well (Source: Agapito) ... 16-9
Figure 17-1: Site plan .................................................................................................................... 17-2
Figure 17-2: Block diagram of the processing plant ....................................................................... 17-3
Figure 18-1: Plant layout ................................................................................................................ 18-1
Figure 18-2: Site layout .................................................................................................................. 18-2
Figure 22-1: Cumulative Cash Flow .................................................................................................. 22-4
Figure 22-2: Sensitivity of the after-tax NPV .................................................................................. 22-5
Figure 22-3: Sensitivity of the after-tax IRR.................................................................................... 22-6

Preliminary Economic Assessment and Preliminary Feasibility Study
NI 43-101 Technical Report
Project No.: 194379
xiii
Figure 23-1: Adjacent properties .................................................................................................... 23-2
Figure 24-1: Area extent and mineral resource areas for the Belle Plaine Member ........................ 24-4
Figure 24-2: Cavern and pad layout in the Measured and Indicated Resource area. Note: No caverns are present in areas where BP carnallite anomalies have been defined by seismic (Source: Agapito). ....................................................................................................................... 24-1
Figure 24-3: Mining steps from sump development to secondary mining planned for the Muskowekwan Project (Source: Agapito) ......................................................................................... 24-2
Figure 24-4: Cavern and pillar dimensions (Source: Agapito) ....................................................... 24-5
Figure 24-5: Typical well pad and cavern layout (Source: Agapito) ............................................... 24-6
Figure 24-6: Diagram of a submersible pump installed in the production well (Source: Agapito) ... 24-8
Figure 24-7: Overall site plan (Source: Novopro) .......................................................................... 24-9
Figure 24-8: Overall plant model representation (Source: Novopro) ........................................... 24-10
Figure 24-9: Evaporation and crystallization circuit process diagram (Source: Novopro) ............ 24-11
Figure 24-10: Plant layout (Source: Novopro) ............................................................................... 24-15
Figure 24-11: Demand for KCl (Source: Fertecon Limited) ........................................................... 24-20
Figure 24-12: Outlook for potash prices FOB Vancouver (Source: Fertecon Limited) ................... 24-21
Figure 24-13: Sensitivity of the after-tax NPV (Source: Novopro) .................................................. 24-28
Figure 24-14: Sensitivity of the after-tax IRR (Source: Novopro) ................................................... 24-28
Preliminary Economic Assessment and Preliminary Feasibility Study
NI 43-101 Technical Report
Project No.: 194379
1-1
1 Summary
1.1 Introduction
This Technical Report was prepared by Amec Foster Wheeler Mining, North Rim Resources Ltd., and Agapito Associates, Inc., and Novopro Projects Inc. for Encanto Potash Corp to summarize Preliminary Economic Assessment (2017 PEA) and Pre-Feasibility Study (2013 PFS) results for the Muskowekwan Potash Project (the Project).
The 2017 PEA defines a higher production rate scenario with improved economic results than the 2013 PFS. The mineral exploration results and mine design concept from the 2013 PFS are unchanged and they support current Proven and Probable Mineral Reserves. The 2017 PEA is based only on Measured and Indicated Mineral Resources.
The 2013 PFS is also summarized in this Technical Report as a relevant alternative mine development scenario. A review of the economic analysis for the 2013 PFS shows a positive NPV at the potash prices assumed for the base case in the 2017 PEA. Thus while the 2013 PFS provides a lower economic return than that of the 2017 PEA, the 2013 PFS remains valid, including its Mineral Reserve statements.
In 2010, Encanto Potash Corp. formed a formal Joint Venture Agreement (JVA) with the Muskowekwan First Nations and Muskowekwan Resources Limited Partnership (MRL). The purpose of the JVA is to progressively develop plans to delineate a potash resource substantial enough to support a potential mining operation on the Muskowekwan First Nations’ land.
The Project Area is located on the Muskowekwan Indian Reserve 85 (IR85, AANDC Permit Number 368519) which is situated in south-eastern Saskatchewan approximately 100 km north-northeast of Regina. The project area is approximately 100 km south-east of BHP Billiton’s Jansen Project and approximately 125 km north-east of Mosaic’s Belle Plaine Mine.
The potash deposit consists of essentially flat-lying sedimentary deposits of interbedded halite (NaCl), sylvite (KCl), carnallite (KCl.MgCl2.6H2O), clay, and minor anhydrite and dolomite beds that extend from central Alberta through Saskatchewan and Manitoba in Canada to North Dakota and Montana, United States.
1.2 Terms of Reference
This Technical Report has been prepared for Encanto Potash Corp. (Encanto) to summarize the results of the 2017 PEA and 2013 PFS of its Muskowekwan Potash Project (the Project) and to support the press release dated 12-June-2017 by Encanto reporting positive economic results of the 2017 PEA and 2013 PFS studies.
1.3 Project Setting
The Project is located on Reserve lands of the Muskowekwan First Nation #85 as defined by the Indian Act of Canada. The Muskowekwan First Nation #85 is located near the town of Lestock in south-eastern Saskatchewan and is approximately 100 km north-northeast of Regina.

Preliminary Economic Assessment and Preliminary Feasibility Study
NI 43-101 Technical Report
Project No.: 194379
1-2
1.4 Mineral Tenure, Surface Rights, Royalties, and Agreements
The Project is owned by Encanto Potash Corp. Encanto is working in partnership with Muskowekwan Resources Limited, a legally incorporated entity wholly owned by the Muskowekwan First Nation and representing their interests. The Muskowekwan First Nation has secured mineral rights for its own reserve land and is legally entitled to assign development of mineral resources to another party.
In March 2017, Muskowekwan Resources Limited entered into an Indian Mining Regulations Mineral Lease with Her Majesty The Queen in Right of Canada, as represented by the Minister of the Department of Indian Affairs and Northern Development.
As the Project is the First Nations owned mineral lease and on First Nations land, the royalties payable will be unique. At the time of the PEA study the royalty rates and payees were not formally defined.
The PEA study has assumed royalties similar to other potash operations in Saskatchewan, and similar to the 2013 PFS study.
1.5 Geology and Mineralization
The potash deposit consists of essentially flat-lying sedimentary deposits of interbedded halite (NaCl), sylvite (KCl), carnallite (KCl.MgCl2.6H2O), clay, and minor anhydrite and dolomite beds that extend from central Alberta through Saskatchewan and Manitoba in Canada to North Dakota and Montana in the United States. The PE Formation deposits underlying and surrounding the Project Area were penetrated by seven surface drill holes. In addition, extensive 2D and 3D seismic surveys have been performed within the Project Area to identify anomalies and subsurface structures. Evaluation of borehole geophysical drill-hole logs, assays of cores cut through the PE Formation, and geological well-site reports show that the potash mineralization occurs within the Patience Lake (PL), BP and EM Members. In general, the potash-bearing beds consist of a mineralogically simple mixture of sylvite and halite together with minor clay, dolomite, anhydrite and carnallite.
The intervals containing sylvinite with economic interest have been identified as the PL and the BP Members. The EM may be of economic interest in some locations in Saskatchewan; however, the average grade is less than the 15% K2O cutoff used in this Technical Report and the carnallite concentration is 8.05% so it is not a potential resource in the Project Area. The PL and BP Members are deemed suitable beds for the recovery of sylvite (potash) by solution mining methods.
The potash-bearing beds are typically flat-lying and continuous, except where the mineralization has been modified either by intraformational erosional channels (i.e., washouts) or post-depositional replacement by halite (leach anomalies or salt horses).
1.6 History
Exploration activities were initiated in 2009 following the agreement between the Muskowekwan First Nation and Encanto Potash Corp. Table 1-1 summarizes the Exploration Programs for 2009 to 2011.

Preliminary Economic Assessment and Preliminary Feasibility Study
NI 43-101 Technical Report
Project No.: 194379
1-3
Table 1-1: Summary of 2009-2011 exploration programs (Source: North Rim)
Exploration Program Start Date Completion Date No. Lines / Area Covered
Meters Drilled
2D Seismic Survey May 2009 September 2009 241.57 km2 N/A
3D Seismic Survey November 2009 May 2010 223 km2 N/A
2D Interpretation October 2009 November 2009 N/A N/A
Drilling Program November 2009 December 2009 1 hole Drilled 1,392
3D Interpretation May 2010 December 2010 N/A N/A
Drilling Program October 2010 November 2010 4 holes Drilled 5,582
NI 43-101 Resource November 2010 April 2011 N/A N/A
Preliminary Economic Assessment April 2011 August 2011 N/A N/A
Drilling Program September 2011 October 2011 2 holes Drilled 2,525
3D Seismic Survey November 2012 December 2012 58.25 km2 N/A
Preliminary Feasibility Study January 2013 February 2013 N/A N/A
Notes:
N/A = Not Applicable
1.7 Drilling and Sampling
Since 2009 there have been 7 wells drilled on the property. The purpose of the wells was to test the distribution of the potash members and to define a mineral resource/reserve. All three potash members, with the exception of well 8-14-27-15W2 where the Esterhazy member was absent, were delineated in the 7 wells. Wireline geophysics, including resistivity, density, neutron, gamma ray and acoustic logs were completed in each well. Several drill stem tests were conducted to test potential water zones above the potash horizons. Geochemical analysis within the potash horizons was completed for every well. Rock mechanic testing and dissolution testing was completed for various samples in wells 8-14-27-15 and 02-30-27-14W2. The 2017 PEA is based on the drilling and sampling conducted prior to the 2013 PFS.
1.8 Data Verification
The authors are able to provide verification of the Encanto exploration programs and all associated geochemical data as they were involved in all aspects of the sampling process and carried out measures to ensure the security and integrity of the core. The sampling and assaying procedures detailed in Section 11 were of the highest quality and are compatible with procedures typically undertaken in industry. Tabetha Stirrett, the QP, has verified the data relied upon for all aspects of the Mineral Resource estimation.
1.9 Metallurgical Testwork
Geochemical testing consisting of core dissolution tests were performed to obtain basic data regarding the expected concentrations of potassium chloride (KCl), sodium chloride (NaCl) and other solutes in the brines produced in the solution mine caverns and sent to the processing plant.

Preliminary Economic Assessment and Preliminary Feasibility Study
NI 43-101 Technical Report
Project No.: 194379
1-4
Evaporation and crystallization of potash-bearing brines are proven technologies already used in commercial ventures, including several active mining potash mines in Saskatchewan. For this reason the process does not require additional metallurgical testing at this stage or any future phases of the Project. An assembly of cores from the last two explorations wells, Encanto Lestock 08-14-27-15 and Encanto Lestock 02-30-27-14, were sent to the NG Consulting laboratory in Germany for dissolution testing.
The core material was chosen to represent the PL and BP potash members, the ‘salt back’ above the PL member, the halite interbed between the PL and BP members and the halite interbed in the floor of the BP representing a range of naturally occurring rock variations in order to obtain an average brine grade with respect to the primary mining dissolution process.
With respect to the dissolution kinetics, it was found that the dissolution rates of the Encanto samples are in a range comparable to sylvinite found in similar deposits. The dissolution testing supported the design brine concentration of 148 g/L KCl and 254 g/L NaCl at a cavern temperature of 60°C.
1.10 Mineral Resource Estimation
The Mineral Resource as presented in this Technical Report assumes that the recovery of the potash will be by solution mining methods. Measured, Indicated and Inferred Mineral Resources have been estimated for the Project Area. In the 2013 PFS all the Measured and Indicated resources within the 3D seismic area were converted to Proven and Probable Mineral Reserves. Based on the revised mining parameters described in this PEA, the Mineral Resources included within the PEA mine plan remain Mineral Resources. There has been additional land acquired since the 2013 PFS, but those areas have not had Mineral Resources estimated.
Based on the solution mining methodology the interval of interest will be defined as the combined PL and BP Members, with the barren halite interbed left unmined. The mineable roof and floor contacts were based on a minimum K2O grade of 10% or 15.8% KCl with an average mineable grade over the entire interval of at least 15% K2O or 23.7% KCl. The EM was not included in the estimation. Table 1-2 reports the average thicknesses, grade and impurities of the PL and BP Members in the Project Area.
Table 1-2: Average thickness and weighted-average mineralogical parameters of the potash zone (Source: North Rim)
Mineralogical Resource Parameters
Member From (m) To (m)
Solution Interval Thickness (m)
KCl Grade Over Potash Zone (%)
Total Carnallite over Potash Zone (%)
Total Insolubles over Potash Zone (%)
Patience Lake 1184.22 1192.36 8.22 30.73 0.48 8.90
Interbed Salt 1192.36 1197.66 6.10 6.58 0.62 5.01
Belle Plaine 1197.66 1204.88 7.22 29.74 0.54 3.88
Note:
The Interbed Salt Member was not included in the Resource Estimation.

Preliminary Economic Assessment and Preliminary Feasibility Study
NI 43-101 Technical Report
Project No.: 194379
1-5
1.11 Mineral Resource Statement – PEA 2017
Table 1-3 summarizes the estimated Measured, Indicated, and Inferred Mineral Resource for the PL and BP Members within the Project Area. The interbed salt has not been included in the estimation.

Preliminary Economic Assessment and Preliminary Feasibility Study
NI 43-101 Technical Report
Project No.: 194379
1-6
Table 1-3: 2017 PEA Measured, Indicated and Inferred Resource Summary (Source: North Rim)
Effective Date of Table 1-3 is 24 May 2017 by T. Stirrett, P.Geo.
Member
Area with
Exclusions
(m2)
Weighted Average
Thickness (m)
Weighted Average K2O
Grade (%)
Weighted Average
KCl Grade (%)
Volume
(m3)
Gross In-Place
Sylvinite
Tonnage (MT)
In-Place K2O
Resource (MT)
In-Place KCl
Resource (MT)
Patience Lake 11,043,823 7.66 19.63 31.08 84,545,124 176 35 55
Belle Plaine 11,043,823 7.58 18.49 29.27 83,731,821 174 32 51
Total Excluding Interbed 15.24 168,276,945 350 67 106
Weighted Average Excluding Interbed 19.06 30.18
Member
Area with
Exclusions
(m2)
Weighted Average
Thickness (m)
Weighted Average K2O
Grade (%)
Weighted Average
KCl Grade (%)
Volume
(m3)
Gross In-Place
Sylvinite
Tonnage (MT)
In-Place K2O
Resource (MT)
In-Place KCl
Resource (MT)
Patience Lake 52,789,204 8.25 18.92 29.96 435,414,490 906 171 271
Belle Plaine 52,789,204 7.01 18.72 29.63 370,105,786 770 144 228
Total Excluding Interbed 15.26 805,520,276 1,675 315 499
Weighted Average Excluding Interbed 18.83 29.81
Member
Area with
Exclusions
(m2)
Weighted Average
Thickness (m)
Weighted Average K2O
Grade (%)
Weighted Average
KCl Grade (%)
Volume
(m3)
Gross In-Place
Sylvinite
Tonnage (MT)
In-Place K2O
Resource (MT)
In-Place KCl
Resource (MT)
Patience Lake 57,702,117 7.99 18.50 29.29 460,968,759 959 177 281
Belle Plaine 57,702,117 6.98 18.70 29.61 402,912,510 838 157 248
Total Including Interbed 14.97 863,881,268 1797 334 529
Weighted Average Excluding Interbed 18.60 29.44
Note: Deductions f or unknown anom al ies :
1. MT = Million Metric Tonnes Ins ide 3D: Measured = 5%
2. Density of Sylvinite = 2.08 T/m3Indicated = 9%
3. Gross In-Place Sylvinite is calculated based on Area x Thickness x Density (2080kg/m 3) Inferred = 15%
4. Gross Resource refers to Tonnage In-Place times Average Grade Outs ide 3D: Measured = N/A
5. KCl Resource = 1.583*K2O Resource Indicated = 15%
6. Weighted average thickness and K2O are weighted to In-Place Tonnage Inferred = 25%
Measured Resource Summary
Indicated Resource Summary
Inferred Resource Summary

Preliminary Economic Assessment and Preliminary Feasibility Study
NI 43-101 Technical Report
Project No.: 194379
1-7
1.12 Mineral Reserve Estimation
There are no Mineral Reserves resulting from the Preliminary Economic Assessment. The Measured and Indicated Mineral Resources in the 2017 PEA mine plan remain as Mineral Resources.
1.13 Mining Methods
Solution mining is planned for the recovery of the potash resource in the BP and PL Members, approximately 1,200 m below ground surface (BGS). Solution mining in each cavern will be initiated by drilling and completion of two wells, directionally drilled in the shape of s-bends from a single pad, such that the wells enter the potash vertically about 80 m apart. Solution mining of two potash beds (BP and PL Members) is anticipated and the sequence of mining will be to mine the lowest bed first, with mining progressing upward. Major mining steps will include well drilling, cavern development, primary mining, and secondary mining.
Selection of site-specific cavern dimensions is based on depth, in situ temperature, and rock mechanic considerations. Geotechnical testing of the cored samples was conducted at two rock mechanic laboratories. Dissolution testing was performed for the potash and salt samples from PL and BP Members as well as the salt interbed.
The wellfield cavern layout for a 48-year mine plan was generated within the Measured and Indicated Resource areas at the Muskowekwan project site, and was based on the proposed cavern and pillar dimensions, geological anomaly/carnallite exclusions, and surface facility isolations. The cavern layout is based on providing a pillar of unmined material between caverns to maintain isolation of the caverns and to support the overlying strata. The cavern dimensions and pillar sizing were selected to control cavern closure during mining. The cavern end radius is 75 m, and the spacing between the wells is 80 m. With a pillar width of 80 m, pillar and cavern dimensions result in a cavern spacing of 230 m by 310 m. This geometry results in an areal extraction ratio of 41.6% in those areas where an extensive regular pattern of caverns can be developed.
The well pad layout is based on the assumption that 14 caverns or 28 wells will be developed from a single pad using a walking rig or tabletop rig. Directional drilling will be used to provide a bottomhole separation distance of 80 m between the pair of wells for each cavern.
1.14 Recovery Methods
The proposed processing plant will have an average capacity of 3.4 Mt of potash. The plant will produce two products, namely granular and standard. The plant utilizes a combination of Multiple Effect Evaporation and a crystallization pons to process primary and secondary mining brines from the brinefield.
The brine from primary mining will be processed in two trains of evaporators followed by two trains of crystallizers. Each evaporator/crystallizer train is designed to produce 1.2 Mtpa. The brine from secondary mining will be processed in a crystallization pond with the solids harvested by dredging to produce 1.0 Mtpa. The solids from the crystallizer trains and the crystallization pond will be debrined, dried and screened to produce standard product. The
Preliminary Economic Assessment and Preliminary Feasibility Study
NI 43-101 Technical Report
Project No.: 194379
1-8
oversize and undersize fractions, and a portion of the standard fraction, which will vary depending on market conditions, will be fed to the compaction plant. In the compaction plant, three compaction circuits will produce granular material.
The standard and granular products will be sent to the product storage building. Material will be reclaimed from the product storage building and fed to the loadout building for final treatment prior to being loaded in railcars.
1.15 Project Infrastructure
The plant site will be accessed from Highway 35. The local grid road form Highway 35 to the site will be upgraded to support the increased project traffic.
Encanto is in discussions with third parties about the possibility of building a cogeneration facility near the plant site of the project that would use natural gas to generate electrical power. Power from this cogeneration facility will be sold to SaskPower and will be fed into the SaskPower grid. The basis of the design for the project includes the completion of the cogeneration by a third party supplier.
Power will be supplied from the main provincial power grid. The plant will tie into the grid at the cogeneration facility located near the plant sire.
The steam required for the process and heating will be sourced from the nearby cogeneration facility by capturing the heat generated from the generation of power in the form of steam. Natural gas will be used for product drying. Natural gas for the site will be supplied from the main natural gas supply line to the cogeneration facility.
Water will be supplied from Buffalo Pound Lake. A pipeline of approximately 150 km will be constructed from the regional pumphouse at Buffalo Pound to the plant site. The water will be stored in the raw water pond.
The site will be connected to the Canadian National Watrous line by a 5 km rail spur.
1.16 Market Studies and Contracts
In 2017, Encanto engaged RBC Capital Markets to provide information regarding historical and forecast developments in the potash industry and its markets.
Demand for potash averaged a compound annual growth rate (CAGR) of 2.8% per year from 2000 to 2010. From 2010 to 2016 the CAGR slowed to 1.6%. It is expected that from 2016 to 2020 the CAGR will be more in-line with the growth rate seen from 2000 to 2010 of 2.8%.
In view of the RBC Capital Markets outlook for pricing, the Encanto Project preliminary economic assessment be based on $319 per tonne FOB Vancouver for standard product ($313 in 2022) and $344 per tonne FOB Vancouver for granular product ($338 in 2022)
Add USD conversion rate used for RBC price.
All prices in this report are expressed in Canadian Dollars unless otherwise stated.
1.17 Environmental Studies, Permitting, and Social or Community Impact
No additional environmental work was completed since the 2013 PFS was completed.

Preliminary Economic Assessment and Preliminary Feasibility Study
NI 43-101 Technical Report
Project No.: 194379
1-9
Field work has commenced in the spring of 2017 to address new requirements as well as deficiencies found with the 2013 EIS was reviewed by regulators.
1.18 Capital and Operating Costs
The total CAPEX estimate for the 3.4 Mtpa facility is $3.73 billion for the initial phase plus $300 million for the deferred capital associated with secondary mining. The total CAPEX for the project is $4.03 billion.
Sustaining capital costs at the full production capacity of 3.4 Mtpa are estimated to be $35.98/product tonne.
Operating costs at the full production capacity of 3.4 Mtpa are estimated to be $42.86/product tonne for site costs, $50.05/product tonne for logistics and $41.95/product tonne for taxes and royalties.
1.19 Economic Analysis
The results of the economic analyses discussed in this section represent forward- looking information as defined under Canadian securities law. The results depend on inputs that are subject to a number of known and unknown risks, uncertainties and other factors that may cause actual results to differ materially from those presented here. Information that is forward-looking includes:
· Mineral Resource estimates
· Assumed commodity prices and exchange rates
· The proposed mine production plan
· Projected mining and process recovery rates
· Capital costs and operating costs
· Projected cash flows
· Assumptions as to closure costs and closure requirements
· Assumptions as to environmental, permitting and social risks
Additional detail on the factors and assumptions used and the risks regarding those factors and assumptions are provided in the relevant sections of the Technical Report.
For a 50 year mine life and a production rate of 3.4 Mtpa the following pre-tax financial parameters were calculated:
$1,133 million NPV (pre-tax, year -4) at 10% discount rate
18.9% IRR
5.9 year payback on $4.03 billion capital cost
The after-tax financial parameters are:
$816 million NPV (pre-tax, year -4) at 10% discount rate
17.7% IRR
9.9 year payback on $4.03 billion capital cost

Preliminary Economic Assessment and Preliminary Feasibility Study
NI 43-101 Technical Report
Project No.: 194379
1-10
Sensitivity analysis was performed on the project using potash price, capital cost, operating cost and discount rate. The project is most sensitive to changes in the potash price.
1.20 Adjacent Properties
Adjacent operating potash mines include the Potash Corporation of Saskatchewan (PCS) Lanigan underground potash mine approximately 88.0 km northwest of the Project Area, and the Mosaic Belle Plaine Solution Mine operated by The Mosaic Company located approximately 116.0 km southwest of the Project.
Projects in advanced stages of development include the following. K+S Potash Canada General Partnership (KSPC) is the holder of KPSA 002 south of the Project Area, and KLSA 009, which is northwest of Regina and is nearing operations status Yancoal Canada Resource Co., Ltd., holds the leases southwest (KL 242 and KL 243). BHP Billiton holds several leases to the northwest of the Project Area. Karnalyte Resources is an exploration company focused on KLSA 010 and KL 247 where they intend to develop carnallite and sylvite using solution mining methods. Karnalyte Resources has finished an Optimization Pilot Program in late 2016.
1.21 Conclusions
The 2017 PEA show that the:
Measured and Indicated Mineral Resources can support 3.4 Mtpa of potash production for 50 years.
estimated project capital cost is $3.92 billion, with sustaining capital estimated to be $35.98 per tonne of potash produced.
operating costs are estimated to be $42.86/tonne of potash produced for site costs, $50.05 /tonne for logistics and $41.95/tonne for taxes and royalties.
The project pre-tax economics are $1.133 billion NPV and 18.9% IRR. After tax economics are $0.816 billion NPV and 17.7% IRR.
Risks include:
Unexpected cost escalation.
Potash market price reduction, possibly caused by additional international production capacity.
Opportunities include:
Public and Government interest in promoting First Nations industries and employment.
First Nation business opportunities for power cogeneration, water supply.
First Nation business opportunities during project construction.

Preliminary Economic Assessment and Preliminary Feasibility Study
NI 43-101 Technical Report
Project No.: 194379
1-11
1.22 Recommendations
The 2017 PEA recommendations are to:
Complete field work to support the Environmental Impact Statement (EIS). Amend the EIS report with these new inputs and re-submit for regulatory approval. Estimated cost: $2 million.
Complete an updated Mineral Resource estimation that would include newly acquired lands and the incorporation of the 3D seismic in the north-east part of the property. Estimated cost: $50 thousand.
Conduct a Feasibility Study for the Project. Estimated cost: $7 million.
Assuming a positive outcome of the Feasibility Study, proceed to Front End Engineering and Design of the project. Estimated cost: $55 million.
Total estimated cost for the PEA recommendations are $57.05 million.
1.23 2013 Pre-Feasibility Study
In February 2013, Novopro, Agapito, Stantec, and North Rim completed a PFS for Encanto Resources Ltd. which reviewed economics, mineral resources and mineral reserves for the Muskowekwan property. The PFS on the Muskowekwan Project provided sufficient details to meet the requirements of the Association for the Advancement of Cost Engineering (AACE) Class 4 estimate with an accuracy of ±20% for the capital and operating cost estimates of this Project. These cost estimates formed the required input data to perform associated cash flow and sensitivity analysis.
A review of the economic analysis for the 2013 PFS shows a positive NPV at the potash prices assumed for the base case in the 2017 PEA. Thus while the 2013 PFS provides a lower economic return than that of the 2017 PEA, the 2013 PFS remains valid, including its Mineral Reserve statements.
The PFS included the following key deliverables:
Process Flow Diagrams
Trade-off Study: Evaporation and Crystallization Technology
Mass Balances
Equipment Specifications and vendor bids
Process Description
Site selection alternatives and recommendation
Performance Specifications and Design Criteria
Mechanical and Electrical Equipment Lists
Mining Plan
TMA Siting and Preliminary Design
Marketing and Logistical Plan
Trade-off Study: Cavern Temperature

Preliminary Economic Assessment and Preliminary Feasibility Study
NI 43-101 Technical Report
Project No.: 194379
1-12
Water Demand and Supply Alternatives
Trade-off Study: Energy Supply Alternatives
Economic Model
Resource and Reserve estimations
Estimates (CAPEX and OPEX)
General Arrangement Drawings
The Mineral Resource as presented in this Technical Report assumes that the recovery of the potash will be by solution mining methods. Measured, Indicated and Inferred Mineral Resources have been estimated for the Project Area.
In the 2013 PFS all the Measured and Indicated resources within the 3D seismic area were converted to Proven and Probable Mineral Reserves respectively.
For solution mining, the interval of interest is defined as the combined PL and BP Members with the barren halite interbed left unmined. The minable roof and floor contacts were based on a minimum K2O grade of 10% or 15.8% KCl with an average mineable grade over the entire interval of at least 15% K2O or 23.7% KCl. The Esterhazy Member was not included in the estimate. Table 1-5 reports the average thicknesses, grade and impurities of the PL and BP Members in the Project Area.
The Muskowekwan Project includes a solution mining Brinefield, tank farm, crystallization pond, evaporation and crystallization plant, drying and compaction plant, loadout (and temporary storage), salt storage area, as well as all necessary on-site and off-site infrastructure and utilities. The full scale plant production capacity is 2.8 Mtpa, including production from both primary and secondary mining.
The total CAPEX estimate for the 2.8 Mtpa plant is $2.86 billion for the initial phase, plus $130 million for the differed capital associated with secondary mining as well as production of the granular type of Muriate of Potash (MOP). This figure includes preliminary cost estimates for natural gas and water pipelines, as well as Cogeneration plant.
The total OPEX estimate for the 2.8 Mtpa plant is $54.32/tonne at the plant site, with rail and port costs totaling $50.50/tonne, and sustaining capital of $32.21/tonne.
The results of the economic analyses discussed in this section represent forward- looking information as defined under Canadian securities law. The results depend on inputs that are subject to a number of known and unknown risks, uncertainties and other factors that may cause actual results to differ materially from those presented here. Information that is forward-looking includes:
Mineral Resource and Mineral Reserve estimates
Assumed commodity prices and exchange rates
The proposed mine production plan
Projected mining and process recovery rates
Capital costs and operating costs
Projected cash flows
Assumptions as to closure costs and closure requirements

Preliminary Economic Assessment and Preliminary Feasibility Study
NI 43-101 Technical Report
Project No.: 194379
1-13
Assumptions as to environmental, permitting and social risks
Additional detail on the factors and assumptions used and the risks regarding those factors and assumptions are provided in section 24 of the Technical Report.
In the 2013 PFS the estimated after tax Net Present Value (NPV) of the Encanto Project is $2.838 billion, with an after tax Internal Rate of Return (IRR) of 18.0%, as listed in Table 1-4. A cash flow diagram illustrating the discounted gross revenues, capital expenditures, operational expenditures and net income (i.e., income after expenses, taxes, royalties and insurances) is presented in Figure 24-13. Note that Figure 24-14 illustrates the discounted cash flows. A pay-back period of 5.1 years was calculated based on the after-tax cash flows (non-discounted).
The after tax figures assume a tax rate similar to other potash projects being considered in the province, and not necessarily the exact tax rate applicable to this Project. These figures will require revision once the tax position of this Project is clarified.
The Muskowekwan PFS has significantly advanced the level of definition of this Project. It has determined that there are no technical impediments to prevent the Project from moving forward. The PFS, therefore, recommends continuing on to the full Feasibility Study (FS) as soon as possible to remain on track and maintain the Project timeline.
The results of the PFS were presented in a report dated 13 February 2013 (Novopro et al, 2013).
The results of the PFS are summarized in Section 24 of this Technical Report.
The 2013 PFS concluded that:
The property presents sufficient Proven and Probable Reserves to support 2.8 Mtpa of potash production for 58 years.
In 2013 dollars, the capital cost of the project was $2.99 billion.
The recommendations from 2013 PFS were as follows:
Phase 1
Continue studies to define reserves and complete a Feasibility Study and Environmental Baseline Study including:
1. Complete final interpretation of the 3D seismic survey over the newly acquired Treaty Land Entitlement (TLE) lands. Estimated cost: $20 thousand.
2. Complete a Feasibility Study including cavern layout, permitting, process design, infrastructure, utilities, transport, and marketing studies. Estimated cost: $9 million.
3. Complete an Environmental Baseline Study and EIS. Estimated cost: $2 million.
Total estimated cost for Phase 1: $11.02 million.
Phase 2
Conditional on favourable results for the Feasibility Study and after project approvals have been granted commence:
1. Bridge engineering of plant, well field, infrastructure, and utilities. Estimated cost: $15 million.
2. Basic detail engineering. Procurement of long-lead equipment. Estimated cost: $20 million.

Preliminary Economic Assessment and Preliminary Feasibility Study
NI 43-101 Technical Report
Project No.: 194379
1-14
3. Early site civil works. Estimated cost: $20 million.
Total estimated cost for Phase 2: $55 million.
Table 1-4: Before and after income tax NPV and IRR for a 50 year life of potash production (Source: Novopro)
Before and After Income Tax
NPV (CAD$) IRR (%)
Before Income Tax $4.118B 20.00%
After Income Tax $2.838B 18.00%
Notes:
*10% Discount Rate, 2% Inflation
** 460 FOB $/tonne Standard KCl, 485 FOB $/tonne Granular KCl
*** 4.0 $/GJ Natural Gas Rate
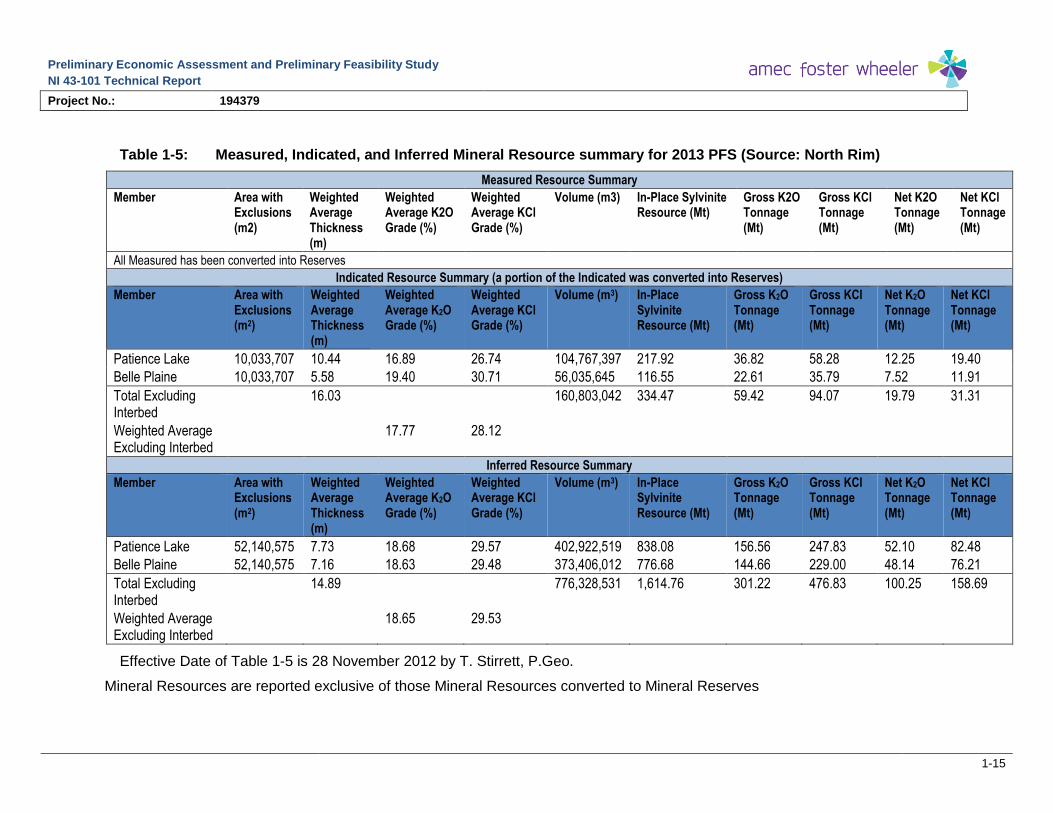
Preliminary Economic Assessment and Preliminary Feasibility Study
NI 43-101 Technical Report
Project No.: 194379
1-15
Table 1-5: Measured, Indicated, and Inferred Mineral Resource summary for 2013 PFS (Source: North Rim)
Measured Resource Summary
Member Area with Exclusions (m2)
Weighted Average Thickness (m)
Weighted Average K2O Grade (%)
Weighted Average KCl Grade (%)
Volume (m3) In-Place Sylvinite Resource (Mt)
Gross K2O Tonnage (Mt)
Gross KCl Tonnage (Mt)
Net K2O Tonnage (Mt)
Net KCl Tonnage (Mt)
All Measured has been converted into Reserves
Indicated Resource Summary (a portion of the Indicated was converted into Reserves)
Member Area with Exclusions (m2)
Weighted Average Thickness (m)
Weighted Average K2O Grade (%)
Weighted Average KCl Grade (%)
Volume (m3) In-Place Sylvinite Resource (Mt)
Gross K2O Tonnage (Mt)
Gross KCl Tonnage (Mt)
Net K2O Tonnage (Mt)
Net KCl Tonnage (Mt)
Patience Lake 10,033,707 10.44 16.89 26.74 104,767,397 217.92 36.82 58.28 12.25 19.40
Belle Plaine 10,033,707 5.58 19.40 30.71 56,035,645 116.55 22.61 35.79 7.52 11.91
Total Excluding Interbed
16.03 160,803,042 334.47 59.42 94.07 19.79 31.31
Weighted Average Excluding Interbed
17.77 28.12
Inferred Resource Summary
Member Area with Exclusions (m2)
Weighted Average Thickness (m)
Weighted Average K2O Grade (%)
Weighted Average KCl Grade (%)
Volume (m3) In-Place Sylvinite Resource (Mt)
Gross K2O Tonnage (Mt)
Gross KCl Tonnage (Mt)
Net K2O Tonnage (Mt)
Net KCl Tonnage (Mt)
Patience Lake 52,140,575 7.73 18.68 29.57 402,922,519 838.08 156.56 247.83 52.10 82.48
Belle Plaine 52,140,575 7.16 18.63 29.48 373,406,012 776.68 144.66 229.00 48.14 76.21
Total Excluding Interbed
14.89 776,328,531 1,614.76 301.22 476.83 100.25 158.69
Weighted Average Excluding Interbed
18.65 29.53
Effective Date of Table 1-5 is 28 November 2012 by T. Stirrett, P.Geo.
Mineral Resources are reported exclusive of those Mineral Resources converted to Mineral Reserves

Preliminary Economic Assessment and Preliminary Feasibility Study
NI 43-101 Technical Report
Project No.: 194379
1-16
Table 1-5 Notes:
Mt = million metric tonnes
Density of Sylvinite = 2.08 T/m3
In-Place Sylvinite is calculated based on Area × Thickness × Density (2,080 kg/m3)
Gross tonnage refers to Tonnage In-Place times Average Grade.
Net Resource based on 41.6% extraction ratio and 20% plant and cavern loss.
KCl Resource = 1.583*K2O Resource.
Weighted average thickness and K2O are weighted to In-Place Tonnage.
8-14 interbed salt was thin so it was included in the PL member resource interval.
Deductions for unknown anomalies:
Inside 3D:
Measured = 5%
Indicated = 9%
Inferred = 15%
Outside 3D:
Measured = N/A
Indicated = 15%
Inferred = 25%
Preliminary Economic Assessment and Preliminary Feasibility Study
NI 43-101 Technical Report
Project No.: 194379
2-1
2 Introduction
2.1 Introduction
This Technical Report was prepared by Amec Foster Wheeler Mining, North Rim Exploration Ltd., a wholly owned subsidiary of RESPEC (North Rim), and Agapito Associates for Encanto Potash Corp to summarize Preliminary Economic Assessment results for the Muskowekwan Potash Project (the Project).
In 2010, Encanto Potash Corp., formed a formal Joint Venture Agreement (JVA) with the Muskowekwan First Nations and Muskowekwan Resources Limited Partnership (MRL). The purpose of the JVA is to progressively develop plans to delineate a potash resource substantial enough to support a potential mining operation on the Muskowekwan First Nations’ land.
In March 2017, MRL entered into an Indian Mining Regulations Mineral Lease with Her Majesty The Queen in Right of Canada, as represented by the Minister of the Department of Indian Affairs and Northern Development.
The Project Area is located on the Muskowekwan Indian Reserve 85 (IR85, AANDC Permit Number 368519) which is situated in south-eastern Saskatchewan approximately 100 km north-northeast of Regina. The project area is approximately 100 km south-east of the PotashCorp Lanigan mine, 160 km northwest of the Mosaic K1 and K2 mines and 125 km north-east of Mosaic’s Belle Plaine Mine.
2.2 Terms of Reference
This Technical Report has been prepared for Encanto Potash Corp. (Encanto) to summarize the results of the 2017 PEA and 2013 PFS of its Muskowekwan Potash Project (the Project).
In this Technical Report, the Project has been evaluated with two similar mine development options that are based on similar mining and processing methods, but different production rates. The 2017 Preliminary Economic Assessment (PEA) is a conceptual study that evaluates a production rate of 3.4 Mtpa potash fertilizer product that improves project economics over the 2013 Prefeasibility Study (PFS) which is based on a production rate of 2.8 Mtpa.
The Qualified Persons (QPs) that authored this Technical Report are independent of Encanto Potash Corp., and the Project.
2.3 Qualified Persons
The QPs responsible for technical content of this Technical Report are:
David M. Myers, P.Eng., Amec Foster Wheeler, Manager of Engineering Saskatoon
Paul M. O’Hara, P.Eng. Amec Foster Wheeler, Manager of Process Saskatoon
Tabetha A. Stirrett, P.Geo., CPG, North Rim, Senior Geologist
Douglas F. Hambley, Ph.D., P.E., P.Eng., P.G., Agapito Associates, Inc., Senior Associate

Preliminary Economic Assessment and Preliminary Feasibility Study
NI 43-101 Technical Report
Project No.: 194379
2-2
James Brebner, Eng., Novopro Projects Inc.
2.4 Site Visits and Scope of Personal Inspection
The project site was visited on 6 April 2017 by David Myers, P. Eng. to inspect the proposal process plant location, tailings management area location, rail spur route and access roads. A Muskowekwan First Nation representative accompanied Mr. Myers on the site visit to provide guidance and answer general questions about land ownership and current use.
Tabetha Stirrett, P. Geo visited to the Project Area during the 2010 exploration program on 25 October 2010. Ms. Stirrett did not go to site during the 2011 exploration program, but a North Rim employee under the direct supervision of Ms. Stirrett was on site at all times during the core recovery. Once the core was in Saskatoon at North Rim’s core lab, Ms. Stirrett reviewed all core descriptions and assay intervals for accuracy.
2.5 Effective Dates
The content of this Technical Report have a number of effective dates:
The Mineral Resources for the PEA have an effective date of 24 May 2017.
The Mineral Resources for the PFS have an effective date of 28 November 2012.
The Mineral Reserves have an effective date of 01 March 2013 and are reported only for the PFS.
The PFS technical summary included in Section 24 has an effective date of 13 February 2013.
The overall Technical Report effective date including the most recent PEA results has an effective date of 24 May 2017.
There were no material changes to the scientific and technical information for the mineral property between the effective date and the signature date of the Technical Report.
2.6 Information Sources and References
Please refer to section 27 for references used in this Technical Report.
2.7 Previous Technical Reports
Encanto has previously filed the following technical reports for the Project:
Stirrett, T.A., Hardy, M.P., Hambley, D.F., Brebner, J., 2013: Technical Report Summarizing the Preliminary Feasibility Study for the Muskowekwan First Nations Project in South Eastern Saskatchewan: unpublished NI 43-101 technical report prepared for Encanto, effective date 13 February 2013
Stirrett, T.A., Brebner, J., Hambley, D.F., 2012: Encanto Potash Corp., Muskowekwan Indian Reserve Project 2012 Technical Summary Report
Kotowski, S., Funk, V., Johnson, A., Cairns, J., Ramsey, D., Meyer, T., Stirrett, T.A., Brebner, J., Gebhardt, E., 2011: Technical Report and unpublished Preliminary Economic Assessment report prepared for Encanto, effective date 09 May 2012 Preliminary Economic Assessment of the Muskowekwan Project: unpublished

Preliminary Economic Assessment and Preliminary Feasibility Study
NI 43-101 Technical Report
Project No.: 194379
2-3
Preliminary Economic Assessment report prepared for Encanto, effective date 27 September 2011

Preliminary Economic Assessment and Preliminary Feasibility Study
NI 43-101 Technical Report
Project No.: 194379
3-1
3 Reliance on Other Experts
3.1 Introduction
The QPs have relied upon the following other expert reports, which provided information regarding mineral rights, surface rights, property agreements, royalties, taxation and marketing sections of this Technical Report.
3.2 Mineral Tenure
The Amec Foster Wheeler QPs have not reviewed the mineral tenure, nor independently verified the legal status or ownership of the Project area or underlying property agreements. The QPs have fully relied upon, and disclaim responsibility for, information derived from legal experts for this information through the following documents:
Canada Gazette II, 5 April 2017: Statutory Instrument SOR//2017-47, Muskowekwan First Nation Solution Potash Mining Regulations, page 692-723, P.C. Number 2017-258
Indian Mining Regulations Mineral Lease between Her Majesty the Queen in Right of Canada, as represented by the Minister of the Department of Indian Affairs and Northern Development and Muskowekwan Resources Ltd, 31 March 2017, File No. 5853-9-392-1
This information is used in Sections 4.3 and 4.4 of the Technical Report.
3.3 Surface Rights
The Amec Foster Wheeler QPs have not reviewed the documentation on surface rights that are necessary to support the proposed mining operations in this Technical Report. The QPs have fully relied upon, and disclaim responsibility for, information derived from legal experts for this information through the following documents:
Ministerial Orders 2014-32, 2014-33, 2014-34, 2014-35, 2014-36 and 2014-037 defining Reserve and Pre-Reserve rights of the Muskowekwan First Nation for lands defined therein
“Map Showing Muskowekwan First Nation Reserves”, Muskowekwan Designation SGB 2013-12-016- V.2.0 updated 26 October 2015
This information is used in Sections 4.5 of the Technical Report.
3.4 Environmental
The QPs rely upon information prepared by Neil Cory, MEDes., B.Sc. of Stantec who is a Principal, Environmental Planner and Regulatory Specialist.
3.5 Social and Community Impacts
The QPs rely upon information Neil Cory, MEDes., B.Sc. of Stantec who is a Principal, Environmental Planner and Regulatory Specialist.

Preliminary Economic Assessment and Preliminary Feasibility Study
NI 43-101 Technical Report
Project No.: 194379
3-2
3.6 Taxation
The Amec Foster Wheeler QPs have relied on taxation guidance provided by the Issuer who have received expert advice from Ernst and Young LLC.
3.7 Markets
The Amec Foster Wheeler QPs have relied on RBC Capital Markets data provided by the Issuer.

Preliminary Economic Assessment and Preliminary Feasibility Study
NI 43-101 Technical Report
Project No.: 194379
4-1
4 Property Description and Location
4.1 Introduction
The Project Area is centrally located on IR85 and comprises a portion of the Muskowekwan First Nations Lands encompassing approximately 61,114 acres including roads (Data Source for Project Boundary: Sask Cadastral Dataset from ISC). The Project Area spans a total land base incorporating much of Township 27 including the southern half of Ranges 15 and 16 and Range 14, West of the Second Meridian. A detailed Project location map is shown in Figure 4-1 and includes township boundaries, infrastructure, surrounding Subsurface Mineral Permit boundaries, and TLE Lands that Encanto has permission to access based on their agreements with the Muskowekwan First Nation. This Technical Report presents Mineral Resource estimates for the Project Area, which includes the home reserve as well as the Muskowekwan TLE lands in the estimation.
4.2 Property and Title in Saskatchewan
The Project is located on Reserve lands of the Muskowekwan First Nation #85 as defined by the Indian Act of Canada.
A Mineral Lease has been signed for these lands as described in Section 4.4.
4.3 Project Ownership
The Project is owned by Encanto Potash Corp. Encanto is working in partnership with Muskowekwan Resources Limited, a legally incorporated entity wholly owned by the Muskowekwan First Nation and representing their interests. The Muskowekwan First Nation has secured mineral rights for its own reserve land and is legally entitled to assign development of mineral resources to another party.

Preliminary Economic Assessment and Preliminary Feasibility Study
NI 43-101 Technical Report
Project No.: 194379
4-2
Figure 4-1: Regional location map of the Muskowekwan First Nations lands

Preliminary Economic Assessment and Preliminary Feasibility Study
NI 43-101 Technical Report
Project No.: 194379
4-3
4.4 Mineral Tenure
In March 2017, Muskowekwan Resources Limited entered into an Indian Mining Regulations Mineral Lease with Her Majesty The Queen in Right of Canada, as represented by the Minister of the Department of Indian Affairs and Northern Development.
This Agreement applies to the following lands as defined by the Indian Act, R.S.C. 1985, cI-5: Muskowekwan Indian Reserve No. 85, 85-1, 85-3, 85-4, 85-5, 85-6, 85-7, 85-8, 85-9, 85-10, 85-11, 85-12, 85-13, 85-14, 85-15, 85-16, 85-17, 85-18, 85-19, 85-20, 85-21, 85-22, 85-23, 85-24, 85-25, 85-26, 85-27, 85-28, 85-29, 85-30, 85-31, 85-32, 85-33, 85-34, 85-35, 85-36, 85-37, 85-38, 85-39, 85-40, 85-41, 85-42, 85-44, 85-48, 85-51, 85-53, 85-54, 85•57, 85-58, 85-59, 85-60, 85-61, 85-66, 85-67, 85-68, 85-69, 85-72, and 85-74.
Note that these lands include TLE property that has been acquired since 2013. The PEA study excludes those new lands, and is based only on resources identified in the 2013 PFS.
In Saskatchewan, provincial legislation governs the issuance and administration of mineral tenure, and was regulated by the Subsurface Mineral Regulations [The Subsurface Mineral Regulations, 1960] and the Crown Minerals Act [The Crown Minerals Act, 1984-85-86]. As of March 26, 2015, the Subsurface Mineral Regulations of 1960 have been updated and replaced in large part by the Subsurface Mineral Tenure Regulations (SMTR). The Subsurface Mineral Regulations of 1960 remain in force and continue to set out applicable Crown royalty rates which will remain unchanged [Porter, 2015].
In accordance with the Indian Oil and Gas Act (The Indian Oil and Gas Act, 1974-75-76), “Indian lands” means lands reserved for the Indians, including any interests therein, surrendered in accordance with the Indian Act and includes any lands or interests in lands described in any grant, lease, permit, license or other disposition.
The majority of mineral rights are owned by either the Crown or Freehold owners in Saskatchewan. Therefore, companies or individuals wishing to conduct exploration activities must obtain permission to complete their work. Potash Dispositions in Saskatchewan are issued in the form of permits and leases through the Ministry of Energy and Resources and are governed by The SMTR [2015]. The responsibility for managing mineral resources has historically been passed down from the federal level to the provincial level with the exception of Nunavut, the Northwest Territories, and Indian Reserve land. In Saskatchewan, exploration is allowed on all Crown Land, except for those protected from mining activities. Access to Aboriginal lands or Indian Reservations is prohibited unless consent and compensation is given to the surface-rights holders (Mineral Exploration Webpage, 2010).
Crown Mineral Rights are mineral titles that are owned by the Saskatchewan Provincial Government and in some instances the federal government as in the case of national parks or Indian reservations.
4.5 Surface Rights
Surface rights are subject to separate ownership and title from the subsurface (i.e. mineral rights); therefore, the securing of mineral rights does not secure the surface rights, unless on Indian Reserve Land. The surface and mineral rights of interest belong to the Muskowekwan First Nations. Indian Mineral Lands were granted to the First Nations of Saskatchewan by virtue of the treaties signed during the 19th Century. When the First

Preliminary Economic Assessment and Preliminary Feasibility Study
NI 43-101 Technical Report
Project No.: 194379
4-4
Nations were given their original reserves, the title gave them ownership of both the surface and subsurface minerals. The land described in the mineral lease are reserve land.
4.6 Water Rights
The Project will require a large flow rate of raw water (range of 1500-1800 m3/h). For the purposes of the PEA study the water source is assumed to be Buffalo Pound Lake, in accordance with the 2013 PFS assumptions and the authors’ knowledge of Saskatchewan Water Security Agency preference from similar past projects.
4.7 Royalties
As the Project is the first First Nations owned mineral lease and on First Nations land, the royalties payable will be unique. At the time of the PEA study the royalty rates and payees were not formally defined.
The PEA study has assumed royalties similar to other potash operations in Saskatchewan, and similar to the 2013 PFS study summarized in Section 24.
4.8 Agreements
In 2010, Encanto Resources Ltd., a subsidiary of Encanto Potash Corp. formed a formal Joint Venture Agreement (JVA) with the Muskowekwan First Nation and MRL, the purpose of which is to progressively develop plans to establish a potash resource on the Muskowekwan First Nation’s reserves lands and further, if feasible, to develop, construct and operate a potash Project. As their contribution to the JVA, Encanto agreed to provide operational services in respect of the project and pay all monies, as well as assume the responsibilities of obligations and liabilities in connection with the study. Pursuant to Encanto’s agreement, they are entitled to receive all benefits and revenues of the JVA. MRL has received shares of Encanto Potash Corp. and will receive royalty payments upon production and sales, while the Muskowekwan First Nation will receive a Development Fee upon certain milestones being achieved. Community involvement including training and job placement will be provided by Encanto. The JVA between Encanto, MRL and the Muskowekwan First Nation follows a unique set of provisions and regulations for Surface and Subsurface Access.
4.9 Permitting Considerations
A Permit agreement between Her Majesty the Queen [represented by Aboriginal Affairs and Northern Development Canada (AANDC)] and MRL was signed on 9 November 2009. Below is a summary of the Department of Indian Affairs and Northern Development Mineral Exploration Permit (Indian Mining Regulations) between Her Majesty and MRL:
A security deposit of $35,000 to be paid upon commencement of the Permit.
The permit may be extended a maximum of three (3) terms of one year.
The permit is subject to any prior encumbrances.
A charge of $0.50 plus applicable GST per acre within the Permit Area.

Preliminary Economic Assessment and Preliminary Feasibility Study
NI 43-101 Technical Report
Project No.: 194379
4-5
An assessment work charge of $53.84 per acre during the term and $1.00 per acre during each additional term (anniversary date upon signing).
All data, seismic, documentation, and core obtained during the exploration process must be kept, organized and submitted properly in accordance with the exploration permit.
The Permittee must comply with federal, provincial, municipal, environmental and Muskowekwan First Nation Laws and regulations.
Her Majesty has the right to suspend operations causing environmental harm. If remediation is not performed by the Permittee, the Permittee shall pay Her Majesty for remediation duties.
If Her Majesty has deemed a contract breached due to failure to comply with the covenants or obligations outlined within the Mineral Exploration Permit, Her Majesty has the right to terminate the agreement and has the right to recover any payments owed and refuse a refund on any monies paid.
A valid insurance policy must be in place that protects both the Permittee and Her Majesty for loss or damage incurred.
Her Majesty has a right of entry and access to the permit at all reasonable times.
The Permittee should not interfere with land outside the permit area.
Upon termination of the permit the area is to be restored to a set environmental standard three-hundred and sixty-five (365) days after a receipt of notice.
The Permit does not include a surface lease allowing for operations to extract potash and a surface lease must be applied for under section 38 and 39 of the Indian act, which surrenders the land conditionally or unconditionally to Her Majesty for the purpose of obtaining a lease.
The full document along with a copy of the AANDC Indian Act Mineral Exploration Permit can be found in the April 2011 Encanto Technical Report (Stirrett, 2011).
4.10 Environmental Considerations
An EIS was prepared by Stantec Consulting Ltd. and submitted by First Potash Ventures to Saskatchewan Ministry of Environment, Environmental Assessment Branch for review and approval in August 2013. First Potash Ventures was a joint venture of Muskowekwan First Nation, MRL, and Encanto.
A regulatory review was conducted by branches of both Saskatchewan and Canadian regulatory Departments. This review identified deficiencies, categorized as follows:
Type I: Outstanding deficiencies considered sufficiently important to justify withholding a decision under The Environmental Assessment Act. These deficiencies frequently relate to the availability of sufficient information for a complete understanding of project-related effects and basic environmental trade-offs associated with a development. These issues must be addressed prior to the EIS being released for public review.
Type II: Deficiencies not considered sufficiently important to justify withholding a decision, but which, should an approval be granted, must be resolved before subsequent regulatory approvals are issued. The proponent should address these issues in the EIS

Preliminary Economic Assessment and Preliminary Feasibility Study
NI 43-101 Technical Report
Project No.: 194379
4-6
when this is feasible and/or may submit additional information separate from the EIS to meet regulatory approvals.
Type III: Relatively minor issues, the clarification of which will add to the quality and accuracy of the EIS. Efforts should be made to address these issues in the final EIS.
Type IV: Poor phrasing or presentation of proponent’s commitments that could create problems for compliance or enforcement of commitments.
The Issuer was arranging for consultants to address these items at the time of the PEA study, to be completed in support of EIS finalization and resubmission. Type I deficiencies are prioritized, which include hydrogeological, at-risk species and traditional knowledge field studies.
4.11 Social License Considerations
Consultations with Muskowekwan First Nation, surrounding First Nation and Metis communities, and affected rural Municipalities were conducted during the environmental assessment are documented in the 2013 EIS. Both benefits and concerns of these communities are reported.
A series of votes were conducted by the Muskowekwan First Nation during 2014 to confirm majority support of land use for mine development. These were formalized by Ministerial Orders of the Minister of Aboriginal Affairs and Northern Development as follows:
2014-032, dated 27 August 2014
2014-033, 2014-034, 2014-035, 2014-036 and 2014-037, dated 29 July 2014
As a First Nations owned mineral resource, continuous engagement of the Muskowekwan community and its neighbouring stakeholders is expected.

Preliminary Economic Assessment and Preliminary Feasibility Study
NI 43-101 Technical Report
Project No.: 194379
5-1
5 Accessibility, Climate, Local Resources, Infrastructure, and Physiography
5.1 Topography and Vegetation
The property is characterized by gently rolling grassland with local poplar bluffs (Figure 5-1). Some of the land is unbroken grassland and is used as pasture or grazing land for livestock. There are several small swamps and low lying wetland areas that play host to a number of wildlife species. The elevation of the area is variable, but generally sits at a mean elevation of 673.0 m above sea level.
5.2 Accessibility and Local Resources
The Muskowekwan First Nation is located near Highway 15, between the towns of Lestock and Punnichy. No other towns or villages are located within the bounds of the Project Area. The entire Permit is accessible by a network of grid section gravel and paved roads, including a major paved highway. Highway 15 connects to Melville in the east and to the west it connects to Highway 6 which runs south to the city f Regina. Highway 15 is bounding the northern portion of the Project Area. Both paved and gravel road access is available through the Permit Area, in part due to the inhabitation of the land by a combination of mixed farms. A Canadian National rail line crosses through the reserve nearly paralleling Highway 15 through Lestock and Punnichy.
Major populated Saskatchewan urban centers, including Regina, Melville, and Yorkton, and the surrounding rural communities such as Raymore, Wynyard and Fort Qu’Appelle may offer skilled professional, technical, and trades persons for project construction and operation. Saskatchewan is experiencing strong economic growth in both the construction and mining industries which may result in a shortage of experienced and skilled trades and technical personnel. The Saskatchewan Mining Association reports that an additional 13,000 workers will be required by 2024 (Mining Industry Human Resources Council, 2015). Encanto has stated that they are committed to providing jobs to qualified Muskowekwan persons, whenever possible, throughout the duration of the project. These positions include management and supervisory positions. Encanto is dedicated to the hiring and training of the Muskowekwan First Nations personnel. Muskowekwan businesses will also be given preference to act as suppliers for goods and services that may be required throughout the Projects duration.
5.3 Climate
The climate in the Lestock area is typical of the Saskatchewan prairies. It consists of a winter period (November – March) of snow and temperatures down to -38 degrees Celsius (°C). The spring (April – May) and fall (September – October) have temperatures around 10°C, with greater rates of precipitation, either in the form of snow or rain. The summer period (June to August) is typically warm (between 15°C and 32°C) and dry, with a low average rate of precipitation. The seasonal climate can play a role in accessibility, particularly in the spring and fall, when freezing and thawing ground conditions prevent mobilization of heavy equipment into the area. Spring road restrictions are issued by the Saskatchewan Ministry of Highways and Infrastructure typically beginning the first three
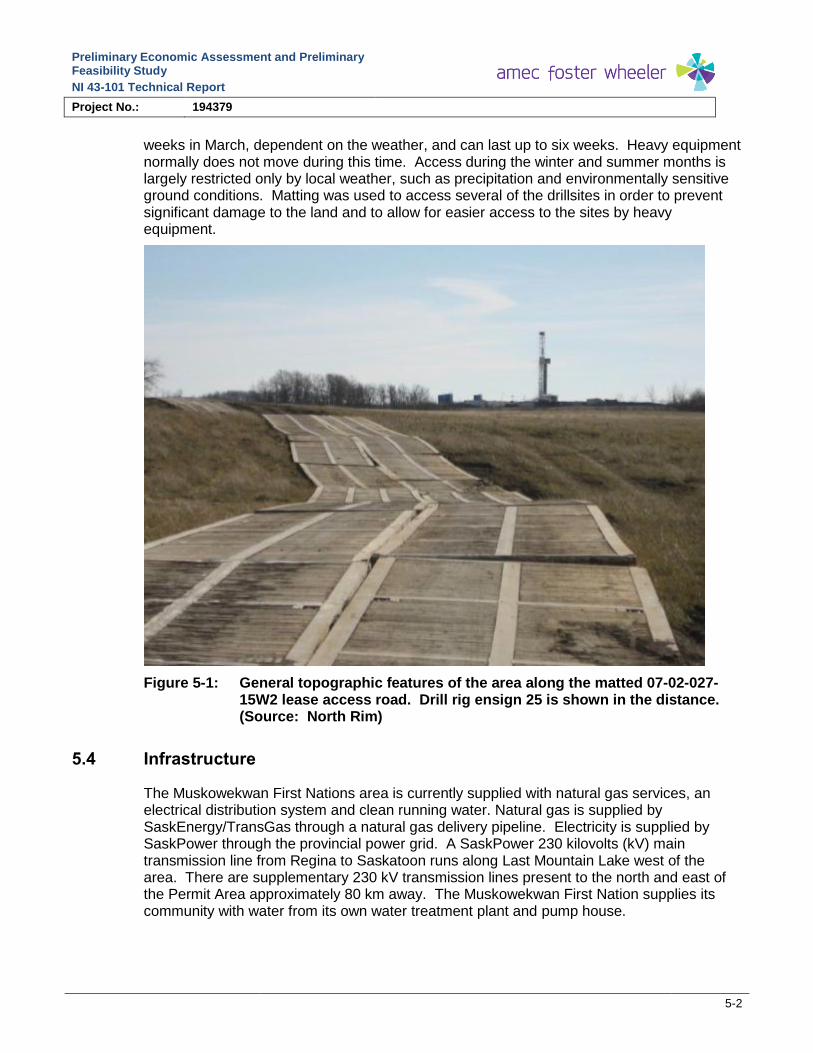
Preliminary Economic Assessment and Preliminary Feasibility Study
NI 43-101 Technical Report
Project No.: 194379
5-2
weeks in March, dependent on the weather, and can last up to six weeks. Heavy equipment normally does not move during this time. Access during the winter and summer months is largely restricted only by local weather, such as precipitation and environmentally sensitive ground conditions. Matting was used to access several of the drillsites in order to prevent significant damage to the land and to allow for easier access to the sites by heavy equipment.
Figure 5-1: General topographic features of the area along the matted 07-02-027-15W2 lease access road. Drill rig ensign 25 is shown in the distance. (Source: North Rim)
5.4 Infrastructure
The Muskowekwan First Nations area is currently supplied with natural gas services, an electrical distribution system and clean running water. Natural gas is supplied by SaskEnergy/TransGas through a natural gas delivery pipeline. Electricity is supplied by SaskPower through the provincial power grid. A SaskPower 230 kilovolts (kV) main transmission line from Regina to Saskatoon runs along Last Mountain Lake west of the area. There are supplementary 230 kV transmission lines present to the north and east of the Permit Area approximately 80 km away. The Muskowekwan First Nation supplies its community with water from its own water treatment plant and pump house.

Preliminary Economic Assessment and Preliminary Feasibility Study
NI 43-101 Technical Report
Project No.: 194379
6-1
6 History
6.1 Project History
Exploration activities were initiated in 2009 following the agreement between the Muskowekwan First Nation and Encanto Potash Corp. Table 6-1 summarizes the Exploration Programs for 2009 to 2013.
Table 6-1: Summary of 2009-2013 exploration programs (Source: North Rim)
Exploration Program Start Date Completion Date No. Lines / Area Covered
Meters Drilled
2D Seismic Survey May 2009 September 2009 241.57km2 N/A
3D Seismic Survey November 2009 May 2010 223km2 N/A
2D Interpretation October 2009 November 2009 N/A N/A
Drilling Program November 2009 December 2009 1 hole Drilled 1,392
3D Interpretation May 2010 December 2010 N/A N/A
Drilling Program October 2010 November 2010 4 holes Drilled 5,582
NI 43-101 Resource November 2010 April 2011 N/A N/A
Preliminary Economic Assessment April 2011 August 2011 N/A N/A
Drilling Program September 2011 October 2011 2 holes Drilled 2,525
3D Seismic Survey November 2012 December 2012 58.25km2 N/A
Preliminary Feasibility Study January 2013 February 2013 N/A N/A
Notes:
N/A = Not Applicable
6.2 2009 Seismic Program
A 2D seismic program was conducted in 2009 by Kinetix Corporation of Calgary, Alberta between April and June. It covered the Muskowekwan First Nations Project Area and extended north into the Daystar First Nations property. The program was designed to evaluate the regional geological structures including faults and Winnipegosis carbonate mounds. Additionally, the survey focused on salt dissolution features to determine the potential for laterally continuous potash mineralization sufficient to potentially support a mining operation. The seismic was tied to two deep historical wells in the area. These two wells were Canadian Reserve Punnichy 6-13-28-17W2 (1968) and Atlantic Raymore 16-6-29-15W2 (1966). Considering only the structure of the Prairie Evaporite (PE) Formation, a brief interpretation of the seismic was conducted, which led to the drilling of the Lestock well 2-09-27-15W2. Based on the results from 2-09-27-15W2 and the favorable geological structure of the area, a 3D seismic program was completed to examine the geological continuity in the area.

Preliminary Economic Assessment and Preliminary Feasibility Study
NI 43-101 Technical Report
Project No.: 194379
6-2
North Rim was not involved in the supervision of the coring or core retrieval of well 2-09-027-15W2, nor did they have any input in the 2009 seismic program. However, North Rim did conduct the detailed core logging and assay sampling for this well.
2009 Drilling ProgramOne vertical, stratigraphic test well was drilled in 2009 between late November and early December. The well was drilled at 2-09-027-15W2.
Barlon Engineering of Calgary, Alberta, was contracted to complete the drill hole utilizing oilfield drilling equipment capable of drilling to depths beyond that of the PE Formation.
The drill hole was designed to evaluate the potash mineral potential in the Project Area and was placed based on results from the 2009 2D seismic survey. A drill stem test within the Dawson Bay Formation was completed and cores were collected through the potash-bearing zones.
The objective of the drilling program was to correlate the seismic surveys to actual drill hole results and evaluate the potash potential in the Project Area. Drill hole locations were selected upon the following parameters:
The presence of laterally continuous potash-bearing strata (avoiding anomalous ground).
Positive results arising from seismic interpretation and recommendations.
6.3 2010 Seismic Program
RPS Group (RPS) of Calgary, Alberta was contracted by Encanto to interpret the results of the 2009 2D and 2010 3D seismic survey. 2D and 3D seismic surveys are highly effective subsurface analytical tools for potash exploration used in the identification and estimation of the degree of salt loss, salt dissolution-induced collapse structures, and the identification of other geological elements. The results of the 2D and 3D surveys were used in the design of drill holes to avoid potentially anomalous ground.
The following discussion is based on the RPS report entitled, “Encanto Potash Corp. 2010 Muskowekwan 3D Final Depth Interpretation” and can be found in appendices of the April 2011 Encanto Technical Report (Stirrett, 2011). As part of the planning for the 2010 drilling program, the 3D seismic was reviewed for evidence of geological anomalies that could potentially affect potash mineralization within the PE Formation.
Anomalous areas identified by the 3D survey are subdivided into:
Class 1, 2, and 3 collapses.
Potential disturbances in the Devonian carbonates directly overlaying the PE (Illustrated as Souris River Anomaly).
Probable carnallite zones.
Class 1 collapses show a high degree of salt removal within the Upper PE Formation and exhibit vertically extensive compensatory down-warping of the overlying strata. The seismic shows that Class 1 collapses extend up into the Paleozoic strata, suggesting extensive fracturing of the Dawson Bay Formation.
Anomalous areas interpreted by RPS can be seen in Figure 6-1 and it also shows the new 2012 3D seismic outline.

Preliminary Economic Assessment and Preliminary Feasibility Study
NI 43-101 Technical Report
Project No.: 194379
6-3
Figure 6-2 modified from the 2010 RPS report illustrates the Second Red Bed structure map. This map suggests that the subsurface to the top of the Second Red Beds is, in general, relatively free of any high amplitude undulating disconformities and indicates a relatively continuous and uniform PE Formation. A large, linear salt-dissolution or collapse feature is identified in the southeastern portion of the survey and appears to greatly affect the overlying sedimentary packages. Figure 6-3 modified from the RPS report, illustrates Class 1 to Class 3 collapses and the extent to which they disturb the upper strata.
Figure 6-1: Features identified from seismic (RPS 2010, 2011 and 2012)
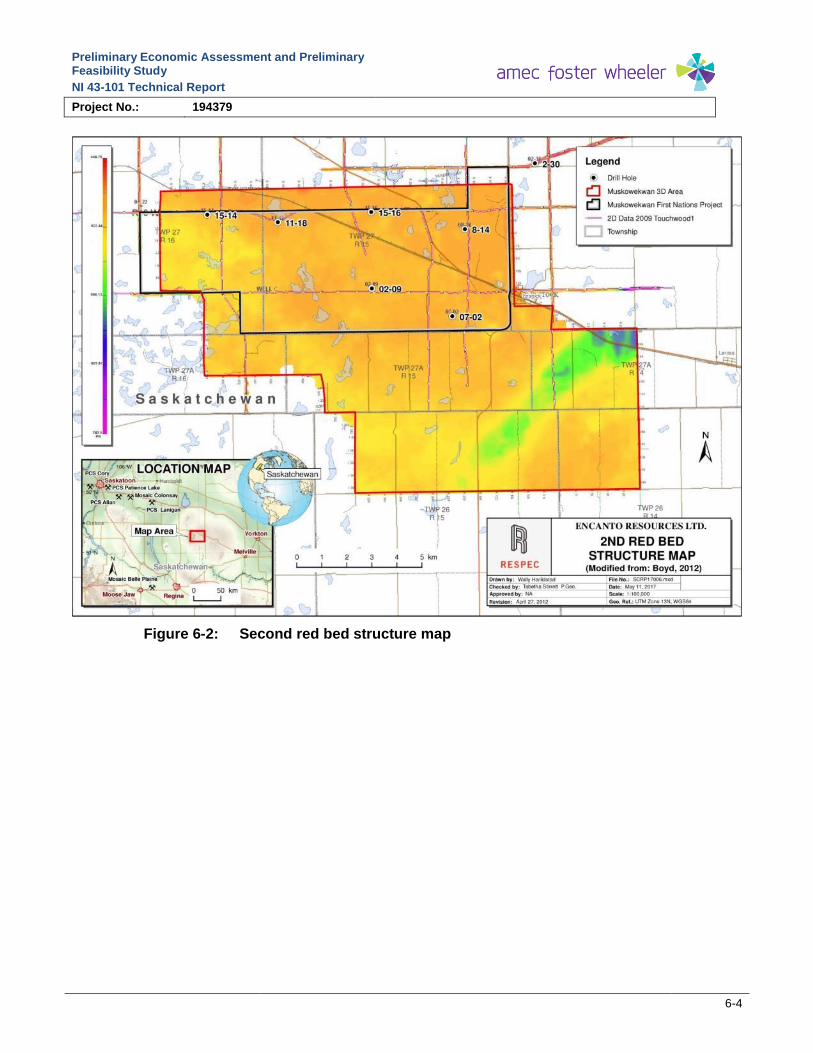
Preliminary Economic Assessment and Preliminary Feasibility Study
NI 43-101 Technical Report
Project No.: 194379
6-4
Figure 6-2: Second red bed structure map

Preliminary Economic Assessment and Preliminary Feasibility Study
NI 43-101 Technical Report
Project No.: 194379
6-5
Figure 6-3: Examples of collapse anomalies in the project area (RPS, 2010)

Preliminary Economic Assessment and Preliminary Feasibility Study
NI 43-101 Technical Report
Project No.: 194379
6-6
For this Technical Report and for the Mineral Resource estimation, North Rim and RPS reviewed each collapse in detail to determine an accurate outline for area affected by a collapse. Mike Hardy of Agapito provided input into determining how close caverns could be placed to a collapse depending on the severity of the dip of the beds affected. Figure 6-4 and Figure 6-5 illustrate how the buffers around the anomalies were selected by RPS (RPS, 2010). The full report can be found in Appendix B of the April 2011 Technical Report (Stirrett T. A., 2011).
Figure 6-4: Second red beds depth surface viewed with 10 times vertical exaggeration (RPS, 2012)

Preliminary Economic Assessment and Preliminary Feasibility Study
NI 43-101 Technical Report
Project No.: 194379
6-7
Figure 6-5: Map view of second red beds dip with mound outlines (Source: North Rim)
6.4 2010 Drilling Program
Four vertical, stratigraphic test wells were drilled in 2010 drilling between early October and mid-November. These wells were:
Encanto Lestock 07-02-27-15W2
Encanto Lestock 11-18-27-18W2
Encanto Lestock 15-16-27-15W2
Encanto Punnichy 15-14-27-16W2
Barlon Engineering of Calgary, Alberta, was contracted to complete the program utilizing oilfield drilling equipment capable of drilling to depths beyond that of the PE Formation.
The drill holes were designed to further evaluate the potash mineral potential in the Project Area and were spaced with consideration to specific mineral resource buffers. Drill stem tests within the Dawson Bay Formation were completed and cores were collected through the potash-bearing zones.
The objective of the drilling program was to define a geological dataset suitable for the development of a robust Mineral Resource. Drill hole locations were selected upon the following parameters:
The presence of laterally continuous potash-bearing strata (avoiding anomalous ground).
Preliminary Economic Assessment and Preliminary Feasibility Study
NI 43-101 Technical Report
Project No.: 194379
6-8
Positive results arising from RPS’s seismic interpretation and recommendations.
Drill hole spacing sufficient to allow for an evaluation of the Dawson Bay Formation.
A strategic plan incorporating the future acquisition of lands to the north of the Project Area.
The availability of drill hole data suitable for the documentation potash Mineral Resource based on CIM and NI 43-101 industry best practice.
6.5 2011 Resource Estimation
During the 2011 resource estimation, two mining scenarios were studied: conventional mining and solution mining. Each scenario was carried out by examining the possible mining horizons and potential extractable potash available in the deposit. This allowed Encanto to examine the potential feasibility of each scenario for extracting the Resource using existing mining methods.
The 2011 report did not address which mining method would be utilized. The depth to the potential mineable formations is shallower and at lower formation temperatures than operating Canadian solution mining potash mines, but deeper than that of operating Canadian potash conventional mines therefore requiring further investigation into suitable extraction ratios. Because of the depth and at the time, undetermined economic factors, this Technical Report presented both a conventional and solution mining Mineral Resource. See the (Stirrett, 2011) report for the Resource Tonnage numbers as they will not be presented in this summary.
6.6 2011 Drilling Program
Two vertical, stratigraphic test wells were drilled in 2011 between mid-September and mid-October. These wells were:
Encanto-Sundance Lestock 27-30-27-14
Encanto-Sundance Lestock 8-14-27-15
Barlon Engineering of Calgary, Alberta, was contracted to complete the program utilizing oilfield drilling equipment capable of drilling to depths beyond that of the PE Formation.
The drill holes were designed to further evaluate the potash mineral potential in the Project Area and were spaced with consideration to mineral resource buffers. Several drill stem tests throughout the length of the borehole were completed to determine the viability of water source wells and to evaluate the Dawson Bay Formation. Cores were collected through the entire potash-bearing zones.
The objective of the drilling program was to define a geological dataset suitable for the development of a robust Mineral Resource. Secondary objectives were to determine if a suitable underground water source was present in the Project Area. Drill hole locations were selected upon the following parameters:
The presence of laterally continuous potash-bearing strata (avoiding anomalous ground).
Positive results arising from RPS’s seismic interpretation and recommendations.

Preliminary Economic Assessment and Preliminary Feasibility Study
NI 43-101 Technical Report
Project No.: 194379
6-9
Drill hole spacing sufficient to allow for an evaluation of the Dawson Bay Formation.
A strategic plan incorporating the future acquisition of lands to the north of the Project Area.
The availability of drill hole data suitable for the documentation potash Mineral Resource based on CIM and NI 43-101 industry best practice.
6.7 2012 Resource Estimation
The Mineral Resource from 2012 was based on the results of the PEA study and it was determined that the recovery of the potash would be by solution mining methods. Measured, Indicated, and Inferred Mineral Resources were estimated for the mineralized intervals.
The solution interval was defined as the combined PL and BP Members with the barren halite interbed left unmined. The minable roof and floor contacts were based on a minimum K2O grade of 10% with an average ‘mineable grade’ over the entire interval of at least 15% K2O. The EM was not included in the calculation as the average carnallite grade was 8.05% (2.75% MgCl2) and the K2O grade was lower than the economic threshold cutoff of 15%.
The 2012 Measured Mineral Resources for the potential solution mining intervals was:
Patience Lake Member: 8.21 Mt of K2O
Belle Plaine Member: 8.77 Mt of K2O
Total Patience Lake and Belle Plaine Members excluding interbeds: 16.98 Mt of K2O
The 2012 Indicated Mineral Resources for the potential solution mining interval was:
Patience Lake Member: 31.38 Mt of K2O
Belle Plaine Member: 34.20 Mt of K2O
Total Patience Lake and Belle Plaine Members excluding interbeds: 65.58 Mt of K2O
The 2012 Inferred Mineral Resources for the potential solution mining intervals was estimated to be:
Patience Lake Member: 85.19 Mt of K2O
Belle Plaine Member: 63.09 Mt of K2O
Patience Lake and Belle Plaine Members excluding interbeds: 148.27 Mt of K2O
6.8 2013 Preliminary Feasibility Study
The results of the 2013 PFS are summarised in Section 24.

Preliminary Economic Assessment and Preliminary Feasibility Study
NI 43-101 Technical Report
Project No.: 194379
7-1
7 Geological Setting and Mineralization
7.1 Regional Geology
The subsurface stratigraphic column of Saskatchewan’s Phanerozoic cover may be subdivided into three broad geologic intervals (depths are based on the examination of wells from within the project area):
An uppermost overburden sequence comprised of Cenozoic glacial tills, gravels, and clays, extends to approximately 150.0 m to 200.0 m and contains fresh water aquifers.
A medial sequence of Mesozoic shales, siltstones, and sandstones containing limited aquifers of brackish water extending from the base of the glacial sediments to approximate 650.0 m to 685.0 m.
A lowermost package of Paleozoic strata which extends from the Paleozoic/Mesozoic Unconformity to more than 2,000.0 m and is comprised predominantly of thick successions of carbonate and evaporate rocks punctuated by shales and sandstones.
The sedimentary packages listed above comprise the Phanerozoic stratigraphic sequence in Saskatchewan and are underlain by Precambrian aged rocks. The Saskatchewan Industry and Resources regional subsurface stratigraphic correlation chart is shown in Figure 7-1.
Saskatchewan potash resources occur within Middle Devonian Elk Point Group strata as relatively flat-lying and laterally extensive bedded deposits comprised of halite, sylvite, and local carnallite. The Elk Point Group was deposited within a wide intracratonic depositional corridor known as the Elk Point Seaway, which extends from its southern extremities in North Dakota and northeastern Montana up through southern and central Saskatchewan into northeastern Alberta. The potash deposits are found at surface outcroppings in northwestern Manitoba and can be traced down the regional dip to subsurface depths of up to 2,750.0 m in southern Saskatchewan.
The deposits occur within the uppermost strata of a relatively thick evaporate succession known as the Prairie Evaporite Formation (PE). The PE is present within the lowermost Phanerozoic sequence and reaches thicknesses of up to 200.0 m within the study area. The PE is bound at its top by locally disconformable, Middle Devonian Dawson Bay Formation carbonate deposits and bound unconformably at its base by Silurian to Middle Devonian (Givetian) carbonate deposits. The basal depositional contact is marked by a sharp transition from the PE halite to an assortment of Winnipegosis Formation dolostones, limestones, and anhydrite interbeds.

Preliminary Economic Assessment and Preliminary Feasibility Study
NI 43-101 Technical Report
Project No.: 194379
7-2
Figure 7-1: Saskatchewan phanerozoic stratigraphic correlation chart. Modified from the Government of Saskatchewan website (Government of Saskatchewan Publications, 2014)

Preliminary Economic Assessment and Preliminary Feasibility Study
NI 43-101 Technical Report
Project No.: 194379
7-3
The Winnipegosis Formation forms broad, flat-lying regional basin and platform carbonate deposits locally occupied by limestone and dolomite reef systems. The Second Red Bed consisting of shale and locally silty regolith, mark the upper contact of the PE with the overlying Dawson Bay Formation.
According to Fuzesy (Fuzesy, 1982), three evaporitic sequences occurred during the Middle Devonian in Saskatchewan. The first is marked by the Elk Point Group and consists of the Ashern, Winnipegosis, and Prairie Evaporite; the second by the Dawson Bay Formation; and the third by the Souris River Formation. Together, the Dawson Bay Formation and the Souris River Formation comprise the Manitoba Group which directly overlies the Elk Point Group.
Two halite beds are incorporated into the Manitoba Group. The first is the Hubbard Salt and it is present as the uppermost bed in the Dawson Bay Formation. The second is the Davidson Evaporite which is composed of two halite beds separated by anhydrite occurring within the lower Souris River Formation. These halite beds are important from a mining viewpoint as they provide an aquitard or a physical barrier between the PE and potential water and brine aquifers common in the overlying Mesozoic sands.
Dissolution and removal of the Hubbard and Davidson halite beds is considered an indication of potential difficulties for conventional room and pillar mining methods as formation fluids capable of halite dissolution were at one time present and may have potentially infiltrated the mining horizons. Dissolution of any salt in the stratigraphic column highlights the possibility of a higher risk for inflow problems in underground conventional systems; therefore, such areas are commonly avoided by current potash mine operators in Saskatchewan. Regarding solution mining scenarios, the absence of these halite beds is often considered irrelevant other than in the identification of possible dissolution zones. During exploration, drill stem tests (DSTs) are frequently used to help identify aquifers and problematic areas directly overlying the Prairie Evaporite by testing for formation fluids and pressures.
Figure 7-1 shows a regional cross section of the PE and its potash-bearing Members in Saskatchewan, with the stratigraphic nomenclature taken from (Holter, 1969). A map indicating the position of the Project Area in relation to the section is also included in Figure 7-2. The figure demonstrates that consistent correlation of the potash-bearing Members is possible over hundreds of kilometers across the province from Saskatoon to just north of the Project Area and into southeastern Saskatchewan.
The PE is divided into a lowermost Lower Prairie Sequence and an overlying Upper Prairie Sequence unit containing three potash bearing Members and several marker beds. In ascending stratigraphic order, they are; the Esterhazy Member (EM), the White Bear Marker Beds (WBM), the Belle Plaine Member (BP), and the Patience Lake Member (PL). These beds are generally flat lying and are formed of interbedded sylvite, halite, carnallite, clays, and minor amounts of anhydrite.
Figure 7-3 is a generic type-log of the Upper PE from (Fuzesy, 1982) highlighting the specific correlation of the gamma ray and neutron log signatures to the mineralogy and lithology of the PL and the BP potash Members.
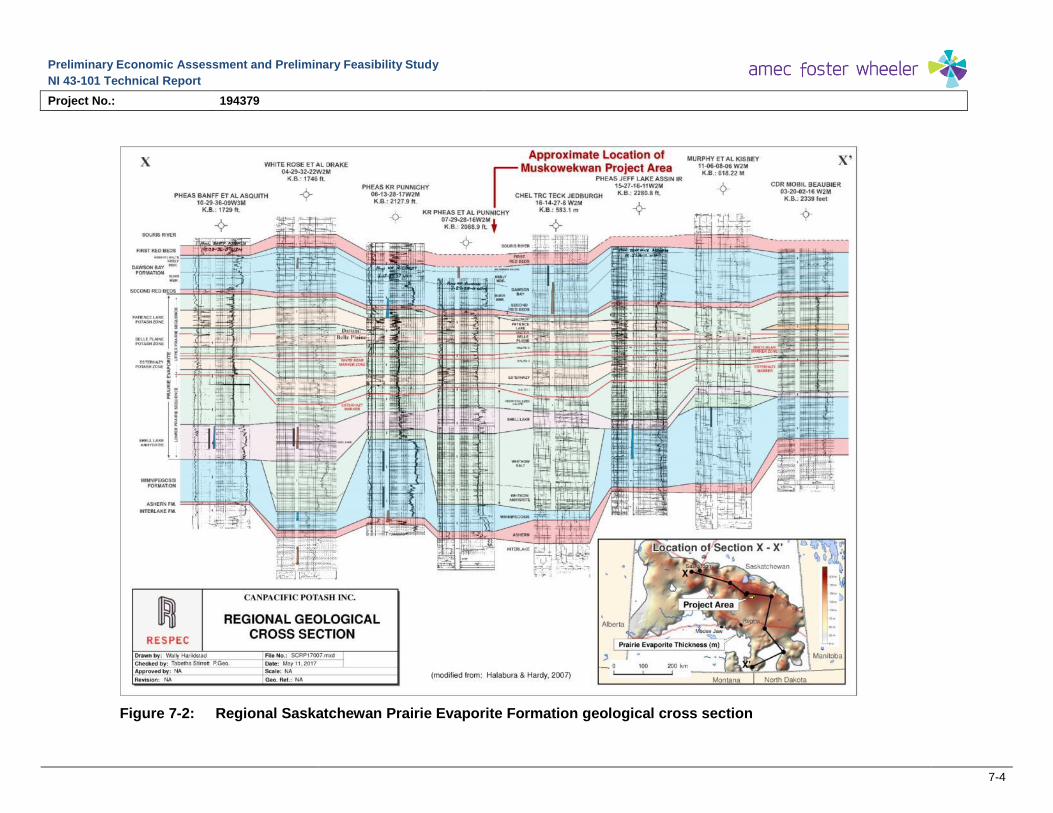
Preliminary Economic Assessment and Preliminary Feasibility Study
NI 43-101 Technical Report
Project No.: 194379
7-4
Figure 7-2: Regional Saskatchewan Prairie Evaporite Formation geological cross section

Preliminary Economic Assessment and Preliminary Feasibility Study
NI 43-101 Technical Report
Project No.: 194379
7-5
Figure 7-3: Stratigraphy of the upper Prairie Evaporite Formation showing correlation between lithology and mineralogy of the Patience Lake and Belle Plaine Members and gamma-ray neutron geophysical wireline logs (Modified from (Fuzesy, 1982))

Preliminary Economic Assessment and Preliminary Feasibility Study
NI 43-101 Technical Report
Project No.: 194379
7-6
7.2 Local Geology and Potash Bearing Members
The detailed stratigraphy of the Project Area is summarized in Figure 7-4. The figure shows the local geological marker beds as identified by the geophysical well logs and drill cuttings taken from the 2009, 2010, and 2011 exploration programs.
The three-major potash-bearing members are present in the Project Area and are, in ascending stratigraphic order, the EM, BP, and the PL Members. These Members occur as discreet stratiform evaporite deposits in the uppermost PE and are comprised of halite, sylvite, and carnallite of variable mineral proportions and crystal size. Between each Member are sequences of bedded salts comprised predominantly of halite and clay. A thin distinct package of bedded clay, halite, and sylvinite termed the Whitebear Marker Bed is absent in the Project Area, but is normally situated between the EM and BP.
Figure 7-5 is a detailed correlation of the PE lithology to geophysical wireline log signatures as present in Encanto Lestock well 15-16-027-15W2. The Member tops were chosen using the gamma ray, neutron porosity and density porosity wireline log signatures. The tops as depicted in Figure 7-5are consistent lithology picks throughout the Project Area.
The following is a summary of the key stratigraphic boundaries determined for the Project Area. Quoted depths are specific to the Project Area and are identified from the well log signatures of the seven project wells. All K2O grades have been calculated using the seven previously drilled wells’ assay data in conjunction with dissolution geochemical results from wells 02-30-27-14W2 and 08-14-27-15W2. Carnallite and insoluble content for each member is based on all seven wells.

Preliminary Economic Assessment and Preliminary Feasibility Study
NI 43-101 Technical Report
Project No.: 194379
7-7
Figure 7-4: Interpreted Stratigraphic column of the phanerozoic cover in the Lestock area. Note: Test holes did not penetrate geological bodies underlying the Prairie Evaporite Formation.
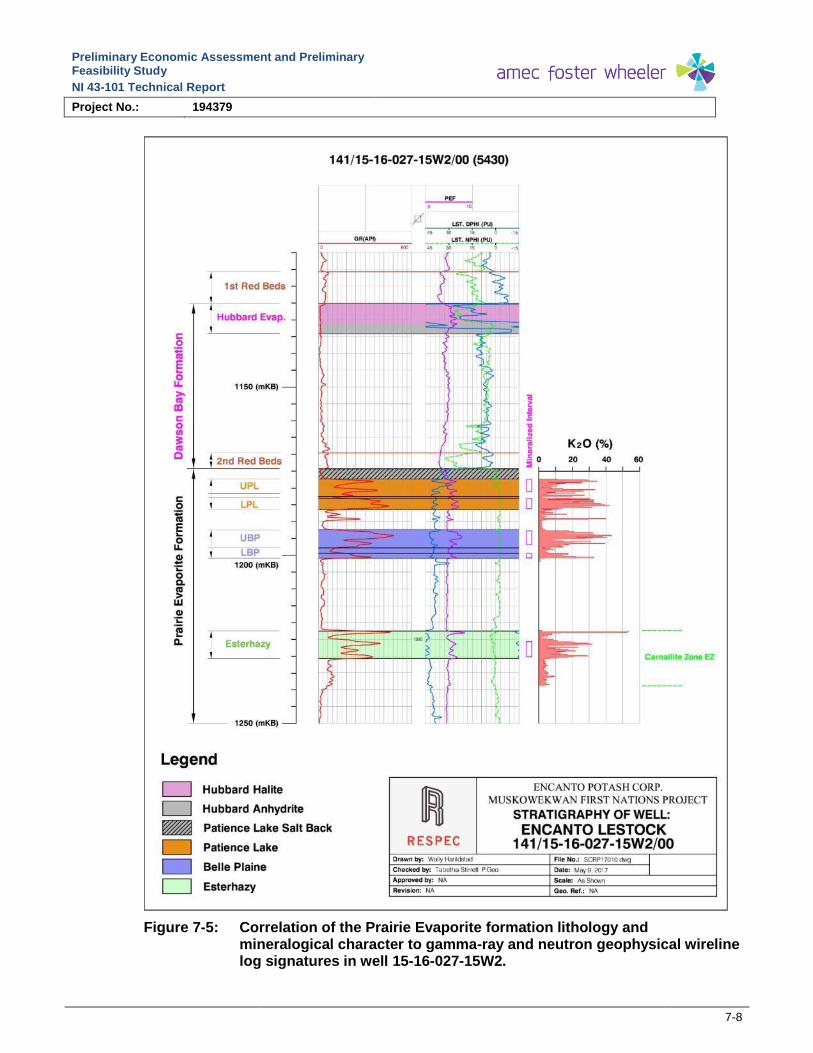
Preliminary Economic Assessment and Preliminary Feasibility Study
NI 43-101 Technical Report
Project No.: 194379
7-8
Figure 7-5: Correlation of the Prairie Evaporite formation lithology and mineralogical character to gamma-ray and neutron geophysical wireline log signatures in well 15-16-027-15W2.

Preliminary Economic Assessment and Preliminary Feasibility Study
NI 43-101 Technical Report
Project No.: 194379
7-9
7.2.1 Patience Lake Member
The PL is the uppermost potash bearing Member within the PE. It is conventionally mined in the Saskatoon area and is solution mined at the Belle Plaine Mine near Regina. The Member is subdivided into the Upper Patience Lake (UPL) and Lower Patience Lake (LPL) Potash Sub-members and is separated by a thin barren medial interbed halite.
The upper boundary of the PL is marked by the presence of the first sylvinite bed as indicated from the drill core, assay grade and interpreted wireline. The salt back which occurs between the base of the Second Red Beds and the top of the UPL is comprised predominantly of halite and interstitial clay. The salt back within the project area ranges from 0.0 m to 3.18 m. The base of the PL is placed at the bottom of the last occurring sylvinitic bed, but is often chosen at the base of a commonly present clay seam. It was chosen slightly differently within the Project Area, as sylvinite was still present below this clay seam.
The depth to the top of the PL ranges between 1,162.11 m to 1,191.36 m in the eastern portion of the Project Area and increases to 1,213.14 m in the west. The PL averages 8.22 m in vertical thickness.
The UPL is completely eroded away in well 07-02-027-15W2 and partially eroded in well 02-09-27-15W2. The LPL was encountered in all holes drilled.
Mineralogically the PL is recognized for its clay-rich character, with several laterally extensive interbedded clay seams and zones of high interstitial insolubles. Assay results within the Project Area indicate an average insoluble content 8.90%. Sylvite crystals are generally cloudy white and subhedral in form, ranging in diameter from <5.0 mm to 10.0 mm and locally reaching up to 29.0 mm. Oxidized reddish-orange insolubles commonly rim the sylvite crystals. Halite crystals also range from <5.0 mm to 10.0 mm, reaching a maximum diameter of 22.0 mm. Halite crystals are typically subhedral and vary in color from white, to pale orange, to moderate brown. Carnallite is generally found in trace amounts with the average equivalent content of 0.48% (0.16% MgCl2), based on all seven drill holes.
7.2.2 Belle Plaine Member
The BP stratigraphically underlies the PL and is present in all seven wells drilled in the Project Area. The BP is currently solution mined at the Mosaic Belle Plaine Potash Mine west of Regina. The upper boundary of the Member is picked at the top of a thin clay-rich bed present between the overlying barren halite interbed and the underlying BP sylvinite beds. The lowermost sylvinite bed marks the base of the BP, which typically has a persistent clay bed, separating the BP from the underlying barren halite interbed. Like the PL, the BP can be subdivided into Upper and Lower Potash Sub-Members divided by a bed of low-grade clay-rich sylvinite.
The depth to the top of the BP ranges from 1177.64 m in the east to 1,228.28 m in the west, exhibiting a uniform thickness across the property averaging 7.22 m.
The BP contains relatively less clay insolubles than the PL. Insolubles in the BP from all seven drill holes average at 3.88% while the average insoluble content in the PL is 8.90%.
Sylvite crystals are generally cloudy white and subhedral in form, ranging from <5.0 millimetres (mm) to 15.0 mm and locally up to 30.0 mm in diameter. Halite crystals also range from <5.0 mm to 15.0 mm in diameter locally exceeding 30.0 mm. Carnallite is

Preliminary Economic Assessment and Preliminary Feasibility Study
NI 43-101 Technical Report
Project No.: 194379
7-10
generally trace to locally minor with an average calculated equivalent assay grade of 0.54% (0.19% MgCl2) based on all seven wells.
7.2.3 Esterhazy Member
The lowermost stratigraphic potash-bearing EM is present in all seven wells drilled in the Project Area. It is separated from the BP by a relatively thick sequence of barren interbed salt averaging 23.93 m. The EM is conventionally mined at the Mosaic Esterhazy and PotashCorp Rocanville mines, as well as solution mined at Mosaic’s Belle Plaine mine.
The upper boundary of the EM is placed at the top of the first sylvinite bed and the lower boundary at the base of the lowermost sylvinite bed. In both cases the boundaries are relatively sharp with an abrupt change in crystal size and sylvite mineralization.
Figure 7-6 shows the local thickness for the UPL as a structure map exhibiting the apparent southeastward thinning of the Sub-member, interpreted as an effect of post-depositional erosion. From the seismic data, RPS has identified a salt edge related to a large collapse or dissolution feature to the south-east of the project area.
The depth to the top of the EM ranges from 1,209.00 m in the east to 1,262.00 m in the west, averaging 8.24 m in vertical thickness. Sylvite crystals are cloudy white, subhedral in crystal form, and coarser grained than the overlying members. Sylvite crystals range in diameter from 5.0 mm to 20.0 mm on average, to 41.0 mm locally. Halite crystals also range in diameter from 5.0 mm to 20.0 mm on average, locally exceeding 40.0 mm in size. In general, throughout the seven wells drilled in the Project Area, sylvinite beds within the EM are of substantially lower grade than those of the PL and BP. The EM in the Project Area is considered carnallitic with carnallite occurring as reddish-orange, amorphous, interstitial masses and stringers surrounding the sylvite/halite groundmass. Carnallite averages a calculated equivalent grade content of 8.05% (2.75% MgCl2) within the project area.
Table 7-1 shows the geological intervals of the seven wells drilled and the corresponding KCl grade, total carnallite and insoluble percentages.

Preliminary Economic Assessment and Preliminary Feasibility Study
NI 43-101 Technical Report
Project No.: 194379
7-11
Figure 7-6: Interpreted isopach map of the top of the Patience Lake Member to the base of the Belle Plaine Member in the project area

Preliminary Economic Assessment and Preliminary Feasibility Study
NI 43-101 Technical Report
Project No.: 194379
7-12
Table 7-1: Solution intervals, KCl grade, total carnallite, and insolubles of project area drill holes (Source: North Rim)
Member From (m) To (m) Solution Interval Thickness (m)
KCl Grade Over Potash Zone (%)
Total Carnallite over Potash Zone (%)
Total Insolubles Over Potash Zone (%)
02-09-27-15W2M
Patience Lake 1191.36 1197.50 6.14 30.65 0.51 8.21
Interbed Salt 1197.50 1203.61 6.11 6.37 0.63 5.06
Belle Plaine 1203.61 1211.60 7.99 25.85 0.62 3.86
Total 20.24
07-02-27-15W2M
Patience Lake 1187.81 1191.56 3.75 37.65 0.66 9.80
Interbed Salt 1191.56 1197.79 6.23 6.07 0.62 4.02
Belle Plaine 1197.79 1205.75 7.96 31.25 0.50 3.12
Total 17.94
11-18-27-15W2M
Patience Lake 1178.46 1187.10 8.64 27.39 0.40 9.80
Interbed Salt 1187.10 1193.52 6.42 6.93 0.57 5.42
Belle Plaine 1193.52 1201.44 7.92 30.03 0.53 4.28
Total 22.98
15-14-27-16W2M
Patience Lake 1213.14 1221.46 8.32 31.54 0.35 9.15
Interbed Salt 1221.46 1228.28 6.82 5.44 0.65 7.02
Belle Plaine 1228.28 1236.51 8.23 27.81 0.48 2.54
Total 23.37
15-16-27-15W2M
Patience Lake 1177.43 1186.39 8.96 29.23 0.39 9.73
Interbed Salt 1186.39 1192.72 6.33 7.97 0.55 4.73
Belle Plaine 1192.72 1200.84 8.12 29.26 0.48 3.01
Total 23.41
02-30-27-14W2M
Patience Lake 1162.11 1172.97 10.86 25.93* 0.47 6.86
Interbed Salt 1172.97 1177.64 4.67 6.69* 0.72 3.80
Belle Plaine 1177.64 1182.60 4.96 31.42* 0.56 4.60
Total 20.49
08-14-27-15-W2M
Patience Lake/ Interbed Salt
1179.22 1190.08 10.86 32.75* 0.62 8.76
Belle Plaine 1190.08 1195.44 5.36 32.59* 0.63 5.78
Total 16.22
Notes:
Note: Esterhazy was not used in the Mineral Resource Estimate.
Note: The Interbed Salt Member parameters are listed here for information purposes only and was only used in the Resource Estimate for 08-14 as the Interbed
was very thin and contained sufficient KCl grade.
* Indicates using a combination of Assay results and results from the chemical analysis of the dissolution test sample brines.
Preliminary Economic Assessment and Preliminary Feasibility Study
NI 43-101 Technical Report
Project No.: 194379
7-13
7.3 Geological Cross Sections
Figure 7-7 (A-A’) is an east-west representative geologic cross section incorporating five of the seven test holes drilled across the Project Area. Section A to A' extends from 15-14-027-16W2, the western most hole, eastward through wells 11-18-027-15W2, 15-16-027-15W2, 02-09-027-15W2 to 07-02-027-15W2.
The structural and stratigraphic relations of the PE shown on section A-A’ illustrate the regional southwest dip of the potash-bearing members. Towards the east, the upper potash beds of the PL are gradually truncated along a disconformable surface with the Upper Patience Lake Sub-member absent in well 07-02-027-15W2. This observation is consistent with Fuzesy (Fuzesy, 1982) who noted bevelling of potash beds by pre-Dawson Bay erosion, particularly within the PL.
The uppermost Member of the Dawson Bay Formation, the Hubbard Evaporite, is present in all seven wells. The Hubbard Evaporite is comprised of an upper halite unit overlying a basal argillaceous anhydrite. In general, the Hubbard Evaporite thins westward across the Project Area, pinching out west of 11-18-027-15W2 such that only the basal argillaceous anhydrite of the Hubbard Evaporite is preserved in 15-14-027-16W2.
.

Preliminary Economic Assessment and Preliminary Feasibility Study
NI 43-101 Technical Report
Project No.: 194379
7-14
Figure 7-7: East-west geological cross section (A – A’) through the five project area drill holes

Preliminary Economic Assessment and Preliminary Feasibility Study
NI 43-101 Technical Report
Project No.: 194379
7-15
7.4 Disturbances Affecting Geology of the Potash Bearing Members
A disturbance that affects the normal characteristics of the potash-bearing beds of the PE is called an anomaly and represents an area generally not suitable for mining. Potash Members of the PE can be affected by three general types of anomalies: washout anomaly, leach anomaly and dissolution or collapse anomaly. These features are shown in Figure 7-8 and are types of disturbances known to create anomalous zones within the main sylvinite-bearing beds in Saskatchewan.
A washout anomaly occurs where the sylvinite bed has been replaced or altered to a halite mass that consists of medium to large (0.5 cm to 1.0 cm) euhedral to subhedral halite crystals within a groundmass of smaller intermixed halite and clay insolubles. Clay intraclasts up to 1.0 cm long may be present, typically with a concentration of clay at the top and base of the altered zone. This type of disturbance is interpreted to be penecontemporaneous (i.e., occurring at the same time as deposition of the primary sylvinite, or shortly thereafter) and are thus local in nature.
A leach anomaly occurs where the sylvinite bed has been altered such that the sylvite mineral has been removed and replaced by euhedral to subhedral halite. Such anomalies are also termed salt horses or salt horsts by mine operators. If the altered zone crosses any stratigraphic boundaries, these boundaries are commonly unaltered. Workers underground interpret this type of disturbance as being post-depositional (i.e., after deposition of the primary sylvinite). These anomalies are commonly associated with underlying Winnipegosis reefs, suggesting that the reefs may have some formative influence upon the anomaly, as described by (Mackintosh & McVittie, 1983).
The third type of anomaly is a dissolution and collapse anomaly formed where the PE has been removed by dissolution of salt and the resulting void is infilled by material caved from above. This type of disturbance may be local (i.e., less than a square kilometer) or it may be regional (i.e., extending over several square kilometers) and may affect the entire thickness of the PE. An example of an unusual and severe case of this type of anomaly was encountered at Potash Corp’s Lanigan potash mining operation and is described in detail by Danyluk et al, 1999.
All three types of anomalies are commonly encountered in underground Saskatchewan potash deposits. Such anomalies impact mining operations in the sense that the grade of the potash ore sent to the mill decreases as anomalous ground is encountered, or that a portion of the potash ore or halite is left in the ground as these areas are not mined conventionally for safety reasons. Mining operations will abandon the anomalous ground and the safety pillar surrounding it. Generally, a combination of surface reflection seismic studies, both 2D and 3D, and careful examination of surface drill holes, underground (in-seam) geophysics, and geological observations of mining rooms is sufficient to identify potentially anomalous ground.

Preliminary Economic Assessment and Preliminary Feasibility Study
NI 43-101 Technical Report
Project No.: 194379
7-16
Figure 7-8: Disturbances affecting the continuity of the potash-bearing members (Modified from (Halabura & Hardy, 2007)).
An important aspect of estimating the potash potential of an area is to identify portions of the ground that may contain disturbances which affect the PE. If a drill hole penetrates a
Preliminary Economic Assessment and Preliminary Feasibility Study
NI 43-101 Technical Report
Project No.: 194379
7-17
disturbance, it may offer a vertical profile of an anomaly, but will not provide any information as to its lateral extent. Reflection seismic surveys offer the possibility to map the lateral extent of anomalies related to large-scale alteration of the PE. The dissolution of the main mass of PE with subsequent collapse of the overlying beds into the dissolution cavern may be captured in seismic; however, seismic may not necessarily define the lateral extent of more subtle anomalies such as washout or leach anomalies. The smallest detectable anomaly is dependent on the frequency of the data. Generally, anomalies in the order of 50 m can be detected.
Within the Project Area the 3D seismic in 2009, identified anomalous features both within the PE and the overlaying Manitoba Group carbonates. Seismic interpretations are provided by RPS and are presented in Appendix B of the April 2011 Encanto Technical Report (Stirrett, 2011). From the interpretations, significant anomalous features have been identified and deducted from the Mineral Resource estimation with the utilization of buffers to provide a safety factor, dependent upon the severity of the feature.
Further deductions to the Mineral Resource have been made for unknown anomalies such as steep dip angle, high carnallite, or low grade beds not detectable by seismic.
7.5 Property Mineralization
Potash mineralization showing economic potential was identified from drill hole data within the Project Area and consists of the PL Member and the BP Member. For the purposes of estimating Mineral Resource grade and tonnage, the top of the PL was placed at the top of the uppermost sylvinite bed of the PL, and the lower boundary was placed at the base of the lowermost sylvinite bed. The top of the BP was placed at the top of the sylvinite-bearing horizon occurring approximately 5.5 m below the base of the PL. The base of the BP was placed at the base of this Lower BP Sub-member bed.
For well 02-30-27-14W2 only the Upper BP Sub-member was used in the Resource estimate as the whole Member did not meet the Resource cutoff criteria. These Members were identified by the authors based on data collected from geochemical assays, core descriptions, seismic studies, and wireline log interpretation. The relationships between these Sub-members are shown in Figure 7-7.
7.5.1 Favorable Solution Mining Conditions
Key features used to evaluate potential solution mining areas are:
Thickness of mineralization to efficiently allow for the selective removal of the mineralized members.
Grade of the potash bed to ensure a consistent brine concentration and the effectiveness of the secondary mining.
Depth to the mineralized intervals will mean higher formation temperatures and increase the efficiency of the solution mining process.
Increased carnallite content will decrease the efficiency of the cavern dissolution and ultimately the potash recovery.
Presence of anomalies may reduce the thickness, grade and continuity of the mineralized zones.

Preliminary Economic Assessment and Preliminary Feasibility Study
NI 43-101 Technical Report
Project No.: 194379
7-18
Dip of the potash beds must be relatively low as increased dip may reduce the size of a cavern and therefore the resource recovery.
Presence of clay layers in the immediate roof can lead to premature failure of the roof and can limit the size of the cavern.
Based on the above described solution mining criteria, a solution resource interval is defined in the Project Area as the entire PL and the entire BP. The barren interbed salt is separated out and will be dealt with separately. An economic cutoff grade for the roof and floor picks was assumed to be where K2O values were greater than 10.0% (16% KCl) and where average ‘mineable grade’ was greater than 15.0% (24% KCl). Based on the drilling and resource definition, the EM was not included in the calculation as it has an average equivalent carnallite content of 8.05% (2.75% MgCl2) and the grade was lower than the economic threshold cutoff.
The borehole temperature in the Project Area is the temperature recorded by the wireline tools in the geological formations during the logging operation. The bottom hole temperature is the deepest temperature reading collected by the wireline tool, typically near the bottom of the borehole. This bottom hole temperature (BHT) ranges between 33° and 38°C in the Project Area. Weatherford, the company who conducted the wireline surveys, has stated that the accuracy of the temperature reading from the wireline tools is ±2°C.
During the 2011 drilling program, a Selective Formation Test (SFT) was conducted in the zone of interest. This tool was set at 1174.0 m and, over approximately 3 hours of testing, obtained a maximum temperature of 38°C; Weatherford has indicated this tool has an accuracy of ±0.1°C. The measured BHT readings may be 2 to 5°C less than actual rock temperature due to cooler drilling mud being circulated in the well; this effect is best assessed by leaving a sensor in the well for several days to allow the temperature to stabilize before taking a reading.
7.5.2 Carnallite Distribution
Examination of drill core and the geochemical assays for the seven wells completed during the 2010-2011 potash exploration programs show that carnallite mineralization is restricted to the EM and its immediate underlying halite interbeds. Carnallite mineralization was also found within the interbed salt directly above the EM in drill hole 02-30-27-14W2. Carnallite mineralization may persist up to 10.0 m past the base of the Esterhazy into the underlying halite. Throughout the EM, carnallite mineralization occurs as interstitial reddish-orange amorphous crystal masses commonly rimming sylvinite. Above the EM the total average carnallite grade, as calculated from drill core assays, is less than 1.0% equivalent carnallite over the UPL, LPL, and Upper BP Sub-members. The weighted averages of carnallite for each sub-member can be seen in Table 7-1.
7.6 Additional Mineralization Comments
The following statement by Phillips, 1982 summarizes the requirements when defining a potash resource in Saskatchewan, “the potash deposits that are located in Saskatchewan, Canada are characterized by their remarkable consistency of grade and thickness over many tens of kilometers. It is therefore possible to characterize a deposit with a relatively few drill holes, supplemented by sufficient seismic coverage to establish continuity between holes.”

Preliminary Economic Assessment and Preliminary Feasibility Study
NI 43-101 Technical Report
Project No.: 194379
7-19
The seismic survey results confirmed the presence of the PE sequence on the property. For potash to be exploited there are several conditions other than grade that must be met such as:
Carnallite content of the ore is below 2-3% as it can present problems for mining and ore processing. Carnallite is deliquescent meaning that it absorbs moisture from the surrounding air and can then release the water into the surrounding area as it is exposed. Carnallite is processed in many deposits around the world but requires different mining (solution mining) and processing methods commonly used in Saskatchewan.
Continuity of the potash members and shallow dipping beds are essential for solution mining methods.

Preliminary Economic Assessment and Preliminary Feasibility Study
NI 43-101 Technical Report
Project No.: 194379
8-1
8 Deposit Type
The word ‘potash’ is widely applied to naturally occurring potassium-bearing salts and their manufactured products and is often expressed by the chemical formula KCl (potassium chloride or sylvite). While several salt species are classified as potash minerals, sylvite (KCl) is the natural form of the principal ore mineral. The term sylvinite is applied to most sylvite-dominated potash beds. One tonne of chemically pure KCl contains an equivalent of 0.63 tonnes of K2O (potassium oxide), a chemical conversion typically employed to compare the nutrient levels in potash deposits of various mineralogical composition as well as various potash products. Reporting potash content as K2O is considered the industry standard. Potash has been used in the manufacturing of many industrial and commercial materials including soaps, glass, and textiles; however, potash is most commonly used as a primary ingredient in the production of crop fertilizers.
Potash deposits are an industrial mineral deposit that occurs primarily within sequences of salt-bearing evaporite sediments, with the potash mineral accumulations being hosted within the bedded halite layers. The extreme solubility of potash salts results in their formation in only highly restricted settings (e.g., sabkhas, barred intracratonic seas, evaporative lakes, etc.) where they precipitate from solution only towards the end of the evaporite depositional series (Warren, 2006). The potash salts are precipitated from these concentrated evaporating potassic brines as chemical sediments that are deposited at, or very near the depositional surface as the basin approaches desiccation. Their geologic provenance, therefore, dictates that they are typically confined to relatively narrow stratiform intervals and, excluding deformation, erosion, and other post-depositional destructive processes, nearly all potash deposits will therefore exhibit some degree of lateral continuity.
Most of the world’s salt and potash resources are extracted from these types of deposits with many the Canadian deposits using conventional mining methods (Warren, 2006). Where the deposit cannot be conventionally mined, solution mining is performed by injecting nearly saturated sodium brine into the deposit to more favorably dissolve only potash minerals. After some time, the potash-bearing liquor is recovered from the mine cavern and subsequently crystallized on surface into potassium salts which are then refined into the desired end-product. The immense size of many potash deposits worldwide means that a potash processing facility may exploit a single deposit for decades.
The authors propose that potash deposits can be of either ‘simple’ or ‘complex’ mineralogical character. A ‘simple’ potash is any deposit characterized by a sylvinite-dominated potash type with variable concentrations of impurities including halite, carnallite (KMgCl3•6H2O), and clay. The potash deposits underlying the prairies of Saskatchewan are considered a mineralogically ‘simple’ deposit. Other deposits worldwide, such as several of the European salt deposits, may bear a more variegated salt mixture and other exotic contaminant species. These deposits of a ‘complex’ mineralogical nature.
The potash deposits underlying Encanto’s Project Area belong to the Middle Devonian PE Formation and are considered ‘simple’ in mineralogy, being comprised predominantly of sylvinitic potash with variable amounts of carnallite and clay. The potash beds of the PE Formation constitute a truly world-class deposit because of their remarkable consistency in grade, geology, and lateral continuity over much of southern Saskatchewan and parts of Manitoba, North Dakota, and northeast Montana. Within the deposit, geological markers such as individual clay seams, potash layers, and halite interbeds can be traced over hundreds of kilometers.

Preliminary Economic Assessment and Preliminary Feasibility Study
NI 43-101 Technical Report
Project No.: 194379
9-1
9 Exploration
In 2012, Encanto completed a 3D seismic program in which 58.25 km2 of seismic data was shot over the north-east area of the property as seen in Figure 6-1. The program was completed to further the geological knowledge and assess potential risk related to mine development. The following is information obtained from RPS Group’s report 2012 Muskowekwan 3D – Final Seismic Interpretation Report (2013).
The data quality in the 2012 Muskowekwan 3D program was good and consistent with previously acquired data in the area. The 2012 Muskowekwan 3D data was compared to the 2010 Muskowekwan 3D data and the processing improved the overall data continuity and quality of the entire dataset. The 2010 data was updated which resulted in some changes to the previous interpretation with respect to collapse interpretation and the dip gradient maps but didn’t impact the interpretations used in the previous Mineral Resource estimations.
The regional features identified may have implications related to mining include the presence of Davidson Halite and Winnipegosis mounds. Local features that may have implications to mining include PE collapses, Second Red Beds structural dip, and higher probability of BP carnallite.
9.1 Davidson Halite Interpretation and Potential Wet Dawson Bay
The presence of the Davidson Halite can be interpreted to infer that the porosity in the underlying Dawson Bay will be salt-filled and poses less risk for brine inflow at the mining level. The Davison Halite was present in Well 08-14 and the data collected has allowed for an interpretation of the areal extent to be made. Figure 9-1 illustrates RPS Group’s interpretation of possible Davidson Halite presence outlined in brown. The presence of the Davidson Halite will not be significant for the project as the proposed mining method is solution mining. Water inflow risk associated to the Davidson Halite is only significant in conventional mines.
The Dawson Bay can be considered tight, meaning it has salt plugged pore spaces, or wet, meaning the pore spaces are filled with brine. As indicated previously, a wet Dawson Bay can cause mine inflow risk and thus it is important to understand areas where the potential of a wet Dawson Bay is present. Figure 9-2 illustrates the zones where the seismic data indicates a change in porosity in the Dawson Bay. Further investigation should be completed to determine the cause of the change in seismic response if mining were considered in this region of the Project Area. There were DST’s completed for many of the earlier wells drilled, however, these results were not used in the seismic interpretation. These should be reviewed further should the project consider a conventional mining plan.

Preliminary Economic Assessment and Preliminary Feasibility Study
NI 43-101 Technical Report
Project No.: 194379
9-2
Figure 9-1: Amplitude slice at Souris River Marker minus 2 ms with an area of thick Davidson halite outlined in brown (RPS, 2013)

Preliminary Economic Assessment and Preliminary Feasibility Study
NI 43-101 Technical Report
Project No.: 194379
9-3
Figure 9-2: 2EB -13 ms amplitude slice illustrating localized zones of increased porosity (RPS, 2013)

Preliminary Economic Assessment and Preliminary Feasibility Study
NI 43-101 Technical Report
Project No.: 194379
9-4
9.2 Second Red Bed Structural Dip
To assess potential damage at the Second Red Bed level, RPS examined the amplitude and coherency of the reflection, as a means of highlighting less competent or disturbed intervals. Within the project area, the Second Red Bed is largely undisturbed. Many of the amplitude anomalies are associated with known features. Weak amplitudes that are unexplained should be investigated further but do not impact the geological interpretations at this time.
9.3 Prairie Evaporite Collapse Interpretation
PE collapse features indicate areas where potash mineralization could be affected and are categorized into three classes. RPS Group (2013) describes them as follows:
Class 1 – Significant Upper Salt loss, show fracturing of events up to and above the Paleozoic Unconformity, and a break or sagging of the Second Red Bed.
Class 2 – Some Upper Salt loss, fracturing, and sagging above the PE.
Class 3 – Least severe and are identified by the sagging in the Second Red Bed with very little disturbance above the PE.
Within the new 3D seismic area two Class 3 collapses, four Class 2 collapses, and no Class 1 collapses have been identified. With the new seismic processing, the previous 3D data was re-interpreted and one Class 2 collapse has been upgraded to a Class 1 collapse, two new Class 2 collapses have been identified, and one new Class 3 collapse has been identified. Figure 9-3 illustrates the updated collapse features in the Project Area. These collapses can be seen in Figure 9-3.
9.4 Belle Plaine Carnallite
The probability of the presence of carnallite can be calculated to show areas where the possibility of high carnallitic areas exist. The data has been interpreted for the BP. Based on a visual inspection, the data can be calibrated for a high, medium, and low probability of encountering carnallite. Figure 9-3 illustrates the areas where a high probability of encountering carnallite exists. Since no wells have been drilled in these areas, it is possible this anomaly is caused by some other unknown grade change or lateral lithological disruption. If carnallite is encountered in future wells, the seismic data should be re-examined for evidence of carnallitic responses.

Preliminary Economic Assessment and Preliminary Feasibility Study
NI 43-101 Technical Report
Project No.: 194379
9-5
Figure 9-3: Probability of BP carnallite and collapses (RPS, 2012)

Preliminary Economic Assessment and Preliminary Feasibility Study
NI 43-101 Technical Report
Project No.: 194379
10-1
10 Drilling
Since 2009 there have been 7 wells drilled on the property. The objective of the various drilling programs was to define, within the Project Area, a geological dataset suitable for the development of a robust Mineral Resource. Drill hole locations were selected upon the following parameters:
The presence of laterally continuous potash-bearing strata (avoiding anomalous ground).
Positive results arising from RPS Boyd PetroSearch’s seismic interpretation and recommendations.
A drill hole spacing sufficient to allow for a representative evaluation of the Dawson Bay Formation.
A strategic plan incorporating the future acquisition of lands to the north of the Project Area.
The availability of drill hole data suitable for the documentation of an NI 43-101-compliant potash Mineral Resource.
The following is a summary of the drilling programs between 2009 and 2011. There has been no new drilling on the property since 2011.
Please refer to Table 7-1.
10.1 2009 Drilling Program
One hole, 02-09-27-15W2, was drilled on the Muskowekwan First Nation Home Reservation between November and December 2009. Barlon Engineering of Calgary, Alberta, was contracted to provide overall drilling management and supervision of the drill hole. North Rim did not provide onsite supervision or onsite technical assistance for 02-09-27-15W2.
The 2009 drill hole location was identified from seismic interpretation and selected based on the presence of laterally continuous potash-bearing strata and the absence of subsurface collapse structures and salt dissolution features.
10.2 2009 Drilling Procedures
Barlon Engineering of Calgary, Alberta was responsible for the drilling procedures during the 2009 program.
10.3 2009 Core Retrieval
Coring and core retrieval was completed by Baker Hughes of Calgary, Alberta. Coring was completed from the top of the Dawson Bay Second Red Bed Member through to the Lower Salt of the Prairie Evaporite Formation and the systematic retrieval of core was carried out. Ross Moulton of Encanto commented that a routine set of procedures were strictly followed to ensure that the in situ stratigraphic position of the core was maintained and to prevent loss of material. Involved in the core retrieval process were several coring personnel, the drill supervisor, and the onsite geologist.

Preliminary Economic Assessment and Preliminary Feasibility Study
NI 43-101 Technical Report
Project No.: 194379
10-2
The core was shipped to Core Laboratories Canada Inc. in Estevan, Saskatchewan where the core was analyzed by Total Gamma Ray Core Logger. The gamma ray core logger matched in depth and sequence with the open hole wireline logs. In December of 2009, Encanto commissioned North Rim to take possession of and process the 02-09-27-15W2 core. The core was shipped to North Rim’s core facility located at 2834 Millar Avenue in Saskatoon, Saskatchewan.
Once at the core lab, North Rim geologists photographed, split, described and determined assay sample intervals. The core samples were then shipped to a geoanalytical laboratory in Saskatoon, Saskatchewan for assay.
10.4 2010 Drilling Program
The 2010 drilling program began in early October and concluded in mid-November and included the completion of four stratigraphic test holes:
Encanto Lestock 07-02-27-15W2
Encanto Lestock 11-18-27-18W2
Encanto Lestock 15-16-27-15W2
Encanto Punnichy 15-14-27-16W2
Barlon Engineering of Calgary, Alberta, was contracted to complete the program utilizing oilfield drilling equipment capable of drilling to depths beyond that of the Prairie Evaporite Formation. A photograph of the drilling equipment is shown in Figure 10-1.
The drill holes were designed to further evaluate the potash mineral potential of the Prairie Evaporite Formation on the Project Area and were spaced with consideration to specific mineral resource buffers. All holes during the 2010 drilling program were vertical and drilled to penetrate the Prairie Evaporite Formation. All holes were drillstem tested, and cores were collected through the potash-bearing zones.

Preliminary Economic Assessment and Preliminary Feasibility Study
NI 43-101 Technical Report
Project No.: 194379
10-3
Figure 10-1: Ensign 25 Drilling Rig and Equipment.
10.5 2010 Drilling Procedures
The following drilling procedures were followed for all drill holes completed in 2010.
The well was drilled with a 349.0 mm bit diameter and gel chemical drilling mud to an approximate depth of 165.0 mKB, where surface casing was set and then cemented 244.5 mm surface casing. A 222.00 mm diameter borehole was drilled with brine drilling mud from surface casing to core point, which was located approximately 20.0 m above the Souris River Formation / Dawson Bay Formation interface. However, the Dawson Bay was not cored in Encanto Lestock 07-02-27-15W2.
199.0 mm core barrels were made up and cored down into the Dawson Bay Formation Second Red Bed Member. Then a drillstem test tool string was assembled and a bottom-hole drillstem test was taken over the Dawson Bay Formation. For well 15-14-27-16W2 an inflate straddle drillstem test was used instead the coring of the Prairie Evaporite was completed.
The mud system was then switched over from brine to invert drilling fluid. The core barrels were made up and continued to core to the base of the Esterhazy Member, or until no visible sylvite was present at the base of the cored interval. Finally, the well was drilled ahead with a 200.0 mm bit diameter to total depth, to the Winnipegosis Formation.
Weatherford logged the open hole section using the wireline program provided by North Rim Exploration and cement plugs were set as per the abandonment report to surface.

Preliminary Economic Assessment and Preliminary Feasibility Study
NI 43-101 Technical Report
Project No.: 194379
10-4
10.6 2010 Core Retrieval
Coring and core retrieval was completed by Blackie’s Coring Services of Estevan, Saskatchewan and Superior Coring Systems of Calgary, Alberta (see Figure 10-2). Blackie’s Coring Services completed the coring of wells 07-02-27-15W2 and 11-18-27-15W2. Superior Coring Systems completed the coring of wells 15-16-27-15W2 and 15-14-27-16W2. Upon completion of coring from the base of the Souris River (i.e. approximately 1127.0 mKB) through to the Lower Salt of the Prairie Evaporite Formation, the retrieval of core from the core barrel was carried out. A routine set of procedures were strictly followed by onsite personnel to ensure the in situ stratigraphy of the Prairie Evaporite Formation was maintained and to prevent loss of materials. In addition to several coring personnel, the drill supervisor and wellsite geologist, and one or two North Rim geologists supervised the core handling for the 2010 drill holes.
North Rim developed core handling protocol and the procedure is listed below:
1) A safety meeting was held prior to the recovery of each core. At this time, all safety issues were discussed along with proper core handling procedures.
2) Two core supervisors were on the drill while the core was being recovered from the barrel. The North Rim Core Supervisor oversaw the core retrieval on the floor while the Well Site Geologist supervised the core as it was laid down on the catwalk to ensure that the core was in proper sequence.
3) The procedures that were followed for the core retrieval were explained prior to each core retrieval to ensure that the core hands and rig team understood the importance of the process, including:
i. The brake was first bolted on to the coring barrel. A core hand would run the
brake and let the first piece of core out of the barrel while the other core hand
broke the core into approximately 0.5 m pieces. The core was then wiped off and
labelled with a grease marker on the bottom of core to indicate which end was
the bottom; and
ii. The lead core hand stopped the core retrieval process to show the rig hands how
to properly handle and place (most important) the core on the catwalk.
4) With a clearly marked core bottom, the core was placed on the catwalk with the bottom of the core starting at the far left corner of the core holders on the catwalk.

Preliminary Economic Assessment and Preliminary Feasibility Study
NI 43-101 Technical Report
Project No.: 194379
10-5
Figure 10-2: Blackie’s Coring Services Performing Core Retrieval.
5) The core was marked and placed on the catwalk using the methods described above. At the end of each 18.0 m core a core chaser or “rabbit” was run through the barrel to ensure no core was remaining inside the barrel. Once the core was laid out on the floor the well site geologist and North Rim Core Supervisor examined the core to ensure that the in situ Prairie Evaporite stratigraphy was maintained. The core was fitted together and the drill fluid was cleaned by using Varsol or Citrusol. A straight black line was drawn along the core axis with arrows pointing up hole to ensure that the core direction was maintained.
10.7 2011 Drilling Program
The 2011 drilling program began in September and concluded in October and included the completion of two stratigraphic test holes:
Encanto – Sundance Lestock 02-30-27-14W2
Encanto – Sundance Lestock 08-14-27-15W2
Codeco Energy Services of Calgary, Alberta, was contracted to complete the program utilizing oilfield drilling equipment capable of drilling to depths beyond that of the Prairie Evaporite Formation.
The drill holes were designed to further evaluate the potash mineral potential of the Prairie Evaporite Formation on the Project Area and were spaced with consideration to specific mineral resource buffers. In addition, the holes were designed to test for water bearing formations in the area to use as source water for mining operations. Both holes during the 2011 drilling program were vertical and drilled to penetrate the Prairie Evaporite Formation. Both holes were drillstem tested, and cores were collected through the potash-bearing zones.
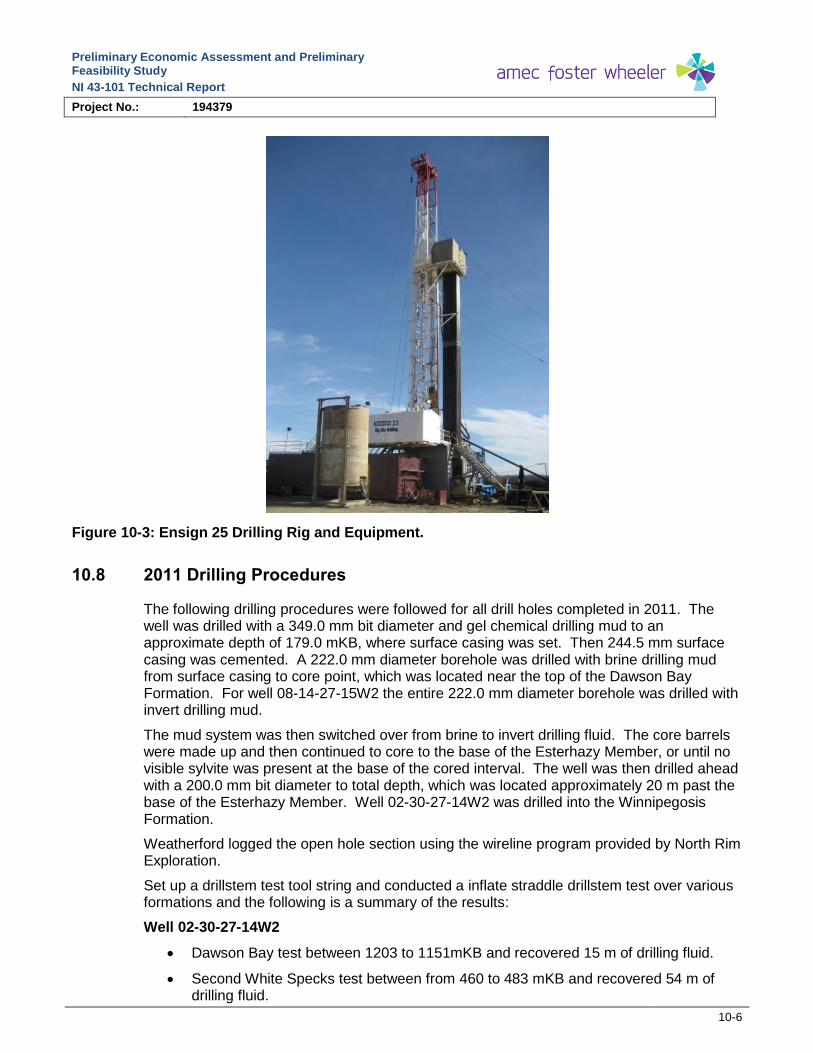
Preliminary Economic Assessment and Preliminary Feasibility Study
NI 43-101 Technical Report
Project No.: 194379
10-6
Figure 10-3: Ensign 25 Drilling Rig and Equipment.
10.8 2011 Drilling Procedures
The following drilling procedures were followed for all drill holes completed in 2011. The well was drilled with a 349.0 mm bit diameter and gel chemical drilling mud to an approximate depth of 179.0 mKB, where surface casing was set. Then 244.5 mm surface casing was cemented. A 222.0 mm diameter borehole was drilled with brine drilling mud from surface casing to core point, which was located near the top of the Dawson Bay Formation. For well 08-14-27-15W2 the entire 222.0 mm diameter borehole was drilled with invert drilling mud.
The mud system was then switched over from brine to invert drilling fluid. The core barrels were made up and then continued to core to the base of the Esterhazy Member, or until no visible sylvite was present at the base of the cored interval. The well was then drilled ahead with a 200.0 mm bit diameter to total depth, which was located approximately 20 m past the base of the Esterhazy Member. Well 02-30-27-14W2 was drilled into the Winnipegosis Formation.
Weatherford logged the open hole section using the wireline program provided by North Rim Exploration.
Set up a drillstem test tool string and conducted a inflate straddle drillstem test over various formations and the following is a summary of the results:
Well 02-30-27-14W2
Dawson Bay test between 1203 to 1151mKB and recovered 15 m of drilling fluid.
Second White Specks test between from 460 to 483 mKB and recovered 54 m of drilling fluid.

Preliminary Economic Assessment and Preliminary Feasibility Study
NI 43-101 Technical Report
Project No.: 194379
10-7
Wynyard Aquifer test between 209 to 227 mKB and recovered 88 m of drilling fluid.
Well 08-14-27-15W2
Dawson Bay test between 1142 to 1165 mKB and recovered 7 m of drilling fluid.
Lodgepole test between 663 to 684 mKB and recovered 180 m of drilling fluid
and 183 m of salt water.
Mannville test between 614 to 626 mKB and recovered 234 m of drilling fluid.
Wynyard Aquifer test between 202 to 224 mKB and recovered 81 m of drilling
fluid.
Mannville test between 614 to 617.5 mKB and recovered 310 m of drilling fluid
cut with salt water.
Wynyard Aquifer test between 178.5 to 182 mKB and recovered 31 m of drilling
fluid.
Cement plugs were set as per the abandonment report to surface.
10.9 2011 Core Retrieval
Coring and core retrieval was completed by Superior Coring Systems of Calgary, Alberta. Upon completion of coring from the Dawson Bay Formation through to the Lower Salt of the Prairie Evaporite Formation, the retrieval of core from the core barrel was carried out. A routine set of procedures were strictly followed by onsite personnel to ensure the in situ stratigraphy of the Prairie Evaporite Formation was maintained and to prevent loss of materials. In addition to several coring personnel, the drill supervisor and wellsite geologist, and one or two North Rim geologists supervised the core handling for the 2011 drill holes.
North Rim developed core handling protocol and the procedure is listed below:
1) A safety meeting was held prior to the recovery of each core. At this time, all safety issues were discussed along with proper core handling procedures.
2) Two core supervisors were on the drill while the core was being recovered from the barrel. The North Rim Core Supervisor oversaw the core retrieval on the floor while the Well Site Geologist supervised the core as it was laid down on the catwalk to ensure that the core was in proper sequence.
3) The procedures that were followed for the core retrieval were explained prior to each core retrieval to ensure that the core hands and rig team understood the importance of the process, including:
a) The brake was first bolted on to the coring barrel. A core hand would run the brake and let the first piece of core out of the barrel while the other core hand broke the core into approximately 0.5 m pieces. The core was then wiped off and labelled with a grease marker on the bottom of core to indicate which end was the bottom; and
b) The lead core hand stopped the core retrieval process to show the rig hands how to properly handle and place (most important) the core on the catwalk.
4) With a clearly marked core bottom, the core was placed on the catwalk with the bottom of the core starting at the far left corner of the core holders on the catwalk.

Preliminary Economic Assessment and Preliminary Feasibility Study
NI 43-101 Technical Report
Project No.: 194379
10-8
5) The core was marked and placed on the catwalk using the methods described above. At the end of each 18.0 m core a core chaser or “rabbit” was run through the barrel to ensure no core was remaining inside the barrel. Once the core was laid out on the floor the well site geologist and North Rim Core Supervisor examined the core to ensure that the in situ Prairie Evaporite stratigraphy was maintained. The core was fitted together and the drill fluid was cleaned by using Varsol or Citrusol. A straight black line was drawn along the core axis with arrows pointing up hole to ensure that the core direction was maintained.

Preliminary Economic Assessment and Preliminary Feasibility Study
NI 43-101 Technical Report
Project No.: 194379
11-9
11 Sample Preparation, Analyses, and Security
11.1 Geochemical Sampling
All geochemical sampling activities were carried out at North Rim’s Core Lab facilities located at 2834 Millar Avenue in Saskatoon, Saskatchewan (refer to Figure 11-1). Prior to sampling the following steps were systematically carried out:
1. Upon arrival at the lab, the core boxes were carefully unloaded from the transport vehicle and laid out in sequential order onto the examining tables.
2. Core box lids were removed and the core bags remained sealed until sampling procedures or logging processes commenced. If carnallite was present, the plastic bags were replaced when the core was not being examined to minimize exposure to the atmosphere.
3. Using a cloth wetted with a saturated brine solution, the core was cleaned thoroughly by wiping mud and debris from the surface in order to identify the potash beds, clay seams, and mineralogical changes within the core.
Figure 11-1: Photograph inside North Rim’s core lab and storage warehouse (Source: North Rim)
11.2 Controls on Sample Interval Determination
The following points summarize the steps taken by the laboratory staff during the geochemical sampling of potash core from the Project Area:
1. Selection of the correct assay intervals was conducted by North Rim geologists. Geochemical assay sampling was separated into two separate intervals. The first began at the top of the PL Member to the base of the BP Member. The second interval included the entire EM. The salt interbed between the BP and the EM was not sampled. The formation contacts were chosen from the geophysical logs as the tops were occasionally ambiguous in the core making them difficult to identify. The first and last samples taken over the two separate potash intervals were intended to

Preliminary Economic Assessment and Preliminary Feasibility Study
NI 43-101 Technical Report
Project No.: 194379
11-10
capture the initial and final presence of sylvite, but often two to three samples were taken to ensure all sylvite was sampled.
2. Once the sample intervals were determined the core was slabbed lengthwise into halves by laboratory assistants with a dry, 2-horsepower band saw equipped with a dust collection system (see Figure 11-2). Once slabbed, the two core halves were placed back into their respective box in proper stratigraphic order, with both cut surfaces facing up. The cutting process was supervised at all times by a North Rim geologist. Saw blades were replaced frequently when any breach of core integrity was noted (i.e., crystal fracturing or splintering of core).
3. The upper core half was divided into individual samples by drawing straight lines across the core diameter in permanent black marker, utilizing natural core breaks where possible. The determination of individual samples is based on several parameters outlined in Section 11.3.
4. The core is then depth corrected by matching intervals of core to their corresponding intervals on the geophysical wireline logs which were collected at the well site. Once the entire assay interval was slabbed, the cut surfaces were wiped down with a damp cloth to remove any rock powder generated by cutting.
5. As the samples were chosen they were labeled using a numbering scheme that incorporated both the drill hole number and a sample number (e.g., 02-30-S001).
6. The sample number was written on the top piece of the upper core half in permanent black marker. A sample tag bearing this number was prepared to be used for identification in the core photo. Figure 11-3 illustrates an example of the core photography and sampled core.
7. Once samples were peer reviewed, the core was photographed with a high resolution digital camera attached to an extendable arm on a tripod. The core was moistened with a damp cloth to enhance the photographic quality of the photos.
8. Each sample within the assay interval was carefully measured to the nearest centimeter and the sample length recorded into the appropriate assay and logging spreadsheets. The sample intervals and ID’s were then transposed onto the cut surface of the underlying second half of the core in the box (see Figure 11-3).
9. The upper core half was cross-cut into the designated sample intervals with the band saw by the lab assistant(s) under the direct supervision of the geologist. Each sample and its corresponding sample tag were placed into a waterproof, plastic sample bag and stapled to enclose the sample within the bag. The sample ID was written on the sample bag in permanent black marker.
10. Samples were placed into plastic pails and sealed with lids. The well ID, sample interval, and pail number were labelled on the lids and the side of the pails. Shipping sheets were completed that included well information, pail numbers, sample numbers, and contact information and accompanied the samples to the SRC.

Preliminary Economic Assessment and Preliminary Feasibility Study
NI 43-101 Technical Report
Project No.: 194379
11-11
Figure 11-2: Dry 2-horsepower band saw with dust collection system (Source: North Rim)
Figure 11-3: Sampling interval from Encanto drill hole 02-30-027-14W2 (core 5, boxes 3 and 4) (Source: North Rim)
The core recovery was excellent for all wells and the cutting and slabbing of the drill core did not result in any notable material loss. The accuracy and reliability of the assay samples was not compromised during the sampling procedure. It is the opinion of the authors that the samples chosen for geochemical analyses are representative of the selected intervals based on the above discussed parameters and guidelines.
North Rim geologists delivered the samples to Saskatchewan Research Council Geoanalytical Laboratories (SRC) at 125 – 15 Innovation Boulevard in Saskatoon, Saskatchewan for analysis. There, the samples were crushed, split and analyzed according to the parameters stated in SRC’s basic potash analysis package. Quality assurance and quality control (QA/QC) measures were strictly adhered to, including the use of standards,
Preliminary Economic Assessment and Preliminary Feasibility Study
NI 43-101 Technical Report
Project No.: 194379
11-12
blanks and duplicates throughout the analysis period. North Rim was not involved in procedures performed at SRC once the samples were delivered, nor was North Rim there to supervise the analysis process. Assay results generated are reviewed and approved by SRC prior to release.
11.3 Sampling Method and Approach
The determination of individual samples within an assayed interval was based on the following geological parameters:
1. Changes in lithology, mineralogy, K2O grade, crystal size, or insoluble content warranted a new sample. Clay seams were broken out as individual samples, with approximately 1.0 cm of overlap on either side of the seam.
2. Samples did not span geological contacts including the upper and lower boundaries of the potash members. When possible, existing breaks within the core were used. Samples did not exceed 30.0 cm in length.
Visual inspection of the core in conjunction with consultation of the respective gamma, density, and photoelectric curves for the drill holes provided North Rim geologists with sufficient information to accurately assess changes in mineralogy, lithology, and grade. Within mineralized zones, new sampling intervals were established where changes in grade occurred; low-grade, moderate-grade and high-grade mineralized zones are set at K2O percentages of >10%, >20% and >30% respectively, estimated from the gamma curves. These K2O percentages correlate to approximately 140, 270, and 390 API units.
11.4 Sampling Method and Approach – For Geomechanical and Dissolution Samples
Prior to geochemical sampling, whole core samples were taken from the cored wells from the 2011 drilling program based on the requirements by Agapito and Novopro and all sampling was done under their direction. The following points summarize the steps taken by the North Rim laboratory staff during the geomechanical sampling of potash core from the Project Area:
1. North Rim geologist’s depth corrected the core and conducted detailed core logging descriptions in terms of lithology and estimated grade.
2. The samples were selected with respect to obtaining the most representative rock within the planned cavern intervals. This consisted of:
a. Good distribution of low, medium, and high grade sylvinite cores.
b. Representation of the different layers of the mining interval.
c. Some upper and intermediate salt content.
d. A homogeneous core (no sharp interfaces between insoluble, halite, and sylvinite).
3. Samples were then numbered and labeled. An arrow was drawn to indicate the bottom of the drill hole.
4. Samples were packed for shipping in core boxes as follows:
a. Each core was wrapped in plastic wrapping.

Preliminary Economic Assessment and Preliminary Feasibility Study
NI 43-101 Technical Report
Project No.: 194379
11-13
b. Each core was wrapped in two layers of bubble wrap.
c. Cores were placed in core boxes and packed with newspaper to ensure they were secure (i.e., no movement in the box).
d. The core boxes were then placed on a pallet and shrink wrapped and secured with tie downs.
11.5 Sample Quantities and Dimensions
A total of 26 geo-mechanical samples and 46 dissolution samples were taken over the two wells.
These samples had:
A length of approximately 30 cm and were full diameter core (89 mm diameter).
No physical deterioration.
Avoided contact with water and did not present re-crystallization on their surfaces.
Once the geo-mechanical samples were returned to North Rim, the samples were split and sent in for assay sampling at SRC.
All geo-mechanical and dissolution sample intervals were discussed with Agapito and Novopro prior to shipment.
11.6 Sample Preparation, Analysis, and Security
The following procedures were closely followed to ensure that the core was under the supervision of qualified personnel at all times:
1. From the retrieval of the core at the drill site to the shipment of the core to the North Rim Exploration Core Lab in Saskatoon, it was under the care and supervision of the Drilling Supervisor, Wellsite Geologist, or North Rim’s Core Supervisor.
2. Following the core retrieval, the core was wrapped in plastic, boxed and secured on site. Immediately following the completion of coring, a hotshot courier from the coring company delivered the locked core trailer to North Rim’s core facility in Saskatoon, Saskatchewan.
3. As soon as the core arrived at the core laboratory, North Rim lab staff inspected the shipment and unloaded the core onto the tables in stratigraphic order. From this point forward, North Rim geologists were responsible for the supervision of the core. The North Rim Core Lab is equipped with an alarm system to ensure the security and integrity of the core when the lab is not under direct surveillance. North Rim’s lab is temperature and humidity controlled to prevent rapid deterioration of the core. All samples were selected, cut, and packaged as quickly as possible under the supervision of a North Rim geologist.
4. Samples collected for geochemical assay sampling were secured in plastic bags to ensure they were not exposed to moisture. To preserve sample identification, the sample number was written on the sample in permanent ink, on a sample tag placed inside the bag, and on the bag the core was placed in. The sample bags were sealed and packed into labeled pails and remained sealed until they were opened for processing at the SRC Lab.
Preliminary Economic Assessment and Preliminary Feasibility Study
NI 43-101 Technical Report
Project No.: 194379
11-14
5. Samples were delivered by North Rim staff to the SRC Laboratories at 125 – 15, Innovation Boulevard in Saskatoon, Saskatchewan, for analysis. SRC is an International Organization for Standardization (ISO) accredited to 17025. Information sent along with the sample shipment included the client name, address, distribution email list, type of geochemical analyses required, and a sample list clearly explaining which samples were stored in each pail.
6. When SRC received the core samples at the lab, they signed, dated and returned the North Rim Packing Slip to the North Rim employee who delivered them. After confirming that the sample list matched the samples in the pails, a Sample Receipt Report was emailed to a pre-determined distribution list.
The following sample preparation procedures were carried out by SRC employees (Modified from the SRC Geoanalytical Laboratories Sample Report outlining work carried out on samples submitted by North Rim):
1. Prepared an in-house sample list and group number for the shipment.
2. Labelled sample vials with the appropriate sample numbers.
3. Individually crushed all samples in the group.
4. Evenly distributed each sample in the splitter to avoid sample bias. Cleaned the crusher and splitter equipment between each sample using compressed air.
5. Split the crushed sample and inserted one portion into the appropriate sample vial.
6. All material that did not get analyzed (reject) was resealed in original labelled plastic bags and stored in plastic pails with appropriate group number marked on the pail.
7. Sent vials of material for grinding. The material was placed in a pot, ground for 1 minute then returned to the vial. Vials were visually inspected to ensure fineness of material. Grinding pots were cleaned with compressed air between each sample and cleaned with silica sand and rinsed with water between each group.
8. The pulverized samples were placed in a tray and sample paperwork was submitted to the Main Office. Worksheets were created detailing the samples to be analyzed, the type of analyses requested as well as the standards, blanks and split replicates to be completed.
9. The samples and paperwork were sent to the Geochemical Laboratory and samples were analyzed using SRC’s Basic Potash Package (Soluble Inductively Coupled Plasma [ICP], % Insolubles, and % Moisture).
10. With each set of 40 samples, 2 potash standards, 1 quartz blank, and 1 sample pulp replicate analysis was completed. After processing the entire group of samples, a split sample replicate was completed. After receiving all results from the Geoanalytical Lab, the QA/QC department completed checks to ensure accuracy.
11. Upon completion of the assaying and QA/QC procedures, the geochemical results were emailed to the Encanto contact list in a password-protected zip file.
According to the SRC Geoanalytical Laboratories Customer Quality Control policy the sample preparation and analytical procedures are of the highest quality and are NI 43-101-compliant.

Preliminary Economic Assessment and Preliminary Feasibility Study
NI 43-101 Technical Report
Project No.: 194379
12-1
12 Data Verification
The authors are able to provide verification of the Encanto 2011 exploration program and all associated geochemical data as they were involved in all aspects of the sampling process and carried out measures to ensure the security and integrity of the core. The sampling and assaying procedures detailed in Section 11 were of the highest quality and are compatible with procedures typically undertaken in industry. Tabetha Stirrett, the Qualified Person, has verified the data relied upon for all aspects of the Mineral Resource estimate.
12.1 Assay-to-Gamma Data Verification
The assay-derived % K2O data and the associated gamma curves have been correlated for each hole of the two 2011 drill holes. The purpose of this study was to cross-reference the two data sets as a data verification procedure. The two data sets were plotted on the same graph for each hole, with potash grade along the x-axis and depth along the y-axis. The depths recorded by the gamma wireline curve were taken as true depths and the assay sample intervals were adjusted to these curves using a best-fit approach. These adjustments were completed on an individual core run scale over the sampled intervals for each drill hole. An overall correlation between the assay and gamma data of 97% was obtained over all drill holes (Table 12-1).
Table 12-1 summarizes how closely the assayed values correlated to the estimated % K2O based on the Gamma-ray Estimation Correlation (GREC) developed by Bannatyne (Bannatyne B., 1983). This is completed by comparing the assayed values with the estimated values obtained from the gamma ray log. For each potash member, a weighted % K2O was calculated from both the assay and the GREC over the same interval. The following formula was used to compare these values:
% 𝐶𝑜𝑟𝑟𝑒𝑙𝑎𝑡𝑖𝑜𝑛 = [1 − |𝐴 − 𝐺
𝐴 + 𝐺| ] × 100
where A = %K2O from Assay, G = %K2O from GREC and 𝐴−𝐺
𝐴+𝐺 is the absolute value.
Table 12-1: Encanto drill holes with Assay vs. GREC correlation (Source: North Rim)
Drill Hole Assay vs. GREC Correlation (%)
02-09-27-15W2M 94
07-02-27-15W2M 97
11-18-27-15W2M 99
15-14-27-16W2M 98
15-16-27-15W2M 98
2-30-27-14W2M 96
8-14-27-15W2M 96
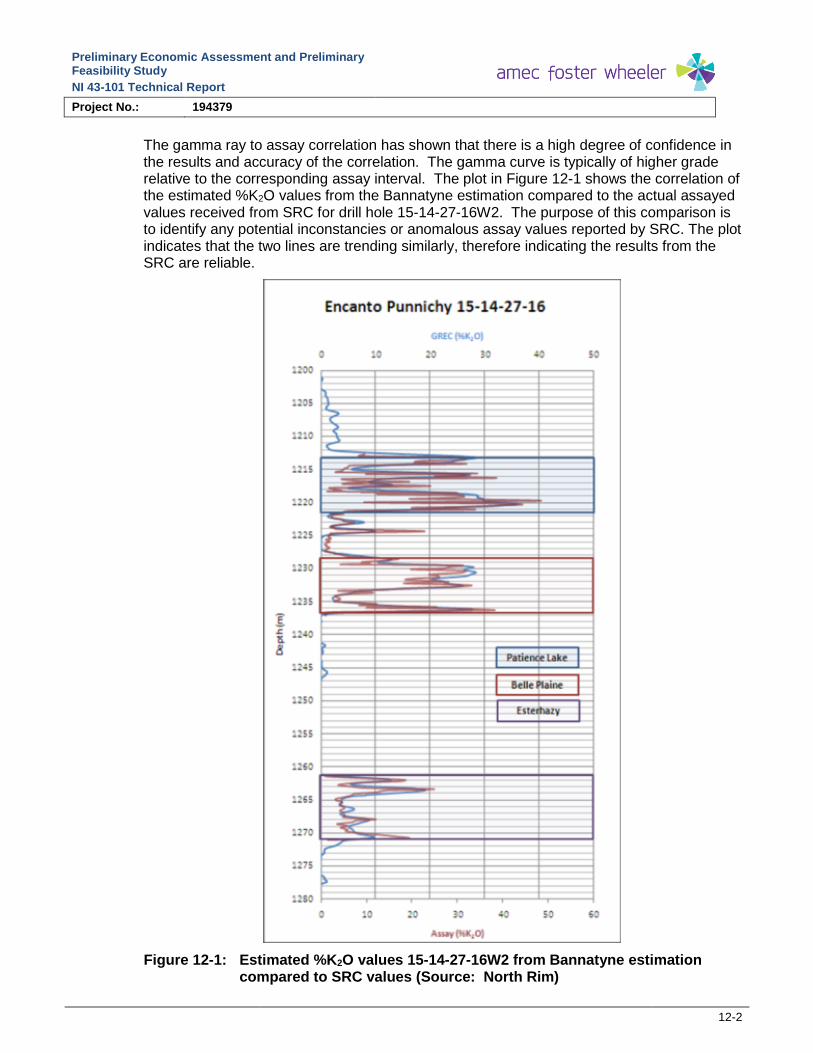
Preliminary Economic Assessment and Preliminary Feasibility Study
NI 43-101 Technical Report
Project No.: 194379
12-2
The gamma ray to assay correlation has shown that there is a high degree of confidence in the results and accuracy of the correlation. The gamma curve is typically of higher grade relative to the corresponding assay interval. The plot in Figure 12-1 shows the correlation of the estimated %K2O values from the Bannatyne estimation compared to the actual assayed values received from SRC for drill hole 15-14-27-16W2. The purpose of this comparison is to identify any potential inconstancies or anomalous assay values reported by SRC. The plot indicates that the two lines are trending similarly, therefore indicating the results from the SRC are reliable.
Figure 12-1: Estimated %K2O values 15-14-27-16W2 from Bannatyne estimation compared to SRC values (Source: North Rim)
Preliminary Economic Assessment and Preliminary Feasibility Study
NI 43-101 Technical Report
Project No.: 194379
12-3
12.2 Historical Drill Holes
There are two wells drilled in 1954 and 1955 located to the Southwest of the Project Area in township 26, ranges 16 and 17. These two holes are Pyramid Gordon No 1 (03-28-026-16W2) and IMP TW Gordon (07-14-026-17W2). Both holes are near the Project Area, but targeted oil bearing formations. B.A. Swenson 3-36 located at 03-36-026-14W2 to the east of the property has a well log which shows the intersection of the potash members with the top of the Prairie Evaporite at 1189.90 m. The authors were unable to estimate a grade from the log because it was in Ra-eq/ton, versus the standard API units that can be easily correlated to %K2O.
There has been little exploration activity in this region prior to 2009 when Encanto Potash began exploration in the area. Due to the lack of exploration prior to 2009 and the relative location of the historical data with respect to the Project Area, North Rim cannot say with certainty that the historical data is accurate or in what manner it may correlate to the Project Area. There is not a high degree of confidence in the historical data present in this region.
Preliminary Economic Assessment and Preliminary Feasibility Study
NI 43-101 Technical Report
Project No.: 194379
13-1
13 Mineral Processing and Metallurgical Testing
Geochemical testing consisting of core dissolution tests were performed to obtain basic data regarding the expected concentrations of potassium chloride (KCl), sodium chloride (NaCl and other solutes in the brines produced in the solution mine caverns and sent to the processing plant.
Mineral processing was not tested at the pilot plant level at this stage. Evaporation and crystallization of potash-bearing brines are proven technologies already used in commercial ventures. For this reason, the process does not require testing at this stage or any future phases of the Project.
13.1 Dissolution Test Work
The purpose of these tests was to predict the brine grade and KCl content achievable with respect to the mineral deposit properties. An assembly of cores from the last two explorations wells, Encanto Lestock 08-14-27-15 and Encanto Lestock 02-30-27-14, were sent to the NG Consulting laboratory in Germany for dissolution testing.
The core material was chosen to represent the PL and BP potash members, the ‘salt back’ above the PL member, the halite interbed between the PL and BP members and the halite interbed in the floor of the BP representing a range of naturally occurring rock variations in order to obtain an average brine grade with respect to the primary mining dissolution process. Generally the cylindrical core samples were dissolved using hot solvent (water) at a pre-determined temperature established to correspond with the project-specific mining parameters, with brine samples taken at set time intervals. The composition and chemical properties of the brine measured allow for the evaluation of the dissolution kinetics and phase chemistry of each of the materials sampled.
With respect to the dissolution kinetics, it was found that the dissolution rates of the Encanto samples are in a range comparable to sylvinite found in similar deposits. There was a marginal dissolution rate gain from increasing the solvent temperature from 60°C to 75°C. Regarding the phase chemistry, no significant differences in brine grade between the potash members (BP and PL) were observed. In addition, no significant differences from standard dissolution ranges, usually caused by MgCl2 bearing minerals like Carnallite, were observed.

Preliminary Economic Assessment and Preliminary Feasibility Study
NI 43-101 Technical Report
Project No.: 194379
13-2
Table 13-1 presents the expected nominal, maximum and minimum concentrations of the primary salts in the primary production brine at the design cavern temperature of 60°C.
Table 13-1: Salt content of primary production brine at 60°C cavern temperature (Source: Agapito)
Components Nominal Content (g/L)
Maximum Content (g/L)
Minimum Content (g/L)
KCl 148 155 140
NaCl 254 257 250
MgCl2 0.7 2 0.02
CaSO4 2.3 3.3 0.6
CaCl2 0.5 2.3 0.01
Brine Temperature 60°C
Preliminary Economic Assessment and Preliminary Feasibility Study
NI 43-101 Technical Report
Project No.: 194379
14-1
14 Mineral Resource Estimates
This section summarises the Mineral Resource Estimate for the Preliminary Economic Analysis with an effective date of 24 May 2017.
The Mineral Resource is based on the assumption that the recovery of the potash will be by solution mining methods. Conventional underground mining is not considered feasible due to the depth (1,750 m) to the top of the mineralized beds. The 2011 Preliminary Economic Assessment report (Kotowski, et al., 2011) addressed the economic and mining parameters (Modifying Factors in CIM [2014] Definition Standards) associated with solution mining, which were considered when determining the parameters used for the Mineral Resource estimate.
The Mineral Resources derived herein were estimated by Qualified Persons Ms. Tabetha Stirrett, P. Geo., with the assistance of Mr. Brett Dueck, P. Eng., of North Rim.
14.1 Indian Mineral Lands
The area used for the Mineral Resource presented in this Technical Report was based on the land package held by Muskowekwan on 27 May 2013. At the time the Project Area consisted of approximately 61,114 acres of Indian Reserve home reserve. As of 27 March 2017, IR 85 has been expanded to include adjacent TLE land, thereby increasing the size of the Project Area (see Section 4). These additional lands and mineral rights have not been included in the Mineral Resource estimate. The area spans a region encompassing Township 27, Range 14, 15 and 16 west of the Second Meridian.
14.2 Assumptions and Methodology
The following principles of exploration techniques and sampling methods commonly employed by other Saskatchewan potash mine operators were used in determining the potential extent, quality, and volume of the potash Mineral Resource:
The primary method employed to determine thickness and concentration of potash mineralization were the 2009, 2010, and 2011 drill core in conjunction with assay testing.
The extent of potash mineralization and continuity between drill holes (i.e., areal extent of potash beds) is determined by subsurface mapping as well as maps compiled from the 3D seismic survey as interpreted by RPS. The limiting factors are property boundaries and structural disturbances related to dissolution of the PE Formation and subsequent collapse of overlying beds.
For estimation of the Mineral Resource the areal extent surrounding a drill hole for which it is reasonable to infer geological continuity is termed the radius of influence (ROI). This is estimated from the hole centre to 0.8 km for a Measured Resource, 0.8 km to 2.0 km for an Indicated Resource, and 2.0 km to 5.0 km for an Inferred Resource. A 5.0 km Inferred ROI was selected as it covers the area of the 3D seismic survey and hole spacing sufficiently to provide confidence in the continuity of the geology in the Project Area.
Based on review of the 3D seismic survey conducted by RPS, it is possible to divide the Project Area into three areas for estimating the presence of a Mineral Resource as follows:

Preliminary Economic Assessment and Preliminary Feasibility Study
NI 43-101 Technical Report
Project No.: 194379
14-2
○ Areas identified rom seismic data to be affected by the processes of subsurface dissolution and removal of the PE, the collapse areas. These areas have been removed from the resource estimates.
○ Areas with a high probability of carnallite within portions of the BP Member as interpreted by RPS. These areas have been removed from the resource estimates.
○ Areas interpreted from seismic to have continuous geology with no subsurface dissolution or alteration of the PE.
The Esterhazy Member did not demonstrate consistent K2O grade and was of higher carnallite grade. Consequently, it was not included in the resource estimates.
Areas deemed to have anomalies based on review of the 3D seismic study conducted by RPS are presented in Figure 14-1 which shows the Mineral Resource areas for the BP. Table 14-1 summarizes the acreages for the areas in the BP affected by anomalies.
Table 14-1: Areas affected by anomalies or buffers in the Belle Plaine Member (Source: North Rim)
Solution Mining Scenario Area Summaries
Affected by Anomalies 7,194 acres
Not Affected by Anomalies Area 53,920 acres
Total 61,114 acres
Note:
The areas used are from the Belle Plaine Member as it was most affected by anomalies.
14.3 Regions Affected by Anomalies
Based on the authors’ previous experience, publically available data and the amount of disturbance detected in the upper stratigraphic sequences by 3D seismic, the following distance buffers were used around the identified anomalies.
Table 14-2: Deductible anomaly buffer sizes (Source: North Rim)
Buffers Distance (m) Comments
Class 1 Anomalies Visually Picked Based on the degree of slope determined by looking at 2RB.
Class 2 Anomalies Visually Picked Based on if the anomaly is interpreted to affect the 2RB
Class 3 Anomalies Visually Picked Based on if the anomaly is interpreted to affect the 2RB
Carnallite Areas 0 Mine right up to the interpreted edge
Lestock Town 800
Resource Buffers Distance (m) Comments
Inferred 5000
Indicated 2000
Measured 800 Inside 3D Seismic Area only

Preliminary Economic Assessment and Preliminary Feasibility Study
NI 43-101 Technical Report
Project No.: 194379
14-3
RPS and North Rim reviewed each collapse to determine the severity based on the slope of the beds, which was determined with the assistance of Mike Hardy of Agapito. All known collapse anomalies and high probability carnallite areas as identified by 3D seismic have been excluded from the Resource estimates based on the criteria listed in Table 14-2. The interpreted high probability carnallite was only removed from the affected sub-unit, the BP Member.
In addition, deductions have been made for those features not detectable by seismic. These can include areas of significant dip, elevated carnallite content and leach and washout anomalies. Based on publically available data concerning mineral resource estimates, indicates that up to 25% is a typical deduction for unknown detectable anomalies. Based on this information, the following deductions were made to the Resource estimate:
Measured Resource
○ Inside 3D – 5%
○ Outside 3D – N/A
Indicated Resource
○ Inside 3D – 9%
○ Outside 3D – 15%
Inferred Resource
○ Inside 3D – 15%
○ Outside 3D – 25%
Areas deemed to have anomalies based on review of the 3D seismic study conducted by RPS are presented in Figure 14-1. The 3D data acquired in 2012 has not been used for this estimation and should be incorporated for the next mineral resource update. For this reason, well 2-30 does not have Measured Mineral Resources reported.
Another difference between this resource and the 2013 PFS resource is that the area under the plant site was not included in the resource numbers. For the PEA restated resource the area under the proposed plant site has been included in the resource estimate. This results in a higher Inferred Resource tonnage.

Preliminary Economic Assessment and Preliminary Feasibility Study
NI 43-101 Technical Report
Project No.: 194379
14-4
Figure 14-1: Area extent and mineral resource areas for the BP Member (Source: North Rim)

Preliminary Economic Assessment and Preliminary Feasibility Study
NI 43-101 Technical Report
Project No.: 194379
14-5
14.4 Mineral Resource
The definitions in the following sections on the Mineral Resource definitions can be found in the 10 May 2014 CIM Definition Standards document prepared for Mineral Resources and Mineral Reserves (CIM, 10 May 2014).
14.4.1 Inferred Mineral Resource
“An Inferred Mineral Resource is that part of a Mineral Resource for which quantity and grade or quality are estimated on the basis of limited geological evidence and sampling. Geological evidence is sufficient to imply but not verify geological and grade or quality continuity.”
“An inferred Mineral Resource has a lower level of confidence than that applying to an Indicated Mineral Resource and must not be converted to a Mineral Reserve. It is reasonably expected that the majority of Inferred Mineral Resource could be upgraded to Indicated Mineral Resource with continued exploration.”
“An Inferred Mineral Resource is based on limited information and sampling gathered through appropriate sampling techniques from locations such as outcrops, trenches, pits, workings and drill holes. Inferred Mineral Resources must not be included in the economic analysis, production schedules, or estimated mine life in publicly disclosed Pre-Feasibility or Feasibility Studies, or in the Life of Mine plans and cash flow models of developed mines. Inferred Mineral Resources can only be used in economic studies as provided under NI-43-101.”
14.4.2 Indicated Mineral Resource
“An Indicated Mineral Resource is that part of a Mineral Resource for which quantity, grade or quality, densities, shape and physical characteristics are estimated with sufficient confidence to allow the application of Modifying Factors in sufficient detail to support mine planning and evaluation of the economic viability of the deposit. Geological evidence is derived from adequately detailed and reliable exploration, sampling and testing and is sufficient to assume geological and grade or quality continuity between points of observation.”
“An Indicated Mineral Resource has a lower level of confidence than that applying to a Measured Mineral Resource and may only be converted to a Probable Mineral Reserve.”
“Mineralization may be classified as an Indicated Mineral Resource by the Qualified Person when the nature, quality, quantity and distribution of data are such as to allow confident interpretation of the geological framework and to reasonably assume the continuity of mineralization. The Qualified Person must recognize the importance of the Indicated Mineral Resource category to the advancement of the feasibility of the project. An Indicated Mineral Resource estimate is of sufficient quality to support a Preliminary Feasibility Study which can serve as the basis for major development decisions.”
Preliminary Economic Assessment and Preliminary Feasibility Study
NI 43-101 Technical Report
Project No.: 194379
14-6
14.4.3 Measured Mineral Resource
“A Measured Mineral Resource is that part of a Mineral Resource for which quantity, grade or quality, densities, shape, and physical characteristics are estimated with confidence sufficient to allow the application of Modifying Factors to support detailed mine planning and final evaluation of the economic viability of the deposit. Geological evidence is derived from detailed and reliable exploration, sampling and testing and is sufficient to confirm geological and grade or quality continuity between points of observation.”
“A Measured Mineral Resource has a higher level of confidence than that applying to either an Indicated Mineral Resource or an Inferred Mineral Resource. It may be converted to a Proven Mineral Reserve or to a Probable Mineral Reserve.”
“Mineralization or other natural material of economic interest may be classified as a Measured Mineral Resource by the Qualified Person when the nature, quality, quantity and distribution of data are such that the tonnage and grade or quality of the mineralization can be estimated to within close limits and that variation from the estimate would not significantly affect potential economic viability of the deposit. This category requires a high level of confidence in, and understanding of, the geology and controls of the mineral deposit.”
14.5 Potential Solution Mining Intervals
“The term Mineral Resource covers mineralization and natural material of intrinsic economic interest which has been identified and estimated through exploration and sampling and within which Mineral Reserves may subsequently be defined by the consideration and application of Modifying Factors.”
The drill holes used in the solution mining resource estimate are shown in Figure 24-2.
The mineral resource is present over most of the Project Area, supported by consistent thicknesses and grades and as demonstrated by the core holes, regional drill holes, and 2D and 3D seismic surveys.
The Measured, Indicated, and Inferred Resources in this section were estimated based on solution mining of the BP and PL members with the halite interbed left unmined. This is can be accomplished by pressurizing a clay seam at the base of the PL after the BP has been mined so that the interbed falls into the existing cavity. Solution mining is begun by creating sumps at the base of both cavern wells in the interbed below the target mining horizon. This process involves using a method similar to that currently used at Mosaic’s Belle Plaine mine and other evaporite solution mines in the Netherlands and Germany to:
Dissolve the halite in the interbed until the sumps are connected.
Perforate a 1.5 m to 2 m thick lift above the roof and raise the oil blanket to begin the first mining lift.
Expand the cavern horizontally to the mining limit.
Perforate a 1.5 m to 2 m thick lift above the roof and raise the oil blanket to begin another mining lift.
The ‘solution interval’ is defined as the entire PL Member and the entire BP Member while excluding the interbed. The resource defined around Well 02-30-27-14W2 only included the Upper BP Sub-member as the lower section did not have sufficient grade. An ‘economic cutoff grade’ for the roof and floor picks was assumed to be one where equivalent carnallite

Preliminary Economic Assessment and Preliminary Feasibility Study
NI 43-101 Technical Report
Project No.: 194379
14-7
was less than 2.91% (1% MgCl2), K2O values were greater than 10% and where average ‘mineable grade’ was greater than 15%. The Esterhazy was not included in the calculation as it has an average equivalent carnallite content of 8.05% (2.75% MgCl2) and its K2O grade was below the economic threshold cutoff.
Table 14-3 shows a summary of the tonnages estimated for the solution mining resource scenario.

Preliminary Economic Assessment and Preliminary Feasibility Study
NI 43-101 Technical Report
Project No.: 194379
14-8
Table 14-3: Resource summary for 2017 PEA– effective date 24 May 2017 (Source: North Rim)
Member
Area with
Exclusions
(m2)
Weighted Average
Thickness (m)
Weighted Average K2O
Grade (%)
Weighted Average
KCl Grade (%)
Volume
(m3)
Gross In-Place
Sylvinite
Tonnage (MT)
In-Place K2O
Resource (MT)
In-Place KCl
Resource (MT)
Patience Lake 11,043,823 7.66 19.63 31.08 84,545,124 176 35 55
Belle Plaine 11,043,823 7.58 18.49 29.27 83,731,821 174 32 51
Total Excluding Interbed 15.24 168,276,945 350 67 106
Weighted Average Excluding Interbed 19.06 30.18
Member
Area with
Exclusions
(m2)
Weighted Average
Thickness (m)
Weighted Average K2O
Grade (%)
Weighted Average
KCl Grade (%)
Volume
(m3)
Gross In-Place
Sylvinite
Tonnage (MT)
In-Place K2O
Resource (MT)
In-Place KCl
Resource (MT)
Patience Lake 52,789,204 8.25 18.92 29.96 435,414,490 906 171 271
Belle Plaine 52,789,204 7.01 18.72 29.63 370,105,786 770 144 228
Total Excluding Interbed 15.26 805,520,276 1,675 315 499
Weighted Average Excluding Interbed 18.83 29.81
Member
Area with
Exclusions
(m2)
Weighted Average
Thickness (m)
Weighted Average K2O
Grade (%)
Weighted Average
KCl Grade (%)
Volume
(m3)
Gross In-Place
Sylvinite
Tonnage (MT)
In-Place K2O
Resource (MT)
In-Place KCl
Resource (MT)
Patience Lake 57,702,117 7.99 18.50 29.29 460,968,759 959 177 281
Belle Plaine 57,702,117 6.98 18.70 29.61 402,912,510 838 157 248
Total Including Interbed 14.97 863,881,268 1797 334 529
Weighted Average Excluding Interbed 18.60 29.44
Note: Deductions f or unknown anom al ies :
1. MT = Million Metric Tonnes Ins ide 3D: Measured = 5%
2. Density of Sylvinite = 2.08 T/m3Indicated = 9%
3. Gross In-Place Sylvinite is calculated based on Area x Thickness x Density (2080kg/m 3) Inferred = 15%
4. Gross Resource refers to Tonnage In-Place times Average Grade Outs ide 3D: Measured = N/A
5. KCl Resource = 1.583*K2O Resource Indicated = 15%
6. Weighted average thickness and K2O are weighted to In-Place Tonnage Inferred = 25%
Measured Resource Summary
Indicated Resource Summary
Inferred Resource Summary

Preliminary Economic Assessment and Preliminary Feasibility Study
NI 43-101 Technical Report
Project No.: 194379
15-1
15 Mineral Reserve Estimates
No Mineral Reserves have been defined for the 2017 PEA.

Preliminary Economic Assessment and Preliminary Feasibility Study
NI 43-101 Technical Report
Project No.: 194379
16-1
16 Mining Methods
Solution mining is planned for the recovery of the potash resource in the BP and PL Members, approximately 1,200 m below ground surface (BGS). This is the method used at the Belle Plaine and Bethune operations which are mining equivalent Prairie Evaporite members. Solution mining in each cavern will be initiated by drilling and completion of two wells, directionally drilled in the shape of s-bends from a single pad, such that the wells enter the potash vertically about 80 m apart. Solution mining of two potash beds (BP and PL Members) is anticipated and the sequence of mining will be to mine the lowest bed first, with mining progressing upward. Major mining steps will include well drilling, cavern development, primary mining, and secondary mining. Figure 16-1 parts a, b, c and d show sump development, cavern connection and roof development, primary mining and secondary mining, respectively.
Selection of site-specific cavern dimensions is based on depth, in situ temperature, and rock mechanics considerations. Geotechnical testing of the cored samples was conducted at two rock mechanics laboratories. Dissolution testing was performed for the potash and salt samples from PL and BP Members as well as the salt interbed in between.
16.1 Geotechnical Testing
The potash and salt properties are based on triaxial compressive strength and creep tests conducted at the rock mechanics laboratories of RESPEC in Rapid City, South Dakota and the Institut für Gebirgsmechanik GmbH (IfG) in Leipzig, Germany. In total, 10 triaxial tests and 23 creep tests were conducted on samples collected from the salt back, PL Member, BP Member, and the salt interbed between these two potash members. IfG conducted all 10 triaxial tests (3 samples from salt back, 4 from BP Member, and 3 from PL Member) with confinement stresses ranging from 1 to 12.5 MPa. Of the 23 creep tests, IfG conducted 15 tests with sample diameters of 40 mm; RESPEC tested 8 samples with sample diameters ranging from 94 mm to 100 mm. The duration for the creep tests ranged from 60 to 70 days, and the creep tests were conducted under temperatures of either 45°C or 60°C. To facilitate comparison between the results from the two laboratories, 5 pairs of identical samples collected from the same core for each pair were tested by both RESPEC and IfG.
Agapito summarized the creep test data provided by each laboratory, and generated power law viscoplastic creep models for both potash and salt at temperatures of 45°C and 60°C.

Preliminary Economic Assessment and Preliminary Feasibility Study
NI 43-101 Technical Report
Project No.: 194379
16-2
Figure 16-1: Mining steps from sump development to secondary mining planned for the Muskowekwan Project (Source: Agapito)

Preliminary Economic Assessment and Preliminary Feasibility Study
NI 43-101 Technical Report
Project No.: 194379
16-3
Figure 16-1: Mining steps from sump development to secondary mining planned for the Muskowekwan Project (continued) (Source: Agapito)

Preliminary Economic Assessment and Preliminary Feasibility Study
NI 43-101 Technical Report
Project No.: 194379
16-4
16.2 Laboratory Sylvinite Dissolution Testing
Laboratory dissolution testing of core samples at 60°C and 75°C was performed in 2012 by NG Consulting of Sondershausen, Germany. The samples were collected from the PL Member, the interbed between the PL and BP Members, and the BP Member. The results of the testing (NGConsulting 2012) indicated that:
Dissolution rates varied as expected between those for pure sylvinite and pure halite and correlated well with theoretical data.
Dissolution rates of the Encanto samples fell in a range similar to that for common sylvinite from other deposits.
Only 5 to 10% higher dissolution rates were observed for 75°C compared to 60°C.
The presence of insolubles reduced the dissolution rate up to 40%.
The dissolution testing provided a preliminary relationship between dissolution rate and KCl content of the sylvinite at 60°C and 75°C.
16.3 Mining Sequence
The wellfield cavern layout for a 48-year mine plan, illustrated in Figure 16-2 was generated within the Measured and Indicated Resource areas at the Muskowekwan project site, and was based on the proposed cavern and pillar dimensions, geological anomaly/carnallite exclusions, and surface facility isolations.
Some major geological anomalies and areas with high carnallite concentrations were identified in 3D seismic surveys performed at the solution mining site. Because these features can cause problems in well drilling and solution mining, these areas were excluded from the cavern layout.
For a preliminary wellfield cavern layout, buffer zones of approximately 1,200 m and 800 m have been provided to protect the plant site and nearby towns/villages, respectively. The objective of leaving these buffer zones is to provide a conservative wellfield layout which minimizes the impact of potential subsidence to the plant site and the town/village. As further studies such as numerical and analytical modelling using site-specific data are completed, it is anticipated that the wellfield layout will be refined to maximize potash extraction while minimizing the impact of potential subsidence.
The cavern layout is based on providing a pillar of unmined material between caverns to maintain isolation of the caverns and to support the overlying strata. The cavern dimensions and pillar sizing were selected to control cavern closure during mining. As shown in Figure 16-3, the pillar width has been set at 80 m. The cavern end radius is 75 m, and the spacing between the wells is 80 m. These dimensions result in a cavern spacing of 230 m by 310 m, which results in an areal extraction ratio of 41.6% in those areas where an extensive regular pattern of caverns can be developed.
The well pad layout is based on the assumption that 14 caverns or 28 wells will be developed from a single pad, as illustrated in Figure 16-4. Directional drilling will be used to provide a bottomhole separation distance of 80 m between the pair of wells for each cavern.

Preliminary Economic Assessment and Preliminary Feasibility Study
NI 43-101 Technical Report
Project No.: 194379
16-5
Figure 16-2: Life of mine plan showing range of recoverable tonnages per cavern (Source: Agapito)

Preliminary Economic Assessment and Preliminary Feasibility Study
NI 43-101 Technical Report
Project No.: 194379
16-6
Figure 16-3: Cavern and pillar dimensions (Source: Agapito)
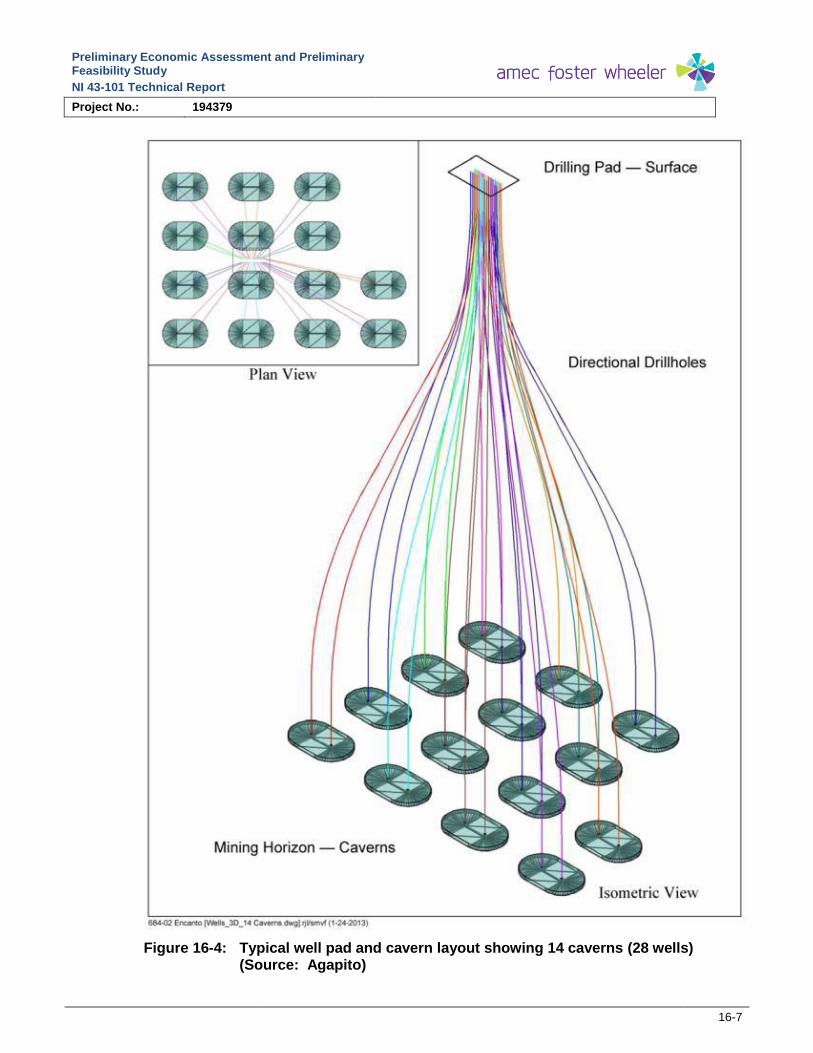
Preliminary Economic Assessment and Preliminary Feasibility Study
NI 43-101 Technical Report
Project No.: 194379
16-7
Figure 16-4: Typical well pad and cavern layout showing 14 caverns (28 wells) (Source: Agapito)

Preliminary Economic Assessment and Preliminary Feasibility Study
NI 43-101 Technical Report
Project No.: 194379
16-8
Drill pads are designed to accommodate drilling of multiple wells using a walking rig or tabletop rig, and directional drilling techniques. Cavern development, which includes sump development, sump connection and roof development, takes place below the BP Member in salt, initially using unheated water because the aqueous solubility of halite as a lone solute is essentially unaffected by temperature (Gaudin, 1957). During later stages of roof development, hot water is used to condition the cavern temperature before the first mining cut. The brine produced during development will be disposed of in deep disposal wells.
After roof development, primary mining is initiated by injecting freshwater at an elevated temperature into one well and retrieving production brine from the other. Primary mining will progress in successive mining cuts, with frequent additions of oil to maintain the oil blanket. Each mining cut will be approximately 1 to 1.5 m thick. When a lift has been completed, the casing is perforated and the new section of the potash deposit is solution mined. Injection will alternate between the two cavern wells so that a symmetrical cavern develops. The PEA assumes that primary mining and secondary mining are 70% and 30% of the total available KCl tonnes within the cavern being solution mined, respectively, and the primary mining life of an individual cavern averages 2.86 years.
The mine plan does not include mining of the 5.3 m-thick low-grade interbed material between the roof of the BP Member and the floor of the PL Member. To skip this interburden, a practice of the salt can be hydraulically separating separated the salt from along a clay seam at the base of the PL Member can be used. Once this separation has been initiated, solution mining above the PL Member can proceed by perforating the casing and continuing the solution mining process as before.
Upon completion of the primary production phase, injection fluid will be changed to saturated sodium chloride (NaCl) brine. The oil blanket will be recovered. Secondary mining of a cavern can be conducted as a continuous or an intermittent batch operation. As the KCl is dissolved in solution, the saturation point of the NaCl will change, precipitating some NaCl within the cavern. During secondary mining, KCl on exposed surfaces of the cavern will be mined. NaCl in the ore zone remains in the cavern and essentially in-place in the walls of the cavern. At 30% secondary mining, the secondary cavern life is 4.58 years. The total cavern life including both mining phases is 7.4 years.
To support production of 2.4 Mtpa of MOP from primary mining, 44 caverns are needed in simultaneous production. Initially 50 caverns are planned in order to provide backup caverns. To support production of 1.0 Mtpa of MOP from secondary mining, 68 caverns need to be available. Thus full production will be achieved at the onset of the second cycle of secondary mining. The expected life of a primary cavern is 2.86 years so full production including secondary mining can be achieved after two cycles of primary or in 5.7 years. Also note that after several cycles of primary mining have been completed the number of secondary caverns available considerably exceeds the number required so that caverns can be scheduled in order to optimize grade to the plant.
During later stages of secondary mining, a solution mining cavern may develop communication with the permeable Dawson Bay Formation above the cavern roof or, possibly, communication with an adjacent cavern. This communication could limit the ability of the cavern to maintain sufficient hydraulic pressure to lift the production brine to the surface. In such a case, a submersible pump can be installed in the production well to assist in lifting the production brine to the surface (see Figure 16-5).

Preliminary Economic Assessment and Preliminary Feasibility Study
NI 43-101 Technical Report
Project No.: 194379
16-9
Figure 16-5: Diagram of a submersible pump installed in the production well (Source: Agapito)
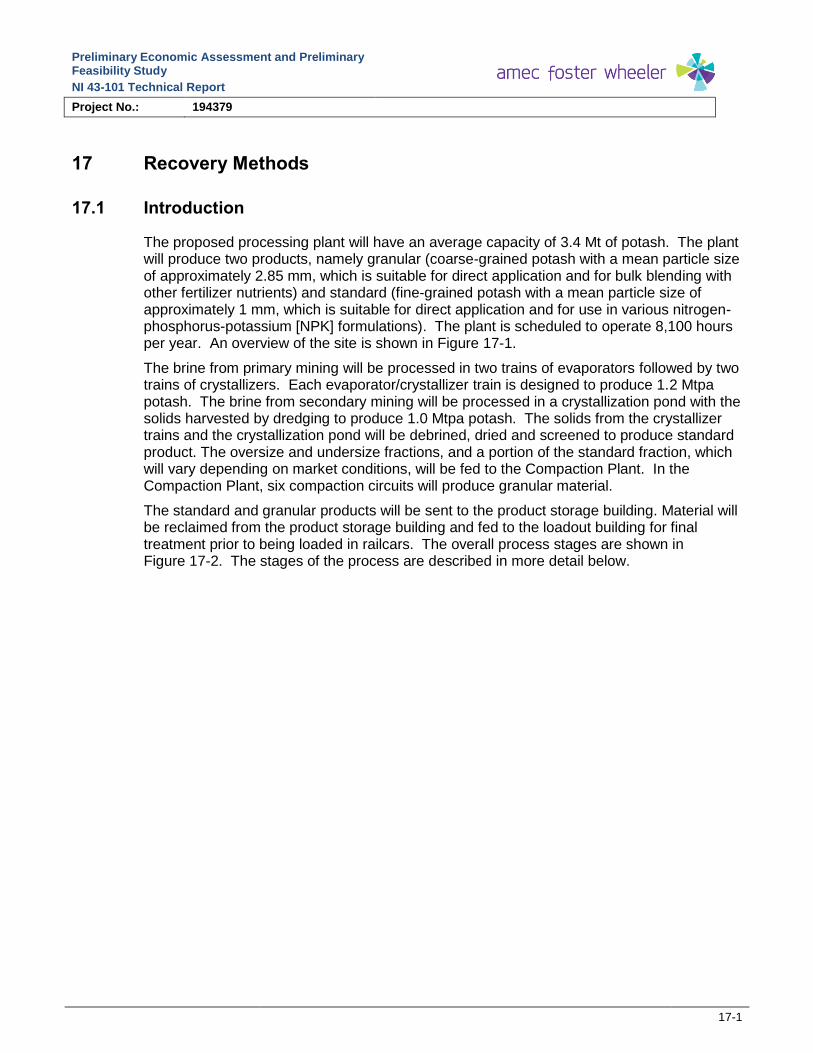
Preliminary Economic Assessment and Preliminary Feasibility Study
NI 43-101 Technical Report
Project No.: 194379
17-1
17 Recovery Methods
17.1 Introduction
The proposed processing plant will have an average capacity of 3.4 Mt of potash. The plant will produce two products, namely granular (coarse-grained potash with a mean particle size of approximately 2.85 mm, which is suitable for direct application and for bulk blending with other fertilizer nutrients) and standard (fine-grained potash with a mean particle size of approximately 1 mm, which is suitable for direct application and for use in various nitrogen-phosphorus-potassium [NPK] formulations). The plant is scheduled to operate 8,100 hours per year. An overview of the site is shown in Figure 17-1.
The brine from primary mining will be processed in two trains of evaporators followed by two trains of crystallizers. Each evaporator/crystallizer train is designed to produce 1.2 Mtpa potash. The brine from secondary mining will be processed in a crystallization pond with the solids harvested by dredging to produce 1.0 Mtpa potash. The solids from the crystallizer trains and the crystallization pond will be debrined, dried and screened to produce standard product. The oversize and undersize fractions, and a portion of the standard fraction, which will vary depending on market conditions, will be fed to the Compaction Plant. In the Compaction Plant, six compaction circuits will produce granular material.
The standard and granular products will be sent to the product storage building. Material will be reclaimed from the product storage building and fed to the loadout building for final treatment prior to being loaded in railcars. The overall process stages are shown in Figure 17-2. The stages of the process are described in more detail below.
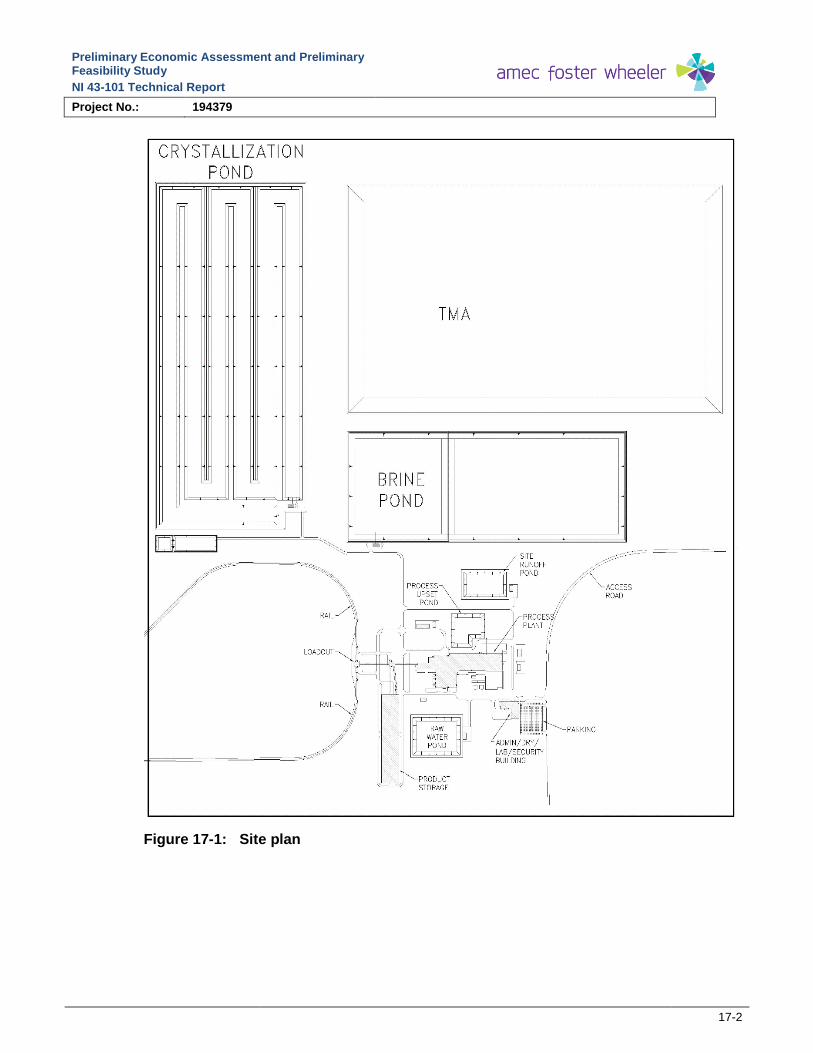
Preliminary Economic Assessment and Preliminary Feasibility Study
NI 43-101 Technical Report
Project No.: 194379
17-2
Figure 17-1: Site plan

Preliminary Economic Assessment and Preliminary Feasibility Study
NI 43-101 Technical Report
Project No.: 194379
17-3
Figure 17-2: Block diagram of the processing plant
17.2 Major Process Design Criteria
The process plant is designed to have a capacity of 3.4 Mt of MOP per year. The major criteria used in the design are shown in Table 17-1.
Table 17-1: Major design criteria
Product Criteria Units Quantity
Annual saleable potash tpa 3,400,000
Contained KCl tpa 3,336,658
Product grade % K2O 62
Plant recovery % 93
Primary to secondary mining ratio 70:30
Primary mining production tpa 2,400,000
Secondary mining production tpa 1,000,000
Granular to Standard Ratio 30:70
Granular product production tpa 1,000,000
Standard product production tpa 2,400,000
Plant and wellfield operating hours per year h 8100

Preliminary Economic Assessment and Preliminary Feasibility Study
NI 43-101 Technical Report
Project No.: 194379
17-4
17.3 Process Plant Description
17.3.1 Well Field and Solution Mining
For primary mining, raw water is combined with process condensate and makeup water from the evaporators, heated in the primary cavern brine heater and injected into the primary caverns. The primary brine is returned from the caverns and pumped to a coalescing oil water separator to remove the oil used for the mining blanket. The primary brine is then pumped to the brine tank in the processing plant.
For secondary mining, the crystallization pond is combined with crystallization pond centrate, heated in the secondary cavern brine and injected into the secondary caverns. The secondary brine is returned from the caverns and pumped to the crystallization pond.
17.3.2 Evaporation
The brine from the mining caverns is combined NaCl/KCl brine. To prevent co precipitation of NaCl and KCl, the NaCl is removed by evaporative crystallization prior to KCl crystallization. Brine from the brine tank is fed to two parallel trains of Multi-Effect Evaporators (MEEs). The brine is boiled in the evaporators. Each effect is operated at a lower pressure than the previous effect. Because the boiling point of water in the brine decreases as pressure decreases, the vapor boiled off in one effect can be used to heat the next effect, and only the first effect requires steam from the boiler.
The overflow brine from the evaporation section is first sent to a clarifier to remove any remaining solid materials carried over in the brine. The NaCl slurry recovered from the evaporation area and the clarifier underflow are directed to a combination of hydrocyclones and centrifuges for debrining, with the wet NaCl crystals recovered sent to the Tailings Management Area (TMA).
17.3.3 Crystallization
The overflow from the clarifier is directed to the first stage of the vacuum-cooled crystallizer circuit, where the crystallizer stages are arranged so that the brine is cooled sequentially in each stage, resulting in the formation of KCl crystals. The slurry and mother liquor are carried through each stage, with the KCl crystals extracted from the last stage.
17.3.4 Crystallization Pond
During secondary mining, brine from the secondary caverns is pumped into the crystallization pond. Since the ambient temperature is less than the brine temperature, the brine cools. The brine is directed through a series of channels which results in the brine cooling and KCl crystallizing and settling to the bottom of the pond.
The KCl is harvested from the pond as slurry using dredges. Pumps on the two cutter dredges pump the slurry to a pair of thickening tanks located at the northwest corner of the crystallization pond. The slurry is then pumped to the product centrifuges for debrining.
Secondary brine from the crystallization pond overflow is returned to the secondary caverns.

Preliminary Economic Assessment and Preliminary Feasibility Study
NI 43-101 Technical Report
Project No.: 194379
17-5
17.3.5 Debrining
The KCl slurry from the crystallizers and the dredges is directed to a combination of hydrocyclones and centrifuges for debrining, with the KCl crystals discharged from the centrifuges directed to the fluid bed driers. The centrifuges debrine the slurry and produce a cake that is approximately 96% solids. The cake from the product centrifuges is fed to the product dryers.
17.3.6 Drying
The wet KCl discharged from the centrifuges is transported to two fluid bed dyers installed in parallel. The air used in the dryers will be heated by natural gas burners, with the dried crystals discharged at a temperature between 140-160°C. The exhaust gas from the dryers will be passed through their respective cyclones and wet scrubbers to recover entrained dust and particles, and to meet the local environment discharge requirements prior to being released in the atmosphere.
17.3.7 Screening
The product exiting the dryers will be conveyed to the product screens, where the standard sized product is separated out. The standard product will then be cooled and treated with anti-caking and de-dusting products prior to being directed to the rail load-out or storage area.
17.3.8 Compaction
The fines and oversized KCl crystals recovered from the product screens are directed to the compaction plant, which consists of parallel compactor trains, crushers, and screens. The fines and oversized product are directed into the compactors via feed screws, and the compactor flake is discharged into flake breakers, followed by crushing and additional screening.
The size fraction of product from the screening operation that is within the granulated product size limits will undergo a glazing and cooling operation. The granular product will be conveyed to storage.
17.3.9 Loadout and Product Storage
Standard and granular products are conveyed to loadout for direct shipping or to product storage. Anti-caking agent (a mixture of anti-cake and de-dusting oil) is added to the standard and granular material before being dispatched into product storage. Any material sent directly to loadout is treated with anti-caking agent in loadout only. Product is distributed throughout the storage building using two tripper conveyors. Product is held in the storage building until it is ready for loading into railcars for shipping.
Potash is reclaimed from the piles in the building using a portal reclaimer and then conveyed to the product loadout building. Standard product is screened to remove any oversize material and granular product is screened to remove any oversize and undersize material.

Preliminary Economic Assessment and Preliminary Feasibility Study
NI 43-101 Technical Report
Project No.: 194379
17-6
Anti-caking agent is applied to the standard and granular product before loading the product into railcars for shipping.
17.3.10 Reagent Storage and Preparation
Reagents used in the solution mining process will be stored either locally (i.e., in the area where they are used) or in the tank farm.
The following reagents are to be stored in the tank farm:
Blanket oil: diesel will be used as blanket oil in the caverns, and will be delivered to the storage tank in the tank farm by tanker trucks.
Flocculent: flocculants will be prepared in the tank farm area and then pumped to the thickener and clarifier.
Other reagents will be stored locally, in the areas where they are used.
Anti-dusting oil and anti-caking oil: these oils will be delivered by tanker truck, and stored in tanks located in the loadout area of the plant.
Iron oxide: iron oxide powder will be delivered to the plant in tote bags, and transferred to a storage bin in the compaction process area.
17.3.11 Brine Disposal
Brine disposal is required during development, operation, and decommissioning phases of the project. The project proposes to inject this waste brine into the Winnipeg or Deadwood aquifers located approximately 1,800 m below the surface using a number of dedicated disposal wells. This methodology is the standard practice for most of the potash facilities in Saskatchewan.
17.3.12 Tailings Management Area
The TMA consists of a salt storage area and a reclaim brine pond. The TMA has a perimeter dyke to contain both the solid NaCl and the decanted brine and to divert fresh water around the perimeter. The slurry from the evaporators is pumped to the salt storage area. The solids settle out and the salt storage area is graded to allow the brine to drain from the salt storage area and flow to the reclaim brine pond by gravity. Reclaim brine is reused in the process and any excess reclaim brine is pumped to the brine injection tank for deep well disposal.
Because the caverns are developed by solution mining, insoluble components of the potash beds are not brought to surface. In addition, less salt per tonne of product is brought to surface as compared to a conventional mine. The Tailings Management Area (TMA) is designed to handle the tailings produced from the potash production process for the duration of 50 years
17.3.13 Process Water
The project will capture and re-use as much process water as is possible. All condensate from the evaporation trains is captured and reused, cooling tower water purge will be

Preliminary Economic Assessment and Preliminary Feasibility Study
NI 43-101 Technical Report
Project No.: 194379
17-7
directed into the process stream, rain water collected around the site from hard surfaces will be used in the process, and even treated sewage and grey water will be reused.
17.3.14 Energy
The steam required for the process will be supplied by the co-generation facility (see section 18.2.2). Natural gas will be used for potash drying purposes.
A cooling tower will be used to provide cooling for the evaporation and crystallizer process water. The process water will be operated in a closed circuit with makeup water added as required.

Preliminary Economic Assessment and Preliminary Feasibility Study
NI 43-101 Technical Report
Project No.: 194379
18-1
18 Project Infrastructure
18.1 Plant Site
The plant is located within Township 27, Section 26, on lands owned by the Muskowekwan First Nations. A diagram of the plant layout is shown in Figure 18-1 and site layout in Figure 18-2.
Figure 18-1: Plant layout
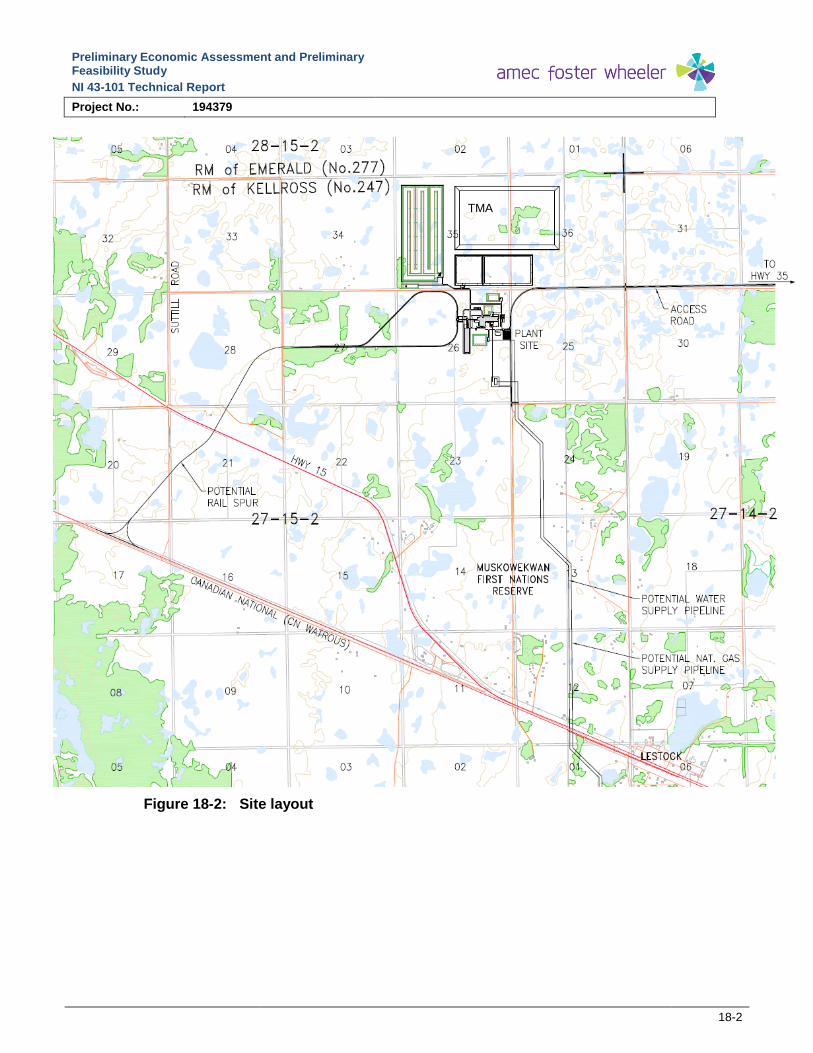
Preliminary Economic Assessment and Preliminary Feasibility Study
NI 43-101 Technical Report
Project No.: 194379
18-2
Figure 18-2: Site layout
TMA

Preliminary Economic Assessment and Preliminary Feasibility Study
NI 43-101 Technical Report
Project No.: 194379
18-3
18.2 Utilities
18.2.1 Electrical Power
Power will be supplied from the main provincial power grid. The primary power distribution for the plant will be 25 kV and the primary utilization is 5 kV and 600 volts. The peak power demand is estimated to be approximately 65 megaVolt-amperes (MVA).
Within the plant, electricity will be distributed at the appropriate voltage for each application. For the buildings located at a distance from the main plant, as well as the Brinefield valve houses, power will be distributed through underground lines that are routed along the access road right-of-way (ROWs) or in conjunction with pipelines to avoid interference with other activities.
18.2.2 Steam Generation
The site will not generate on steam on site. The steam required for the process and heating will be sourced from the nearby cogeneration facility.
The cogeneration facility will be a third party facility. As such, the CAPEX for the cogeneration facility is not included in the CAPEX of this project. An operating cost to purchase the steam from the cogeneration facility has been included in the OPEX.
18.2.3 Raw Water Supply
Water was identified as a critical resource for which a reliable source is required to meet the quantity and quality requirements of the plant and the Brinefield. The estimated water demand of 1,800 m3/h can be supplied from Buffalo Pound Lake, which is located 20 km north of Moose Jaw, SK.
Saskatchewan’s Water Security Agency (WSA) has modelled the impact of the withdrawal of Encanto’s water demand on Buffalo Pound, and the results of the model showed no significant impacts on Buffalo Pound and the downstream Qu’Appelle water system. SaskWater, another Crown Corporation within Saskatchewan, which was contracted to study the delivery of the water from Buffalo Pound to the site, has provided a preliminary Engineering study proving the feasibility of delivering water to Encanto.
The plant will be designed to minimize fresh water requirements by implementing water recycling, recovery, and re-use from the process as much as possible, including storm water.
18.2.4 Natural Gas Supply
Natural gas will be used for product drying. Natural gas for the site will be supplied from the main natural gas supply line to the cogeneration facility.
18.2.5 Telecommunications
SaskTel, a provincial corporation, will provide the necessary telecommunications services for the Project. A temporary cellular tower will be used during the construction phase. A
Preliminary Economic Assessment and Preliminary Feasibility Study
NI 43-101 Technical Report
Project No.: 194379
18-4
land line telecommunication service will be provided to meet both voice and data communication requirements for the mine site.
18.3 Site Infrastructure
The site infrastructure and support areas were designed to minimize their environmental impact, and consist principally of the following:
The site infrastructure was grouped into a compact area to reduce the amount of land that would be disturbed by the Project.
Existing roads were used where possible.
The locations of new access roads were chosen to utilize the existing grid road allowance as much as possible.
The amount of energy (natural gas, electricity, or oil) and water used will be minimized where possible.
Collection of the run-off water from the plant site to minimize Buffalo Pound raw water consumption.
18.4 Brinefield Piping
Pipelines between the plant’s tank farm and the brinefield will be routed next to the access roads and buried below the frost line. The pipes will be grouped together to form a main pipeline corridor. There will be 6 pipelines buried in a single trench running a total length of approximately 2,100 m.
Located at the end of the brinefield pipeline, the valve buildings will contain the electrical, instrumentation and communication facilities necessary for the mining operations of each well cluster.
18.5 Raw Water, Firewater, and Storm Water
Raw water will be delivered to the raw water pond located south of the process plant. The raw water pond will have an outlet structure to maintain a low flow velocity to an adjacent wet well, located below the pump house structure. From this wet well, water will be transferred to the Brinefield pumps and other plant users. The intake to this wet well will be maintained to ensure a sufficient quantity of water for fire protection at all times.
18.6 Potable Water
Water from the raw water pond is treated in a self-contained water treatment package located south of the boiler house. Potable water is distributed throughout the plant for use in the emergency showers and eye wash stations, the control room, and to the administration building for drinking and for showers.

Preliminary Economic Assessment and Preliminary Feasibility Study
NI 43-101 Technical Report
Project No.: 194379
18-5
18.7 Cooling Towers
The plant cooling water requirements will be provided by a cooling tower. The location of the cooling towers will be to the south-west side of the processing plant to minimize drift towards the main plant with the prevailing winds. The quality of the water within the cooling tower loop will be maintained through standard chemical treatment systems normally used for cooling towers.
18.8 Sewage Treatment Plant
Sanitary sewage is collected and transferred for treatment to the on-site waste stabilization ponds (sewage lagoons). The sewage lagoons are sized for 450 people.
The sewage lagoons consist of a primary and secondary cell. The sewage lagoons are cut and fill earthworks with containment obtained from local soil conditions anticipated to provide the required impermeability.
Treated sewage, once safe to release, can be pumped into the brine reclaim pond to be recycled into the process.
18.9 Roads
Access to the Project site from public roads will be via the existing Highways 35 and local grid roads. Upgrades will be necessary to the local grid roads to ensure safe access to and from the property, as well as to support the increased project traffic including transport, heavy construction equipment, and material delivery.
In addition, separate access roads to the Brinefield will be required. These access roads will be constructed from the existing RM grid road network near the Brinefield. Access roads will be routed using similar guiding principles for those for pipelines, and efforts will be made to consolidate infrastructure in a common ROW wherever feasible.
18.10 Rail
The final potash product will be shipped from the plant by rail. The railway design will maximize the use of existing regional infrastructure and will provide connection to trans-Canadian main lines. It is presently planned to connect to the existing Canadian National Watrous line located approximately 5 km southwest of the site with a rail spur from the processing plant.
18.11 Temporary Facilities
Temporary facilities that are required during the construction phase of the plant are expected to be mobile, and removed after construction in order to ensure minimum impact on the overall plant site. It is anticipated that the following temporary facilities and infrastructure will be required:
Entrance/exit gates with security and first aid trailers.
Engineering offices with lunchroom and washroom.

Preliminary Economic Assessment and Preliminary Feasibility Study
NI 43-101 Technical Report
Project No.: 194379
18-6
Contractors’ offices with lunchroom and washroom.
Parking lot for construction workers.
Safety training trailer.
Equipment storage buildings.
Equipment maintenance area.
Material laydown area.

Preliminary Economic Assessment and Preliminary Feasibility Study
NI 43-101 Technical Report
Project No.: 194379
19-1
19 Market Studies and Contracts
19.1 Preamble
In 2017, Encanto engaged RBC Capital Markets to provide information regarding historical and forecast developments in the potash industry and its markets. A Qualified Person has reviewed the market studies produced by RBC Capital Markets and they support the potash prices assumptions used in the PEA.
19.1.1 Demand for Potash (KCl)
19.1.1.1 Historical and Forecast Growth of Demand
Demand for potash averaged a compound annual growth rate (CAGR) of 2.8% per year from 2000 to 2010 (RBC, 2017). From 2010 to 2016 the CAGR slowed to 1.6%. It is expected that from 2016 to 2020 the CAGR will be more in-line with the growth rate seen from 2000 to 2010 of 2.8%.
19.1.1.2 Pricing; Historical and Forecast Prices
RBC Capital Markets (RBC, 2017) believe that potash prices have likely bottomed in 2016 and expect to see moderately higher prices going forward due to stronger demand growth, relatively stabilized industry operating rates and producer discipline. The primary risk to the price forecast is slower-than-expected demand growth.
In view of the RBC Capital Markets outlook for pricing, it is recommended that the Encanto Project preliminary economic assessment be based on 2017 FOB Vancouver price of $US 214/tonne increasing by 2% per year for 5 years.
Major potash consumption markets are in Asia, South America and North America. China is considered the largest consumer.

Preliminary Economic Assessment and Preliminary Feasibility Study
NI 43-101 Technical Report
Project No.: 194379
20-1
20 Environmental Studies, Permitting, and Social or Community Impact
20.1 Environmental Impact Assessment
The Muskowekwan Project is subject to an Environmental Assessment (EA) under federal and provincial laws and regulations.
A combined Project Description/Technical Proposal as required under the Canadian Environmental Assessment Act, 2012 (CEAA) and the Saskatchewan Environmental Assessment Act (SKEAA), respectively, was submitted to initiate the EA process. A Project Description/Technical Proposal was submitted to the Saskatchewan Ministry of Environment (MOE) on 6 December 2012 and to the Canadian Environmental Assessment (CEA) Agency on 7 December 2012. A review of the Project Description/Technical Proposal by the Saskatchewan MOE has determined that the Project will constitute a “development” for the purposes of SKEAA, as that term is defined in that Act, and will also require an EA. The Project constitutes a “designated project” for the purposes of CEAA, as it involves the construction and operation of a potash mine with a potassium chloride (KCl) production capacity of more than 1,000,000 tonnes per year (per article 15(e) of the Schedule to the Regulations Designating Physical Activities (SOR/2012-147)).
EA work was executed by Stantec Consulting Ltd. on behalf of the Project in 2012-2013. Subsequent to submission of the Project Description/Technical Proposal to the CEA Agency and MOE, draft EIS Guidelines were released by the CEA. An EIS was submitted in 2013 to meet both the federal and provincial requirements. The regulator review resulted in a deficiency list with priority 1 through 4 assigned to each item. The priority 1 items need to be addressed prior to EIS approval. A program is currently underway to address the deficiencies and update the EIS for resubmission.
As of the effective date of this Technical Report, no issues have been identified that could materially impact extraction of the mineral resources.
20.2 Environmental Management Framework
The project team is committed to incorporating life-of-Project environmental management approaches and strategies into Project planning and execution so that the Project is not only compliant with provincial and federal regulatory requirements and manages the potentially adverse environmental effects, but also ensures that Project benefits and positive environmental effects are enhanced and optimized. The project team has consulted extensively with both provincial and federal regulators to better understand the issues that are of most concern to them, as well as to understand the requirements for the preparation of the EIS.
Knowledge of past potash developments are being used in the planning and proactive management of the potential environmental effects of the Project. The project team has confidence in their understanding and ability to manage potential environmental effects of the Project using a suite of proven environmental management tools. The project team will use a variety of tools for environmental management including, but not limited to:
Integration of environmental design mitigation.

Preliminary Economic Assessment and Preliminary Feasibility Study
NI 43-101 Technical Report
Project No.: 194379
20-2
Environmental management procedures and environmental management system.
Environmental protection planning for construction.
Environmental monitoring and follow-up.
Emergency prevention and response planning, including contingency plans for effects of the environment on the Project, accidents and malfunctions.
Tailings management planning.
Waste management planning.
Water management planning.
Decommissioning and reclamation.
20.3 Waste, Tailings Management, and Water Management
Waste, tailings management, and water management aspects of the Project are being designed to integrate, but is not limited to, the following:
Consideration of regional hydrogeological factors and careful siting of the tailings management area (TMA) facilities to mitigate contaminant migration to underground aquifers.
Uses of best processing technologies to gain efficiencies and re-use waste streams.
Development of contingency plans or alternatives to address upset conditions.
Initial studies, including constraints mapping and a shallow drilling program, have been completed to assist in the siting and design of the TMA. The shallow drilling program showed the site is underlain by a thick, continuous layer of oxidized till of low permeability, between 4.5 and 16 m thick, that will limit brine migration. Under this oxidized layer is an unoxidized layer that would further limit brine migration. These results confirmed the suitability of the proposed area for the purpose of tailings management; more detailed work is currently being done to characterize the area and determine the best design for the TMA. The efficacy of TMA location and design will be confirmed through long-term monitoring.
Surface runoff and drainage from developed areas of the plant site will be directed to an on-site retention pond and re-used in the process. Since the processing plant will be located on the highest ground, water will naturally flow from the plant to the retention pond. Surface runoff from undeveloped areas will be directed away from the plant site to existing natural drainages, separated from developed area drainage. A surface water management plan will be presented in the EIS.
The environmental design features integrated into the TMA and Water Management planning include, but are not limited to, the following.
The area chosen for the TMA takes advantage of the use of natural till, instead of fragile manufactured membranes, to reduce the migration of brine.
A containment system will be designed to control migration of brine from the TMA.
Precipitation and surface runoff in the TMA and developed areas will be recovered and reused, where feasible.
Design optimization studies have been conducted to reduce water use and TMA size.
Preliminary Economic Assessment and Preliminary Feasibility Study
NI 43-101 Technical Report
Project No.: 194379
20-3
The brine pond will be designed to provide adequate storage of process streams under normal and extreme operating conditions and storm events.
The plant site and TMA will be designed so that uncontaminated surface water from undeveloped areas will be diverted around the Project site to natural drainages, allowing this fresh water to remain part of the natural water cycle.
Waste reduction practices will be incorporated. Secondary mining will selectively remove just KCL leaving the NaCl underground, thereby reducing the amount of salt to be managed in the TMA.
20.4 Permitting Requirements
Subsequent to approval of the EA by the CEA Agency and the SK MOE, the Muskowekwan Project will require several site-specific environmental permits, licenses and authorizations, including those for construction and operation. The Indian Mining Regulations require the permittee, lessee or licensee to comply with provincial laws and regulations pertaining to mining, even if the mining activity occurs on federal (reserve and TLE) lands. Most mining permits are administered under the Saskatchewan Environmental Management and Protection Act (EMPA), specifically the Mineral Industry Environmental Protection Regulations.
A regulation pursuant to First Nations Commercial and Industrial Development Act (FNCIDA) has been established (in parallel with completion of the EIS), as requested by Muskowekwan First Nation. The regulation specifies those provincial laws and regulations, and particularly those sections of provincial laws and regulations that will apply to the Project on federal, reserve and TLE lands. The FNCIDA regulations establish a robust and comprehensive regulatory framework for the life of the Project for activities occurring on both federal and provincial lands (essentially mirroring the suite of provincial regulations that Saskatchewan employs to regulate potash mines on provincial Crown lands), and in particular will enable the respective regulators, notably the CEA Agency and MOE, to confidently establish conditions for follow-up programs, including mitigation and monitoring.
Utilities including power, gas, telecommunications, and water are being provided by other providers and, therefore, will be subject to separate applications and permitting by others responsible for the administration and delivery of those services.
20.5 Social and Community Impacts
The EA process includes a requirement for engaging various First Nations, local governments, public, and other stakeholders. As the Project is located on lands owned by the Muskowekwan First Nation and with the Muskowekwan First Nation being a Project partner, preliminary engagement activity by Encanto with Muskowekwan First Nation has been ongoing for the past several years. The project team has completed and continues to complete extensive consultation and engagement with the Muskowekwan First Nation, neighbouring First Nations, Metis Nations, regulators, non-government organizations, and the general public to inform them of the Muskowekwan Project. To date, consultation and engagement activities have include open houses, both on and off reserve, informal discussions between the Muskowekwan First Nation Chief and surrounding First Nations, meetings with rural municipalities and with various departments at the provincial and federal governments and maintenance of a Project website to disseminate information as well as to
Preliminary Economic Assessment and Preliminary Feasibility Study
NI 43-101 Technical Report
Project No.: 194379
20-4
solicit comment. Consultation and engagement will continue throughout the completion of the EIS. As well, Project updates and further engagement will continue to occur into the construction and operational phases of the Project.
The purpose of the Project is to develop the potash resource that underlies Muskowekwan First Nation lands, thereby generating a return on investments for the shareholders of First Potash Ventures, a joint venture between MRL, Muskowekwan First Nation, and Encanto, and creating economic and social benefits particularly for the Muskowekwan people, but also the surrounding community, Saskatchewan and Canada.
The Project will help to meet the growing international demand for potash, while providing a unique opportunity for the Muskowekwan people to realize significant, and much-needed economic and social opportunities and benefits through the implementation of their Treaty rights.
The Project will deliver significant economic benefits to Muskowekwan First Nation. As the owner of the mineral rights, Muskowekwan First Nation will earn royalty revenue annually for the minimum 50-year operational life of the Project. Also, revenues associated with the Project will enable Muskowekwan First Nation to invest in services, infrastructure, and other initiatives for the benefit of its members for generations to come. First Potash Ventures, by virtue of its partnership, is committed to and will work with the community and responsible agencies to maximize the benefits of the Project, and ensure that potentially adverse effects are managed.
Neighbouring First Nations, Métis, and other communities and stakeholders in Saskatchewan and Canada will also benefit from the economic and social opportunities created by the Project, and First Potash Ventures is similarly committed to the optimization of Project benefits.
20.6 Site Closure and Reclamation
Following operations, the site will undergo comprehensive decommissioning and reclamation (D&R). The D&R plan will conform to SMoE requirements. As part of operations, Encanto will be required to file a financial assurance for the purpose of D&R activities. The financial assurance is based on a detailed closure plan that includes D&R costs. Requirements for the financial assurance are included in The Mineral Industry Environmental Protection Regulations. Site closure planning requirements for potash mines in Saskatchewan are well understood and are not anticipated to cause unforeseen delays or costs.

Preliminary Economic Assessment and Preliminary Feasibility Study
NI 43-101 Technical Report
Project No.: 194379
21-1
21 Capital and Operating Costs
21.1 Capital Cost Estimate
21.1.1 Scope of Capital Cost Estimate
The capital cost estimate scope includes the following major facilities:
The solution mine wellfield
Office, dry, shops, and warehouse buildings
Processing plant
Pipelines connecting the wellfield and the processing plant
Product storage
Loadout
Waste salt management
Off-site utilities
The estimate also includes provisions for indirect costs, EPCM costs, Owner’s Costs, and Contingency.
21.1.2 Basis of Estimate
21.1.2.1 Class of Estimate
The estimate is classified as an AACE International Class 5 estimate with an accuracy range of -30% to +50% after the application of project contingency and escalation with no provisions for assigned risk.
21.1.2.2 Financial
All costs and pricing in the estimate are expressed in 2nd quarter 2017 Canadian Dollars.
21.1.2.3 Labour
The direct field labour rates are based on a schedule of ten hour days, seven days per week. Labour rates are based on Construction Labour Relations Association of Saskatchewan (CLRS).
21.1.2.4 Currency
The estimate was developed using quoted currencies and converted to Canadian dollars using a currency exchange rate of US$1 = CAD$1.32.

Preliminary Economic Assessment and Preliminary Feasibility Study
NI 43-101 Technical Report
Project No.: 194379
21-2
21.1.2.5 Escalation
At Encanto’s request, escalation has been excluded from the CAPEX estimate.
21.1.3 Capital Cost Estimate Summary
Table 21-1 outlines the estimated capital cost for designing, supplying, installing, and precommissioning the project.
Table 21-1: Capital costs
Area Description Cost (CAD$M)
Initial CAPEX Deferred CAPEX
1000 Mining 293.42
161.87
2000 Site General 84.78
0.18
3000 Processing Plant 1,218.77
36.48
4000 Waste Salt Management 75.51
-
5000 Utilities 102.40
-
6000 Ancillary Service Buildings 41.64
-
7000 Off-Site Facilities 251.83
-
Total Direct Cost 2,068.34
198.53
8000 Owner's Costs 196.67
9.22
9000 Indirect Costs 879.66
42.26
Total Indirect Cost 1,076.33
51.48
Total Direct + Indirect Cost 3,144.67
250.01
Contingency 585.86
50.00
Total Capital Cost 3,730.53
300.01
Grand Total 4,030.55
21.2 Operating Cost Estimate
21.2.1 Scope of Operating Cost Estimate
OPEX estimates have been created that show annual costs for primary production at 2.4 Mtpa and combined primary and secondary production at 3.4 Mtpa. Unit costs are expressed as $/product tonne. Unit costs are averaged over one year due to slight seasonal variations.

Preliminary Economic Assessment and Preliminary Feasibility Study
NI 43-101 Technical Report
Project No.: 194379
21-3
The OPEX costs are calculated from a combination of fixed and variable operating costs. They include: staffing, maintenance, power, water, natural gas, and consumables. Wellfield operating costs are also included.
21.2.2 Labour
The estimated labour force to operate the facility at 3.4 Mtpa is shown in Table 21-2.
Table 21-2: Labour force
Description Employees
Staff 100
Hourly 240
Total 340
21.2.3 Power
The power consumption for the project was estimated based on an assessment of the load profile for the project. Annual consumption and demand charges were determined using the E25 rates from the SaskPower website.
21.2.4 Natural Gas
Natural gas consumption was estimated based on the process steam requirements provided and the heat requirements for product drying. An allowance for additional loads such as building heat and auxiliary water heating was included.
Process steam will be provided from the nearby cogeneration facility. It has been assumed that the cost of process steam will be 50% of the cost to generate the steam using natural gas fired boilers. The heat requirements for product drying were estimated using natural gas fired dryers.
21.2.5 Rail Costs
Rail transportation costs will be incurred for shipping the product to the port in Vancouver. The operational costs of rail include the monthly lease of the cars, the shipping charges and any maintenance necessary to continue these operations.
21.2.6 Port Charges
The cost is based on the ports proposed expansion projects to create a new potash handling facility at their site, and includes the cost of capital for the port infrastructure as well as the operational cost of the port.

Preliminary Economic Assessment and Preliminary Feasibility Study
NI 43-101 Technical Report
Project No.: 194379
21-4
21.2.7 Summary of Operating Costs
The estimated unit operating costs at the full production rate of 3.4 Mtpa potash are shown in Table 21-3.
Table 21-3: Operating costs
Description $ per tonne potash
Site Costs $42.86
Total logistics (rail and port) costs $50.05
Production taxes and royalties $41.95
Preliminary Economic Assessment and Preliminary Feasibility Study
NI 43-101 Technical Report
Project No.: 194379
22-1
22 Economic Analysis
The results of the economic analyses discussed in this section represent forward- looking information as defined under Canadian securities law. The results depend on inputs that are subject to a number of known and unknown risks, uncertainties and other factors that may cause actual results to differ materially from those presented here. Information that is forward-looking includes:
Mineral Resource estimates
Assumed commodity prices and exchange rates
The proposed mine production plan
Projected mining and process recovery rates
Capital costs and operating costs
Projected cash flows
Assumptions as to closure costs and closure requirements
Assumptions as to environmental, permitting and social risks
Additional detail on the factors and assumptions used and the risks regarding those factors and assumptions are provided in the relevant sections of the Technical Report.
22.1.1 Scope
As part of the project an economic analysis was performed, providing for estimates of the Net Present Value, Internal Rate of Return, and Pay Back Period for the Project. This analysis included the development of a cash flow model, which was completed by Amec Foster Wheeler to be used specifically for the Encanto Project.
The inputs and structure of the Economic Model for the Encanto Project are described in this section.
22.1.2 Economic Model
22.1.2.1 Revenues
Revenues were calculated using an estimated price of $319 Canadian Dollars per tonne FOB Vancouver for standard product ($313 in 2022) and $344 per tonne FOB Vancouver for granular product ($338 in 2022). The product split between standard potash and granular potash was assumed to be 2.4 Mtpa and 1.0 Mtpa respectively (70/30). Production of granular product begins in year 4 of operation (2025), reaching its full capacity of 1.0 Mtpa by year 7 (2028).

Preliminary Economic Assessment and Preliminary Feasibility Study
NI 43-101 Technical Report
Project No.: 194379
22-2
22.1.2.2 Capital Construction Costs
The initial Capital Construction Costs of the Project were taken from the CAPEX estimate and assumed to be spent over a 4-year timeline.
Project’s deferred capital expenditure for construction is assumed to be spent during years 2 and 3 of operation (2023 and 2024) being ready for use to produce granular KCl in year 4 (2025).
22.1.2.3 Operating Costs
Direct operating costs were estimated based on design-specific process parameters. Indirect costs were estimated based on benchmarking against and experience from past projects, and are paid from the start of the production.
22.1.2.4 Sustaining Capital
The sustaining capital captures all items in the brinefield extensions (including drilling, pipelines and valve houses, roads, etc.), as well as capitalizable maintenance costs within the plant.
The total sustaining capital is $35.98/tonne per year.
22.1.2.5 Decommissioning and Reclamation
An allowance of $0.50/tonne was included to fund future decommissioning and reclamation activities. Additionally, beginning in year 8 of operations (2029) an allowance of $4M/year was included for decommissioning completed caverns in the wellfield.
22.1.2.6 Taxes and Royalties
For the Project, the following Taxes and Royalties were considered:
Saskatchewan Crown Royalty
Saskatchewan Resource Surcharge
Potash Production Tax
Federal Tax
Provincial Tax
A summary of the royalty rates is shown in Table 22-1.
For the purpose of the 2017 PEA, the assumption was made that the Project would be subject to the same royalties and taxes similar to any other potash Project located on provincial Crown lands. From a competitiveness or economic performance perspective, this would make the Project the same as any other potash Project located in Saskatchewan with respect to royalty and tax.
Other Project efficiencies would still apply to the Project. This includes but is not limited to the result of locating the Project on federal Indian lands such as dealing with a single land owner and mineral rights holder; mine plan efficiencies associated with having a contiguous

Preliminary Economic Assessment and Preliminary Feasibility Study
NI 43-101 Technical Report
Project No.: 194379
22-3
potash resource rather than the typical ‘checkerboard mineral title’ that characterizes most potash mines; and the support of the federal government to support a high profile, on-reserve, Indian economic development Project.
Table 22-1: Factors assumed in Royalty Estimate
Description Unit Value
Number of production years to hold off on tax Year 10
Resource Surcharge % 3%
Saskatchewan Resource Credit % 0.75%
Crown Royalty Rate % 2.1%
PPT - Base rate/tonne C$/tonne 12.33
PPT Rate Threshold, Gross Profit/ K2O tonne C$/tonne 67.35
PPT (% of profit), Above bracket % 35.0%
PPT (% of profit), Below bracket % 15.0%
22.1.2.7 Discount Rate and Inflation
The Economic Model for the Encanto Project used a discount rate of 10%.
22.1.3 Time Scale
22.1.3.1 Construction
Construction begins in Year 1. Subsequent years represent complete calendar years with construction completed at the end of Year 4 and production starting at the beginning of Year 5.
22.1.3.2 Ramp-Up
Production ramp-up to 3.4 Mtpa is expected to occur over seven years. In the first year, production will ramp up to 2.4 Mtpa using primary mining alone reaching the production rate of 2.4 in 2023. Secondary mining production will commence in 2025 with the full production capacity of 3.4 Mtpa being achieved in 2028.
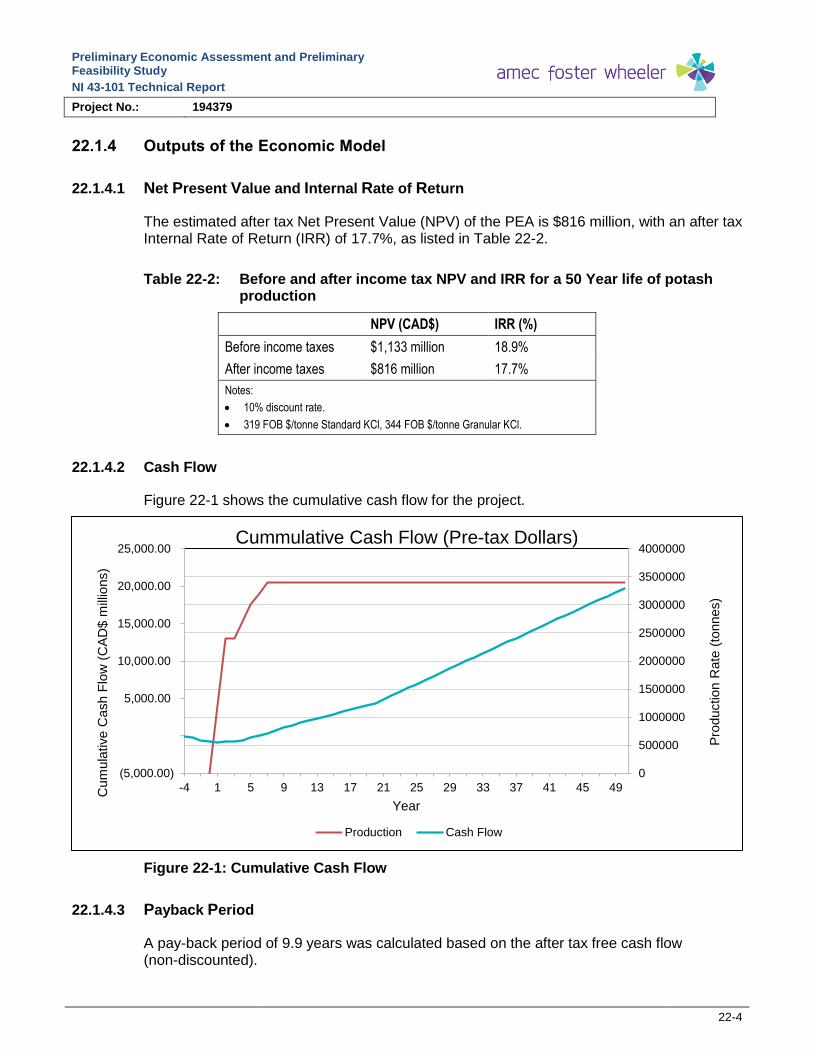
Preliminary Economic Assessment and Preliminary Feasibility Study
NI 43-101 Technical Report
Project No.: 194379
22-4
22.1.4 Outputs of the Economic Model
22.1.4.1 Net Present Value and Internal Rate of Return
The estimated after tax Net Present Value (NPV) of the PEA is $816 million, with an after tax Internal Rate of Return (IRR) of 17.7%, as listed in Table 22-2.
Table 22-2: Before and after income tax NPV and IRR for a 50 Year life of potash production
NPV (CAD$) IRR (%)
Before income taxes $1,133 million 18.9%
After income taxes $816 million 17.7%
Notes:
10% discount rate.
319 FOB $/tonne Standard KCl, 344 FOB $/tonne Granular KCl.
22.1.4.2 Cash Flow
Figure 22-1 shows the cumulative cash flow for the project.
Figure 22-1: Cumulative Cash Flow
22.1.4.3 Payback Period
A pay-back period of 9.9 years was calculated based on the after tax free cash flow (non-discounted).
(5,000.00)
5,000.00
10,000.00
15,000.00
20,000.00
25,000.00
-4 1 5 9 13 17 21 25 29 33 37 41 45 49
0
500000
1000000
1500000
2000000
2500000
3000000
3500000
4000000
Cum
ula
tive C
ash F
low
(C
AD
$ m
illio
ns)
Year
Pro
duction R
ate
(to
nnes)
Cummulative Cash Flow (Pre-tax Dollars)
Production Cash Flow

Preliminary Economic Assessment and Preliminary Feasibility Study
NI 43-101 Technical Report
Project No.: 194379
22-5
22.1.4.4 Sensitivity Study
In order to assess the sensitivity and variability of the NPV and IRR associated with the Encanto Project, a sensitivity analysis was carried out. Tested for sensitivity were variations in the Project’s potash selling price, discount rate (cost of capital) and capital costs. The results of the sensitivity study indicate that the NPV is most sensitive to, in decreasing order:
Potash Price
Project Cost of Capital (Discount Rate)
Capital Costs
Operating Costs
Figure 22-2 shows the relative sensitivity of NPV to each of the variables and Figure 22-3 shows the relative sensitivity of IRR to each of the variables.
Figure 22-2: Sensitivity of the after-tax NPV
(1,000)
(500)
0
500
1,000
1,500
2,000
2,500
3,000
-40% -30% -20% -10% 0% 10% 20% 30% 40%
NP
V @
10
% (
$ m
illio
n)
Change in Factor
Sensitivity of NPV @ 10% AfterTax
Capital Costs Operating Costs Potash Price Discount Rate

Preliminary Economic Assessment and Preliminary Feasibility Study
NI 43-101 Technical Report
Project No.: 194379
22-6
Figure 22-3: Sensitivity of the after-tax IRR
0%
5%
10%
15%
20%
25%
30%
35%
-40% -30% -20% -10% 0% 10% 20% 30% 40%
IRR
(%
)
Change in Factor
Sensitivity of IRR AfterTax
Capital Costs Operating Costs Potash Price

Preliminary Economic Assessment and Preliminary Feasibility Study
NI 43-101 Technical Report
Project No.: 194379
23-1
23 Adjacent Properties
The Potash Corporation of Saskatchewan (PCS) operates the Lanigan underground potash mine approximately 88.0 km northwest of the north-western boundary of the Project Area. The Lanigan mine functions as a conventional mine producing standard, granular and suspension grade potash sold for use as a fertilizer and agricultural product as per their website. The Mosaic Belle Plaine Solution Mine operated by The Mosaic Company is located approximately 116.0 km southwest of the Project Area and produces a variety of potash products.
The adjacent Subsurface Mineral Permit (KP) and Lease (KL) holders are shown in Figure 23-1. Since the release of the 2013 technical report, many of the KP holders converted their land to KL’s. Much of the previously held permits directly adjacent to the project area has been dropped. To the south of the project area the permit holders are Yancoal Canada Resource Co. and CanPacific Potash Inc. To the north, the KL holders are BHP Billiton Canada Inc., Karnalyte Resource Inc., Canada Potash Corp. and a numbered company.
Karnalyte Resources is an exploration company focused on developing potash and magnesium products. They are currently focusing on KLSA 010 and KL 247 where they intend to develop carnallite and sylvite using solution mining methods. Karnalyte Resources has finished an Optimization Pilot Program in late 2016 which was designed to provide information about KCl brine concentrations achieved at specified flow rates in a controlled cavern operation (Karnalyte Resources Website).
K+S Potash Canada General Partnership (KSPC) is the holder of KPSA 002 south of the Project Area. KSPC are focusing their efforts on KLSA 009, which is northwest of Regina and are currently in the final stages of developing a solution mine. On 2 May 2017 KSPC announced the opening of the newly named Bethune Mine which will ramp up production in the second half of 2017.
The authors are unaware of any other advanced exploration activities on any other nearby Permits.

Preliminary Economic Assessment and Preliminary Feasibility Study
NI 43-101 Technical Report
Project No.: 194379
23-2
Figure 23-1: Adjacent properties

Preliminary Economic Assessment and Preliminary Feasibility Study
NI 43-101 Technical Report
Project No.: 194379
24-1
24 Other Relevant Data and Information
The 2013 PFS is summarized in this section as a relevant alternative mine development scenario. A review of the economic analysis for the 2013 PFS shows a positive NPV at the potash prices assumed for the base case in the 2017 PEA. Thus while the 2013 PFS provides a lower economic return than that of the 2017 PEA, the 2013 PFS remains valid, including its Mineral Reserve statements.
The subsection numbering reflects the section numbering of the original report. Non-relevant sections of the 2013 PFS are intentionally left blank herein.
24.14 Mineral Resource Estimates
For the purpose of this PFS, the Mineral Resource is based on the assumption that the recovery of the potash will be by solution mining methods. The 2011 Preliminary Economic Assessment report (Kotowski et al., 2011) addressed the economic and mining parameters associated with solution mining in this area and were considered when determining the parameters used for the Mineral Resource estimate.
The Mineral Resources derived herein were estimated by Qualified Persons Ms. Tabetha Stirrett, P. Geo., with the assistance of Mr. Brett Dueck (Engineer in Training) of North Rim.
24.14.1 Indian Mineral Lands
The Project Area consists of approximately 61,114 acres of Indian Reserve home reserve and is situated approximately 100.0 km north of the city of Regina, Saskatchewan. The permit spans a region encompassing Township 27, Range 14, 15 and 16 west of the Second Meridian.
24.14.2 Assumptions and Methodology
The following principles of exploration techniques and sampling methods commonly employed by other Saskatchewan potash mine operators were used in determining the potential extent, quality, and volume of the potash Mineral Resource:
1. The primary method employed to determine thickness and concentration of potash mineralization were the 2009, 2010, and 2011 drill core in conjunction with assay testing.
2. The extent of potash mineralization and continuity between drill holes (i.e., areal extent of potash beds) is determined by subsurface mapping as well as maps compiled from the 3D seismic survey as interpreted by RPS. The limiting factors are property boundaries and structural disturbances related to dissolution of the Prairie Evaporite Formation and subsequent collapse of overlying beds.
3. For estimation of the Mineral Resource the areal extent surrounding a drill hole for which it is reasonable to infer geological continuity is termed the radius of influence (ROI). This is estimated from the hole centre to 0.8 km for a Measured Resource, 0.8 km to 2.0 km for an Indicated Resource, and 2.0 km to 5.0 km for an Inferred Resource. A 5.0 km Inferred ROI was selected as it covers the area of the 3D

Preliminary Economic Assessment and Preliminary Feasibility Study
NI 43-101 Technical Report
Project No.: 194379
24-2
seismic survey and hole spacing sufficiently to provide confidence in the continuity of the geology in the Project Area.
4. Based on review of the 3D seismic survey conducted by RPS, it is possible to divide the Project Area into three areas for the purpose of estimating the presence of a Mineral Resource as follows:
a. Areas that are judged from seismic data to be potentially affected by the processes of subsurface dissolution and removal of the Prairie Evaporite; this would include the collapse areas.
b. RPS has interpreted there to be a high probability of carnallite in portions of the BP Member. These areas have been removed from the calculation.
c. Areas that are judged to have continuous geology with no subsurface dissolution or alteration of the Prairie Evaporite as determined from review of the seismic data.
The Esterhazy Member did not demonstrate consistent K2O grade and was of higher carnallite grade. It was not used in the Resource estimates.
Areas deemed to have anomalies based on review of the 3D seismic study conducted by RPS are presented in Table 24-1 which shows the Mineral Resource and Mineral Reserve areas for the BP. Table 24-2 summarizes the acreages for the areas in the BP affected by anomalies.
Table 24-1: Areas affected by anomalies or buffers in the Belle Plaine Member (Source: North Rim)
Solution Mining Scenario Area Summaries (Acres)
Affected by Anomalies 7,194
Not Affected by Anomalies Area 53,920
Total 61,114
Note:
The areas used are from the Belle Plaine Member as it was most affected by anomalies.
24.14.3 Regions Affected By Anomalies
Based on the authors’ previous experience, publically available data and the amount of disturbance detected in the upper stratigraphic sequences by 3D seismic, the following distance buffers were used around the various types of anomalies for the different mining scenarios:

Preliminary Economic Assessment and Preliminary Feasibility Study
NI 43-101 Technical Report
Project No.: 194379
24-3
Table 24-2: Deductible anomaly buffer sizes (Source: North Rim)
Buffers Distance (m) Comments
Class 1 Anomalies Visually Picked Based on the degree of slope determined by looking at 2RB
Class 2 Anomalies Visually Picked Based on if the anomaly is interpreted to affect the 2RB
Class 3 Anomalies Visually Picked Based on if the anomaly is interpreted to affect the 2RB
Carnallite Areas 0 Mine right up to the interpreted edge
Lestock Town 800
Resource Buffers
Inferred 5000
Indicated 2000
Measured 800 Inside 3D Seismic Area only
Section 6.3 describes how the buffers around the collapse anomalies were selected. RPS and North Rim reviewed each collapse to determine the severity based on the slope of the beds. The degree of slope was determined with the assistance of Mike Hardy of Agapito. All known collapse anomalies and high probability carnallite areas as identified by 3D seismic have been excluded from the Resource estimate based on the criteria listed in Table 24-2. The interpreted high probability carnallite was only removed from the affected sub-unit, the BP Member.
In addition, allowance has been made for those features not detectable by seismic. These can include areas of significant dip, carnallite content, low grade or thin beds. Personal communication of the author and publically available data (Hardy, Halabura, Shewfelt, & Hambley, 2010) concerning mineral resource estimations, indicates that up to 25% is typical for unknown detectable anomalies. Due to the above concerns, the following deductions were made to the Resource estimate:
Indicated Resource
○ Inside 3D – 9%
○ Outside 3D – 15%
Inferred Resource
○ Inside 3D – 15%
○ Outside 3D – 25%
Areas deemed to have anomalies based on review of the 3D seismic study conducted by RPS are presented in Figure 24-1.

Preliminary Economic Assessment and Preliminary Feasibility Study
NI 43-101 Technical Report
Project No.: 194379
24-4
Figure 24-1: Area extent and mineral resource areas for the Belle Plaine Member

Preliminary Economic Assessment and Preliminary Feasibility Study
NI 43-101 Technical Report
Project No.: 194379
24-5
24.14.4 Mineral Resource
The following definitions in sections on the Mineral Resource definitions can be found in the 27 November 2010 CIM Definition Standards document prepared for Mineral Resources and Mineral Reserves (CIM, 27 November 2010).
24.14.5 Potential Solution Mining Intervals
The term ‘Mineral Resource’ covers mineralization and natural material of intrinsic economic interest which has been identified and estimated through exploration and sampling, and within which mineral resources may subsequently be defined by the consideration and application of technical, economic, legal, environmental, socio-economic and governmental factors.
The drill holes used in the solution mining scenario resource estimate are shown in Figure 24-2.
The mineral resource is present over most of the Project Area, supported by consistent thicknesses and grades and as demonstrated by the permit core holes, regional drill holes, and 2D and 3D seismic surveys.
The Measured, Indicated or Inferred Resources in this section were estimated based on solution mining of the BP and PL members with the halite interbed left unmined. This is can be accomplished by pressurizing a clay seam at the base of the PL after the BP has been mined so that the interbed falls into the existing cavity. Hardy, Halabura and Shewfelt and Hambley (Hardy, Halabura, Shewfelt, & Hambley, 2010) describe that solution mining is begun by creating sumps at the base of both cavern wells in the interbed below the target mining horizon. This process involves:
Dissolving the halite and sylvite using a method similar to that currently used at Mosaic’s Belle Plaine mine.
Dissolving the evaporite rock upwards through the mineralized beds while maintaining a cap of oil or gas that inhibits the vertical growth of the cavern.
Expanding the cavern horizontally to the mining limit.
Perforating a 1.5 m thick lift above the roof and raising the cap to begin another mining lift.
Based on the above described solution mining methodology the ‘solution interval’ is defined as the entire PL Member and the entire BP Member while excluding the interbed. Well 02-30-27-14W2 only included the Upper BP Sub-member as the lower section did not have sufficient grade. An ‘economic cutoff grade’ for the roof and floor picks was assumed to be where equivalent carnallite was less than 2.91% (1% MgCl2), K2O values were greater than 10% and where average ‘mineable grade’ was greater than 15%. The Esterhazy was not included in the calculation as it has an average equivalent carnallite content of 8.05% (2.75% MgCl2) and the grade was lower than the economic threshold cutoff.
Table 24-3 shows a summary of the tonnages estimated for the solution mining resource scenario. The grade and thicknesses used from the individual holes in the Project Area can be found in Appendix D of the Encanto 2012 Technical Report (Stirrett T. A., 2012).

Preliminary Economic Assessment and Preliminary Feasibility Study
NI 43-101 Technical Report
Project No.: 194379
24-1
Table 24-3: PFS Solution mining scenario resource summary – effective 31 January 2013 (Source: North Rim)
Measured Resource Summary
Member Area with Exclusions (m2)
Weighted Average Thickness (m)
Weighted Average K2O Grade (%)
Weighted Average KCl Grade (%)
Volume (m3) In-Place Sylvinite Resource (Mt)
Gross K2O Tonnage (Mt)
Gross KCl Tonnage (Mt)
Net K2O Tonnage (Mt)
Net KCl Tonnage (Mt)
All Measured has been converted into Reserves
Indicated Resource Summary (a portion of the Indicated was converted into Reserves)
Member Area with Exclusions (m2)
Weighted Average Thickness (m)
Weighted Average K2O Grade (%)
Weighted Average KCl Grade (%)
Volume (m3) In-Place Sylvinite Resource (Mt)
Gross K2O Tonnage (Mt)
Gross KCl Tonnage (Mt)
Net K2O Tonnage (Mt)
Net KCl Tonnage (Mt)
Patience Lake 10,033,707 10.44 16.89 26.74 104,767,397 217.92 36.82 58.28 12.25 19.40
Belle Plaine 10,033,707 5.58 19.40 30.71 56,035,645 116.55 22.61 35.79 7.52 11.91
Total Excluding Interbed 16.03 160,803,042 334.47 59.42 94.07 19.79 31.31
Weighted Average Excluding Interbed 17.77 28.12
Inferred Resource Summary
Member Area with Exclusions (m2)
Weighted Average Thickness (m)
Weighted Average K2O Grade (%)
Weighted Average KCl Grade (%)
Volume (m3) In-Place Sylvinite Resource (Mt)
Gross K2O Tonnage (Mt)
Gross KCl Tonnage (Mt)
Net K2O Tonnage (Mt)
Net KCl Tonnage (Mt)
Patience Lake 52,140,575 7.73 18.68 29.57 402,922,519 838.08 156.56 247.83 52.10 82.48
Belle Plaine 52,140,575 7.16 18.63 29.48 373,406,012 776.68 144.66 229.00 48.14 76.21
Total Excluding Interbed 14.89 776,328,531 1,614.76 301.22 476.83 100.25 158.69
Weighted Average Excluding Interbed 18.65 29.53 Notes:
Mt = million metric tonnes
Density of Sylvinite = 2.08 T/m3
In-Place Sylvinite is calculated based on Area × Thickness × Density (2,080 kg/m3)
Gross tonnage refers to Tonnage In-Place times Average Grade.
Net Resource based on 41.6% extraction ratio and 20% plant and cavern loss.
KCl Resource = 1.583*K2O Resource.
Weighted average thickness and K2O are weighted to In-Place Tonnage.
8-14 interbed salt was thin so it was included in the PL member resource interval.
Deductions for unknown anomalies:
Inside 3D: Measured = 5%
Indicated = 9%
Inferred = 15%
Outside 3D: Measured = N/A
Indicated = 15%
Inferred = 25%
Mineral Resources are reported exclusive of the Mineral Resources that were converted to Mineral Reserves

Preliminary Economic Assessment and Preliminary Feasibility Study
NI 43-101 Technical Report
Project No.: 194379
24-1
24.15 Mineral Reserve Estimates
The CIM Definitions Standards (CIM 2010) define a mineral reserve as follows:
“A Mineral Reserve is the economically mineable part of a Measured or Indicated Mineral Resource demonstrated by at least a Preliminary Feasibility Study. This Study must include adequate information on mining, processing, metallurgical, economic and other relevant factors that demonstrate, at the time of reporting, that economic extraction can be justified. A Mineral Reserve includes diluting materials and allowances for losses that may occur when the material is mined.”
The CIM Definitions Standards (CIM 2010) further state that:
“Mineral Reserves are those parts of Mineral Resources which, after the application of all mining factors, result in an estimated tonnage and grade which, in the opinion of the Qualified Person(s) making the estimates, is the basis of an economically viable project after taking account of all relevant processing, metallurgical, economic, marketing, legal, environment, socio-economic and government factors. Mineral Reserves are inclusive of diluting material that will be mined in conjunction with the Mineral Reserves and delivered to the treatment plant or equivalent facility.”
As a result of the favorable economic results presented in the PFS (Novopro 2013), the Measured and Indicated Resources surrounding wells 08-14-027-15, 07-02-027-15, 15-16-027-15, 02-09-027-15, 11-18-027-15, and 15-14-027-15 were converted to Proven and Probable Mineral Reserves, respectively. Table 24-4 summarizes the Proven and Probable Mineral Reserves; the cavern layout used to estimate the Proven and Probable Mineral Reserves is shown in Figure 24-2. The reserves represent the recoverable tonnages of KCl contained in the caverns within the ROI for the Indicated Resource surrounding the six wells listed above.
The reserve estimate must be based on the mine plan developed during a PFS or FS design phase. The estimate is based on the geologic model and assigned thicknesses and grade for the individual caverns documented in the PFS. The cavern dimensions and mine plan are discussed in Section 24.16.
The reserve tonnages were obtained by applying factors to reduce the in-place KCl within the perimeter of the caverns for unknown geologic anomalies (5% reduction for proven and 9% reduction for probable reserves), and cavern and plant KCl losses. The cavern loss of 15% accounts for brine remaining in the cavern at completion of mining. The plant loss is 5.5% (plant KCl recovery = 94.5%), which accounts for KCl losses in the plant and in transport from the plant to the port.
Some of the caverns that define the reserves straddle the boundary defined by the Indicated Mineral Resource ROI (Probable Mineral Reserve ROI). Such caverns were included in the Probable Mineral Reserve if the centroid of the cavern fell within the ROI and were excluded from the Probable Mineral Reserve if the centroid fell outside the ROI.

Preliminary Economic Assessment and Preliminary Feasibility Study
NI 43-101 Technical Report
Project No.: 194379
24-2
Table 24-4: Proven and Probable Mineral Reserves (Source: Agapito)
The reserve tonnages could be affected if any of the following changes:
The extraction ratio that is based on the shape and dimensions of the cavern and the size of the pillars between caverns.
The location and sizes of structural anomalies and areas of high carnallite grades.
Plant recovery.
MOP product grade is not expected to change from the design basis of 98.1% KCl, but product grade may range from the minimum acceptable MOP product grade, 95% KCl, to a 99.1% KCl MOP product, which crystallizer manufacturers claim they can provide.
Subsidence allowance of any infrastructure on ground surface within the mining boundary.
Plant recovery depends on the operation of the plant and impurities in the brine feed. The primary impurity of concern is the magnesium content of the brine feed – as the magnesium grade goes up, the KCl recovery goes down. The estimate of the plant losses are provided by the plant designers and discussed in Section 16.
It should also be noted that additional reserves can be defined during the process of drilling production wells by coring and sampling at least one production well on each pad with the samples sent to a lab for assay. The results of assays near the perimeter of the current Probable Mineral Reserve area can be used to expand the reserve base. Production wells with assayed core in the interior of the Probable Reserve can be used to increase the Proven Mineral Reserve.

Preliminary Economic Assessment and Preliminary Feasibility Study
NI 43-101 Technical Report
Project No.: 194379
24-1
Figure 24-2: Cavern and pad layout in the Measured and Indicated Resource area. Note: No caverns are present in areas where BP carnallite anomalies have been defined by seismic (Source: Agapito).

Preliminary Economic Assessment and Preliminary Feasibility Study
NI 43-101 Technical Report
Project No.: 194379
24-1
24.16 Mining Methods
Solution mining is planned for the recovery of the potash resource in the BP and PL Members, approximately 1,200 m below ground surface (BGS). Solution mining will be initiated by directional drilling and completion of two wells, drilled from a single pad, such that the wells enter the potash vertically and are spaced about 80 m apart. Solution mining of two potash beds (BP and PL Members) is anticipated and the sequence of mining will be to mine the lowest bed first, with mining progressing upward. Major mining steps will include well drilling, cavern development, primary mining, and secondary mining. Figure 24-3 shows the mining steps of cavern development, primary mining, and secondary mining.
Selection of site-specific cavern dimensions is based on depth, in situ temperature, and rock mechanics considerations. Geotechnical testing of the cored samples was conducted at two rock mechanics laboratories. Dissolution testing was performed for the potash and salt samples from PL and BP Members as well as the salt interbed in between.
24.16.1 Geotechnical Testing
The potash and salt properties used in the PFS are based on triaxial tests as well as creep tests conducted at the rock mechanics laboratories of RESPEC in Rapid City, South Dakota and the Institut für Gebirgsmechanik GmbH (IfG) in Leipzig, Germany. In total, 10 triaxial tests and 23 creep tests were conducted for the samples collected from the salt back, PL Member, BP Member, and the salt interbed between these two potash members. IfG conducted all 10 triaxial tests (3 samples from salt back, 4 from BP Member, and 3 from PL Member) with confinement stresses ranging from 1 to 12.5 MPa. Of the 23 creep tests, IfG conducted 15 tests with sample diameters of 40 mm; RESPEC tested 8 samples with sample diameters ranging from 94 mm to 100 mm. The duration for the creep tests ranged from 60 to 70 days, and the creep tests were conducted under temperatures of either 45°C or 60°C. For the purpose of experimental verification, of all 23 creep samples tested, 5 pairs of identical samples collected from the same core for each pair were assigned to both RESPEC and IfG.
Agapito summarized the creep test data provided by each laboratory, and generated power law viscoplastic creep models for potash and salt under temperatures of 45°C and 60°C respectively.

Preliminary Economic Assessment and Preliminary Feasibility Study
NI 43-101 Technical Report
Project No.: 194379
24-2
Figure 24-3: Mining steps from sump development to secondary mining planned for the Muskowekwan Project (Source: Agapito)

Preliminary Economic Assessment and Preliminary Feasibility Study
NI 43-101 Technical Report
Project No.: 194379
24-3
Figure 24-3: Mining steps from sump development to secondary mining planned for the Muskowekwan Project (continued) (Source: Agapito)

Preliminary Economic Assessment and Preliminary Feasibility Study
NI 43-101 Technical Report
Project No.: 194379
24-4
24.16.2 Laboratory Sylvinite Dissolution Testing
Laboratory dissolution testing of core samples at 60°C and 75°C was performed in 2012 by NG Consulting of Sondershausen, Germany. The samples were collected from the PL Member, the interbed between the PL and BP Members, and the BP Member. The results of the testing indicated that:
Dissolution rates varied as expected between those for pure sylvinite and pure halite and correlated well with theoretical data.
Dissolution rates of the Encanto samples fell in a range similar to that for common sylvinite from other deposits.
Only 5 to 10% higher dissolution rates were observed for 75°C compared to 60°C.
The presence of insolubles reduced the dissolution rate up to 40%.
The dissolution testing provided a preliminary relationship between dissolution rate and KCl content of the sylvinite at 60°C and 75°C.
24.16.3 Mining Sequence
The well-field cavern layout for the 58-year mine plan, illustrated in Figure 24-2 was generated within the Measured and Indicated Resource areas at the Muskowekwan project site, and was based on the proposed cavern and pillar dimensions, geological anomaly/carnallite exclusions, and surface facility isolations.
Some major geological anomalies and areas with high carnallite concentrations have been identified in 3D seismic surveys performed at the solution mining site. These features can cause problems in well drilling and solution mining, so these areas were excluded from the cavern layout.
For a preliminary Brinefield cavern layout, buffer zones of approximately 1,200 m and 800 m have been provided to protect the plant site and nearby towns/villages, respectively. The objective of leaving these buffer zones is to provide a conservative Brinefield layout which minimizes the impact of potential subsidence to the plant site and the town/village. As further studies such as numerical and analytical modelling using site-specific data are completed, it is anticipated that the Brinefield layout will be refined to maximize potash extraction while minimizing the impact of potential subsidence.
The cavern layout is based on there being a pillar of unmined material between caverns to maintain isolation of the caverns and to support the overlying strata. The cavern dimensions and pillar sizing were selected to control cavern closure during mining. As shown in Figure 24-4, the pillar dimension has been set at 80 m for the design base. The cavern radius is 75 m, and the spacing between the wells is 80 m. These dimensions result in a cavern spacing of 230 m by 310 m. This cavern spacing results in a real extraction ratio of 41.6% in those areas where an extensive regular pattern of caverns can be developed.
The pad layout is based on the assumption that 14 caverns or 28 wells will be developed from a single pad, as illustrated in Figure 24-5. Directional drilling will be used to accurately locate the pairs of wells 80 m apart for each cavern.
Drill pads are designed to accommodate drilling of multiple wells using a walking rig, or a tabletop, and directional drilling techniques. Cavern development, which includes sump development, connection and roof development, takes place below the BP Member in salt initially using unheated water. During later stages of roof development, hot water can be

Preliminary Economic Assessment and Preliminary Feasibility Study
NI 43-101 Technical Report
Project No.: 194379
24-5
used to condition the cavern temperature before the first mining cut. The produced brine during development will be disposed of in deep disposal wells.
After roof development, primary mining is initiated by injecting freshwater at an elevated temperature into one well and retrieving production brine from the other. Primary mining will progress in successive mining cuts, with occasional additions of oil to maintain the oil blanket. Each mining cut will be approximately 1 to 1.5 m thick. When a lift has been completed, the casing is perforated and the new section of the potash deposit is solution mined. Injection will alternate between the two cavern wells so that a symmetrical cavern develops. The PFS assumes that primary mining and secondary mining are 70% and 30% of the total available KCl tonnes within the cavern being solution mined, respectively, and the primary mining life of an individual cavern is 2.86 years, on average.
Figure 24-4: Cavern and pillar dimensions (Source: Agapito)

Preliminary Economic Assessment and Preliminary Feasibility Study
NI 43-101 Technical Report
Project No.: 194379
24-6
Figure 24-5: Typical well pad and cavern layout (Source: Agapito)
Preliminary Economic Assessment and Preliminary Feasibility Study
NI 43-101 Technical Report
Project No.: 194379
24-7
The mine plan does not include mining of the 5.3 m low-grade interbed material between the roof of the BP Member and the floor of the PL Member. To skip this interburden, a practice of hydraulically separating the salt from the base of the PL Member can be used. Once this separation has been initiated, solution mining above the PL Member can proceed by perforating the casing and continuing the solution mining process as before.
Upon completion of the primary production phase, injection fluid will be changed to saturated sodium chloride (NaCl) brine. The oil blanket will be recovered. Secondary mining of a cavern can be conducted as a continuous or an intermittent batch operation. As the KCl is dissolved in solution, the saturation point of the NaCl will change, precipitating some NaCl within the cavern. During secondary mining, KCl on exposed surfaces of the cavern will be mined. NaCl in the ore zone remains in the cavern and essentially in-place in the walls of the cavern. At 30% secondary mining, the secondary cavern life is 4.58 years. The total cavern life including both mining phases is 7.4 years.
To support production of 2 Mtpa of MOP, 36 caverns need to be in production. Initially 42 are planned to provide backup caverns. To support production of 0.8 Mtpa of MOP from secondary mining, 54 caverns need to be available. The expected life of a primary cavern is 2.86 years so full production including secondary mining can be achieved after two cycles of primary or in 5.7 years.
During later stages of secondary mining, a solution mining cavern may develop communication with the permeable Dawson Bay Formation above the cavern roof or, possibly, communication with an adjacent cavern. This communication could limit the ability of the cavern to maintain sufficient hydraulic pressure to lift the production brine to the surface. In such a case, a submersible pump can be installed in the production well to assist lifting the production brine to the surface (see Figure 24-6).

Preliminary Economic Assessment and Preliminary Feasibility Study
NI 43-101 Technical Report
Project No.: 194379
24-8
Figure 24-6: Diagram of a submersible pump installed in the production well (Source: Agapito)

Preliminary Economic Assessment and Preliminary Feasibility Study
NI 43-101 Technical Report
Project No.: 194379
24-9
24.17 Recovery Methods
24.17.1 Introduction
The plant is designed to process brines from both primary and secondary mining caverns using two basic unit operations, evaporation and cooling. The primary and secondary solvent used for solution mining is initially heated using heat recovered from the process, followed by a steam heat exchanger in order to attain the desired temperatures prior to being sent to the caverns. The production grade brine returning from the caverns is heated using steam to evaporate water from the primary brine using a combination of Multiple-Effect Evaporation (MEE), followed by electrical Mechanical Vapour Recompression (MVR). The evaporation of water causes NaCl only to come out of solution, as NaCl saturation is reached before KCl saturation. KCl is subsequently crystalized by cooling both the primary and secondary brines, due to the fact that KCl solubility is proportional to temperature, while NaCl solubility is relatively stable with changes in temperature. Within the plant there are a number of areas of heat recovery where fluids requiring cooling are used to heat fluids requiring heat. These optimizations are incorporated to the Encanto flow sheet, resulting in a reduction in the steam and cooling water requirements.
Once the KCl crystals are produced, they are de-brined, dried, and screened, and ready for shipping.
For an overview of the plant site see Figure 24-7.
Figure 24-7: Overall site plan (Source: Novopro)

Preliminary Economic Assessment and Preliminary Feasibility Study
NI 43-101 Technical Report
Project No.: 194379
24-10
24.17.2 Crystallization and Evaporation
The primary brine returning from the Brinefield will be saturated in NaCl and approximately 80% saturated with KCl. The brine is first directed to oil separators for the removal of any entrained blanket oil prior to entering the production brine storage tanks.
From the storage tanks, the brine is directed through multiple evaporation trains where NaCl crystals are preferentially precipitated out of solution as the water is evaporated. The trains will consist of Multi-Effect Evaporation (MEE) units using steam, Mechanical Vapor Recompression (MVR) units using electricity, or a combination of both. The choice of options (MEE or MVR) will be determined during the next phase. A 3D rendering of the plant is shown in Figure 24-8.
Figure 24-8: Overall plant model representation (Source: Novopro)
A simplified process flow diagram is provided in Figure 24-9.
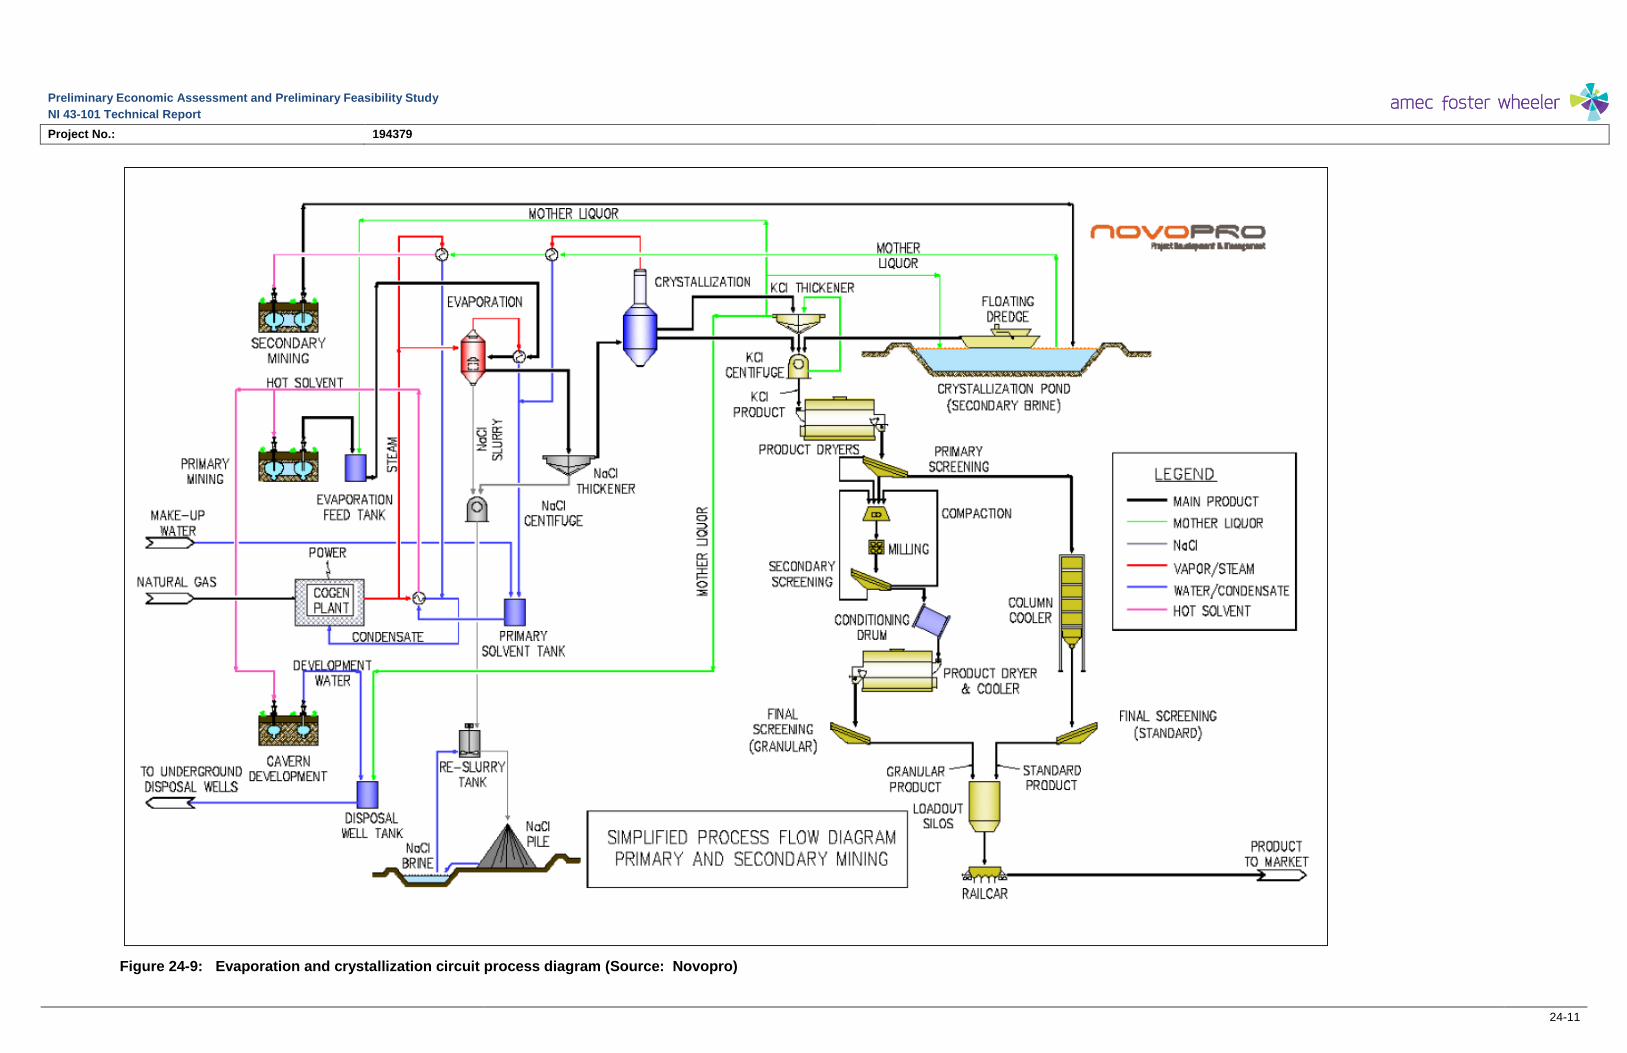
Preliminary Economic Assessment and Preliminary Feasibility Study
NI 43-101 Technical Report
Project No.: 194379
24-11
Figure 24-9: Evaporation and crystallization circuit process diagram (Source: Novopro)

Preliminary Economic Assessment and Preliminary Feasibility Study
NI 43-101 Technical Report
Project No.: 194379
24-12
The overflow brine from the evaporation section is first sent to a clarifier to remove any remaining solid materials carried over in the brine. The NaCl slurry recovered from the evaporation area and the clarifier underflow are directed to a combination of hydrocyclones and centrifuges for debrining, with the wet NaCl crystals recovered sent to the Tailings Management Area (TMA).
The overflow from the clarifier is directed to the first stage of the vacuum-cooled crystallizer circuit, where the crystallizer stages are arranged so that the brine is cooled sequentially in each stage, resulting in the formation of KCl crystals. The slurry and mother liquor are carried through each stage, with the KCl crystals extracted from the last stage. The overflow from the crystallization section is directed to a thickener, with the mother liquor overflow directed back to the front of the evaporation process.
The KCl slurry from the crystallizers and the thickener underflow are directed to a combination of hydrocyclones and centrifuges for debrining, with the KCl crystals discharged from the centrifuges directed to the fluid bed driers.
Brine from secondary mining of the caverns will be saturated with NaCl with an 80% saturation in KCl, and is directed to the crystallization pond. In the pond, the brine loses heat to the environment through conduction and convection, and results in KCl crystals forming and accumulating at the bottom of the pond. The KCl crystals in the pond are harvested by floating dredges, and pumped as a slurry to the KCl centrifuges located within the plant, with the recovered KCl crystals sent to the drying and screening section.
24.17.3 Compaction, Screening, and Loadout
The wet KCl discharged from the centrifuges is transported to two fluid bed dyers installed in parallel. The air used in the dryers will be heated by natural gas burners, with the dried crystals discharged at a temperature between 140-160°C. The exhaust gas from the dryers will be passed through their respective cyclones and baghouses to recover entrained dust and particles, and to meet the local environment discharge requirements prior to being released in the atmosphere.
The product exiting the driers will be conveyed to the main screens, where a first stage of screening will be conducted, separating out the standard size product. The standard product will then be cooled and treated with anti-caking and de-dusting products prior to being directed to the rail load-out or storage area.
The fines and oversized KCl crystals recovered from the main product screens are directed to the compaction plant, which consists of parallel compactor trains, crushers, and screens. The fines and oversized product are directed into the compactors via feed screws, and discharged into flake breakers, followed by crushing and additional screening. The size fraction of product from the screening operation that is within the granulated product size limits will undergo a glazing and cooling operation, exiting as granular product, and directed to the railcar loadout area or to storage.
The plant’s operational methodology consists of direct loading and shipping of the finished product, where both standard and granular material are transferred from the production area directly to the loadout area through dedicated conveyors, and loaded immediately into railcars.
Preliminary Economic Assessment and Preliminary Feasibility Study
NI 43-101 Technical Report
Project No.: 194379
24-13
24.17.4 Storage Tanks and Pumps
All storage tanks, pumps and heat exchangers required for the operation of the processing facility and the Brinefield will be located within a designated tank farm area that will be developed in close proximity to the processing plant.
The infrastructure and equipment located in the tank farm area will consist of the following:
hot solvent storage tank
secondary solvent storage tank
production brine tanks
waste brine tank
boil-out tank
evaporation dump tank
process water tank
process condensate tank
blanket oil storage tank
cold water transfer pumps
primary mining solvent pumps
cavern development pumps
secondary mining brine pumps
blanket oil distribution pumps
waste brine injection pumps
primary and secondary solvents heat exchangers
24.17.4.1 Reagent Storage and Preparation
Reagents used in the solution mining process will be stored either locally (i.e., in the area where they are used) or in the tank farm.
The following reagents are to be stored in the tank farm:
Blanket oil: Diesel will be used as blanket oil in the caverns, and will be delivered to the storage tank in the tank farm by tanker trucks.
Flocculent: Flocculants will be prepared in the tank farm area and then pumped to the thickener and clarifier.
Other reagents will be stored locally, in the areas where they are used.
Anti-dusting oil and anti-caking oil: these oils will be delivered by tanker truck, and stored in tanks located in the loadout area of the plant.
Iron oxide: iron oxide powder will be delivered to the plant in tote bags, and transferred to a storage bin in the compaction process area.

Preliminary Economic Assessment and Preliminary Feasibility Study
NI 43-101 Technical Report
Project No.: 194379
24-14
24.17.5 Brine Disposal
Waste brine is produced during cavern development, and the purge stream from the crystallization plant. Precipitation falling on the TMA also produces waste brine. The project proposes to inject this waste brine into the Winnipeg or Deadwood aquifers located approximately 1,800 m below the surface using a number of dedicated disposal wells. This methodology is the standard practice for most of the potash facilities in Saskatchewan.
24.17.6 Tailings Management Area
The Tailings Management Area (TMA) is designed to handle the tailings produced from the potash production process for duration of 50 years. The tailings are composed exclusively of NaCl produced from the evaporation plant. Any rainwater falling onto the TMA will also drain into the brine pond, where it will be recovered for use in slurrying the solid NaCl from the centrifuges, with any excess sent to the injection wells. The TMA is designed to handle 100% of the NaCl produced at the plant.
MDH Engineering completed a preliminary design of the TMA to store the quantity of tailings required. The following staged construction of the tailings area in three phases was selected to reduce the initial construction footprint:
Cell 1 providing for the initial 5 years of waste.
Cell 2 providing an additional 15 years of waste storage.
Cell 3 providing a final 25 years of waste storage.
All of the TMA cells will be bordered by dykes and underlain by liners constructed of borrow clay materials from the pond construction in order to contain the tailings and brine within the containment area.
24.17.7 Process Water
The project will capture and re-use as much process water as is possible. All condensate from the evaporation trains is captured and reused, cooling tower water purge will be directed into the process stream, rain water collected around the site from hard surfaces will be used in the process, and even treated sewage and grey water will be reused.
24.17.8 Crystallization Pond
The project will use a crystallization pond to produce KCl from secondary mining. The pond will accept hot brine from the caverns and by the size and design allow it to cool while passing through this pond. As the brine cools KCl precipitates out and collects at the bottom of the pond.
When the layer of KCl is thick enough a barge equipped with a mechanized dredge will be used to harvest it and send it to the processing plant.

Preliminary Economic Assessment and Preliminary Feasibility Study
NI 43-101 Technical Report
Project No.: 194379
24-15
24.17.9 Energy
The process will use natural gas to produce all electrical energy all steam required for the process, as well as direct firing for drying purposes. The project will use approximately 1700 GJ per hour of natural gas.
24.18 Project Infrastructure
24.18.1 Plant Site
The plant is located within Township 27, Sections 25 and 26, on lands owned by the Muskowekwan First Nations. A diagram of the plant layout is shown in Figure 24-10.
Figure 24-10: Plant layout (Source: Novopro)
24.18.2 Utilities
24.18.2.1 Electrical Power
Electricity will be generated on-site through a natural gas-fired cogeneration plant. The Project will incorporate the latest technologies available, and will meet all applicable
Preliminary Economic Assessment and Preliminary Feasibility Study
NI 43-101 Technical Report
Project No.: 194379
24-16
emission standards. Currently, Encanto plans to own and operate the on-site cogeneration facility. The power demand is estimated at 95 MVA while the plant is in operation.
Within the plant, electricity will be distributed at the appropriate voltage for each application. For the buildings located at a distance from the main plant, as well as the Brinefield valve houses, power will be distributed through underground lines that are routed along the access road right-of-way (ROWs) or in conjunction with pipelines to avoid interference with other activities.
24.18.2.2 Steam Generation
The process steam requirements will be provided by the heat recovery steam generation (HRSG) systems connected to the gas turbines, utilizing the waste heat as well as additional duct firing as needed. The exact configuration will be finalized during the next phase of the project. In the case of a total failure of the cogeneration plant, critical safety and life support equipment would be supplied from a standby diesel emergency generator.
24.18.2.3 Raw Water Supply
Water was identified as a critical resource for which a reliable source is required to meet the quantity and quality requirements of the plant and the Brinefield. The estimated water demand of 1,500 m3/h can be supplied from Buffalo Pound Lake, which is located 20 km north of Moose Jaw, Saskatchewan.
Saskatchewan’s Water Security Agency (WSA) has modelled the impact of the withdrawal of Encanto’s water demand on Buffalo Pound, and the results of the model showed no significant impacts on Buffalo Pound and the downstream Qu’Appelle water system. SaskWater, another Crown Corporation within Saskatchewan, which was contracted to study the delivery of the water from Buffalo Pound to the site, has provided a preliminary Engineering study proving the feasibility of delivering water to Encanto.
The plant will be designed to minimize fresh water requirements by implementing water recycling, recovery, and re-use from the process as much as possible, including storm water.
24.18.2.4 Natural Gas Supply
Natural gas will be used for heating and power generation in the cogeneration plant. It is estimated that the natural gas requirement of the plant at full operation will be approximately 1,700 GJ/h, the majority of which is used to feed the Cogeneration plant. An investigation by SaskEnergy/TransGas, the crown corporation responsible for natural gas distribution in Saskatchewan, indicated that a natural gas pipeline would originate from their existing network in the Regina area and be routed to the site.
24.18.2.5 Telecommunications
SaskTel, a provincial corporation, will provide the necessary telecommunications services for the Project. An existing cellular tower provides adequate coverage at present, and will be used during the construction phase.

Preliminary Economic Assessment and Preliminary Feasibility Study
NI 43-101 Technical Report
Project No.: 194379
24-17
A land line telecommunication service will be provided to meet both voice and data communication requirements for the mine site.
24.18.3 Site Infrastructure
The site infrastructure and support areas were designed to minimize their environmental impact, and consist principally of the following;
The location of the plant site was chosen to avoid environmentally and culturally sensitive areas as much as possible.
The site infrastructure was grouped into a compact area to reduce the amount of land that would be disturbed by the Project.
Existing roads were used where possible.
The locations of new access roads were chosen to avoid environmentally sensitive areas as much as possible.
New access roads will share a ROW with other infrastructure such as pipelines and power lines.
The use of cogeneration for electrical generation is used to maximize energy efficiency and reduce Project greenhouse gas emissions.
The amount of energy (natural gas, electricity, or oil) and water used will be minimized where possible.
Collection of the run-off water from the plant site to minimize Buffalo Pound raw water consumption.
24.18.4 Brinefield Piping
Pipelines between the plant’s tank farm and the Brinefield will be routed next to the access roads and buried below the frost line. The pipes will be grouped together to form a main pipeline corridor. With 6 pipelines buried in a single trench running a total length of approximately 3035 m, with an additional 1260 m of buried branch lines between the main pipeline trench and the three valve station buildings.
Located at the end of the Brinefield pipeline, the valve buildings will contain the electrical, instrumentation and communication facilities necessary for the mining operations of each well cluster, consisting of up to 28 wells.
24.18.5 Raw Water, Firewater, and Storm Water
Raw water will be delivered to the raw water basin located north of the process plant. The raw water pond will have an outlet structure to maintain a low flow velocity to an adjacent wet well, located below the pump house structure. From this wet well, water will be transferred to the Brinefield pumps and other plant users. The intake to this wet well will be maintained to ensure a sufficient quantity of water for fire protection at all times.
Stormwater runoff resulting from precipitation in the form of rainfall or snow will be handled in following manner:

Preliminary Economic Assessment and Preliminary Feasibility Study
NI 43-101 Technical Report
Project No.: 194379
24-18
Diverted away from the plant site prior to contacting the plant facilities.
Collected, contained, tested, and either recycled to the adjacent raw water pond or released to the environment.
24.18.6 Potable Water
Potable water will be drawn from a dedicated well that will be developed within the plant site.
24.18.7 Cooling Towers
The plant cooling water requirements will be provided by a series of four counterflow mechanical draft cooling tower units installed over a concrete water collection basin. The location of the cooling towers will be to the south-west side of the processing plant to minimize drift towards the main plant with the prevailing winds. The quality of the water within the cooling tower loop will be maintained through standard chemical treatment systems normally used for cooling towers.
24.18.8 Sewage Treatment Plant
Domestic water and sanitary sewage will be collected and transferred to a treatment plant utilizing a rotating biological contactor (RBC) process. Such RBC processes have the ability to handle variable hydraulic and organic loadings without upset, and are designed to hold sludge for periodic disposal. Effluent from this unit will meet the requirements to discharge to the environment.
24.18.9 Roads
Access to the Project site from public roads will be via the existing Highways 15 and 639, and local grid roads. Upgrades will be necessary to the local grid roads and to Highway 639 to ensure safe access to and from the property, as well as to support the increased project traffic including transport, heavy construction equipment, and material delivery. Following the upgrade work, grid road maintenance will remain the responsibility of the local Rural Municipalities (RMs).
In addition, separate access roads to the Brinefield will be required. These access roads will be constructed from the existing RM grid road network near the Brinefield. Access roads will be routed using similar guiding principles for those for pipelines, and efforts will be made to consolidate infrastructure in a common ROW wherever feasible.
The on-site roads will be paved and constructed to handle heavy and light vehicle traffic in all areas of the plant, while promoting pedestrian safety. It is expected that some sectors may be designated as having restricted access due to high traffic circulation, and in those cases, separate access points will be implemented to maximize security.

Preliminary Economic Assessment and Preliminary Feasibility Study
NI 43-101 Technical Report
Project No.: 194379
24-19
24.18.10 Rail
The final potash product will be shipped from the plant by rail. It is presently planned to connect to an existing rail line located approximately 5 km south of the facility site with a rail spur from the processing plant. The final routing has not yet been determined, but the rail spur will be approximately 7 km in length.
The on-site rail loop was designed taking into consideration the operation modes of the major rail carriers using a ‘drop and hook’ model that minimizes downtime of the locomotives. The on-site rail will consist of concentric tracks, each capable of holding half of the projected train lengths.
24.18.11 Temporary Facilities
Temporary facilities that are required during the construction phase of the plant are expected to be mobile, and removed after construction in order to ensure minimum impact on the overall plant site. It is anticipated that the following temporary facilities and infrastructure will be required:
entrance/exit gates with security and first aid trailers
engineering offices with lunchroom and washroom
contractors’ offices with lunchroom and washroom
parking lot
safety training trailer
equipment storage buildings
equipment maintenance area
material laydown area
24.19 Market Studies and Contracts
24.19.1 Preamble
In 2012, Encanto engaged Fertecon Limited to provide information regarding historical and forecast developments in the potash industry and its markets.
24.19.2 Demand for Potash (KCl)
24.19.2.1 Historical and Forecast Growth of Demand
Growth of demand for potash averaged 2.7% per year from 1995 through 2011 (Figure 24-11), however growth prior to 2007 had been on a pace of 3.4% per year. It is likely that the prolonged global economic recession, which began in 2008, has masked the underlying growth potential. Figure 24-11 also shows a forecast of growth of demand for 2011 to 2020 made by Fertecon (Fertecon Limited, 2012), that projects an average rate of

Preliminary Economic Assessment and Preliminary Feasibility Study
NI 43-101 Technical Report
Project No.: 194379
24-20
growth of 3.2% per year. This rate appears to be consistent with the 3.4% per year pace of growth from 1995 through 2007. The growth outlook on a tonnage basis appears likely to be strong throughout the forecast period to 2037.
Figure 24-11: Demand for KCl (Source: Fertecon Limited)
24.19.2.2 Pricing; Historical and Forecast Prices
Historical and forecast prices are shown in Figure 24-12 in current terms (dollars of the day) and in real terms (inflation adjusted to 2011 dollars).
Fertecon’s forecast of standard product prices for 2012 to 2020 ranges from a low of US$435/tonne in 2016/2017 to US$500/tonne in 2020. The projected rate of increase for prices is expected to be limited, since the rate of supply growth is expected to outpace demand growth. To achieve the projected price increases, Canadian and Former Soviet Union producers will have to operate at a lower rate of capacity utilization than the industry average. Assuming an inflation rate of 2%, real prices are projected to decline during this period.

Preliminary Economic Assessment and Preliminary Feasibility Study
NI 43-101 Technical Report
Project No.: 194379
24-21
Figure 24-12: Outlook for potash prices FOB Vancouver (Source: Fertecon Limited)
In view of the Fertecon outlook for pricing, it is recommended that the Encanto Project prefeasibility evaluation be based on US$500/tonne. Since the Project considers using an off-take contractor for sale of product, a deduction of 8%, resulting in a net price FOB Vancouver of US$460/tonne for the first 2.0 million tonnes per year (Mtpa) of MOP will be considered. Additional tonnage is planned to be produced by secondary mining beginning approximately 4 years after start up and reaching a planned production rate of 0.8 Mtpa another 3 years thereafter. It is recommended that the plant use its compaction capabilities to produce 40% of the total output starting in Year 4 of operation to produce granular product and that it be sold in the United States or other countries in the Americas. In such case the price assumption should be US$485/tonne.

Preliminary Economic Assessment and Preliminary Feasibility Study
NI 43-101 Technical Report
Project No.: 194379
24-22
24.21 Capital and Operating Costs
24.21.1 Capex Estimate Scope and Methodology
The Muskowekwan Project is a greenfield facility, and includes the following major areas for which capital expenditures (CAPEX) are required:
mine
processing plant
utilities
product storage
product loadout
tailings management and brine disposal
on-site and off-site infrastructure
24.21.2 Basis of Estimate
24.21.2.1 Type of Estimate and Accuracy
The minimum requirement of the estimation is to meet the requirements of a Class 4 estimate as defined in AACE International Recommended Practice No. 18R-97 with an intended estimate accuracy of ±20%.
24.21.2.2 Labour
Labour composite crews were developed for the different disciplines based on the Saskatchewan Building Trades Association rates effective until July 2012. These hourly rates are all inclusive sell-out rates for the different construction tradesmen.
24.21.2.3 Currency
The estimate was developed using quoted currencies and converted to Canadian dollars using the final currency exchange rates as of 14 October 2012 (1$USD=1$CAN).
24.21.3 Project Cost Summary
Table 24-5 outlines the estimated capital and operational costs applicable to the Project considering parameters mentioned in the above sections.

Preliminary Economic Assessment and Preliminary Feasibility Study
NI 43-101 Technical Report
Project No.: 194379
24-23
Table 24-5: Project cost summary by major area
Description Total Installed Cost (CAD$)
Initial CAPEX Deferred CAPEX
Direct Costs
Total Direct Costs $1.92 billion $76.3 million
Indirect Costs
Total Indirect Costs $0.94 billion $53.5 million
CAPEX Summary Sub-Totals $2.86 billion $130.0 million
Grand Total $2.99 billion
24.21.4 Operating Cost Estimate
The scope for this activity was to prepare an operating cost estimate for the entire Project, including the mine and plant, running at the various incremental capacities of primary and secondary mining production. This exercise was performed using all technical and commercial data generated from the mass and heat balance as well as interfacing with vendors, utility suppliers and third-party service providers to establish the plant running costs in terms of quantities and pricing. The methodology used is considered to be in line with the requirements of the PFS and accurate to within ±20%.
The estimated labour force required to operate the facility at 2.8 Mtpa is presented in Table 24-6.
Table 24-6: Labour force to operate facility
Description Total Personnel
Management and Administration level 20
Salaried Staff 80
Hourly Staff 240
Total 340
24.21.4.1 Rail Costs
Transportation costs will be incurred for shipping the product to the port in Vancouver. The operational costs of rail include the monthly lease of the cars, the shipping charges and any maintenance necessary to continue these operations. It is estimated that 3 trains of 170 cars each are required for the initial production of 2.0 Mtpa and 5 trains of 170 cars each for the production of 2.8 Mtpa. The estimate assumes that production of 2.8 Mtpa starts in year 4 of plant operation. The cost of shipping is based on a proposal from Canadian National (CN) rail. These costs were benchmarked against other projects in Saskatchewan and deemed to be competitive. The cost per tonne is approximately $32.44 including the fuel surcharge as of December, 2012. As the price of fuel changes the surcharge will also change.

Preliminary Economic Assessment and Preliminary Feasibility Study
NI 43-101 Technical Report
Project No.: 194379
24-24
24.21.4.2 Port Charges
Working with two ports in the Vancouver area, a rate of $17.74 per tonne was obtained. This is an all-inclusive price covering rail discharge, storage and ship loading. The cost is based on the ports proposed expansion projects to create a new potash handling facility at their site, and includes the cost of capital for the port infrastructure as well as the operational cost of the port.
24.21.4.3 Summary of Operating Costs
All quantities generated for the estimate do not include contingencies or risk. The estimated direct cost breakdown at full production (2.8 Mtpa) is presented in Table 24-7.
Table 24-7: Estimated OPEX to produce 2.8 Mtpa of MOP
$ per tonne
Direct Costs
Labour $13.57
Utilities $31.66
Maintenance $10.13
Total Direct Cost $45.08
Total Indirect Costs $9.24
Combined OPEX $54.32
Total Logistics (rail and port) Costs $50.50
Production Taxes and Royalties $65.37
The tax and royalty figures assumed thus far are only estimated based on any other potash project in the Province of Saskatchewan. Actual tax and royalty figures as applicable to this project will need to be clarified during the next feasibility stage.
24.22 Economic Analysis
24.22.1 Scope
As part of the project an economic analysis was performed, providing for estimates of the Net Present Value, Internal Rate of Return, and Pay Back Period for the Project. This analysis included the development of a cash flow model, which was completed by Novopro to be used specifically for the Encanto Project.
For the purpose of the model, the assumption has been made that the Project would pay royalties and tax similar to any other potash Project located on provincial Crown lands. From a competitiveness or economic performance perspective, this would make the Project the same as any other potash Project located in Saskatchewan in this respect.

Preliminary Economic Assessment and Preliminary Feasibility Study
NI 43-101 Technical Report
Project No.: 194379
24-25
The cash flow model was developed by Novopro with the assistance of the Saskatoon branch of the accounting firm Ernst & Young, the recognized potash royalty and tax expert in Saskatchewan.
The inputs and structure of the Economic Model for the Encanto Project are described in this section.
24.22.2 Economic Model
24.22.2.1 Revenues
Revenues were calculated using an estimated price of US$460 per tonne FOB Vancouver for Standard product and US$485 per tonne FOB Vancouver for granular product. This is in line with the pricing that was recommended as per a market study performed. The product split between standard potash and granular potash was assumed to be 1.68 Mtpa and 1.12 Mtpa respectively (60/40). Production of granular product begins in Year 4, reaching its full capacity of 1.12 Mtpa by Year 5.
24.22.2.2 Capital Construction Costs
The initial Capital Construction Costs of the Project were taken from the CAPEX estimate and assumed to be spent over a 3-year timeline.
Project’s deferred capital expenditure for construction is assumed to be spent during the third year of production being ready for use to produce granular KCl in Year 4.
24.22.2.3 Operating Costs
Direct operating costs were estimated based on design-specific process parameters. Indirect costs were estimated based on benchmarking against and experience from past Projects, and are paid fully from the start of the production. All non-specific operating costs were adjusted in proportion to the amount of potash production.
24.22.2.4 Sustaining Capital
The sustaining capital captures all items in the Brinefield extensions (including drilling, pipelines and valve houses, roads, etc.), as well as the costs of replacement of vehicles and TMA expansions. It also includes capitalizable maintenance costs within the plant.
The total sustaining capital is $32.21/tonne.
24.22.2.5 Taxes and Royalties
For the Project, the following Taxes and Royalties were considered:
Property/Municipal taxes (included in the OPEX)
Potash Production Tax
Federal Tax

Preliminary Economic Assessment and Preliminary Feasibility Study
NI 43-101 Technical Report
Project No.: 194379
24-26
Provincial Tax
Saskatchewan Resource Surcharge
For the purpose of the PFS, the assumption was made that the Project would be subject to royalties and taxes similar to any other potash Project located on provincial Crown lands. From a competitiveness or economic performance perspective, this would make the Project the same as any other potash Project located in Saskatchewan with respect to royalty and tax.
Any agreement between Canada on behalf of the Muskowekwan First Nation and Saskatchewan that would be expected to result in a royalty and tax obligation less than what would apply to a Project located on Saskatchewan Crown lands would represent a positive economic advantage for the Project.
Other Project efficiencies would still apply to the Project. This includes but is not limited to the result of locating the Project on federal Indian lands such as dealing with a single land owner and mineral rights holder; mine plan efficiencies associated with having a contiguous potash resource rather than the typical ‘checkerboard mineral title’ that characterizes most potash mines; and the support of the federal government to support a high profile, on-reserve, Indian economic development Project.
24.22.2.6 Discount Rate and Inflation
The Economic Model for the Encanto Project used a discount rate of 10% and 2% inflation per annum from Year 1 onwards. Inflation rates were applied to potash price, operation expenditures, sustaining capital, taxes and royalties and insurances. Inflation for capital expenditures was covered in escalation within the CAPEX.
24.22.2.7 Time Scale
24.22.2.7.1 Construction
Construction begins in Year 1 of the model. Subsequent years represent complete calendar years with construction completed at the end of Year 3 and production starting at the beginning of Year 4.
24.22.2.7.2 Ramp-Up
Production ramp-up to 2.8 Mtpa is expected to occur over five years. In the first year, production will ramp up to 2.0 Mtpa using primary mining alone. After 2.86 years, these primary mining caverns are switched to secondary mining. It is estimated that it will take one full year of secondary mining production to build up adequate potash in the crystallization pond to commence harvesting.

Preliminary Economic Assessment and Preliminary Feasibility Study
NI 43-101 Technical Report
Project No.: 194379
24-27
24.22.3 Outputs of the Economic Model
24.22.3.1 Net Present Value and Internal Rate of Return
The estimated after tax Net Present Value (NPV) reported in the 2013 PFS was $2.838 billion, with an after tax Internal Rate of Return (IRR) of 18.0%, as listed in Table 24-8. This is based on potash price and estimated costs and exchange rate at that effective date of the 2013 PFS (28 February 2013).
Table 24-8: Before and after income tax NPV and IRR for a 50 year life of potash production
NPV (CAD$) IRR (%)
Before income taxes $4.118 billion 20.0%
After income taxes $2.838 billion 18.0%
Notes:
10% Discount Rate, 2% Inflation.
460 FOB $/tonne Standard KCl, 485 FOB $/tonne Granular KCl.
24.22.3.2 Payback Period
A pay-back period of 5.1 years was calculated based on the after tax free cash flow (non-discounted).
24.22.3.3 Sensitivity Study
In order to assess the sensitivity and variability of the NPV and IRR associated with the Encanto Project, a sensitivity analysis was carried out. Tested for sensitivity were variations in the Project’s potash selling price, discount rate (cost of capital), capital construction costs and natural gas costs. The results of the sensitivity study indicate that the NPV is most sensitive to, in decreasing order:
potash price
project cost of capital (discount rate)
capital construction costs
natural gas price
This is represented graphically in Figure 24-13 and Figure 24-14.

Preliminary Economic Assessment and Preliminary Feasibility Study
NI 43-101 Technical Report
Project No.: 194379
24-28
Figure 24-13: Sensitivity of the after-tax NPV (Source: Novopro)
Figure 24-14: Sensitivity of the after-tax IRR (Source: Novopro)
0
1,000
2,000
3,000
4,000
5,000
6,000
-30% -20% -10% 0% 10% 20% 30%
NP
V (
Millio
ns
$C
ND
)
Change in Factor
Sensitivity of the AfterTax NPV
Potash Price
DiscountRate
Natural GasPrice
CapitalExpenditures
0%
5%
10%
15%
20%
25%
-30% -20% -10% 0% 10% 20% 30%
Inte
rna
l R
ate
of
Re
turn
(IR
R%
)
Change in Factor
Sensitivity of AfterTax IRR
Potash Price
Natural GasPrice
CapitalExpenditures
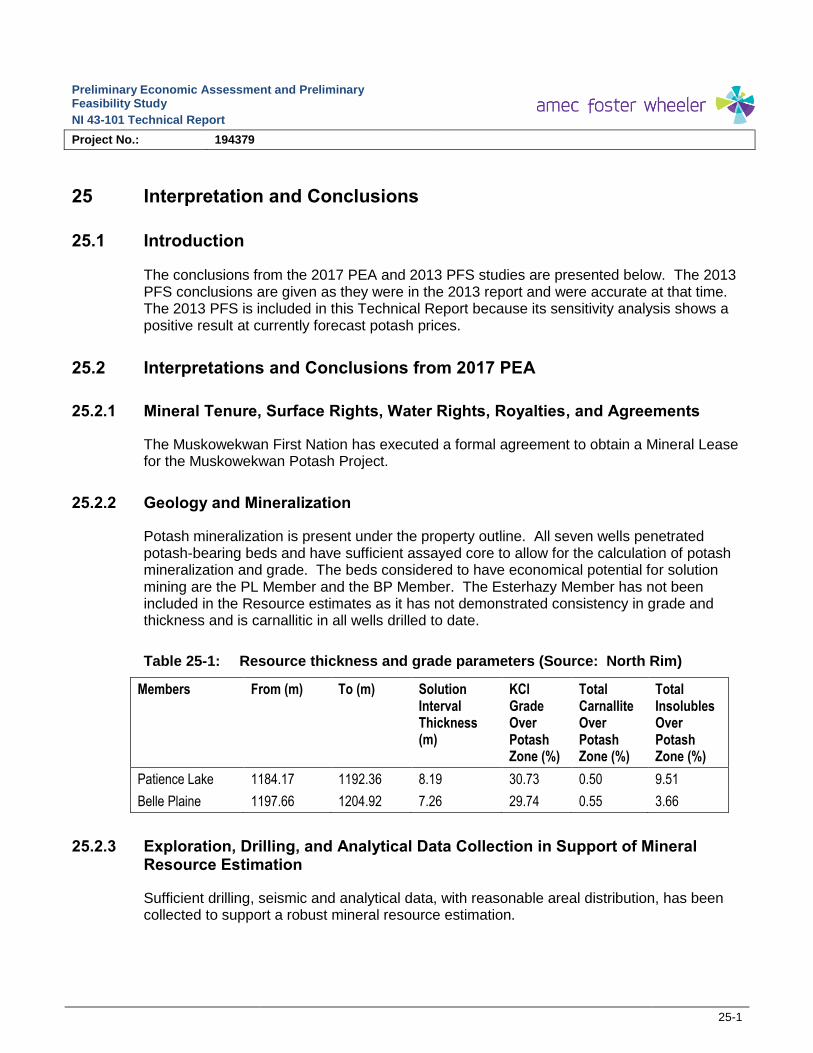
Preliminary Economic Assessment and Preliminary Feasibility Study
NI 43-101 Technical Report
Project No.: 194379
25-1
25 Interpretation and Conclusions
25.1 Introduction
The conclusions from the 2017 PEA and 2013 PFS studies are presented below. The 2013 PFS conclusions are given as they were in the 2013 report and were accurate at that time. The 2013 PFS is included in this Technical Report because its sensitivity analysis shows a positive result at currently forecast potash prices.
25.2 Interpretations and Conclusions from 2017 PEA
25.2.1 Mineral Tenure, Surface Rights, Water Rights, Royalties, and Agreements
The Muskowekwan First Nation has executed a formal agreement to obtain a Mineral Lease for the Muskowekwan Potash Project.
25.2.2 Geology and Mineralization
Potash mineralization is present under the property outline. All seven wells penetrated potash-bearing beds and have sufficient assayed core to allow for the calculation of potash mineralization and grade. The beds considered to have economical potential for solution mining are the PL Member and the BP Member. The Esterhazy Member has not been included in the Resource estimates as it has not demonstrated consistency in grade and thickness and is carnallitic in all wells drilled to date.
Table 25-1: Resource thickness and grade parameters (Source: North Rim)
Members From (m) To (m) Solution Interval Thickness (m)
KCl Grade Over Potash Zone (%)
Total Carnallite Over Potash Zone (%)
Total Insolubles Over Potash Zone (%)
Patience Lake 1184.17 1192.36 8.19 30.73 0.50 9.51
Belle Plaine 1197.66 1204.92 7.26 29.74 0.55 3.66
25.2.3 Exploration, Drilling, and Analytical Data Collection in Support of Mineral Resource Estimation
Sufficient drilling, seismic and analytical data, with reasonable areal distribution, has been collected to support a robust mineral resource estimation.

Preliminary Economic Assessment and Preliminary Feasibility Study
NI 43-101 Technical Report
Project No.: 194379
25-2
25.2.4 Metallurgical Testwork
Dissolution testing on cores from two explorations wells, Encanto Lestock 08-14-27-15 and Encanto Lestock 02-30-27-14, was performed by the NG Consulting laboratory in Germany. With respect to the dissolution kinetics, it was found that the dissolution rates of the Encanto samples are in a range comparable to sylvinite found in similar deposits. The dissolution testing supported the design brine concentration of 148 g/L KCl and 254 g/L NaCl at a cavern temperature of 60oC.
25.2.5 Mineral Resource Estimates
Measured, Indicated and Inferred Mineral Resources have been estimated for the project area. The Mineral Resources are the tonnes of potash contained in a cylinder centered on the available cored and assayed drill holes with ROIs based on best practices and the QPs experience. Only Measured and Indicated Resources were used in the PEA mine design.
25.2.6 Mineral Reserve Estimates
No reserves are estimated in connection with the 2017 PEA.
25.2.7 Mine Plan
Caverns were laid out within the Measured and Indicated Resource areas at the Muskowekwan project site using the proposed cavern and pillar dimensions discussed in Section 16.1.3 together with exclusions for geological anomalies and carnallite and areas with townsites and critical individual surface facilities. This layout resulted in a total of 710 caverns.
Forty-four caverns are required in simultaneous production in order to provide a production level of 2.4 Mtpa of MOP from primary mining. Initial development will consist of 50 caverns in order to provide backup caverns. In secondary mining, which has a smaller production rate from a given cavern compared to primary mining, 68 caverns are necessary to produce 1.0 Mtpa of MOP. Because only 44 caverns will be released to secondary mining after the first primary mining cycle, full production of 3.4 Mtpa will be achieved at the onset of the second cycle of secondary mining. The average expected life of a primary cavern is 2.86 years so full production including secondary mining can be achieved after two cycles of primary or in 5.7 years. If run continuously, the life of a secondary cavern is approximately 4 years. Using these caverns per year requirements and cavern lives in both primary and secondary mining, the mine life for those 710 caverns is approximately 48 years.
25.2.8 Recovery Methods
The process facility will consist of evaporation, crystallization, crystallization pond, drying, debrining, screening compaction, and loadout facilities. The plant is designed to produce standard and granular potash products.
Bulk and packaged reagents will be trucked and or railed to site and stored for use in the process plant.

Preliminary Economic Assessment and Preliminary Feasibility Study
NI 43-101 Technical Report
Project No.: 194379
25-3
The equipment and technology proposed for the process plant has been proven successful in other potash operations.
25.2.9 Infrastructure
The plant site will be accessed from Highway 35. The local grid road form Highway 35 to the site will be upgraded to support the increased project traffic.
Power will be supplied from the main provincial power grid. The plant will tie into the grid at the cogeneration facility located near the plant site that will be owned and operated by a third party.
The steam required for the process and heating will be sourced from the nearby cogeneration facility. Natural gas will be used for product drying. Natural gas for the site will be supplied from the main natural gas supply line to the cogeneration facility.
Water will be supplied from Buffalo Pound Lake. A pipeline of approximately 150 km will be constructed from the regional pumphouse at Buffalo Pound to the plant site. The water will be stored in the raw water pond.
The site will be connected to the Canadian National Watrous line by a 5 km rail spur.
25.2.10 Environmental, Permitting and Social Considerations
The Project has well advanced environmental, permitting and social investigative work that led to an EIS submission in August 2013. Additional field and study work is required to address regulator comments from that submission to complete the EIS and obtain approval.
25.2.11 Capital Cost Estimates
The PEA capital cost estimate for a 3.4 Mtpa operating solution mine facility is $4.03 billion.
Sustaining capital costs at the full production capacity of 3.4 Mtpa are estimated to be $35.98/product tonne.
25.2.12 Operating Cost Estimates
Operating costs at the full production capacity of 3.4 Mtpa are estimated to be $42.86/product tonne for site costs, $50.05/product tonne for logistics and $41.95/product tonne for taxes and royalties.
25.2.13 Economic Analysis
For a 50 year mine life and a production rate of 3.4 Mtpa the following pre-tax financial parameters were calculated:
$1,133 million NPV (pre-tax, year -4) at 10% discount rate
18.9% IRR
5.9-year payback on $3.92 billion capital cost

Preliminary Economic Assessment and Preliminary Feasibility Study
NI 43-101 Technical Report
Project No.: 194379
25-4
The after-tax financial parameters are:
$816 million NPV (pre-tax, year -4) at 10% discount rate
17.7% IRR
9.9-year payback on $4.03 billion capital cost
Sensitivity analysis was performed on the project using potash price, capital cost, operating cost, and discount rate. The project is most sensitive to changes in the potash price.
25.2.14 Risks and Opportunities
Risks:
Mineral Resource and Mineral Reserve estimates
Assumed commodity prices and exchange rates
The proposed mine production plan
Projected mining and process recovery rates
Capital costs and operating costs
Projected cash flows
Assumptions as to closure costs and closure requirements
Assumptions as to environmental, permitting and social risks
Potash market price reduction, possibly caused by additional international production capacity.
Opportunities:
Public and Government interest in promoting First Nations industries and employment.
First Nation business opportunities for power cogeneration and water supply.
First Nation business opportunities during project construction.
25.2.15 Conclusions
The QPs conclude that the PEA represents a viable production alternative with an improved NPV compared to the PFS.. The project can proceed to more detailed studies to further develop the project scope definition, regulatory approvals, execution strategy and cost.
25.3 Interpretations and Conclusions from 2013 PFS
25.3.1 2013 Mineral Resource
Measured, Indicated and Inferred Mineral Resources have been estimated for the project area. The Mineral Resources are the tonnes of potash contained in a cylinder centered on the available cored and assayed drill holes with ROIs based on best practices and the QPs

Preliminary Economic Assessment and Preliminary Feasibility Study
NI 43-101 Technical Report
Project No.: 194379
25-5
experience. Only Measured and Indicated Resources were used in the PFS mine design. All of the Measured Resources were converted to Proven Reserves and a portion of the Indicated Resources were converted to Probable Reserves.
Refer to Table 14-4.
25.3.2 2013 Mineral Reserves
Measured and Indicated Mineral Resources surrounding 6 of the 7 wells have been converted to Proven and Probable Reserves, respectively. Mineral Reserves for the potential solution mining intervals (PL and BP Members excluding the interbed between them) are estimated to be as follows (using a cutoff grade of 15.0% K2O or 23.7% KCl):
Proven Mineral Reserves: 34.23 Mt of KCl, or 34.93 Mt potash product containing 62% K2O (K62).
Probable Mineral Reserves: 127.74 Mt of KCl, or 130.34 Mt potash product containing 62% K2O (K62).
The Proven and Probable Mineral Reserves are based on the mine plan and geologic model that accounts for local variability of grade and thickness of individual caverns. The Proven and Probable Mineral Reserves include downward adjustments of 5% and 9%, respectively, to account for unknown anomalies. The Proven and Probable Mineral Reserves accounted for extraction ratio, KCl recovery from the caverns (85%), and plant recovery (94.5% including losses between the plant and the port). More detail on the Proven and Probable Reserves is presented in Section 15 of this Technical Report. At a production rate of 2.8 million tonnes MOP (K62) per year, the estimated mine life is over 58 years.
25.3.3 2013 Prefeasibility Study
Based on the work done for the 2013 Muskowekwan Project PFS, the authors are satisfied that a single design has been achieved that meets the needs of Encanto and the Muskowekwan First Nations Band. CAPEX and OPEX estimates were prepared with a target accuracy typical for an AACE Class 4 level study. The total CAPEX estimate for the 2.8 Mtpa plant was $ 2.99 billion. This included allowances for, water and gas supply pipelines, and off-site rail spur. The cash flows and economic analysis indicate a strong project with low sensitivity to CAPEX and OPEX. The 2013 Muskowekwan PFS has significantly advanced the level of definition of this project, with no known limitations preventing advancement.
It is the opinion of the PFS authors that the 2013 PFS demonstrated sufficient potential for a reserve base to support further studies to evaluate the feasibility of development of a commercial plant capable of producing 2.8 Mtpa of potash (K62 equivalent and 98% sylvite).
25.3.4 Additional Work
Additional work can be contemplated to further investigate mining and processing risk. This risk comprises the uncertainties concerning solution mining of low-grade beds, the impact of carnallite on sylvite saturation, and the energy required to economically recover potash from a solution mining operation. This risk will be further mitigated by the preparation of a FS that

Preliminary Economic Assessment and Preliminary Feasibility Study
NI 43-101 Technical Report
Project No.: 194379
25-6
incorporates various scenarios concerning cavern mining sequence, injection liquor flow rate and temperature, energy input, processing method and management.
It was the opinion of the PFS authors of the 2013 PFS that there were sufficient mineral resources and mineral reserves to support a Feasibility Study.

Preliminary Economic Assessment and Preliminary Feasibility Study
NI 43-101 Technical Report
Project No.: 194379
26-1
26 Recommendations
26.1 Introduction
The recommendations from the 2017 PEA and 2013 PFS studies are presented below. These are derived from different alternatives prepared and different times, yet are similar in most respects.
26.2 Recommendations from 2017 PEA
Complete field work to support the EIS. Amend the EIS report with these new inputs and re-submit for regulatory approval. Estimated cost: $2 million Canadian dollars.
Complete an updated Mineral Resource estimation that would include newly acquired lands and the incorporation of the 3D seismic in the north-east part of the property. Estimated cost: $50 thousand Canadian dollars.
Conduct a Feasibility Study for the Project. Estimated cost: $7 million Canadian dollars.
Assuming a positive outcome of the Feasibility Study, proceed to Front End Engineering and Design of the project. Estimated cost: $55 million Canadian dollars.
26.3 Recommendations from 2013 PFS
Specific recommendations for a phased development include:
The following recommendations are made by the authors:
Phase 1
Continue studies to define reserves and complete a FS and Environmental Baseline Study including:
1. Complete a FS including cavern layout, permitting, process design, infrastructure, utilities, transport, and marketing studies. Estimated cost: $9 million.
2. Complete an Environmental Baseline Study and EIS. Estimated cost: $2 million.
Total estimated cost for Phase 1: $11 million.
Phase 2
Conditional on favourable results for the FS and after project approvals have been granted commence:
1. Bridge engineering of plant, well field, infrastructure, and utilities. Estimated cost: $15 million.
2. Basic detail engineering. Procurement of long-lead equipment. Estimated cost: $20 million.
3. Early site civil works. Estimated cost: $20 million.
Total estimated cost for Phase 2: $55 million.

Preliminary Economic Assessment and Preliminary Feasibility Study
NI 43-101 Technical Report
Project No.: 194379
27-2
27 References
This section lists references used in this document.
Alger, R., & Crain, E. 1965. “Defining evaporite deposits with electrical well logs”. Trans. Northern Ohio Geo. Soc. Second Symp. on Salt, 2, pp. 116-130.
Bannatyne, B. 1983. Devonian Potash Deposits in Manitoba; Manitoba Department of Energy and Mines, Open File report OF83-3.
Bannatyne, B. 1983. Devonian Potash Deposits of Manitoba. Winnipeg: Department of Energy and Mines Report OF83-3.
Brebner, J., Stirett, T., Hardy, M., Hambley, D., “Technical Report Summarizing the Preliminary Feasibility Study for the Muskowekwan First Nations Project in South Eastern Saskatchewan”, Feb 28, 2013
CIM. 10 May 2014. CIM Definition Standards - For Mineral Reserves and Mineral Resources.
CIM. 27 November 2010 CIM Definition Standards - For Mineral Reserves and Mineral Resources.
CIM. 23 November 2003. Estimation of Mineral Resources and Mineral Reserves – Best Practices Guidelines. CIM.
Danyluk, T. K., G. D. Phillips, A. F. Prugger, and M. S. Pesowski. 1999. “Geophysical Analysis of an Unusual Collapse Structure at PCS Potash, Lanigan Division,” Proceedings, Mining: Catalyst for Social and Economic Growth, 101st Annual General Meeting of CIM. Lower Haughton, Johannesburg, South Africa. 2-5 May.
Edgecombe, R. 15 February 2011. Manager Potash Division. P. Communication, Interviewer.
Fuzesy, A. 1982. Potash in Saskatchewan. Saskatchewan Energy and Mines Report 181.
Government of Saskatchewan Publications. 2014. “Stratigraphic Correlation Chart”. http://publications.gov.sk.ca/documents/310/93751-Saskatchewan%20Stratigraphic%20Correlation%20Chart%20Aug11.14.pdf. Retrieved 19 April 2017.
Government of Saskatchewan Publications. 2017. “Mineral Exploration Guidelines for Saskatchewan”. www.publications.gov.sk.ca/details.cfm?p=76977. Retrieved 19 April 2017.
Halabura, S. P., and M .P. Hardy. 2007. “An Overview of the Geology of Solution Mining of Potash in Saskatchewan”. Solution Mining Research Institute. Halifax, Nova Scotia.
Hardy, M. P., S. P. Halabura, D. Shewfelt, and D. Hambley. 2010. Technical Report – 2010 Potash Reserve Assessment for Subsurface Mineral Permit KP 289 Saskatchewan. NI 43-101.
Holter, M. 1969. The Middle Devonian Prairie Evaporite of Saskatchewan. Saskatchewan Department of Mineral Resources Report 123.

Preliminary Economic Assessment and Preliminary Feasibility Study
NI 43-101 Technical Report
Project No.: 194379
27-3
Karnalyte Resources Inc. “Karnalyte Resources Inc. Announces Results Of Optimization Program.” http://karnalyte.com/news/press-releases/karnalyte-resources-inc-announces-results-optimization-program/. Last updated 29 December 2016.
Kotowski, S., V. Funk, A. Johnson, J. Cairns, T. Stirrett, L. MacBride, et al. 2011. Technical Report and Preliminary Economic Assessment of the Muskowekwan Project. Tetra Tech Wardrop for Encanto Potash Inc.
Mackintosh, A. A. 1983. “Geological Anomalies Observed at the Cominco Ltd. Saskatchewan Potash Mine”. Potash Technology – Mining, Processing, Maintenance, Transportation, Occupational Health and Safety, Environment. Toronto: Pergamon Press.
Mackintosh, A. D., and G. A. McVittie. 1983. “Geological Anomalies Observed at the Cominco Ltd. Saskatchewan Potash Mine,” Potash ’83 Potash Technology – Mining, Processing, Maintenance, Transportation, Occupational Health and Safety, Environment. Pergamon Press. Toronto, AB. pp. 59-64.
Mineral Exploration Webpage. 2010. http://www.nrcan.gc.ca/mms-smm/abor-auto/htm/kit-toc/kit-exp-eng.htm. Retrieved January 2011.
Mining Industry Human Resources Council. 2015. Saskatchewan Mining Industry Hiring Requirements and Available Talent Forecasts. http://saskmining.ca/ckfinder/userfiles/files/Labour-Market-Reports/2014-SMA.pdf. Retrieved 26 May 2017.
Phillips, G. D. 1982. “Nomenclature for Use in Saskatchewan Potash.” Seventh Annual CIM District Four Meeting. Saskatoon, SK. 9 October.
RBC Dominion Securities Inc., “RBC Fertilizer Insights 2017 Outlook and Industry Primer” , 12 January 2017
RPS Boyd PetroSearch. 2010. 2010 Muskowekwan 3D Seismic Interpretation Final Report. Calgary.
RPS. 2010. 2010 Muskowekwan 3D Seismic Interpretation Final Report. Calgary.
RPS. 2012. 2010 Muskowekwan 3D 2RB Dip. Calgary.
Saskatchewan Ministry of Economy. 2015. “The Crown Minerals Act”. http://www.publications.gov.sk.ca/freelaw/documents/English/Statutes/Statutes/C50-2.pdf. Retrieved 18 April 2017.
Saskatchewan Ministry of Economy. 2017. “The Subsurface Mineral Tenure Regulations”. www.publications.gov.sk.ca/freelaw/documents/English/Regulations/Regulations/C50-2R30.pdf. Retrieved 18 April 2017.
Stirrett, T. A. 2011. Technical Summary Report for 2011 Encanto Potash Inc. Potash Resource Assessment for Muskowekwan First Nations Home Reserve. Saskatoon: North Rim.
Stirrett, T. A. 2012. Technical Summary Report - Encanto Potash Corp., 2012 Potash Resource Assessment for the Muskowekwan First Nations Home Reserve Project South Eastern Saskatchewan, Canada. Saskatoon: North Rim.
The Crown Minerals Act. 1984-85-86. Chapter C-50.2 of the Statutes of Saskatchewan.
The Indian Oil and Gas Act. 1974-75-76.
Preliminary Economic Assessment and Preliminary Feasibility Study
NI 43-101 Technical Report
Project No.: 194379
27-4
The Subsurface Mineral Regulations. 1960. Saskatchewan Regulations 541/67.
Warren, J. K. 2006. Evaporites, Sediments, Resources and Hydrocarbons. Springer, Berline Heidelber New York.
Williams-Stroud, S. 1994. “The Evolution of an Inland Sea of Marine Origin to a Non-Marine Saline Lake: The Pennsylvanian Paradox Salt”. Society for Sedimentary Geology. Special Publication No. 50, 293 – 306
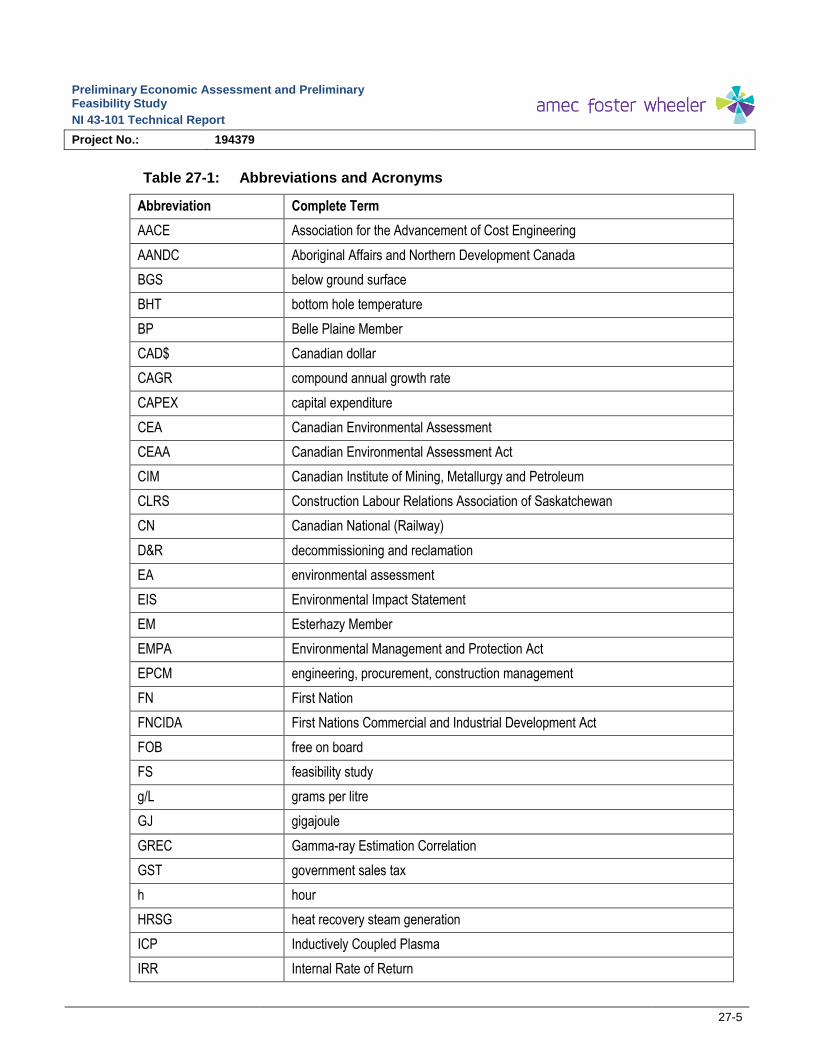
Preliminary Economic Assessment and Preliminary Feasibility Study
NI 43-101 Technical Report
Project No.: 194379
27-5
Table 27-1: Abbreviations and Acronyms
Abbreviation Complete Term
AACE Association for the Advancement of Cost Engineering
AANDC Aboriginal Affairs and Northern Development Canada
BGS below ground surface
BHT bottom hole temperature
BP Belle Plaine Member
CAD$ Canadian dollar
CAGR compound annual growth rate
CAPEX capital expenditure
CEA Canadian Environmental Assessment
CEAA Canadian Environmental Assessment Act
CIM Canadian Institute of Mining, Metallurgy and Petroleum
CLRS Construction Labour Relations Association of Saskatchewan
CN Canadian National (Railway)
D&R decommissioning and reclamation
EA environmental assessment
EIS Environmental Impact Statement
EM Esterhazy Member
EMPA Environmental Management and Protection Act
EPCM engineering, procurement, construction management
FN First Nation
FNCIDA First Nations Commercial and Industrial Development Act
FOB free on board
FS feasibility study
g/L grams per litre
GJ gigajoule
GREC Gamma-ray Estimation Correlation
GST government sales tax
h hour
HRSG heat recovery steam generation
ICP Inductively Coupled Plasma
IRR Internal Rate of Return

Preliminary Economic Assessment and Preliminary Feasibility Study
NI 43-101 Technical Report
Project No.: 194379
27-6
Abbreviation Complete Term
ISO International Organization for Standardization
JVA Joint Venture Agreement
KCl potassium chloride
KL Subsurface Mineral Lease
KP Subsurface Mineral Permit
KSPC K+S Potash Canada
LLP limited liability partnership
LPL Lower Patience Lake
MEE multi-effect evaporators
Mt million tonnes
MOE Ministry of Environment
MOP muriate of potash
MRL Muskowekwan Resources Ltd.
Mtpa million tonnes per annum
MVA mega Volt-amperes
MVR mechanical vapor recompression
NPK nitrogen-phosphorus-potassium
NPV net present value
OPEX operating expenditure
PCS Potash Corporation of Saskatchewan
PE Prairie Evaporite
PEA preliminary economic assessment
PFS prefeasibility study
PL Patience Lake Member
PST provincial sales tax
QA quality assurance
QC quality control
RBC rotating biological contactor
RM rural municipality
ROI return on investment
ROW right of way
SFT Selective Formation Test

Preliminary Economic Assessment and Preliminary Feasibility Study
NI 43-101 Technical Report
Project No.: 194379
27-7
Abbreviation Complete Term
SK Saskatchewan
SKEAA Saskatchewan Environmental Assessment Act
SMTR Subsurface Mineral Tenure Regulations
SRC Saskatchewan Research Council
TLE Treaty Land Entitlement
TMA Tailings Management Area
UPL Upper Patience Lake
US$ United States dollar
WBM White Bear Marker Beds
WSA Water Security Agency

Amec Foster Wheeler Mining and Metals 301-121 Research Drive, Saskatoon, SK Canada, S7N 1Ks
Tel 306-477-1155 Fax 306-477-1161 www.amecfw.com
CERTIFICATE OF QUALIFIED PERSON
I, David M. Myers, P.Eng., am employed as a Technical Director with Amec Foster Wheeler.
This certificate applies to the technical report titled NI 43-101 Technical Report on a Preliminary
Economic Assessment and Preliminary Feasibility Study of the Muskowekwan Potash Project,
South-Eastern Saskatchewan, Canada with an effective date of 24 May 2017 (the “technical report”).
I am a member of the Association of Professional Engineers and Geologists of Saskatchewan (APEGS)
member number 9335. I graduated from the University of Saskatchewan, College of Engineering with a
B.Sc. in 1991 and M.Sc. in 2000.
I have practiced my profession for 26 years. I have been directly involved in potash projects in
Saskatchewan for 20 years including the Rocanville West project as Engineering Manager and the K+S
Potash Canada Legacy solution mine project as Technical Director for Amec Foster Wheeler. I have
experience in all aspects of new solution potash mine development including infrastructure, process plant,
wellfield pipelines and wellpads, process and groundwater ponds, and tailings management.
As a result of my experience and qualifications, I am a Qualified Person as defined in National Instrument
43–101 Standards of Disclosure for Mineral Projects (NI 43–101) for those sections of the technical report
that I am responsible for preparing.
I visited the Muskowekwan property on April 6, 2017.
I am responsible for sections 1, 2, 3, 18, 20, 21.1, 25 and 26 of the technical report.
I am independent of Encanto Potash Corp. as independence is described by Section 1.5 of NI 43–101.
I have had no previous involvement with the Muskowekwan property.
I have read NI 43–101 and the sections of the technical report for which I am responsible have been
prepared in compliance with that Instrument. As of the effective date of the technical report, to the best of
my knowledge, information and belief, the sections of the technical report for which I am responsible
contain all scientific and technical information that is required to be disclosed to make those sections of
the technical report not misleading.
Dated: 27 July 2017
“Signed and sealed”
David M. Myers, P. Eng.

Amec Foster Wheeler Mining and Metals 301-121 Research Drive, Saskatoon, SK Canada, S7N 1Ks
Tel 306-477-1155 Fax 306-477-1161 www.amecfw.com
CERTIFICATE OF QUALIFIED PERSON
I, Paul M. O’Hara, P.Eng., am employed as Manager, Process with Amec Foster Wheeler.
This certificate applies to the technical report titled NI 43-101 Technical Report on a Preliminary
Economic Assessment and Preliminary Feasibility Study of the Muskowekwan Potash Project,
South-Eastern Saskatchewan, Canada dated 24 May 2017 (the “technical report”).
I am a member of Association of Professional Engineers and Geologists of Saskatchewan (APEGS)
member number 11687. I graduated from the University of British Columbia, with a Bachelor of Science
degree in Mining and Mineral Process Engineering in 1986
I have practiced my profession for 31 years. I have been directly involved in the operation of copper, gold,
and potash processing plants in Canada. I have been involved in process design for gold and potash
process plants in Canada, England, Jordan and the Republic of Congo. As a result of my experience and
qualifications, I am a Qualified Person for those portions of the technical report that I am responsible for,
as that term is as defined in National Instrument 43–101 Standards of Disclosure for Mineral Projects (NI
43–101).
As a result of my experience and qualifications, I am a Qualified Person as defined in National Instrument
43–101 Standards of Disclosure for Mineral Projects (NI 43–101).
I have not visited the Muskowekwan property.
I am responsible for sections 1.14, 1.18, 1.19, 1.22, 13, 17, 19, 21, 22, 24.22.3.3, 25.4.2, 25.2.8, 25.2.11,
25.2.12 and 25.2.13, of the technical report.
I am independent of Encanto Potash Corp. as independence is described by Section 1.5 of NI 43–101.
I have had no previous involvement with the Muskowekwan property.
I have read NI 43–101 and the sections of the technical report for which I am responsible have been
prepared in compliance with that Instrument. As of the effective date of the technical report, to the best of
my knowledge, information and belief, the sections of the technical report for which I am responsible
contain all scientific and technical information that is required to be disclosed to make those sections of
the technical report not misleading.
Dated: 27 July 2017
“Signed and sealed”
Paul M. O’Hara, P.Eng.

respec.com
I, Tabetha A. Stirrett, P.Geo., as a coauthor of the Technical Report titled NI 43-101 Technical Report on a Preliminary Economic Assessment and Preliminary Feasibility Study of the Muskowekwan Potash Project, South-Eastern Saskatchewan, Canada, Effective Date: May 24, 2017 (the Technical Report) do hereby certify
that:
/ I am a consulting geologist of North Rim Exploration Ltd, a wholly owned subsidiary of RESPEC, with
an office located at 290A-2600 8th Street East, Saskatoon, Saskatchewan, Canada S7H 0V7. I am a
professional geologist and have been practicing in this capacity since May 1997. I am a graduate of the
University of Saskatchewan and earned a degree in geology in 1997.
/ I am a member in good standing of the Association of Professional Engineers and Geoscientists of
Saskatchewan (Member #10699).
/ As a consulting geologist, I have been involved with potash, coal, oil and gas, and mineral exploration
since 1997. These tasks have included the following:
o Planned and supervised potash, coal and gold drillhole programs
o Logged and interpreted potash, coal and gold mineral cores
o Supervised the preparation of technical reports
o Conducted due diligence reviews on potash properties in Australia, Arizona, North Dakota,
Utah (USA), Spain, Thailand and Saskatchewan (Canada)
o Completed and reviewed potash mineral resource estimations on multiple projects
o Acquired, reviewed, and interpreted geophysical wireline logs.
/ As a result of my experience and qualifications, I am a Qualified Person as defined in National
Instrument 43-101 for those sections of the Technical Report that I am responsible for preparing.
/ I am responsible for 5, 6, 7, 8, 9, 10, 11, 12, 14 and, 23 and co-authoring of Sections 24, 25 and 26 of
the Technical Report.
/ My most recent personal inspection of the Property was October 25, 2010 for one day.
/ I have had prior involvement in preparing supervising drilling and sampling programs and preparing
Mineral Resource estimates with the Property that is the subject of the Technical Report.
/ I have read National Instrument 43-101, and the parts of the Technical Report which I am responsible
for and have been prepared in compliance with that Instrument.
/ As of the date of this certificate, to the best of my knowledge, information and belief, the parts of the
Technical Report that I am responsible for contains all scientific and technical information that is required to be
disclosed to make the Technical Report not misleading.
Signed and dated this 27th day of July, 2017 at Saskatoon, Saskatchewan, Canada.
“Original document dated, signed and sealed” Tabetha Stirrett, P.Geo.
Consultant
North Rim Exploration Ltd.

Agapito Associates, Inc. 1536 Cole Blvd., Suite 220
Lakewood, Colorado 80401 303-271-3750
www.agapito.com
CERTIFICATE OF QUALIFIED PERSON1
I, Dr. Douglas F. Hambley, P.E., P.Eng., P.G., am employed as a Senior Associate of Agapito Associates,
Inc. at its office located at 1536 Cole Boulevard, Suite 220 in Lakewood, Colorado, USA.
This certificate applies to the technical report titled NI 43-101 Technical Report on a Preliminary
Economic Assessment and Preliminary Feasibility Study of the Muskowekwan Potash Project,
South-Eastern Saskatchewan, Canada with an effective date of 24 May 2017 (the “Technical Report”).
I am a member in good standing of the Association of Professional Engineers and Geoscientists of Saskatchewan, being registered as a Professional Engineer (No. 16124) since January 2009 and of Professional Engineers Ontario, being registered as a Professional Engineer (No. 18026013) since July 1975. I am also licensed as a Professional Engineer in the states of Colorado, Illinois, Michigan, Nebraska, Ohio, Pennsylvania and Wisconsin and as a Professional Geologist in Illinois and Indiana. I served on the Board of Licensing for Professional Geologists of Illinois during its initial four years (1996 to 2000). I am a Life Member of the Canadian Institute of Mining, Metallurgy, and Petroleum (CIM) and a Registered Member of the Society for Mining, Metallurgy, and Exploration (SME). I am a member of the Potash Subcommittee of the CIM Committee on Mineral Resources and Mineral Reserves, the SME Resources and Reserves Committee and the SME Registered Member Admissions Committee. I graduated from the Faculty of Applied Science at Queen’s University at Kingston, Ontario, and earned a
Bachelor of Science with Honours degree in Mining Engineering in May 1972. I earned a Doctor of
Philosophy in Earth Sciences from the University of Waterloo in May 1991. My PhD thesis concerned the
prediction of creep around mined openings in salt and potash.
I have practiced my profession as a mining engineer and geologist for more than 40 years. As a consulting mining engineer and geologist since May 1980, I have been involved from 1984 to 1991 and from 2007 to present with evaluation of resources and reserves and design of mines and other underground facilities in salt and potash in Louisiana, Texas, New Mexico, New Brunswick, Michigan, Ontario, Saskatchewan, Manitoba, Colorado, Arizona, Brazil, Russia, Ethiopia and the Congo. As a result of my experience and qualifications, for those sections of the Technical Report that I am
responsible for preparing, I am a Qualified Person as that term is defined in National Instrument 43–101
Standards of Disclosure for Mineral Projects (NI 43–101).
I have not visited the Muskowekwan Potash Project site, otherwise known as Muskowekwan Indian
Reserve No. 85.
I am solely responsible for Sections 15 and 16 and jointly responsible for Sections 1, 2, 3, 21, 22, 24, 25,
26, and 27 of the technical report.
I am independent of Encanto Potash Corporation and the Muskowekwan First Nations (MFN) as
independence is described by Section 1.5 of NI 43–101.

Agapito Associates, Inc. 1536 Cole Blvd., Suite 220
Lakewood, Colorado 80401 303-271-3750
www.agapito.com
I have been involved with the Muskowekwan Potash Project on the following third-party technical reports:
Stirrett, T. A., J. Brebner and D, F. Hambley, 2012, Technical Summary Report, Encanto Potash Corp., 2012 Potash Resource Assessment for the Muskowekwan First Nations Home Reserve Project, South Eastern Saskatchewan, Canada, prepared for Encanto Potash Corporation, May 9, 2012 ; and
Stirrett, T. A., M. P. Hardy, D, F. Hambley, B. Yu, and J. Brebner, 2013, Technical Report Summarizing The Preliminary Feasibility Study For The Muskowekwan First Nations Home Reserve Project In South Eastern Saskatchewan, Canada prepared for Encanto Potash Corporation, February 28, 2013.
I have read NI 43–101 and the sections of the technical report for which I am responsible have been
prepared in compliance with that Instrument.
As of the effective date of the technical report, to the best of my knowledge, information and belief, the
sections of the technical report for which I am responsible contain all scientific and technical information
that is required to be disclosed to make those sections of the technical report not misleading.
Dated: 27 July 2017
“Signed and sealed”
Douglas F. Hambley, Ph.D., P.E. (Colorado), P.Eng. (Saskatchewan), P.G. (Illinois)

1350 Sherbrooke Street West, Suite 600, Montreal, Quebec, H3G 1J1 514-286-0004
CERTIFICATE OF QUALIFIED PERSON
I, James Brebner, P.Eng., am employed as a Consulting Engineer with Novopro Projects Inc.
This certificate applies to the technical report titled NI 43-101 Technical Report on a Preliminary
Economic Assessment and Preliminary Feasibility Study of the Muskowekwan Potash Project,
South-Eastern Saskatchewan, Canada with an effective date of 24 May 2017 (the “technical report”).
I am a professional engineer of the Order of Professional Engineers of Quebec (OIQ), license #41110. I
graduated in 1983 from the University of New Brunswick, Fredericton, New Brunswick in Mechanical
Engineering.
I have practiced my profession for 34 years. Since 2004 I have been working primarily in Potash and
similar industries for the design of processes and the execution of Feasibility Studies for both Muriate of
Potash and Sulfate of Potash using conventional mining, solution mining or shallow surface trenches as a
method of recovery.
As a result of my experience and qualifications, I am a Qualified Person as that term is defined in National
Instrument 43–101 Standards of Disclosure for Mineral Projects (NI 43–101).
I visited the Encanto Potash property on March 28th, 2012.
I am responsible for sections 24.17 to 24.21, 25.3.3 and 25.3.4, co-authored 26.3 of the technical report.
I am independent of Encanto Potash Corp, as independence is described by Section 1.5 of NI 43–101.
I have previously been involved with the Encanto Potash project from 2012 until 2013 for the execution of
the 2013 Prefeasibility Study (PFS).
I have read NI 43–101 and the sections of the technical report for which I am responsible, and they have
been prepared in compliance with that Instrument.
As of the effective date of the technical report, to the best of my knowledge, information and belief, the
sections of the technical report for which I am responsible contain all scientific and technical information
that is required to be disclosed to make those sections of the technical report not misleading.
Dated: 27 July 2017
“Signed and sealed”
James Brebner, P.Eng. Vice President Novopro Projects Inc