nia richards - -orca
TRANSCRIPT

The Catalytic Decomposition of Nitrous Oxide
Thesis submitted in accordance with the requirement of Cardiff University for
the degree of Doctor of Philosophy
Nia Richards
Graham J. Hutchings
Stanislaw E. Golunski
School of Chemistry
Cardiff University
2015 - 2019


i
Appendix 1 – Statements and declarations signed by the candidate and included
in the thesis
STATEMENT 1
This thesis is being submitted in partial fulfilment of the requirements for the
degree of PhD
Signed ……………………………………… (candidate) Date ………………….…………….………
STATEMENT 2
This work has not been submitted in substance for any other degree or award at
this or any other university or place of learning, nor is it being submitted
concurrently for any other degree or award (outside of any formal collaboration
agreement between the university and a partner organisation).
Signed ……………………………………… (candidate) Date ………………….…………….………
STATEMENT 3
I hereby give consent for my thesis, if accepted, to be available online in the
University’s Open Access repository (or, where approved to be available in the
University’s library and for inter-library loan), and for the title and summary to be
made available to outside organisations, subject to the expiry of a University-
approved bar on access if applicable.
Signed ……………………………………… (candidate) Date ………………….…………….………
DECLARATION
This thesis is the result of my own independent work, except where otherwise
stated, and the views expressed are my own. Other sources are acknowledged by
explicit references. The thesis has not been edited by a third party beyond what is
permitted by Cardiff University’s Use of Third Party Editors by Research Degree
Students Procedure.
Signed ……………………………………… (candidate) Date ………………….…………….………
Word Count ………………………………
(Excluding summary, acknowledgments, declarations, contents pages, appendices,
tables, diagrams and figures, references, bibliography, footnotes and endnotes)

ii
Acknowledgements
Firstly I would like to thank my supervisors Graham Hutchings and Stan Golunski for
giving me an opportunity to study a PhD and for their supervision and guidance
throughout the entirety of my PhD. Secondly I would like to thank the rest of the
“After the GoldRush” team, Nick Dummer, Ewa Nowicka, James Carter, Sam
Pattisson and Rebecca Engel, whose day to day supervision was instrumental in
keeping me focussed and on the path to completion, even when the end was
nowhere near in sight.
There are a lot of people who have contributed greatly to this thesis, some of who
are Dave Morgan whose expertise with XPS was greatly received, Qian He whose
imaging knowledge and skills are way beyond me, and Greg Shaw forever
coolheaded when what seemed like impending doom struck in the lab. Following
on from that the entire workshop team, Steve, Alun, Lee and Julian, just Thank you!
I have thoroughly enjoyed my PhD, and that is mainly due to the people I have
worked with along the way. Thank you to Luke, Parag, Meg, Eoin and Simon for
putting up with me from day one. It wouldn’t have been the same without you all.
To everyone else in the office, thank you for making it feel like a second home,
where no question was too stupid.
I would like to thank my family, they have no idea what I’ve done for the last three
years other than ‘catalysts’ and go on holiday (apparently), but have supported me
the whole way. Finally, to Ross, the biggest thank you for listening to me and
helping me through the tough times.

iii
Abstract
N2O is an extremely potent greenhouse gas that has been shown to have
devastating effects on the atmosphere. There are many natural and anthropogenic
sources of N2O emissions, such as oceans, atmospheric chemical reactions,
industrial chemical processes, by-product from fuel combustion, and contributions
from the agricultural sector. Therefore a catalyst that converts N2O into N2 and O2
at low temperatures is highly desirable. Throughout this thesis the common aim is
to produce a catalyst that can decompose N2O at temperatures lower than 300 °C.
Three different classes of catalysts were investigated in this thesis, the first is a Fe-
ZSM-5 catalyst. The work focusses on the effect of different Fe species in Fe-ZSM-5
for the decomposition of N2O in the presence and absence of a reductant, propane.
The effect of Si:Al ratio and Fe weight loading was initially investigated before
focussing on a single weight loading and the effects of acid washing on catalyst
activity and iron speciation.
The second class of catalysts were based on Pd-Al2O3 with the focus being on the
importance of surface species and particle size of Pd for the decomposition of N2O.
The effect of removal of surface species such as water and chloride ions were
investigated by different catalyst pre-treatments and support pre-treatments.
Through pre-treatment of the catalyst support prior to metal deposition, catalytic
activity significantly increased, resulting in a decrease of the T100 by 150 °C to 400 °C.
The third class of catalysts studied were a range of perovskite structured materials.
Most notably studying how the surface area, phase purity and oxygen species
present effected the catalytic activity. The factors were investigated by changing
the ratio of elements in the A and B sites, which lead to increased perovskite
purities requiring lower calcination temperatures leading to higher surface areas.
The ratios that produced the highest phase purity were prepared by two alternative
preparation method to the original citric acid preparation, supercritical anti-solvent
preparation and oxalic acid preparation.

iv
Publication List:
Investigating the Influence of Fe Speciation on N2O Decomposition Over Fe–ZSM-5
Catalysts. N. Richards, E. Nowicka, J. H. Carter, D. J. Morgan, N. F. Dummer,
S. Golunski and G. J. Hutchings, Top. Catal., 2018, 61, 1983–1992.
Submitted: Structure-sensitivity of alumina supported palladium catalysts for N2O
decomposition. N. Richards, J. H. Carter, E. Nowicka, L. A. Parker, S.
Pattisson, Q. He, N. F. Dummer, S. Golunski and G. J. Hutchings. Applied Catalysis B:
Environmental.

v
Abbreviations and Units
% Percent
°C Degrees Celsius
Å Angstrom (10 -10 metres)
a.u. Arbitrary units
AW Acid Washing
BET Brunauer, Emmet and Teller
cm Centimetre
CVI Catalysts prepared by Chemical Vapour Impregnation
D Support dried before catalyst preparation
DRIFTS Diffuse Reflectance Infrared Fourier Transform Spectroscopy
eV Electron Volts
FID Flame ionisation detector
g Gram
GC Gas Chromatography
GHSV Gas hourly space velocity
h Hours
HAADF-STEM High Angle Annular Dark-Field Scanning Transmission Electron Microscopy
ICP-OES Inductively Coupled Plasma Optical Emission Spectroscopy
IR InfraRed
M Molar
MAS-NMR Magic Angle Spin Nuclear Magnetic Resonance
MFC Mass Flow Controllers
mg Milligram (10 -3 g)
min Minutes
mL Millilitre
mol Moles
MP-AES Microwave Plasma Atomic Emission Spectroscopy
MSI Metal support interaction
nm Nanometre (10 -9 metres)
N2O Nitrous Oxide
PZC Point of Zero Charge
SAS Supercritical Anti-Solvent Preparation
SC Support calcined before catalyst preparation
vi
SEM Scanning electron microscopy
Si/Al Molar ratio of SiO2 to Al2O3 in a zeolite
SMSI Strong metal support interaction
SS Stainless Steel
TCD Thermal conductivity detector
TEM Transmission electron microscopy
Temp Temperature
TGA Thermogravimetric analysis
TOF Turnover frequency
TPR Temperature programmed reduction
UV/Vis Ultraviolet- Visible spectroscopy
v/v% Volume by volume %
wt. % Weight percent
XPS X-ray photoelectron spectroscopy
XRD X-ray diffraction
ZSM-5 Zeolite Socony Mobil–5
vii
Table of Contents
1 Introduction ...................................................................................................... 1
1.1 Introduction .............................................................................................. 1
1.2 Ozone Depletion and Global Warming ..................................................... 6
1.3 N2O and the environment ......................................................................... 7
1.4 N2O Decomposition ................................................................................. 13
1.4.1 Mechanism ...................................................................................... 13
1.4.2 N2O decomposition rate limiting step and the effect of adding a
reductant to the gas feed. .............................................................................. 13
1.5 Catalysts for N2O decomposition ............................................................ 14
1.5.1 Iron Zeolites .................................................................................... 14
1.5.2 Pd-γAl2O3 Catalysts .......................................................................... 19
1.5.3 Perovskites ...................................................................................... 20
1.6 Project outline ......................................................................................... 23
1.7 References .............................................................................................. 25
2 Experimental ................................................................................................... 37
2.1 List of Chemicals...................................................................................... 37
2.2 Catalyst Preparation................................................................................ 38
2.2.1 Wet impregnation ........................................................................... 38
2.2.2 Support calcination before catalyst preparation ............................ 38
2.2.3 Hydrochloric acid Modified Impregnation Preparation .................. 39
2.2.4 Chemical Vapour Impregnation (CVI) ............................................. 39
2.2.5 Acid washing ................................................................................... 40
2.2.6 Citric Acid Preparation .................................................................... 40
2.2.7 Oxalic Acid Preparation ................................................................... 41

viii
2.2.8 Supercritical Anti-Solvent (SAS) Preparation, equipment set-up,
conditions and method ................................................................................... 41
2.3 Characterisation Techniques .................................................................. 43
2.3.1 Powder X-ray Diffraction (XRD) ....................................................... 43
2.3.2 In-situ X-ray Diffraction (XRD) ......................................................... 45
2.3.3 Raman Spectroscopy ....................................................................... 46
2.3.4 Thermogravimetric Analysis (TGA) ................................................. 47
2.3.5 Microwave Plasma Atomic Emission Spectroscopy (MP-AES) ........ 47
2.3.6 Inductively Coupled Plasma – Optical Emission Spectroscopy (ICP-
OES) 48
2.3.7 Temperature Programmed Reduction (TPR) .................................. 48
2.3.8 CO Chemisorption ........................................................................... 49
2.3.9 Oxygen Temperature Programmed Desorption (O2 TPD) ............... 51
2.3.10 Brunauer Emmett Teller surface area determination (BET) ........... 52
2.3.11 X-Ray Photoelectron Spectroscopy (XPS) ....................................... 54
2.3.12 Solid State magic angle spin nuclear magnetic resonance (MAS-
NMR) 55
2.3.13 Diffuse Reflectance UV/Vis Spectroscopy (UV/Vis) ........................ 56
2.3.14 Electron Microscope Techniques .................................................... 57
2.3.15 Point of Zero Charge (PZC) .............................................................. 59
2.4 Reactor Experimental.............................................................................. 62
2.4.1 Reactor set up and catalyst testing ................................................. 62
2.4.2 Product analysis: ............................................................................. 64
2.5 References .............................................................................................. 68
3 Identifying the active Fe species for N2O decomposition in Fe-ZSM-5 catalysts
71
3.1 Abstract ................................................................................................... 71
3.2 Keywords ................................................................................................. 72

ix
3.3 Introduction ............................................................................................ 72
3.4 Effect of Si:Al ratio and Fe loading .......................................................... 73
3.5 Acid Washing Fe-ZSM-5 catalysts ........................................................... 78
3.6 Conclusions ............................................................................................. 90
3.7 Future work ............................................................................................. 91
3.8 Comments ............................................................................................... 91
3.9 References .............................................................................................. 92
4 The effect of particle size on Pd-Al2O3 catalysts for N2O decomposition. ...... 97
4.1 Abstract ................................................................................................... 97
4.2 Keywords ................................................................................................. 98
4.3 Introduction ............................................................................................ 98
4.4 Effect of reaction cycle on catalytic activity............................................ 99
4.5 Effect of support calcination on catalytic activity. ................................ 105
4.6 How the control of particle size by modified impregnation catalyst
preparation technique effects catalytic activity ............................................... 115
4.7 Conclusions ........................................................................................... 121
4.8 Future Work .......................................................................................... 122
4.9 References ............................................................................................ 122
5 Effect of lattice oxygen species and surface area of Perovskites on N2O
decomposition. ..................................................................................................... 126
5.1 Abstract ................................................................................................. 126
5.2 Introduction .......................................................................................... 127
5.3 Preparation of perovskite catalysts by citric acid ................................. 128
5.4 Increased purity perovskite catalysts prepared by citric acid .............. 138
5.5 Increased purity and surface area perovskite catalysts prepared by
supercritical antisolvent preparation ............................................................... 147
5.6 Increased purity perovskite catalysts prepared by oxalic acid precipitation
method .............................................................................................................. 154

x
5.7 Conclusions ........................................................................................... 167
5.8 Future Work .......................................................................................... 168
5.9 References ............................................................................................ 169
6 Conclusions and Future Work ....................................................................... 174
6.1 N2O and the environment ..................................................................... 174
6.2 Fe-ZSM-5 Catalysts ................................................................................ 174
6.2.1 Conclusions ................................................................................... 174
6.2.2 Future Work .................................................................................. 176
6.3 Pd-Al2O3 Catalysts ................................................................................. 176
6.3.1 Conclusions ................................................................................... 176
6.3.2 Future Work .................................................................................. 177
6.4 Perovskites ............................................................................................ 179
6.4.1 Conclusions ................................................................................... 179
6.4.2 Future Work .................................................................................. 180
6.5 Final Comments and Comparisons ....................................................... 180
6.6 References ............................................................................................ 181
Chapter 1 Introduction
1
1 Introduction
1.1 Introduction
A catalyst is described by Bond et al. as a substance which increases the rate at
which a chemical reaction approaches equilibrium, without being consumed in the
process. 1 When a catalyst is used in a reaction it is termed catalysis. The first noted
use of catalysts in literature was by Berzelius in 1836 who noted the effect of trace
substances on the rates of reactions. As defined by IUPAC, the catalyst is both a
reactant and a product of the reaction. 2 The word catalysis comes from two Greek
words, cata- meaning down and lyesin meaning to split or break. Catalysis or
catalyst is commonly used in the popular press, but usually with the meaning to
‘accelerate’ usually referring to a sports team, this is the incorrect definition of the
term catalysis and should not be thought of when using the term.
Catalysts do not change the thermodynamic equilibrium; they enable the rate of a
reaction to be increased. Consequently, an increase in the rate coefficient is
observed, whilst the Gibbs free energy remains the same. The laws of
thermodynamics limit the change of the equilibrium position. Therefore, the initial
and final states must remain unchanged. This allows the catalyst to provide a
different pathway through which the reaction can proceed, of which the
intermediate stages are different. When a catalyst is used there are usually a
number of catalysed reaction intermediates, but the highest activation barrier of
these states is still lower than that of the un-catalysed reaction. Therefore, catalysts
offer an energetically favourable pathway, distinct to that of the un-catalysed
reaction.1
There are three important characteristics of an effective catalyst: catalytic activity,
product selectivity and stability. Catalytic activity is the level at which the reaction
is promoted by the catalyst, i.e. the proficiency of the catalyst. This can be
demonstrated by an increase in conversion of the starting reactant at a consistent
temperature. The choice of catalyst can have a demonstrable influence in the
formation of different final products in reactions with the same initial reagents.

Chapter 1 Introduction
2
Therefore, the ratio of these final products is termed selectivity. A catalyst that
produces desirable products is termed a selective catalyst, a catalyst that produces
undesirable products is termed an unselective catalyst. Finally, the stability of the
catalyst relates to the length of time over which the catalyst is active for. The longer
the time in which the catalyst is active without any change in activity, the more
stable the catalyst. If a decrease in activity is noted after a short period of time, this
is an unstable catalyst and has gone through a process of deactivation. Deactivation
can occur through chemical, mechanical or thermal processes. Examples of
chemically induced deactivation are described by “poisoning” through the
chemisorption of species on the active site, or by “coking”, which is the deposition
of often strongly adsorbed carbonaceous material. When heat is applied to a
catalyst, the metal species present can agglomerate, to form larger metal
nanoparticles. The increase in particle size leads to a decrease in metal surface area
available for reactions, this process is known as sintering. In some systems
mechanical processes such as attrition or crushing lead to the loss of catalytic
material, due to abrasion leading to a decreased in surface area. For example, in a
FCC fluidised bed, attrition of the catalyst leads to a smoothed catalyst, and
decreased surface area; 3,4 However, in some cases attrition leads to the formation
of smaller particles and an increased surface area, but can lead to blockages as the
finer powder blocks pores and channels.
There are two classes of catalysts: homogeneous and heterogeneous. 5
Homogenous catalysts are in the same state as the reactants, therefore, if the
reactants are liquid phase the catalyst will also be in the liquid phase.
Heterogeneous catalysts are in a different phase to the reactants, for example a
solid catalyst used in a gas phase reaction. In these cases, the catalyst is easily
recoverable after a reaction has taken place. One of the first industrial uses of a
heterogeneous catalyst was in the Haber process, which produces ammonia from
nitrogen and hydrogen. This was implemented in Germany just before the First
World War as a way of securing the supply of fertilizer that had previously been
imported from South America (along with speculation that ammonia was produced
for explosives). The application of this technology is now used worldwide with little
change to the original Fe catalyst. A final class of catalyst that will not be discussed
further than this mention is enzymes; these do not fit into either of the classes
Chapter 1 Introduction
3
above and are biocatalysts. 6 In this thesis all reactions are heterogeneous with gas
phase reactants and a solid catalyst.
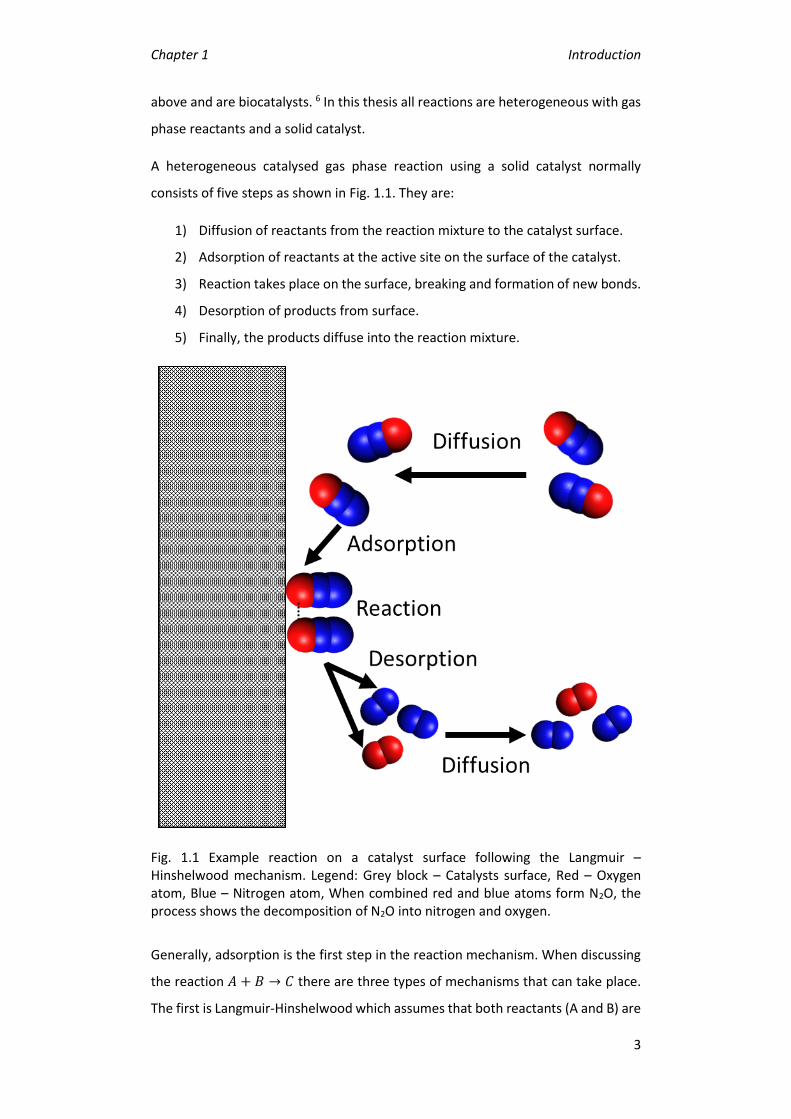
A heterogeneous catalysed gas phase reaction using a solid catalyst normally
consists of five steps as shown in Fig. 1.1. They are:
1) Diffusion of reactants from the reaction mixture to the catalyst surface.
2) Adsorption of reactants at the active site on the surface of the catalyst.
3) Reaction takes place on the surface, breaking and formation of new bonds.
4) Desorption of products from surface.
5) Finally, the products diffuse into the reaction mixture.
Fig. 1.1 Example reaction on a catalyst surface following the Langmuir –Hinshelwood mechanism. Legend: Grey block – Catalysts surface, Red – Oxygen atom, Blue – Nitrogen atom, When combined red and blue atoms form N2O, the process shows the decomposition of N2O into nitrogen and oxygen.
Generally, adsorption is the first step in the reaction mechanism. When discussing
the reaction 𝐴 + 𝐵 → 𝐶 there are three types of mechanisms that can take place.
The first is Langmuir-Hinshelwood which assumes that both reactants (A and B) are

Chapter 1 Introduction
4
adsorbed on to the surface of the catalyst before a reaction can take place.
Following the diagram in Fig. 1.2. the reactants adsorb on to the catalysts surface
(A+B), the adsorbed species then undergo surface migration, combine and desorb
as the product C. The second is the Eley-Ridel mechanism whereby only one of the
reactants are adsorbed onto the surface of the catalyst. As shown in Fig. 1.2, A is
adsorbed on the surface and reacts with reactant B that is in the reaction mixture
to produce C. The third mechanism is the Mars Van Krevelen, where the surface
contributes in the reaction. One of the reactants (A) forms a chemical bond with
the catalytic surface and forms a metal-reactant intermediate, such as N2O binding
via the oxygen terminal to fill an oxygen vacancy on a surface such as ceria, that
then reacts further with the other reactants (B) to form the product C. In
heterogeneous catalysis the most common mechanism is the Langmuir-
Hinshelwood as many reactants are activated by the adsorption on the catalytic
surface. 5
Fig. 1.2. Diagram showing the difference between Langmuir-Hinshelwood and Eley-Rideal mechanism. Legend: Grey block - catalyst surface, A + B – reactants, C – product.
As mentioned previously the catalyst is not consumed in the reaction, with the
active site constantly being regenerated and as such can be used in consecutive
cycles. Therefore, a small ratio of catalyst to reactant is required due to the
efficiency of the catalyst, this ratio can be measured as a turnover number (TON)
or turn over frequency (TOF). As shown in equation 1 below, TON is defined as the
number of moles of reactant that one mole of catalyst can convert before becoming
inactive, based on the calculation of the moles of product formed divided by the
moles of catalysts.

Chapter 1 Introduction
5
𝐸𝑞. 1 𝑇𝑢𝑟𝑛 𝑂𝑣𝑒𝑟 𝑁𝑢𝑚𝑏𝑒𝑟 (𝑇𝑂𝑁) = 𝑚𝑜𝑙𝑒𝑠 𝑜𝑓 𝑁2𝑂 𝑐𝑜𝑛𝑣𝑒𝑟𝑡𝑒𝑑
𝑡𝑜𝑡𝑎𝑙 𝑚𝑜𝑙𝑒𝑠 𝑜𝑓 𝑚𝑒𝑡𝑎𝑙
𝐸𝑞. 2 𝑇𝑢𝑟𝑛 𝑂𝑣𝑒𝑟 𝐹𝑟𝑒𝑞𝑢𝑒𝑛𝑐𝑦 (𝑇𝑂𝐹) = 𝑚𝑜𝑙𝑒𝑠 𝑜𝑓 𝑁2𝑂 𝑐𝑜𝑛𝑣𝑒𝑟𝑡𝑒𝑑 𝑝𝑒𝑟 𝑠𝑒𝑐𝑜𝑛𝑑
𝑡𝑜𝑡𝑎𝑙 𝑚𝑜𝑙𝑒𝑠 𝑜𝑓 𝑚𝑒𝑡𝑎𝑙
As shown in Eq.2, TOF is defined as the molecules reacting per active site in unit of
time. 7 This is typically calculated using the number of moles of reactant consumed
and either the active site weight or total metal loading converted to moles of active
metal. The active site is usually a metal species on the surface that contains
nanoparticles. Nano-particles are in the range 1-100 nm and are defined as being
between the bulk and molecular state of matter. It is not always possible to
quantitatively measure the active moles of metal, therefore throughout this thesis
total moles of metal is used to calculate TON or TOF. 8
There are many classes of catalysts, for example, metal oxides, zeolites, and
supported metal nano-particles. The most common materials used as catalysts are
metals and various oxides. Metals generally have a high surface energy and are
therefore very active for many catalytic reactions, and in some cases too active, for
example in selective oxidation reactions the catalyst can be too active, leading to
an over oxidised product, such as the conversion of propene to acrolein, with very
low selectivity to the desired product. 9 In the case of these overactive catalysts,
mixed metal oxides can be used instead, for example FeSbO4 is used to produce a
high selectivity to acrolein from propene. 10 To increase stability of high surface area
metal nanoparticles under reaction conditions, the nanoparticles are dispersed on
a support, usually a metal oxide such as alumina or silica (Al2O3 or SiO2). This helps
to limit sintering and maintain high catalytic activity. 1,6 An example of supported
metal nanoparticles on an oxide is the use of Au supported on NiO or Fe2O3 for the
low temperature oxidation of CO to CO2. 11 Until 1985, gold was thought of as being
an inactive metal, that was until Graham Hutchings predicted that nano-particles
of gold would be active for the hydro-chlorination of acetylene to produce vinyl
chloride.12 Vinyl chloride is one of the key reactants in the production of PVC, one
of the most commonly used plastics around the world. The chemistry described
here has been implemented at an industrial level, with plants in China now using a
gold catalyst instead of the problematic and toxic mercury catalyst that had been
used previously in the production of vinyl chloride. 13

Chapter 1 Introduction
6
Zeolites are another class of catalyst that are composed of two different oxides,
silica and alumina, amorphous materials that when prepared correctly form a
crystalline zeolite. When ca. 10 % alumina is dispersed through a silica matrix, an
increase in acidity of the solid is observed. The increase in acidity is due to the build-
up of the structure between SiO44- and AlO4
5- ions. The imbalance between the two
units requires a proton to balance the charge, leading to a highly acidic solid. The
interlinking of the two tetrahedra building blocks leads to the production of
relatively open three dimensional crystal structures, or cages, with high surface
areas. The cages can limit adsorbing molecules based on the size of the molecules
and whether they fit in the openings, this phenomenon is known as acting as a
molecular sieve.1 There are many everyday applications for zeolites such as in water
softeners, water filters, and pet litter. These applications make use of the crystalline
structure trapping un-wanted liquids, ions or odour molecules.14 Zeolites are also
commonly used in the petroleum industry, with zeolites the main constituent in
catalytic crackers used to crack large hydrocarbon molecules into petrol and
diesel.15–17
1.2 Ozone Depletion and Global Warming
Ozone depletion is the term used to describe the decrease in concentration of
ozone with in the earth’s stratosphere. The ozone layer helps to protect the earth
from the sun’s ultra violet (UV) radiation. Ozone is formed with in the earth’s
stratosphere by the following reactions:
ℎ𝑣 + 𝑂2 → 2 𝑂 (1)
𝑂 + 𝑂2 → 𝑂3 (2)
The UV radiation from the sun strikes an oxygen molecule in the stratosphere
causing the molecule to split, creating two oxygen atoms (step 1). These oxygen
atoms then combine with an oxygen molecule to form ozone (O3) and heat (step 2).
Due to the high concentration of oxygen molecules in the upper atmosphere, the
UV radiation is fully absorbed into the stratosphere. Ozone depletion occurs when
compounds containing nitrogen, hydrogen, bromine and chlorine react with the
highly unstable ozone molecules, normally producing oxygen and an oxygen
containing compound of the original molecule.18

Chapter 1 Introduction
7
Ozone depletion can occur in two ways, either by a thinning of the ozone layer,
where more ozone is destroyed than produced in the ozone cycle,19 or by the
formation of ozone holes.20,21 These holes occur over the north and south poles
when the temperature in the stratosphere cools rapidly to form polar stratospheric
clouds (PSC). In the stratosphere one of the many ozone depleting atoms, Cl, is in
unreactive forms such as HCl and ClNO3, however when PSC form the inactive Cl
species can react with the surface of the PSC forming very reactive Cl species that
react with ozone, creating ozone holes. In the areas on the earth under the ozone
holes, the intensity of UV radiation is far higher than in places where the ozone
layer is thicker.
A higher intensity of UV radiation hitting the earth’s surface produces many
problems. For example, the temperature in these areas increases and distributes
around the world leading to a phenomenon known as global warming. The
increased temperature in the polar regions leads to an increase in the speed at
which the polar icecaps are melting. As the polar icecaps melt, eventually into the
world’s oceans, this leads to an increase in sea levels. As sea levels rise communities
and life that live on shore close to sea level are threatened.22–26 A secondary effect
of the thinning of the ozone layer is an increase in people getting skin cancer, this
is due to an increased everyday exposure to UV radiation which has been shown to
cause skin cancer.27–30 Overall there have yet to be any positive effects of global
warming.
1.3 N2O and the environment
Nitrous Oxide (N2O) is a colourless non-flammable gas that was discovered in 1772
by Joseph Priestly. Priestly discovered N2O by dampening iron filaments with nitric
acid and heating to produce what he called “nitrous air diminished”.31 In 1794
Thomas Beddoes and James Watt first claimed that N2O could be used to treat
tuberculosis and other lung diseases. A clinical trial was started under the
supervision of Sir Humphry Davy, who noted that, when inhaled, an analgesic effect
was felt, indicating that the gas could be used for surgical operations and called N2O
“laughing gas”.32 The gas was not implemented for use in surgery for another 44
years, but it is still in use today in both dental practices and in hospitals as “gas and
air”.

Chapter 1 Introduction
8
N2O is a linear molecule that is isoelectronic to CO2. There are two resonance
structures of N2O, shown in Fig. 1.3, either with a negatively charged oxygen or a
negatively charged nitrogen but always a positively charged central nitrogen atom.
Fig. 1.3. Resonance structures of Nitrous Oxide.
Levels of N2O in the atmosphere have remained constant at around 270 ppb until
the early 1800s as shown in Fig. 1.4; this is noted as the pre-industrial era. For the
time period up to 2000 years ago, levels of N2O in the atmosphere can be deduced
by measuring the composition of air found in ice cores from Antarctica. For the
period up until 1977, Law Dome ice cores, East Antarctica, have been used. From
1997 to the present day, the National Oceanic and Atmospheric Administration’s
Earth system Research Laboratory (NOAA/ESRL) measure the current
concentration of N2O in the atmosphere at sites around the world such as Mauna
Loa, Hawaii.33–36 The onset of widespread industrialisation resulted in a dramatic
increase in atmospheric N2O, with levels rising to the current day level of 327 ppb.37
Furthermore, the level of atmospheric N2O has increased at the same rate since
around the 1980s year-on-year. Industrialisation and an increase in agriculture have
led to the increase in the levels of N2O in the atmosphere.
Fig. 1.4. Graph showing how the concentration of N2O in the atmosphere has changed in the last 2000 years.34,38–40

Chapter 1 Introduction
9
There are both natural and anthropogenic sources of N2O,41–43 with natural sources
contributing 62 % of the world emissions and anthropogenic sources contributing
to the remaining 38 %. Oceans, soils that are undergoing natural vegetation (micro
-organisms such as nitrifiers and denitrifiers produce N2O during the decomposition
of the nitrogen based fertilisers in soils, converting ammonium to nitrates)44, and
atmospheric chemical reactions are natural sources of N2O.45 However, natural
vegetation of soils is the largest natural contributor to N2O emissions. Emissions of
N2O are closely related to microbial production processes in soils, sediments and
water bodies.46
Examples of anthropogenic sources are sewage treatment, fuel and biomass
combustion, industrial chemical processes, and contributions from the agricultural
sector.41 Approximately 60 % of global anthropogenic emissions come from the
agricultural sector and the use of nitrogen based fertilisers.47 Adipic and nitric acid
are the main industrial processes that lead to the formation of N2O,48 adipic acid
production leads to around 80 % of the global industrial emission of N2O (10 % in
total).43,49 Dental surgeries and hospitals also use N2O for treatment of patients, in
the form of a sedative. These emissions are unregulated and uncontrolled.50
Another anthropogenic source of N2O is a by-product of the combustion of fuels in
cars. Here, three-way catalytic (TWC) converters are installed in all petrol cars
worldwide, and are used to abate nitrogen oxides such a nitric oxide and nitrogen
dioxide, carbon monoxide, and hydrocarbons. The levels of N2O emitted are
dependent on many factors such as the driving cycle, the age and composition of
the TWC, the temperature at which it is operating and the concentration of sulphur
in the fuel source which leads to catalyst deactivation.49,51–54

Chapter 1 Introduction
10
Fig. 1.5. Graphs showing the distribution of anthropogenic and natural sources of N2O. Figure reproduced from IPCC fourth assessment report: Climate change 2007, intergovernmental panel on climate change.41
As a result, it is extremely important to decompose N2O before it is released into
the atmosphere. Decomposition of N2O takes place through dissociation into O2
and N2 as shown below.55
2 𝑁2𝑂 → 2𝑁2 + 𝑂2 (Δ𝑟𝐻0(298) = −163 𝑘𝐽 𝑚𝑜𝑙−1) 56
The effect of nitrous oxide (N2O) on the atmosphere is far more devastating than
CO2 (global warming potential = 1) due to having a global warming potential of
roughly 300, as seen in Fig. 1.6, and a half-life of greater than 100 years.48,57,58 With
such a long lifetime, the effect of N2O on the atmosphere is seen for extended
periods of time.
Fig. 1.6. Graph showing the global warming potential of three well-known greenhouse gases, CO2, methane and N2O.59
Increasing levels of N2O leads to an increase in ozone depletion, which in turn leads
to global warming. As described previously, ozone depletion is the decrease in
levels of ozone from the stratosphere, which can either lead to a thinning of the
ozone layer or the formation of ozone holes. Presence of N2O in the stratosphere
enables ozone depletion through the following mechanism:60

Chapter 1 Introduction
11
𝑁2𝑂 + ℎ𝑣 → 𝑁2 + 𝑂∗ (3)
𝑁2𝑂 + 𝑂∗ → 2 𝑁𝑂 (4)
𝑁𝑂 + 𝑂3 → 𝑁𝑂2 + 𝑂2 (5)
𝑁𝑂2 + 𝑂∗ → 𝑁𝑂 + 𝑂2 (6)
In the first step N2O reacts with UV light to form radical oxygen species, which then
react with N2O in step two to form nitric oxide. Nitric oxide then reacts with ozone
to form nitrogen dioxide and oxygen, this is one of the ozone depletion steps. In
step 4 nitrogen dioxide reacts with ozone to form nitric oxide and oxygen, another
ozone depleting step. The formation of NO enables step 5 to happen again, which
in turn enables step 6 to happen. The constant cycling between steps 5 and 6,
shows how the effect on the ozone layer is so devastating. 60
There are many forms of legislation that cover carbon emissions around the globe;
however, most do not explicitly cover N2O emissions. One that does is the Climate
Change Act 2008 that was introduced by the UK government, with aims to reduce
the emissions of N2O to pre-1990 levels by 2050.61 This is in line with the Kyoto
protocol implemented worldwide in 1997 by the United Nations Framework
Convention on Climate Change (UNFCC), with aims to reduce emissions of multiple
greenhouse gases to pre-1990 levels by 2050 but with aims to do this in the first
period of the protocol (2008-2012).62 The Kyoto protocol is the world’s only legally
binding treaty to reduce greenhouse gas emissions. However, because many
emitters are not part of The Kyoto Agreement, only 18 % of the world’s total
emissions are covered by the protocol. Now in the second commitment period
(2013-2020), the European union countries have vowed to decrease their
greenhouse gas emissions to levels 20 % lower than pre-1990 levels, by following
guidelines set out in the 2020 climate and energy package.63
In December 2015, the Paris Agreement was created that strengthens the global
response to the threat of climate change by trying to cap a global temperature rise
to below 2 °C above pre-industrial levels and to try to limit the increase to + 1.5 °C.
This agreement requires all the parties to frequently report on their emissions and
implementation efforts, with a global stocktake every 5 years to keep track of
efforts. In January 2019, 184 out of 197 countries had joined the Paris Agreement,
making it a truly worldwide initiative.64

Chapter 1 Introduction
12
With one of the major anthropogenic sources of N2O being from vehicle emissions
(Fig. 1.5)41, it would be natural to expect there to be legislation surrounding the
emissions from mobile exhaust streams. This is not the case; the latest legislation,
Euro 6, does not mention N2O specifically, but instead particulate matter, NOx, CO
and hydrocarbons. With the focus of the legislation aiming more towards the
emission of air pollutants rather than the emission of greenhouse gases, with aims
to improve health rather than limit global warming.65
The reduction of greenhouse gas emissions lies hand-in-hand with the 12 principles
of green chemistry.66 Green chemistry or sustainable chemistry is the use of
chemistry that minimises the use or production of hazardous substances. The
twelve principles are as follows:
1. Prevent Waste
2. Atom Economy
3. Less Hazardous Synthesis
4. Design Benign Chemicals
5. Benign Solvents and Auxiliaries
6. Design for Energy Efficiency
7. Use of Renewable Feedstocks
8. Reduce Derivatives
9. Catalysis (vs. Stoichiometric)
10. Design for Degradation
11. Real-Time Analysis for Pollution Prevention
12. Inherently Benign Chemistry for Accident Prevention
The use of the 12 principles of green chemistry design will enable the reduction in
greenhouse gas emissions and allow control over the currently changing global
temperature. The key principles that will be utilised to do this are number 3. less
hazardous synthesis, 6. Design for energy efficiency, 7. Use of renewable
feedstocks, and real-time analysis for pollution prevention.

Chapter 1 Introduction
13
1.4 N2O Decomposition
1.4.1 Mechanism
The following mechanism is generally accepted for the catalytic decomposition of
N2O into N2and O2.56,67
𝑁2𝑂(𝑔𝑎𝑠) + ∗ → 𝑁2𝑂 ∗(𝑎𝑑𝑠) (7)
𝑁2𝑂 ∗(𝑎𝑑𝑠) → 𝑁2(𝑔𝑎𝑠) + 𝑂 ∗(𝑎𝑑𝑠) (8)
2 𝑂 ∗(𝑎𝑑𝑠) → 𝑂2(𝑔𝑎𝑠) + 2 ∗ (9)
𝑂 ∗(𝑎𝑑𝑠) + 𝑁2𝑂(𝑔𝑎𝑠) → 𝑂2(𝑔𝑎𝑠) + 𝑁2(𝑔𝑎𝑠) + ∗ (10)
* = active site
Initially, N2O binds via the oxygen atom to the active site (Eq.7), the second step
shows the breakdown of the N2O molecule into nitrogen and an absorbed oxygen
atom at the active site (Eq.8). Based on this mechanism the catalyst becomes
oxidised in the 2nd step and needs to be able to reduce the active site by removal
of oxygen to regenerate the active site for further reactions. The reduction can take
place via two routes: Eq. 9, by the Langmuir-Hinshelwood mechanism,68 or by Eq.
10, which follows the principles of Eley-Rideal mechanism.56 As described
previously the Eley-Rideal mechanism involves only one of the reactants being
absorbed onto the surface of the catalyst, in this case absorbed oxygen species,
which react with N2O to form oxygen, nitrogen and regenerate the active site.
Equation 8 takes place via the Langmuir-Hinshelwood mechanism, whereby both
the reactants are absorbed on to the surface of the catalyst; in this case, two bound
oxygen atoms come together to form molecular oxygen, regenerating two active
sites.
1.4.2 N2O decomposition rate limiting step and the effect of
adding a reductant to the gas feed.
During the decomposition of N2O, the rate limiting step is the recombination of
oxygen to form O2 (Eq. 13). This is because the oxygen atoms need to be within
close proximity of each other to be able to react to form an oxygen molecule. This

Chapter 1 Introduction
14
is unlikely to be the case, which leads to the blocking of the active site due to
oxidation. To combat the oxidation of active sites, a reductant can be added to the
gas feed to act as an oxygen scavenger. The presence of a reductant in the gas feed
has been shown to assist the abstraction of oxygen from the oxidised active site,
significantly increasing the observed rate of N2O decomposition at lower
temperatures, normally lowering the T50 by 150 °C. Propane,69–73 ethane, methane
and CO 73–78 have all been used as a reductant, however my work focuses on the
use of propane as a reductant, altering the reaction mechanism to the following:
𝑁2𝑂(𝑔𝑎𝑠) + ∗ → 𝑁2𝑂 ∗(𝑎𝑑𝑠) (11)
𝑁2𝑂 ∗(𝑎𝑑𝑠) → 𝑁2(𝑔𝑎𝑠) + 𝑂 ∗(𝑎𝑑𝑠) (12)
10 𝑂 ∗(𝑎𝑑𝑠) + 𝐶3𝐻8(𝑔𝑎𝑠) → 3 𝐶𝑂2(𝑔𝑎𝑠) + 4 𝐻2𝑂(𝑔𝑎𝑠) + 10 ∗ (13)
Eq.11 and 12 are the same as previously described but the addition of propane to
the gas feed allows one propane molecule to regenerate 10 oxidised active sites, as
described in Eq. 13. This is an ideal situation; if there is not enough oxidised active
sites present to produce CO2 then CO can also be formed, as follows:
7 𝑂 ∗(𝑎𝑑𝑠) + 𝐶3𝐻8(𝑔𝑎𝑠) → 3 𝐶𝑂(𝑔𝑎𝑠) + 4 𝐻2𝑂(𝑔𝑎𝑠) + 7 ∗ (14)
In this case, only 7 active sites are regenerated. As the reaction proceeds to higher
temperatures, it is more common to see CO form as more propane is converted
because there are less oxygen species present on the surface of the catalyst for
scavenging. This is expected as the gas feed the ratio of C to O is 3:1 in most reaction
conditions when propane is present in the feed, therefore a high conversion of
propane will always convert all the oxygen species present.
1.5 Catalysts for N2O decomposition
Over the last century there have been many classes of catalysts that have been used
for the decomposition of N2O. Prominent examples are iron zeolites, perovskites
and others such as spinels and vanadium catalysts and some are discussed herein.
1.5.1 Iron Zeolites
Zeolites are a class of crystalline, microporous solids that consist of silicon,
aluminium and oxygen. The elements come together to form frameworks in cage

Chapter 1 Introduction
15
like structures, where cations, or small molecules may be present inside the
channels. There are many different both naturally occurring and man-made zeolite
framework structures, which have different sized cages. The differing cage sizes
lead to the ability to trap and block different size molecules in the cavities, which
enables the zeolite to act as a molecular sieve. Based on this property, zeolites have
been used as adsorbents for industrial purification for many years.79
The zeolite framework consists of tetrahedrally coordinated Si and Al atoms that
are linked by shared oxygen atoms to form regular cavities with in the crystalline
structure. Small cations are present inside the channels to balance out the
negatively charged framework. This results in a three-dimensional microporous
crystalline structure, with channels and tunnels of differing dimensions as shown in
Fig. 1.7.80 There are nearly 50 different types of naturally occurring zeolites and
over 200 synthetic zeolites, such as chabazite and mordenite, all of which have
different physical and chemical properties. Different chemical composition, such as
the ratio of silicon to aluminium atoms, can result in these different properties such
as the pore size of the channels and the cation selectivity.81,82 The pore size of the
channel can range from approximately 3 to 8 Å, within the micropore range of less
than 2 nm.83 Every time that a new structure is thought to be produced, the
structure is submitted to the Structure Commission of the International Zeolite
Association (IZA-SC) to confirm whether the framework is unique.84 If the
framework is unique then the IZA-SC will assign a unique three letter code to the
framework. For example, MFI is used to signify the family of zeolites derived from
Zeolite Socony Mobil – five (ZSM-5), with MFI taken from the M for Mobil and FI
from five. Some of the most common commercially available zeolites are denoted
by their colloquial names; A, beta, Y and ZSM-5 (Fig. 1.7).

Chapter 1 Introduction
16
Fig. 1.7. Representative siliceous frameworks of (a) zeolite A; (b) zeolite Y; (c) Zeolite L; (d) ZSM-5.80
Naturally occurring zeolites are not commonly used in catalysis due to the impurity
of the phases present, along with varying chemical compositions between deposits
and sometimes even with in deposits, leading to irreproducible catalysis.85
Therefore, synthetically produced zeolites are favourable for catalysis. Zeolite X and
Y have been used on an industrial scale for the use in fluid catalytic cracking (FCC)
of large hydrocarbon molecules into petrol and diesel.15–17 The implementation of
zeolites as a catalyst in this reaction improved the yield of petrol significantly over
the previous amorphous silica-alumina catalysts due to the removal of any
impurities.
Zeolites can be doped with a wide variety of metals such as silver, cobalt, nickel and
iron to alter the catalytic activity. For example, silver can be added to a zeolite to
produce an antimicrobial material that can be applied to wounds to enable better
healing and limit infection.86 Cobalt doped zeolites have been used for Fischer-
Tropsch (FT) synthesis to produce hydrocarbons from syngas (CO and H2). Cobalt is
used as the metal in this reaction due to its low cost, high activity and selectivity to
liquid fuels.87
When aluminium cations are substituted into the zeolite framework a charge
imbalance is created, a cation is required to satisfy the Al tetrahedron, SiO44-
compared to AlO45-. Often this is a proton, which increases the Bronsted acidity of
the zeolite due to the proton acting as a Bronsted acid. 88 Other size limited cations
can also be present in the zeolite channels to balance the charge created on the Al
ion, such as, potassium, sodium and ammonium ions. 89

Chapter 1 Introduction
17
Iron zeolites have been commonly used for the decomposition of N2O,68 with H-
ZSM-5 frequently being used as a support.90–92 Both high and low weight loading
Fe-ZSM-5 catalysts have been reported in literature, Xie et al. reported 100 %
conversion at 450 °C using 7.46 wt. % Fe 73 while Wood and co-workers 93 reported
84 % conversion at 500 °C using an Fe-ZSM-5 catalyst with a loading of 0.57 wt. %.
Sobalik et al. showed that when using ferrierite (FER) a Si:Al ratio of 8.5
outperformed Si:Al 10.5 when the same Fe loading was used for N2O
decomposition.94 Rauscher et al. reported that low Si:Al ratios are more effective
for N2O decomposition catalysts.90 Iron doped zeolites (Fe-ZSM-5) (Si:Al = 11.4)
exhibited 95 % conversion of N2O at 500 °C in contrast to Fe-BEA (93) achieved just
20 % conversion of N2O at 575 °C.95 The work of both these groups show that the
Si:Al ratio of the zeolite is an important factor for activity of an N2O decomposition
catalyst.
Additionally, it has been shown that zeolites with different framework structures
can be used for the decomposition of N2O with ZSM-5 (MFI), beta (BEA) and
Ferrierite (FER) zeolites acting as supports for Fe.95–97 Jisa et al. showed that a low
loaded Fe-FER was the most active, achieving 85 % conversion at 450 °C.98 The Si:Al
ratio for the FER was the lowest (8.6) of all the zeolites tested, compared to BEA
(15.5) and MFI (13.4). This supports the earlier findings that a low Si:Al ratio is
necessary for high N2O conversion, due to the presence of active Fe species that
form on the Al moiety of the zeolite framework. Therefore, low Si:Al ratios can lead
to a higher concentration of active species.73
The rate limiting step of N2O decomposition is the recombination of deposited
oxygen to form O2. In the case of Fe-zeolites, the dissociation of N2O on the active
Fe species is facile and results in an oxidised Fe active site. The oxygen left on the
surface must recombine with another oxygen atom to form O2, which is slow.
Propane 69–73 ethane, methane and CO 73–78 have all been used as a reductant.
Fe-ZSM-5 can be prepared by various ion-exchange methods, including via wet 99–
102 or solid state,90,101,103 or sublimation 94,98,104–107 methodologies. Solid state
methods use solventless mechanical mixing, while wet ion exchange makes use of
solvents. Salts with low temperatures of evaporation can be used during a
sublimation technique, for example FeCl3 precursors. Generally, when this
technique is used, chlorine ions remain after sublimation. Therefore, a post

Chapter 1 Introduction
18
preparation washing step may be necessary to remove any remaining chlorine
species.108–110
When iron is deposited on zeolites it is possible to form four distinct Fe species as
shown in Fig. 1.8. These are framework Fe3+, isolated Fe3+ or Fe2+, Fe oxo-species
and FeOx species. Framework Fe3+ is formed by isomorphous substitution of Al or Si
ions, whereas isolated Fe2+/3+ species are anchored to the zeolite framework by
either Si-O-Fe or Al-O-Fe bridges or di-nuclear Fe-O-Fe species, either in the
framework or in the channels. Iron oxide (FeOx) can exist as both small
nanoparticles or bulk FeOx particles.73,110–112
Fig. 1.8. Visual representation of the Fe sites that can form after the introduction of Fe into ZSM-5 framework. Reproduced from Fig 1.14, Hammond 2011.113 Legend: Red - Oxygen, Yellow – Silicon, Pink – Aluminium, Blue – Iron.
Therefore, determination of the active species is challenging, with nano-particulate
iron 73,114 and extra-framework Fe 97,115,116 having been reported as the active site
for N2O decomposition. Extra framework Fe is considered the dominate active
species, due to the formation of α-Oxygen in the presence of N2O.117–123 α-Oxygen
(an oxygen vacancy) is formed by decomposing N2O over reversible redox α-Fe sites
that have the capacity to switch between Fe2+ and Fe3+ as shown in the mechanism
below.124,125
N2O + (Fe2+)α (Fe3+ - O·-)α + N2 126

Chapter 1 Introduction
19
Acid washing Fe-ZSM-5 catalysts have been shown to increase both the catalytic
activity and stability. This is due to the removal of spectator Fe species such as FeOx
nano-particulates and clusters. These species can be removed in relatively short
periods of time such as 10 mins; with extended periods of time, the amount of iron
removed was not found to increase.110 As zeolites are relatively stable to short acid
washing, it does not affect the pore channels and mesopores are not created. As
the acid conditions are relatively mild (10 vol.%), only a small quantity of surface Al
is removed.127 This stability indicates that only the Fe species present will be
effected by the acid washing and the zeolite will remain unchanged.128
Alternatively, steaming pre-treatments can be used to extract iron from the pores
and into the extra-framework sites; 129–133 however, as this technique has been
extensively studied this was not a focus of this work.
1.5.2 Pd-γAl2O3 Catalysts
Palladium/alumina (Pd-Al2O3) catalysts have not been extensively studied for the
decomposition of N2O 103,134–137; however, similar catalytic Pd-Al2O3 systems have
been demonstrated to exhibit high activity and stability in other applications.138–143
Pekridis et al. reported a T100 (i.e. the temperature to reach 100 % conversion) of
425 °C using a 2 wt. % Pd-Al2O3 catalyst prepared by wet-impregnation, for the
decomposition of N2O. The group also showed that the addition of propane to the
gas feed lowered the T100 to 400 °C.134 As described previously the rate limiting step
in the decomposition of N2O is typically the recombination of oxygen to form O2
and free the active site to adsorb an incoming N2O molecule.123,144–149 Therefore,
propane acts as reductant that can facilitate the abstraction of oxygen from the
oxidised active site, significantly increasing the observed rate of N2O decomposition
at lower temperatures.103,134 In the case of Pd-Al2O3 catalysts, addition of propane
69–73 ethane, methane and CO 73–78 have also been used as reductants. Christoforou
et al. reported that 72 % conversion was possible using 2 wt. % Pd-Al2O3 at 600 °C
and the addition of propane to the feed lowers this temperature by over 200 °C,
while still achieving 100 % N2O conversion.103 Doi et al. utilised a higher weight
loading of Pd (5 wt.%) with only 60 ppm N2O in the gas feed and showed that it was
possible to decompose this low concentration at 300 °C. However, air was used as
the balance gas during this reaction, and it has been shown in this case that the
addition of oxygen to the feed increases the activity.137 It is important to note that

Chapter 1 Introduction
20
in most cases the addition of oxygen to the gas feed limits the conversion of N2O,
as the oxygen present oxidises the active site of the catalyst.134,150,151
Tateishi et al. also demonstrated that a higher weight loading was suitable for the
decomposition of N2O with a commercial 5 wt.% Pd-Al2O3 catalyst achieving 100 %
conversion at 320 °C. However, when compared to the catalyst prepared by wet
impregnation in house by the group, the same loading catalyst required 500 °C to
achieve the same conversion under the same conditions.136 Pekridis et. al. prepared
a 2 wt. % Pd-Al2O3 catalyst that at 350 °C achieved 90 % N2O conversion when
propane is present in the gas feed.134
1.5.3 Perovskites
Perovskites are a well-known class of mineral structures with the chemical formula
ABO3. Calcium Titanate (CaTiO3) was the first mineral discovered with the ABO3
structure and was named a perovskite after the Russian Mineralogist Lev
Perovski.152 A perovskite forms a cubic structure, as shown in Fig. 1.9. The A cation
is typically larger than the B cation. The A site cation sits on the corners of the cubic
structure (12 fold coordination to oxygen atoms), whereas the B site atom typically
sits at the centre of the structure (6 fold coordination to oxygen atoms). Whilst the
oxygen species are located in face centered positions and binds to both cations
present in the structure. The A site cation is typically an ion with a large ionic radius
such as a rare earth element, La, whilst the B site cation is a transition metal
element such as Fe or Co that has a smaller ionic radius. The A site cation is
generally catalytically inactive but alters the oxidation state of the B site therefore
creating oxygen vacancies.153 The A sites are typically 2+/3+ cations, whereas, the
B sites are 3+/4+ cations. A second A site cation can be incorporated into the
structure, the difference in valence state between the cations can lead to further
oxygen vacancies as shown in Fig. 1.9, below, in orange. Because of the structural
flexibility of a perovskite, around 90 % of the natural metallic elements of the
periodic table could be incorporated into the structure.154

Chapter 1 Introduction
21
Fig. 1.9. Ideal ABO3 structure of perovskite oxide, the green dot represents the substitution of an A-site cation by an alternative cation, orange squares represent an oxygen vacancies.155
A perovskite consists of two or more simple oxides that have a high melting point,
therefore the preparation of a perovskite structure requires high temperature and
a long calcination time, which typically leads to low surface areas. Common
properties of a perovskite include high thermal stability for use under gas phase
reactions at high temperatures, or high hydrothermal stability for use under liquid
reaction at low temperatures. Perovskites are well known for their ease of
preparation, high thermal stability, low cost and good catalytic activity despite their
low surface area. For examples perovskite catalysts are commonly used in
photochemistry, electrochemistry, CHOx/NOx oxidation, TWC catalytic converters
and CO2 reduction.68,156–160
Surface area has been a very important driving force behind the design of different
preparation method to produce perovskite structures. Initially most preparation
methods produced perovskites with specific surface areas (SSA) of ca. 2 m2g-1. An
example solid-state chemistry preparation method that produces low surface area
perovskites is ball milling: single oxides are milled together to form a homogenous
oxide mixture before calcination at temperatures greater than 900 °C.161 The high
temperature required to form a phase pure perovskite results in a low SSA. Solution
chemistry preparation methods, such as sol-gel, spray drying and co-precipitation,
have been used to produce highly crystalline and phase pure materials at lower
temperatures between the range of 700 – 800 °C, resulting in surface areas of up
to 30 m2g-1, which is a vast improvement on the solid-state methods used
previously. An example of this is the citric acid combustion method, whereby
nitrate precursors were combined with citric acid, dissolved, dried and then

Chapter 1 Introduction
22
calcined at temperatures between 700 – 800 °C, for a shorter period of time.162–164
This preparation method produces a higher surface area material due to the use of
an organic complexing agent, which coordinates the metal ions, followed by the
combustion of the nitrate precursors and the organic complex to form small
homogenised metal oxide particles which are the precursors of perovskites.
Oxygen vacancies have been shown to previously influence the catalytic activity of
perovskites.165–168 The oxidation sate of the B site cation and the resulting oxygen
vacancy can be controlled by substitution of an external cation into the matrix. For
example, if a B site cation oxidation state is reduced from B4+ to B3+ an oxygen
vacancy can be formed, due to less oxygen atoms being required to balance the
charge of the cation. Alternatively, an oxygen vacancy can also be formed by the
substitution of an A3+ cation with that of an A2+ one in the ABO3 structure. The
control of the oxidation state of the B site cation and as a result the number of
oxygen vacancies is crucial as a lot of catalytic cycles depend on the redox
properties of the B site metal cation. Oxygen vacancies can provide the site at which
coordination of the reactant and subsequent activation can take place, owing to
the importance of their presence in the perovskite structure for catalytic activity.155
Perovskites have been reported as effective catalysts for the decomposition of N2O.
For example, Russo et al prepared a LaCoO3 perovskite by a solution combustion
synthesis method and reported 100 % conversion of 0.5 % N2O in He at 550 °C, with
a T50 of 455 °C.169 Ivanov and co-workers prepared a series of LaSrMnO3 catalysts,
investigating the effects of the ratio of La and Sr in the A site. The group found the
optimal ratio to be La0.75Sr0.25, with a T50 of 725 °C under conditions of 0.15 % N2O,
and a Gas Hourly Space Velocity (GHSV) of 30 800 h-1.170,171 The same group then
went on to study the effect of oxygen mobility based on the doping of La0.4Sr0.6FeO3
catalysts with LaSrFeO4 ferrite. Ivanov found that the La0.4Sr0.6FeO3 doped with ca.
10 wt. % LaSrFeO4 produced the most active catalyst, with a T50 of 815 °C under
conditions of 0.15 % N2O, and a GHSV of 30 800 h-1. This catalyst outperforms others
that were tested by Ivanov due to the increased oxygen surface exchange, which
was suggested to be due to the formation of intergrown boundaries between the
perovskite and layered-perovskite phases, which leads to the increased
incorporation of surface oxygen in to the lattice.172

Chapter 1 Introduction
23
Takita and co workers investigated the effect of multiple A and B site atoms and
ratios on the decomposition of N2O using a LaBaMnInO3 catalytic system. The group
concluded that the La0.7Ba0.3Mn0.8In0.2O3 ratios provided the most active catalyst for
the decomposition of N2O; decomposing 92 % at 500 °C, with a T50 at 443 °C under
conditions of 10 % N2O in He at 20 ml min-1 173; Kumar and co-workers reported a
similar T50 by preparing a Pr0.8Ba0.2MnO3 catalyst, initially by co-precipitation and
then impregnation. The group achieved 100 % conversion at 550 °C under
conditions of 0.5 % N2O, balance He and a GHSV of 7500 h-1.174 The catalyst
prepared by Kumar et al. are amongst the most active perovskites for N2O
decomposition reported in literature to date; a summary is provided in Table 1.1.
Table 1.1 The most relevant perovskite systems for N2O decomposition and the temperature required for 50 % conversion (T50).
Catalyst Conditions T50 (°C) Ref
LaCoO3 0.5 % N2O, Helium, WHSV =
120 000 mL g-1 h-1
445
(100 % at 550 °C)
169
Pr0.8Ba0.2MnO3 0.5 g, 0.5 % N2O, He
balance. GHSV = 7500 h-1
442
(100 % at 550 °C)
174
La0.7Ba0.3Mn0.8In0.2O3 10 % N2O in He, 20 ml min -1
W/F = 3.0 g s cm-3
443
(92 % at 500 °C)
173
La0.75Sr0.25MnO3 0.15 % N2O
GHSV = 30 800 h-1
725 170,171
La0.4Sr0.6FeO3 0.15 % N2O
GHSV = 30 800 h-1
815 172
1.6 Project outline
The aim of the PhD is to advance understandings in the area of N2O decomposition,
initially trying to elucidate further information regarding the current catalysts used
in literature and to use this new understanding of catalysts to prepare novel
catalysts for the decomposition of N2O. As mentioned at the start of this chapter it
is extremely important to decompose N2O as it has drastic consequences if released
into the atmosphere.
Chapter 2 provides an outline of all the experimental techniques used in this thesis,
from catalyst preparation and characterisation through to catalyst testing.
Chapter 3 looks at the importance of different Fe species in Fe-ZSM-5 for the
decomposition of N2O in the presence and absence of a reductant, propane. In
Chapter 1 Introduction
24
addition to comparing different Fe loadings, the efficacy of acid washing to increase
the efficiency of the Fe in the active catalyst was investigated. UV/Vis spectroscopy
was used to identify the different Fe species present and elucidate the active Fe
species for the decomposition of N2O. To overcome the issue of chlorine
contamination, a modified sublimation technique denoted as Chemical Vapour
impregnation (CVI) was used to prepare the series of catalysts, iron acetylacetonate
{Fe(acac)3} is used in place of FeCl3, as acetylacetonate precursors are easily
removed under vacuum.108–110
Chapter 4 studies the importance of surface species and particle size on Pd-Al2O3
catalysts for the decomposition of N2O in the presence and absence of a reductant,
propane. The effect of removal of surface species such as water and chloride ions
have been investigated by different pre-treatments and support pre-treatments. In
addition to comparing how activity changes based on these pre-treatments, the
control of subsequent particle size and the effect this has on catalytic activity is
evaluated. Through pre-treatment of the catalyst support prior to metal deposition,
catalytic activity significantly increased, resulting in a decrease of the T100 from
550 °C to 400 °C.
Chapter 5 investigates the use of Perovskites for N2O decomposition, most notably
studying how the surface area, phase purity and oxygen species present effect the
catalytic activity. The factors were investigated by changing the ratio of elements
in the A and B sites, which lead to increased purities, requiring lower calcination
temperatures and thus higher surface areas. The ratios that gave the highest phase
purity were prepared by two alternative preparation methods to the original citric
acid preparation, namely supercritical anti-solvent preparation and oxalic acid
preparation. The preparation methods were compared for two catalysts, with no
single preparation method being best for both. Instead, a factor of things made an
improved perovskite catalyst for N2O decomposition. For example, in the case of
the La0.75Sr0.25Co0.81Fe0.19Ox, more lattice oxygen present resulted in a more active
catalyst, whereas, for Pr0.75Ba0.25CoOx, the catalyst with the most mobile lattice
oxygen was the most active. Both these catalysts convert > 85 % N2O at 500 °C,
which is an improvement on the state of the art. 174

Chapter 1 Introduction
25
1.7 References
1 G. Bond, Heterogenous Catalysis: principles and applications, Oxford
University Press, 1974.
2 IUPAC Compendium of Chemical Terminology,
https://goldbook.iupac.org/html/C/C00876.html, 2018-12–12.
3 R. H. Harding, A. W. Peters and J. R. D. Nee, Appl. Catal. A Gen., 2001, 221,
389–396.
4 J. Reppenhagen and J. Werther, AIChE J., 2000, 45, 2001–2010.
5 P. Atkins and J. de Paula, Atkins Physical Chemistry, Oxford University Press,
2006.
6 M. Bowker, The Basis and Applications of Heterogenous Catalysis, Oxford
Science Publications, 1998.
7 IUPAC, in Manual of Symbols and Terminology for Physicochemical
Quantities and Units - Appendix II. Definitions, Terminology and Symbols in
Colloid and Surface Chemistry. Part II: Heterogeneous Catalysis, IUPAC,
Research Triagle Park, NC, 1976, vol. 46, p. 81.
8 IUPAC Compendium of Chemical Terminology, IUPAC Compendium of
Chemical Terminology, IUPAC, Research Triagle Park, NC, 2009.
9 N. W. Cant and W. K. Hall, J. Phys. Chem., 1971, 75, 2914–2921.
10 M. D. Allen and M. Bowker, Catal. Letters, 1995, 33, 269–277.
11 M. Haruta, T. Kobayashi, H. Sano and N. Yamada, Chem. Lett., 1987, 405–
408.
12 G. J. Hutchings, J. Catal., 1985, 96, 292–295.
13 J. Zhang, N. Liu, W. Li and B. Dai, Front. Chem. Sci. Eng., 2011, 5, 514–520.
14 C. Woodford, https://www.explainthatstuff.com/zeolites.html, 2009, 2019-
01–28.
15 N. Rahimi and R. Karimzadeh, Appl. Catal. A Gen., 2011, 398, 1–17.
16 J. Aguado, D. P. Serrano, J. M. Escola and A. Peral, J. Anal. Appl. Pyrolysis,

Chapter 1 Introduction
26
2009, 85, 352–358.
17 J. S. Jung, J. W. Park and G. Seo, Appl. Catal. A Gen., 2005, 288, 149–157.
18 NASA,
https://www.nasa.gov/audience/foreducators/postsecondary/features/F_
Ozone.html, 2019-01–14.
19 S. Stolarski and J. Cicerone, Can. J. Chem., 1974, 52, 1610–1615.
20 D. J. Hofmann and T. Deshler, J. Geophys. Res., 1991, 96, 2897–2912.
21 J. Austin, N. Butchart and K. P. Shine, Nature, 1992, 360, 221–225.
22 J. Hansen, M. Sato, P. Hearty, R. Ruedy, M. Kelley, V. Masson-delmotte, G.
Russell, G. Tselioudis, J. Cao, E. Rignot, I. Velicogna, B. Tormey, B. Donovan,
E. Kandiano, K. Von Schuckmann, P. Kharecha, A. N. Legrande and M. Bauer,
Atmos. Chem. Phys., 2016, 16, 3761–3812.
23 S. Rahmstorf, Science, 2007, 315, 368–370.
24 M. Meinshausen, N. Meinshausen, W. Hare, S. C. B. Raper, K. Frieler, R.
Knutti, D. J. Frame and M. R. Allen, Nature, 2009, 458, 1158–1162.
25 G. A. Meehl, W. M. Washington, W. D. Collins, J. M. Arblaster, A. Hu, L. E.
Buja, W. G. Strand and H. Teng, Science, 2005, 307, 1769–1772.
26 J. Oerlemans, Science, 1994, 264, 243–245.
27 J. M. Last, Annu. Rev. Public Health, 1993, 14, 115–136.
28 W. J. M. Martens, Environ. Health Perspect., 1998, 106, 241–251.
29 D. L. Hartmann, J. M. Wallace, V. Limpasuvan, D. W. J. Thompson and J. R.
Holton, Proc. Natl. Acad. Sci. U. S. A., 2000, 97.
30 B. Diffey, Phys. Med. Biol., 2004, 49, R1–R11.
31 J. Priestly, Experiments and Observations on Different Kinds of Air, London,
Vol II., 1776.
32 H. Davy, Researches, chemical and philosophical: Chiefly concerning Nitrous
Oxide or Dephlogisticated Nitrous Air and its respiration, Oxford University,
1800.

Chapter 1 Introduction
27
33 J. Spahni R. amd Chapellaz, T. F. Stocker, L. Loulergue, G. Hasamman, K.
Kawamura, J. Fluckiger, J. Schwander, D. Raynaud, J.-M. Barnola, H. Fischer,
V. Masson-Delmotte and J. Jouzel, Science, 2005, 310, 1317–1321.
34 A. Schilt, M. Baumgartner, T. Blunier, J. Schwander, R. Spahni, H. Fischer and
T. F. Stocker, Quarternary Sci. Rev., 2010, 29, 182–192.
35 D. M. Etheridge, L. P. Steele, R. J. Francey and R. L. Langenfelds, J. Geophys.
Res. Atmos., 1998, 103, 15979–15993.
36 D. M. Etheridge, L. P. Steele, R. L. Langenfelds, R. J. Francey, J. M. Barnola
and V. I. Morgan, J. Geophys. Res., 1996, 101, 4115–4128.
37 NASA and AGAGE (Advanced Global Atmospheric Gases Experiment), 2018,
13-01–2019.
38 M. Battle, M. Bender, T. Sowers, P. Tans, J. Butler, J. Elkins, J. Ellis, T. Conway,
N. Zhang, P. Lang and A. Clarke, Nature, 1996, 383, 231–235.
39 AGAGE (Advanced Global Atmospheric Gases Experiment),
http://ds.data.jma.go.jp/gmd/wdcgg/cgi-bin/wdcgg/catalogue.cgi, 13-01–
2019.
40 NOAA (National Oceanic and Atmospheric Administration).,
www.esrl.noaa.gov/gmd/hats/insitu/cats/cats_conc.html, 13-01–2019.
41 Intergovernmental Panel on Climate Change, Climate Change 2007
Synthesis Report, 2008.
42 L. Li, J. Xu, J. Hu and J. Han, Environ. Sci. Technol., 2014, 48, 5290–5297.
43 Intergovernmental Panel on Climate Change, Climate Change 2013: The
Physical Science Basis. Contribution of Working Group I to the Fifth
Assessment Report of the Intergovernmental Panel on Climate Change,
2013.
44 K. Pilegaard, Philos. Trans. R. Soc. B Biol. Sci., 2013, 368.
45 Z. Hu, J. W. Lee, K. Chandran, S. Kim and S. K. Khanal, Environ. Sci. Technol.,
2012, 46, 6470–80.
46 K. Butterbach-bahl, E. M. Baggs, M. Dannenmann, R. Kiese and S.

Chapter 1 Introduction
28
Zechmeister-boltenstern, Phil. Trans. R Soc. B, 2013, 368, 1–20.
47 D. S. Reay, E. A. Davidson, K. A. Smith, P. Smith, J. M. Melillo, F. Dentener
and P. J. Crutzen, Nat. Clim. Chang., 2012, 2, 410–416.
48 J. Pérez-Ramírez, F. Kapteijn, K. Schöffel and J. A. Moulijn, Appl. Catal. B
Environ., 2003, 44, 117–151.
49 United Nations Environment Programme (UNEP), Drawing Down N2O To
Protect Climate and the Ozone Layer, 2013.
50 S. S. Maroufi, M. J. Gharavi, M. Behnam and A. Samadikuchaksaraei, Iran. J.
Public Health, 2011, 40, 75–79.
51 M. Odaka, N. Koike and H. Suzuki, Chemosph. - Glob. Chang. Sci., 2000, 2,
413–423.
52 J. Baronick, B. Heller, G. Lach and B. Ramacher, in SAE Technical Paper, 2000.
53 M. G. M. Berges, R. M. Hofmann, D. Scharffe and P. J. Crutzen, J. Geophys.
Res. Atmos., 1993, 98, 18527–18531.
54 J. M. Dasch, J. Air Waste Manag. Assoc., 1992, 42, 63–67.
55 Space Propulsion Group, http://www.spg-corp.com/nitrous-oxide-
safety.html, 2015-10–29.
56 F. Kapteijn, J. Rodriguez-Mirasol and J. A. Moulijn, Appl. Catal. B Environ.,
1996, 9, 25–64.
57 J. Weimann, Best Pract. Res. Clin. Anaesthesiol., 2003, 17, 47–61.
58 P. Grace and L. Barton, http://theconversation.com/meet-n2o-the-
greenhouse-gas-300-times-worse-than-co2-35204, 2015-10–29.
59 Green House Protocol, Global Warming Potential Values (AR5), 2015, vol.
2014.
60 R. W. Portmann, J. S. Daniel and A. R. Ravishankara, Philos. Trans. R. Soc. B
Biol. Sci., 2012, 367, 1256–1264.
61 Parliament of the United Kingdom, Climate Change Act 2008, 2008.
62 United Nations, Kyoto Protocol To the United Nations Framework Kyoto
Chapter 1 Introduction
29
Protocol To the United Nations Framework, 1998, vol. 7.
63 European Parliament; European Council, Directive 2009/28/EC on the
promotion of the use of energy from renewable sources, 2009, vol. 140.
64 United Nations, Convention on Climate Change: Climate Agreement of
Paris., 2015.
65 J. European Union, DIRECTIVE 2007/46/EC OF THE EUROPEAN PARLIAMENT
AND OF THE COUNCIL of 5 September 2007 establishing a framework for the
approval of motor vehicles and their trailers, and of systems, com- ponents
and separate technical units intended for such vehicles, 2007.
66 P. Anastas and J. C. Warner, Green Chemistry: Theory and Practice, Oxford
University Press, New Ed., 2000.
67 N. Russo, D. Mescia, D. Fino, G. Saracco and V. Specchia, Ind. Eng. Chem.
Res., 2007, 46, 4226–4231.
68 M. I. Konsolakis, ACS Catal., 2015, 5, 6397–6421.
69 H. Ohtsuka, T. Tabata, O. Okada, L. M. F. Sabatino and G. Bellussi, Catal.
Letters, 1997, 44, 265–270.
70 H. Ohtsuka, T. Tabata, O. Okada, L. M. . Sabatino and G. Bellussi, Catal.
Today, 1998, 42, 45–50.
71 R. W. Van Den Brink, S. Booneveld, M. J. F. M. Verhaak and F. A. De Bruijn,
Catal. Today, 2002, 75, 227–232.
72 G. Centi and F. Vazzana, Catal. Today, 1999, 53, 683–693.
73 H. Abdulhamid, E. Fridell and M. Skoglundh, Top. Catal., 2004, 30/31, 161–
168.
74 G. Djéga-Mariadassou, F. Fajardie, J. F. Tempère, J. M. Manoli, O. Touret and
G. Blanchard, J. Mol. Catal. A Chem., 2000, 161, 179–189.
75 L. He, L. C. Wang, H. Sun, J. Ni, Y. Cao, Y. He and K. N. Fan, Angew. Chemie -
Int. Ed., 2009, 48, 9538–9541.
76 K. Teramura, T. Tanaka, H. Ishikawa, Y. Kohno and T. Funabiki, J. Phys. Chem.
B, 2004, 108, 346–354.

Chapter 1 Introduction
30
77 K. Yogo, M. Ihara, I. Terasaki and E. Kikuchi, Chem. Lett., 1993, 22, 229–232.
78 R. Burch and P. K. Loader, Appl. Catal. B Environ., 1994, 5, 149–164.
79 S. Kesraoui‐Ouki, C. R. Cheeseman and R. Perry, J. Chem. Technol.
Biotechnol., 1994, 59, 121–126.
80 Y. Zheng, X. Li and P. K. Dutta, Sensors, 2012, 12, 5170–5194.
81 J. Li, H. Chang, L. Ma, J. Hao and R. T. Yang, Catal. Today, 2011, 175, 147–
156.
82 B. Bogdanov, D. Georgiev, K. Angelova and K. Yaneva, in International
Science Conference, 2009, vol. I, pp. 482–487.
83 Lenntech, https://www.lenntech.pl/zeolites-structure-types.htm, 2019-01–
31.
84 C. Baerlocher and L. B. McCusker, www.iza-structure.org/databases/, 2019-
01–31.
85 J. Weitkamp, Solid State Ionics, 2000, 131, 175–188.
86 M. Rai, A. Yadav and A. Gade, Biotechnol. Adv., 2009, 27, 76–83.
87 D. Farrusseng and A. Tuel, New J. Chem., 2016, 40, 3933–3949.
88 D. Coster, A. L. Blumenfeld and J. J. Fripiat, J. Phys. Chem., 1994, 98, 6201–
6211.
89 R. A. Van Santen, in Studies in Surface Science and Catalysis, 1994, vol. 85,
pp. 273–294.
90 M. Rauscher, K. Kesore, R. Mönnig, W. Schwieger, A. Tißler and T. Turek,
Appl. Catal. A Gen., 1999, 184, 249–256.
91 B. M. Abu-Zied, W. Schwieger and A. Unger, Appl. Catal. B Environ., 2008,
84, 277–288.
92 S. Sklenak, P. C. Andrikopoulos, B. Boekfa, B. Jansang, J. Nováková, L. Benco,
T. Bucko, J. Hafner, J. Ddeek and Z. Sobalík, J. Catal., 2010, 272, 262–274.
93 B. R.Wood, J. A. Reimer and A. T. Bell, J. Catal., 2002, 209, 151–158.
94 Z. Sobalik, J. Novakova, J. Dedecek, N. K. Sathu, E. Tabor, P. Sazama, P.

Chapter 1 Introduction
31
Stastny and B. Wichterlova, Micropor. Mesopor. Mat., 2011, 146, 172–183.
95 I. Melián-Cabrera, E. R. H. van Eck, S. Espinosa, S. Siles-Quesada, L. Falco, A.
P. M. Kentgens, F. Kapteijn and J. A. Moulijn, Appl. Catal. B Environ., 2017,
203, 218–226.
96 M. Mauvezin, G. Delahay, B. Coq, S. Kieger, J. C. Jumas and J. Olivier-
Fourcade, J. Phys. Chem. B, 2001, 105, 928–935.
97 A. H. Øygarden and J. Pérez-Ramírez, Appl. Catal. B Environ., 2006, 65, 163–
167.
98 K. Jíša, J. Nováková, M. Schwarze, A. Vondrová, S. Sklenák and Z. Sobalik, J.
Catal., 2009, 262, 27–34.
99 J. A. Z. Pieterse, S. Booneveld and R. W. Van Den Brink, Appl. Catal. B
Environ., 2004, 51, 215–228.
100 L. Li, Q. Shen, J. Li, Z. Hao, Z. P. Xu and G. Q. M. Lu, Appl. Catal. A Gen., 2008,
344, 131–141.
101 J. H. Park, J. H. Choung, I. S. Nam and S. W. Ham, Appl. Catal. B Environ.,
2008, 78, 342–354.
102 B. Chen, N. Liu, X. Liu, R. Zhang, Y. Li, Y. Li and X. Sun, Catal. Today, 2011,
175, 245–255.
103 S. C. Christoforou, E. A. Efthimiadis and I. A. Vasalos, Catal. Letters, 2002, 79,
137–147.
104 Q. Zhu, E. J. Hensen, B. L. Mojet, J. H. van Wolput and R. A. van Santen, Chem
Commun, 2002, 1232–1233.
105 A. V Kucherov, C. N. Montreuil, T. N. Kucherova and M. Shelef, Catal. Letters,
1998, 56, 173–181.
106 H.-T. Lee and H.-K. Rhee, Catal. Letters, 1999, 61, 71–76.
107 L. J. Lobree, I. Hwang, J. A. Reimer and A. T. Bell, 1999, 63, 233–240.
108 M. M. Forde, R. D. Armstrong, C. Hammond, Q. He, R. L. Jenkins, S. A.
Kondrat, N. Dimitratos, J. A. Lopez-Sanchez, S. H. Taylor, D. Willock, C. J. Kiely
and G. J. Hutchings, J. Am. Chem. Soc., 2013, 135, 11087–11099.

Chapter 1 Introduction
32
109 M. M. Forde, R. D. Armstrong, R. McVicker, P. P. Wells, N. Dimitratos, Q. He,
L. Lu, R. L. Jenkins, C. Hammond, J. A. Lopez-Sanchez, C. J. Kiely and G. J.
Hutchings, Chem. Sci., 2014, 3603–3616.
110 V. Peneau, R. D. Armstrong, G. Shaw, J. Xu, R. L. Jenkins, D. J. Morgan, N.
Dimitratos, S. H. Taylor, H. W. Zanthoff, S. Peitz, G. Stochniol, Q. He, C. J.
Kiely and G. J. Hutchings, ChemCatChem, 2017, 9, 642–650.
111 A. Ates, C. Hardacre and A. Goguet, Appl. Catal. A Gen., 2012, 441–442, 30–
41.
112 J. Pérez-Ramírez, J. C. Groen, A. Brückner, M. S. Kumar, U. Bentrup, M. N.
Debbagh and L. A. Villaescusa, J. Catal., 2005, 232, 318–334.
113 C. Hammond, Cardiff University, 2011.
114 F. Kapteijn, G. Mul, J. a Moulijn and J. Perez-Ramirez, 2002, 35, 227–234.
115 G. Li, E. A. Pidko, I. A. W. Filot, R. A. Van Santen, C. Li and E. J. M. Hensen, J.
Catal., 2013, 308, 386–397.
116 J. Perez-Ramirez, F. Kapteijn, J. C. Groen, A. Domenech, G. Mul and J. A.
Moulijn, J. Catal., 2003, 214, 33–45.
117 K. Sun, H. Zhang, H. Xia, Y. Lian, Y. Li, Z. Feng, P. Ying and C. Li, Chem.
Commun., 2004, 2480–2481.
118 E. J. M. Hensen, Q. Zhu, M. M. R. M. Hendrix, A. R. Overweg, P. J. Kooyman,
M. V. Sychev and R. A. Van Santen, J. Catal., 2004, 221, 569–583.
119 J. Pérez-Ramírez, F. Kapteijn and A. Brückner, J. Catal., 2003, 218, 234–238.
120 V. I. Sobolev, G. I. Panov, A. S. Kharitonov, V. N. Romannikov, A. M. Volodin
and K. G. Ione, J. Catal., 1993, 139, 435–443.
121 G. I. Panov, A. S. Kharitonov and V. I. Sobolev, Appl. Catal. A, Gen., 1993, 98,
1–20.
122 G. I. Panov, V. I. Sobolev and A. S. Kharitonov, J. Mol. Catal., 1990, 61, 85–
97.
123 G. D. Pirngruber, J. Catal., 2003, 219, 456–463.
124 G. I. Panov, E. V. Starokon, L. V. Pirutko, E. A. Paukshtis and V. N. Parmon, J.

Chapter 1 Introduction
33
Catal., 2008, 254, 110–120.
125 M. V. Parfenov, E. V. Starokon, L. V. Pirutko and G. I. Panov, J. Catal., 2014,
318, 14–21.
126 Y. K. Chow, N. F. Dummer, J. H. Carter, C. Williams, G. Shaw, D. J. Willock, S.
H. Taylor, S. Yacob, R. J. Meyer, M. M. Bhasin and G. J. Hutchings, Catal. Sci.
Technol., 2017, 154–163.
127 C. Fernandez, I. Stan, J. P. Gilson, K. Thomas, A. Vicente, A. Bonilla and J.
Pérez-Ramírez, Chem. - A Eur. J., 2010, 16, 6224–6233.
128 M. Wu, H. Wang, L. Zhong, X. Zhang, Z. Hao, Q. Shen, W. Wei, G. Qian and Y.
Sun, Cuihua Xuebao/Chinese J. Catal., 2016, 37, 898–907.
129 K. Sun, H. Zhang, H. Xia, Y. Lian, Y. Li, Z. Feng, P. Ying and C. Li, Chem.
Commun., 2004, 216, 2480–2481.
130 K. A. Dubkov, N. S. Ovanesyan, A. A. Shteinman, E. V. Starokon and G. I.
Panov, J. Catal., 2002, 207, 341–352.
131 A. Ribera, I. W. C. E. Arends, S. De Vries, J. Pérez-Ramírez and R. A. Sheldon,
J. Catal., 2000, 195, 287–297.
132 G. I. Panov, A. K. Uriarte, M. A. Rodkin and V. I. Sobolev, Catal. Today, 1998,
41, 365–385.
133 Q. Zhu, E. J. Hensen, B. L. Mojet, J. H. van Wolput and R. A. van Santen, Chem
Commun, 2002, 1232–1233.
134 G. Pekridis, C. Athanasiou, M. Konsolakis, I. V. Yentekakis and G. E.
Marnellos, Top. Catal., 2009, 52, 1880–1887.
135 M. Machida, T. Watanabe, S. Ikeda and T. Kijima, Catal. Commun., 2002, 3,
233–238.
136 Y. Tateishi, T. Tsuneyuki, H. Furukawa, S. Kagawa, I. Moriguchi, Y. Kanmura
and Y. Teraoka, Catal. Today, 2008, 139, 59–63.
137 K. Doi, Y. Y. Wu, R. Takeda, A. Matsunami, N. Arai, T. Tagawa and S. Goto,
Appl. Catal. B Environ., 2001, 35, 43–51.
138 K. Zorn, S. Giorgio, E. Halwax, C. R. Henry, H. Gronbeck and G. Rupprechter,

Chapter 1 Introduction
34
J. Phys. Chem. C, 2011, 115, 1103–1111.
139 T. Maillet, C. Solleau, J. Barbier and D. Duprez, Appl. Catal. B Environ., 1997,
14, 85–95.
140 A. S. Ivanova, E. M. Slavinskaya, R. V. Gulyaev, V. I. Zaikovskii, O. A. Stonkus,
I. G. Danilova, L. M. Plyasova, I. A. Polukhina and A. I. Boronin, Appl. Catal. B
Environ., 2010, 97, 57–71.
141 D. Roth, P. Gélin, A. Kaddouri, E. Garbowski, M. Primet and E. Tena, Catal.
Today, 2006, 112, 134–138.
142 D. Gao, C. Zhang, S. Wang, Z. Yuan and S. Wang, Catal. Commun., 2008, 9,
2583–2587.
143 J. Lu, B. Fu, M. C. Kung, G. Xiao, J. W. Elam, H. H. Kung and P. C. Stair, Science,
2012, 335, 1205–1208.
144 H. Guesmi, D. Berthomieu and L. Kiwi-Minsker, J. Phys. Chem. C, 2008, 112,
20319–20328.
145 C. Sang, B. H. Kim and C. R. F. Lund, J. Phys. Chem. B, 2005, 109, 2295–2301.
146 N. Hansen, A. Heyden, A. T. Bell and F. J. Keil, J. Phys. Chem. C, 2007, 111,
2092–2101.
147 D. A. Bulushev, L. Kiwi-minsker and A. Renken, Ind. Eng. Chem. Res., 2004,
211, 2004.
148 K. Sun, H. Xia, E. Hensen, R. van Santen and C. Li, J. Catal., 2006, 238, 186–
195.
149 B. R.Wood, J. A. Reimer and A. T. Bell, J. Catal., 2002, 209, 151–158.
150 S. Parres-Esclapez, M. J. Illan-Gomez, C. S. M. de Lecea and A. Bueno-Lopez,
Appl. Catal. B Environ., 2010, 96, 370–378.
151 M. Konsolakis, I. V. Yentekakis, G. Pekridis, N. Kaklidis, A. C. Psarras and G.
E. Marnellos, Appl. Catal. B Environ., 2013, 138–139, 191–198.
152 M. De Graef and M. E. McHenry, Structure of Materials: An introduction to
Crystallography, Diffraction and Symmetry, 2007.
153 N. Labhasetwar, G. Saravanan, S. Kumar Megarajan, N. Manwar, R.
Chapter 1 Introduction
35
Khobragade, P. Doggali and F. Grasset, Sci. Technol. Adv. Mater., 2015, 16,
036002.
154 A. S. Bhalla, R. Guo and R. Roy, Mater. Res. Innov., 2000, 4, 3–26.
155 J. Zhu, H. Li, L. Zhong, P. Xiao, X. Xu, X. Yang, Z. Zhao and J. Li, ACS Catal.,
2014, 4, 2917–2940.
156 J. Hwang, R. R. Rao, L. Giordano, Y. Katayama, Y. Yu and Y. Shao-Horn,
Science, 2017, 358, 751–756.
157 R. J. H. Voorhoeve, D. W. Johnson, J. P. Remeika and P. K. Gallagher, Science,
1977, 195, 827–833.
158 M. A. Peña and J. L. G. Fierro, Chem. Rev., 2001, 101, 1981–2017.
159 G. Centi and S. Perathoner, Micropor. Mesopor. Mat., 2008, 107, 3–15.
160 S. Keav, S. Matam, D. Ferri and A. Weidenkaff, Catalysts, 2014, 4, 226–255.
161 L. A. Isupova, G. M. Alikina, S. V Tsybulya, N. N. Boldyreva, G. N. Kryukova, I.
S. Yakovleva, V. P. Isupov and V. A. Sadykov, Int. J. Inorg. Mater., 2001, 3,
559–562.
162 J. Zhu, D. Xiao, J. Li, X. Xie, X. Yang and Y. Wu, J. Mol. Catal. A Chem., 2005,
233, 29–34.
163 J. Zhu, X. Yang, X. Xu and K. Wei, J. Phys. Chem. C, 2007, 111, 1487–1490.
164 J. Zhu, Z. Zhao, D. Xiao, J. Li, X. Yang and Y. Wu, J. Mol. Catal. A Chem., 2005,
238, 35–40.
165 H. Tanaka and M. Misono, Curr. Opin. Solid State Mater. Sci., 2001, 5, 381–
387.
166 L. Marchetti and L. Forni, Appl. Catal. B Environ., 1998, 15, 179–187.
167 R. J. H. Voorhoeve, J. P. Remeika and L. E. Trimble, Ann. N. Y. Acad. Sci., 1976,
272, 3–21.
168 J. Il Jung, H. Y. Jeong, J. S. Lee, M. G. Kim and J. Cho, Angew. Chemie - Int.
Ed., 2014, 53, 4582–4586.
169 N. Russo, D. Mescia, D. Fino, G. Saracco and V. Specchia, Ind. Eng. Chem.

Chapter 1 Introduction
36
Res., 2007, 46, 4226–4231.
170 D. V. Ivanov, E. M. Sadovskaya, L. G. Pinaeva and L. A. Isupova, J. Catal.,
2009, 267, 5–13.
171 D. V. Ivanov, L. G. Pinaeva, L. A. Isupova, A. N. Nadeev, I. P. Prosvirin and L.
S. Dovlitova, Catal. Letters, 2011, 141, 322–331.
172 D. V. Ivanov, L. G. Pinaeva, L. A. Isupova, E. M. Sadovskaya, I. P. Prosvirin, E.
Y. Gerasimov and I. S. Yakovleva, Appl. Catal. A Gen., 2013, 457, 42–51.
173 T. Ishihara, M. Ando, K. Sada, K. Takiishi, K. Yamada, H. Nishiguchi and Y.
Takita, J. Catal., 2003, 220, 104–114.
174 S. Kumar, A. Vinu, J. Subrt, S. Bakardjieva, S. Rayalu, Y. Teraoka and N.
Labhsetwar, Catal. Today, 2012, 198, 125–132.

Chapter 2 Experimental
37
2 Experimental
This chapter outlines the experimental methods used in this thesis. Catalyst
preparation methods are explained, including the chemicals and their suppliers.
The characterisation techniques used are also described along with the principles
behind them. The catalyst testing and reactor set-ups are also described.
2.1 List of Chemicals
Table 2.1 lists the chemicals used in this thesis, the supplier and purity of the
substances. All reagents were used as received without further purification.
Table 2.1. List of chemicals used
Substance Supplier Purity
γ-Al2O3 Sigma Aldrich > 99.5 %
PdCl2 Sigma Aldrich 99 %
H-ZSM-5 Zeolyst 99 %
Fe(acetylacetonate)3 Sigma Aldrich 99.9 %
HNO3 (70 %) Fisher Scientific Extra Pure
HCl (37 %) Fisher Scientific Extra Pure
Oxalic Acid Sigma Aldrich > 99 %
Citric Acid Sigma Aldrich > 99.5 %
La(NO3)2.6H2O Sigma Aldrich 99.999 %
Sr(NO3)2 Sigma Aldrich 99.995 %
Co(NO3)2.6H2O Sigma Aldrich 99.999 %
Fe(NO3)3.9H2O Sigma Aldrich > 99.95 %
Ba(NO3)2 Sigma Aldrich 99.999 %
Pr(NO3)3.6H2O Sigma Aldrich 99.9 %
Sr(CH3CO2)2 Sigma Aldrich 99.995 %
Co(CH3CO2)2.4H2O Sigma Aldrich 99.999 %
Fe(CH3CO2)2 Sigma Aldrich 95 %
Ba(CH3CO2)2 Sigma Aldrich 99.999 %
Pr(CH3CO2)2.xH2O Sigma Aldrich 99.9 %
La(acetylacetonate)3.xH2O Sigma Aldrich 99.9 %
Ethanol Sigma Aldrich 99.8 %
N2O BOC 99.9 %
Propane BOC 99.99 %
Ethane BOC 99.99 %
Methane BOC 99.99 %

Chapter 2 Experimental
38
Helium BOC 99.99 %
Nitrogen BOC > 99.99%
Oxygen BOC > 99.99 %
2.2 Catalyst Preparation
A number of catalysts were prepared during the course of this thesis. Examples of
each procedure are provided below.
2.2.1 Wet impregnation
Supported metal catalysts were prepared by impregnation as described by Pekridis
et al. 1 PdCl2 was dissolved in deionised water to give a solution with a concentration
of 6 mg mL-1. To this metal solution (4.6 mL), γ-Al2O3 support (0.98 g, Sigma Aldrich)
was added and heated slowly to 55 °C until a slurry was formed. The slurry was then
dried in an oven at 120 °C for 2 h, and calcined at 600 °C for 4 h at 10 °C min-1 in
flowing air. Further heat treatments carried out at 600 °C for 1 h at 20 °C min-1 in
flowing air.
The impregnation preparation method stated in 2.2.1 was followed to prepare the
following catalysts:
• 2 wt. % Pd-Al2O3
• 2 wt. % Pd-Al2O3 support calcined before catalyst preparation at 600 °C for
4 h at 10 °C min-1 in flowing air, indicated by “SC”.
2.2.2 Support calcination before catalyst preparation
Commercially sourced Al2O3 was treated at high temperatures to remove any
impurities and excess water before catalyst preparation. γ-Al2O3 (~3 g) was placed
in a high alumina combustion boat and placed inside a quartz tube within a
combustion furnace. The glass tube was sealed so that flowing air could be passed
over the sample. The furnace was heated to 600 °C at a rate of 10 °C min-1 and held
for 4 h. The calcined support was left to cool to room temperature under flowing
air, before being removed for catalyst preparation.

Chapter 2 Experimental
39
2.2.3 Hydrochloric acid Modified Impregnation Preparation
2 wt.% Pd-Al2O3 was prepared by modified impregnation as described by Morad
and co-workers.2 PdCl2 was dissolved in water to give a solution with a
concentration of 5.725 mg mL-1, HCl was added to acidify the solution until a
concentration of 0.58 M was achieved. De-ionised water was added to the solution
(3.49 mL) to a total volume of 16 mL in a 50 mL round bottom flask. The solution
was heated to 60 °C in an oil bath. γAl2O3 (0.98 g, Sigma Aldrich) was added to the
solution slowly over a period of 10 min. The slurry was left to stir for 15 min and
then the temperature was increased to 95 °C and left to dry for 16 h. The resulting
sample was calcined at 600 °C for 4 h at 10 °C min-1 in flowing air.
The modified impregnation preparation method described in 2.2.3 was followed to
prepare the following catalysts:
• 2 wt. % Pd-Al2O3 MI
• 2 wt. % Pd-Al2O3 SC MI
2.2.4 Chemical Vapour Impregnation (CVI)
A series of supported metal catalysts were prepared by CVI following the procedure
described by Forde et al.3,4 Prior to catalyst preparation, zeolite supports were dried
under vacuum, and then placed into a Schlenk flask and evacuated at room
temperature using a vacuum line, followed by heating at 150 °C for 1 h under
continuous vacuum to remove any surface water species. The metal
acetylacetonate precursor and support were placed into a glass vial and mixed by
manual shaking. The obtained mixture was transferred to a 50 mL Schlenk flask
fitted with a magnetic stirrer bar and sealed. The flask was then evacuated at room
temperature using a vacuum line followed by heating at 150 °C for 2 h, under
continuous vacuum conditions, with stirring to induce sublimation and deposition
of the organometallic precursor onto the support. The flask was brought up to
atmospheric pressure with air and the sample removed and calcined at 550 °C in
static air for 3 h for zeolite catalysts.
The chemical vapour impregnation preparation method described in 2.2.4 was
followed to prepare the following catalysts:

Chapter 2 Experimental
40
• 2.5 wt. % Fe-ZSM-5 (23)
• 2.5 wt. % Fe-ZSM-5 (30)
• 1.25 wt. % Fe-ZSM-5 (23)
• 1.25 wt. % Fe-ZSM-5 (30)
• 0.4 wt. % Fe-ZSM-5 (23)
• 0.4 wt. % Fe-ZSM-5 (30)
• 0.16 wt. % Fe-ZSM-5 (23)
Brackets represents the SiAl ratio of the zeolites used.
2.2.5 Acid washing
Acid washing was performed by heating 10 v/v% HNO3(aq) (50 mL) to 50 °C, adding
the catalyst (0.25 g) and stirring for 10 min. The solution was filtered and washed
with deionised water (1 L g-1) followed by drying in an oven at 110 °C for 16 h. The
samples obtained using this method were denoted as Acid Washed (AW).
2.2.6 Citric Acid Preparation
Perovskite based catalysts were prepared by citric acid preparation as described by
Fierro et al.5,6 Deionised water (50 mL) was stirred and heated to 50 °C in a round
bottom flask. Metal nitrates were added to the solution and allowed to dissolve.
Citric acid (metal : citric acid = 1:2 molar ratio) was added to the solution and the
temperature increased to 90 °C, after 30 min the temperature was increased to
110 °C and left for 16 h. Following grinding, all catalysts were pre-treated in a
chamber oven at 1 °C min-1 at a temperature greater than 200 °C to pass the point
of citric acid combustion, as inferred by TGA, as this can lead to explosions if not
controlled. Finally the materials were calcined in flowing air at a suitable
temperature to form a pure phase perovskite, as determined by in-situ XRD.
The citric acid preparation method described in 2.2.6 was followed to prepare the
following catalysts:
• Ba0.5Pr0.5CoOx
• SrCo0.81Fe0.19Ox
• La0.75Sr0.25CoOx
• La0.75Sr0.25Co0.81Fe0.19Ox

Chapter 2 Experimental
41
• Pr0.75Ba0.25CoOx
2.2.7 Oxalic Acid Preparation
Perovskite catalysts were prepared using oxalic acid as a precipitation agent, based
on the work by Fan et al.7–9 Metal nitrates were added in the appropriate ratios
totalling 0.02 moles of metal to ethanol (200 mL, Sigma Aldrich 99.8 %) and stirred.
Once the metal salts were dissolved oxalic acid (0.024 moles, Sigma Aldrich, > 99 %)
was added and the solution was left to age for 2 h at room temperature. After aging,
the solution was filtered and washed with ethanol (500 mL) and dried in oven at
110 °C for 16 h. The resulting solid was pre-treated in a chamber oven at 300 °C,
followed by calcination in flowing air at a suitable temperature to form a pure phase
perovskite, as determined by in-situ XRD.
The oxalic acid preparation method described in 2.2.7 was followed to prepare the
following catalysts:
• La0.75Sr0.25Co0.81Fe0.19Ox
• Pr0.75Ba0.25CoOx
2.2.8 Supercritical Anti-Solvent (SAS) Preparation, equipment
set-up, conditions and method
The Supercritical Anti-Solvent (SAS) operational mode involves a flowing system
when high-pressure CO2 and metal solvent solutions are fed into the precipitation
vessel at the same time using a co-axial nozzle system. The nozzle contains an inner
tube through which the metal precursor solution is pumped and an outer tube
through which the CO2 anti solvent is pumped. The CO2 flow rate is controlled by
the pump and the pressure of the system is controlled by the position of the needle
valve with in the backpressure regulator (BPR) which is located downstream of the
precipitation vessel. The metal precursor solution flow rate (4 mL min-1) was
controlled using a HPLC pump (Agilent 1200 series isocratic).

Chapter 2 Experimental
42
Fig. 2.1. Diagram showing set up of the SAS precipitation rig as used in the experimental.
Using the apparatus set up described above, perovskite precursors were
synthesised. Solutions of metal salts dissolved in ethanol (1000 mL) with ~ 5 %
deionised water were made prior to the SAS process with all precursors being
dissolved at the same time.
The SAS experiments were performed by first pressurising the system with CO2 to
the required pressure of 150 bar using a flow rate of 12 kg h-1. The heated jacket
around the precipitation chamber was maintained at 40 oC. Pure solvent was
pumped through the system for 10 minutes to allow the system to equilibrate and
clean the residual waste from the system. Then the metal solution was pumped at
a flow rate of 4 mL min-1 for approximately 2 h. To remove any remaining solvent
and dry the precipitate, scCO2 was flowed for 1 h with the HPLC pump turned off.
The system was then brought back to atmospheric pressure by first turning off the
scCO2 flow and then unwinding the needle valve within the BPR before finally
venting the system.
The SAS preparation method stated in 2.2.8 was followed to prepare the following
catalysts:
• La0.75Sr0.25Co0.81Fe0.19Ox
• Pr0.75Ba0.25CoOx

Chapter 2 Experimental
43
2.3 Characterisation Techniques
Many catalyst characterisation techniques have been used throughout this thesis.
A summary of the theory and the experimental procedure required for each
technique are provided.
2.3.1 Powder X-ray Diffraction (XRD)
XRD is a commonly used technique for the analysis of the bulk phases of powdered
samples. The aim of this method is to use constructive interference of diffracted
waves from a sample to form a diffraction pattern that can be used to identify the
phases present and determine the crystallite sizes using the Scherrer equation.10,11
Every crystalline compound produces a characteristic fingerprint under XRD which
can be compared to the Powder Diffraction File to identify the compound.12 It is
important to note that amorphous solids will not produce a diffraction pattern as
they do not possess long range order. The file contains detailed information on the
d spacing and the estimated lines of diffraction. The method requires the sample
to have long range order to produce constructive interference, such as a repeating
unit cell. Therefore amorphous samples produce no diffraction data. The diffraction
from a crystal can be described in terms of reflection from a set of lattice planes.
Constructive interference is a results of satisfying the Bragg Equation. 13
𝑛𝜆 = 2𝑑𝑠𝑖𝑛𝜃
Eq. 1. Bragg Equation, where n is the order of reflection (integer), λ is the wavelength of the X-rays, d is the distance between the lattice planes and θ is the angle of incidence.

Chapter 2 Experimental
44
Fig. 2.2. Bragg Reflection from crystal planes with spacing d
Standard powder XRD involves the use of a static or moving mono-chromatic X-ray
source that bombards a sample creating cones of constructive interference.
Diffraction occurs when waves scattering with an object constructively and
destructively interfere with each other. Destructive interference occurs when X-
rays are out of phase and cancel out diffracted radiation. Constructive interference
is a result of the randomly orientated crystallites, that allow the incident X-rays to
be in phase with each other. The random orientation of the crystallites ensures that
all lattice planes will interact with the X-rays at all possible angles and therefore
satisfying Bragg’s Law for each plane. A detector follows an arch path to intersect
the diffraction cones, which allows the determination of X-ray intensity with
respect to 2θ.
The Scherrer equation can be used to calculate the average crystallite size of the
powdered sample 10,11. This is based on the requirement of long-range order or
crystallinity for XRD diffractograms to be produced. The larger the crystallite the
narrower and sharper the reflections that are seen. However, below 100 nm
particle size line broadening takes place due to incomplete destructive interference
of out of phase X-rays. This broadening of the reflections is used in the calculation
of the crystallite sizer using the Scherrer equation shown below.14
< 𝐿 > = 𝐾𝜆
𝛽𝑐𝑜𝑠𝜃
Eq. 2. Scherrer equation, where < L > is the crystallite size in the direction perpendicular to the lattice planes being analysed, K is a numerical factor frequently referred to as the crystallite shape factor, λ is the wavelength of the X-

Chapter 2 Experimental
45
rays, β is the full width half maximum of the diffraction peak in radians and θ is the Bragg angle in radians.
Powder X-ray diffraction (XRD) analysis was performed using a PANalytical X’pert
Pro diffractometer with a Cu X-ray source operating at 40 keV and 40 mA, with Kα1
X-rays selected using a Ge (111) single crystal monochromator. Patterns were
recorded over the 2θ angular range 10 - 80° using a step size of 0.016° (resulting in
a total run time of 40 minutes) using a back filled sample holder. Diffraction
patterns were identified using the International Centre for Diffraction Data (ICCD)
Powder Diffraction File. 12
2.3.2 In-situ X-ray Diffraction (XRD)
In-situ XRD uses the same theory as XRD stated in 2.3.1 but the spectrometer
focuses the X-rays onto a cell containing a sample holder that can be heated and
have gases flowed over it. This allows for XRD to be performed during either pre-
treatment conditions or reaction conditions.
In-situ XRD was performed using a PANalytical X’pert Pro diffractometer with a Cu
X-ray source operating at 40 keV and 40 mA, with Kα1 X-rays selected using a Ge
(111) single crystal monochromator. The sample cell allows temperature control
and gas flow using Bronkhorst mass flow controllers (MFC’s). A computer program
called ‘High Score Data collector’ was used to control the temperature settings, run
time and scan repeats. The cell was packed with sample and loaded inside the scan
unit of the diffractometer, with flow rates set and temperature controlled.
Reflections within each sample were identified and compared to the ICDD Powder
Diffraction File 12 which contains a database of reference patterns, enabling
identification of compounds. Compounds can be compared based on elemental
composition and the ‘% match’ between the database file and the data.
For phase determination of perovskites the following in situ XRD profile was
performed.
1. Set air flow to 25 ml min-1.
2. Heat to 50 °C, wait 10 min, perform 2 scans from 15 to 70 °.
3. Heat to 400 °C at 10 °C min-1, wait 10 min, perform 2 scans from 15 to 70 °.
4. Heat in 50 °C intervals at 10 °C min-1 and wait 10 min, perform 2 scans from
15 to 70 ° at each temperature up to 850 °C.

Chapter 2 Experimental
46
5. Cool to 50 °C, wait 10 min, perform 2 scans from 5 to 70 °.
6. Cool to room temperature and shut off gas flow.
2.3.3 Raman Spectroscopy
Raman spectroscopy measures the vibrational energy of molecules based on the
changes of polarizability of the molecule. The excitation energies in Raman
spectroscopy result in promotion to virtual energy states and then the relaxation
back to the vibrational energy states. Excitation and relaxation to and from the
same vibrational state is referred to as Raleigh Scattering. Raleigh scattering is an
elastic process meaning both energy and momentum are conserved. Raman
scattering is defined by a change in energy, both positive and negative. Stokes
scattering is characterised by the kinetic energy of the incident radiation and the
scattered photon being different; if the scattered photon gains energy then it is
referred to as anti-stokes scattering where as if the photon loses energy then it is
defined as stokes scattering.15,16 Therefore only Stokes scattering is observed. For a
molecule to be Raman active, the molecule must have changeable polarizability and
not have any centres of symmetry, with selection rules stating that only bond
vibrations and rotations are allowed. A change in frequency of the scattered light is
due to a change in the vibration state on relaxation, which is a Raman effect. The
measurement of this change in frequency from a sample irradiated with a laser
allows the calculation of the vibrational energy states, providing information about
the chemical bonds present and molecular structure that are characteristic to each
sample.
Fig. 2.3. Transitions between energy levels in IR and Raman Spectroscopy 15

Chapter 2 Experimental
47
Raman spectroscopy was carried out using a Renishaw in Via Raman microscope
fitted with a Stellar-REN 3B green Ar+ laser (λ = 514 nm) operated at a power of 20
mW.
2.3.4 Thermogravimetric Analysis (TGA)
TGA allows the mass of a sample to be monitored as a function of time as the
temperature is increased at a controlled rate. Volatile molecules and water loss or
decomposition shows up as mass loss, whereas oxidation or adsorption shows as
mass gain, however if total oxidation occurs this is seen as a mass loss. This
technique can be performed under many different atmospheres. TGA provides
quantitative information on sample composition based on specific weight loss
correlating to functional groups at known temperatures. 17
Analysis was carried out using a Perkin Elmer TGA 4000 to determine information
on the decomposition pathways of catalyst precursors. The default TGA profile used
between 20 – 30 mg sample with 50 mL min-1 air and a ramp rate of 5 °C min-1 unless
otherwise stated. Perovskite catalysts require a more controlled temperature
increase and therefore in the case of these catalysts the temperature ramp rate
used was 1 °C min-1 with < 10 mg sample. Mass losses were recorded as changes in
mg and converted into a percentage of the total mass of the sample.
2.3.5 Microwave Plasma Atomic Emission Spectroscopy (MP-AES)
MP-AES allows elemental analysis of a compound to be carried out in one run.
Multi-element analysis can be carried out using AES with greater sensitivity than in
atomic absorption spectroscopy (AAS) due to lower interference. A microwave
nitrogen plasma heat source was used to create high temperatures to excite
electrons to create a radiation source. The wavelength of this radiation is
characteristic of the specific element used, and allows elemental concentrations to
be determined.
A solution is sprayed through a nebuliser into a detection chamber that lies just
below the microwave nitrogen plasma. The electrons within the sample are excited
to a higher energy state by the plasma and then emit energy in the form of radiation
(visible to UV) which is directed to the charge coupled device detector by a

Chapter 2 Experimental
48
diffraction grating where it is separated into its component wavelengths in an
optical spectrometer. The intensity of the light is measured by photomultiplier
tubes and correlated against known intensities at certain wavelengths to produce
a concentration value in parts per million (PPM). Before any analysis is carried out,
standards containing the known concentrations of the elements expected within
the sample must be run to calibrate the AES equipment. 18,19
AES was carried out using an Agilent 4100 MP-AES utilising Agilent MP expert
software. Calibration samples were prepared by dilution of a standard metal
solution with deionised water. A minimum of 4 calibration plots were used per
analysis. Solid catalyst samples (50 mg) were dissolved in aqua regia (4 mL diluted
to 50 mL with deionised water) to give a pre-calculated approximate metal
concentration.
2.3.6 Inductively Coupled Plasma – Optical Emission
Spectroscopy (ICP-OES)
Inductively Coupled Plasma – Optical Emission Spectroscopy uses the same
technique as descried in 2.3.5 but, instead of a microwave plasma being used as a
heat source, an inductively coupled plasma is used instead as the temperature
achieved is much higher and therefore all elements are fully ionised. ICP-OES is used
instead of MP-AES as the detection limits are much lower in ICP-OES.
Inductively Coupled Plasma – Optical Emission Spectroscopy (ICP-OES) was
performed by Exeter Analytical Services using HF digestion to get an accurate Fe
loading. The sample was digested by an Anton Paar Multiwave 3000 microwave
with nitric acid and HF – then the HF was neutralised with the addition of boric acid.
A reagent blank was carried out. An internal standard was added to the resulting
solutions, and the blank and sample were run against Fe standards by ICP-OES using
Thermo Fisher iCAP Duo 7400.
2.3.7 Temperature Programmed Reduction (TPR)
Temperature programmed reduction measures the reducibility of a sample and the
reducible species present. This is achieved by heating the sample in a reducing

Chapter 2 Experimental
49
atmosphere such as diluted hydrogen at various temperatures controlled by a
program to ensure a linear ramp rate.
The sample was heated as a function of time in a furnace under a flowing gas
mixture of 10% H2 in Ar. The results show the different species present in the
sample and how easily they are reduced (i.e. temperature required). These results
give information on the presence of different oxidation states or the effect of a
dopant in a lattice. This technique is useful for measuring the temperature required
for complete reduction of a catalyst and is commonly used to analyse the
interaction of a metal with its support. Hydrogen has a high thermal conductivity
meaning a decrease in hydrogen concentration is marked by a decrease in
conductivity of the gas mixture. This change is measured by a thermal conductivity
cell as a function of either time or temperature. The peaks in a TPR spectrum show
the temperature at which various reduction steps take place. If a species is reduced,
and hydrogen is consumed, a positive peak is seen on the TCD signal that is used to
monitor the H2 flow. Sometimes a negative peak is seen due to the sample releasing
H2 when heated, an example of is this Pd which can exist as Pd-H before reduction
takes place. The volume of hydrogen consumed can be determined by the area
under the peak, when compared to a CuO calibration.17
TPR was carried out using a ChemBET TPR/TPD equipped with a TCD to monitor
hydrogen uptake. A pre-treatment in He up to 150 oC was performed, followed by
a reduction in 10 %H2/Ar up to 800 oC, held for 30 min at Tmax, using an attenuation
of 4, TCD sensitivity of 150 and flow 15 mL min-1. The sample mass used was
typically between 40 – 50 mg.
2.3.8 CO Chemisorption
CO chemisorption can be used to determine the dispersion, metal surface area and
average crystallite size of active metal in a catalyst sample.
Chemisorption takes place when an interaction such as bond formation takes place
between an adsorbates and the sample surface, whereas physisorption refers to a
weak physical interaction. Initially chemisorption involves the formation of a
monolayer of adsorbate on the surface of the active sites by bond formation.
However, it is possible for further absorption to take place on top of the mono-layer
and form multi-layers which should be considered when chemisorption techniques

Chapter 2 Experimental
50
are performed. Multi-layers form when CO binds to a monolayer of CO that has
already formed on the surface of the active metal. This only normally happens when
a molecule is polar and both physical and chemical adsorption may occur at the
surface at the same time. A layer of molecules may be physically adsorbed on top
of an underlying chemisorbed layer. 20
The CO chemisorption process involves reducing an active component of a catalyst
and then pulsing a known volume of CO (adsorbate) over the catalyst and recording
the volume that is not adsorbed on the metal by the TCD response. Initially no
response should be seen for the first couple of pulses, and as the metal becomes
saturated more of a response is registered, until the response does not change and
the metal is fully saturated, and no further CO is adsorbed. The total volume of CO
absorbed can be converted into a dispersion value when the stoichiometry, binding
modes and metal loading are considered. The ‘TPR Win’ software makes use of
three key equations, metal surface area, dispersion, and average crystallite size.
Metal surface area is defined as the surface area of active sites present in the
sample surface as m2 g-1 from the following equation:
𝑀𝑒𝑡𝑎𝑙 𝑆𝑢𝑟𝑓𝑎𝑐𝑒 𝐴𝑟𝑒𝑎 (𝑀𝑆𝐴) = 𝑁𝑎 𝑉𝑚
𝑆𝑓𝑆𝑑
Eq. 3. Metal surface area equation, where: Na = Avogadro’s number, Vm = Gas adsorbed at monolayer (mol g-1), Sf = Stoichiometric factor of reaction, Sd = Metal surface density.
Dispersion is defined as the amount of metal atoms exposed and available to act as
catalyst and propagate the reaction, given as a percentage of the total metal
loading from the following reaction:
𝐷𝑖𝑠𝑝𝑒𝑟𝑠𝑖𝑜𝑛 =𝑉𝑚 𝑀 104
𝑆𝑓 𝑥
Eq. 4. Dispersion equation, where: Vm = Gas adsorbed at monolayer (mol g-1), M =
molecular weight of the active metal, Sf = Stoichiometric factor of reaction and x = total metal loading of the sample.
Average particle size is defined as the using the metal surface area as follows:

Chapter 2 Experimental
51
𝐴𝑣𝑒𝑟𝑎𝑔𝑒 𝑃𝑎𝑟𝑡𝑖𝑐𝑙𝑒 𝑆𝑖𝑧𝑒 = 100 𝑁 𝑓
𝑀𝑆𝐴 𝜌
Eq. 5. Average particle size equation in nm, where: N = mass of the active metal, f = shape correlation factor, MSA = metal surface area, and ρ = active metal density.
CO Chemisorption was performed using a ChemBET TPR/TPD pulsar with a
reduction in 10 %H2/Ar up to 120 oC before carrying out CO chemisorption at room
temperature using 10 % CO/He using an attenuation of 2, TCD sensitivity of 150 and
CO flow of 15 mL min-1. An automated pulse program was used with a pulse length
of 400 seconds, loop volume 125 µL, 16 pulses and a stable baseline.
2.3.9 Oxygen Temperature Programmed Desorption (O2 TPD)
Temperature programmed desorption of oxygen measures the oxygen mobility of
the species present, i.e. the more mobile the oxygen the lower the temperature at
which desorption will take place at. This is achieved by heating the sample in a clean
atmosphere such as helium to remove any surface species, followed by dosing of
oxygen at high temperatures and cooling to room temperature, followed by the
desorption of oxygen in helium environment controlled by a program to ensure a
linear ramp rate.
The sample was pre-treated to 550 °C at 10 °C min-1 and held for 30 min in helium
(30 ml min-1) to remove any surface species that may give a false TCD response such
as water. After completion of the pre-treatment, the gas was switched to 10 %
O2/He and held at 550 °C for 30 mins to allow adsorption of oxygen. The sample
was then cooled in the O2 atmosphere to room temperature and the gas switched
to He, after a wait of 1 h the temperature programmed desorption was performed.
This involved heating the sample to 850 °C at 10 °C min-1, whilst measuring the TCD
signal and temperature.
The results show the different oxygen species present in the sample and how
mobile they are (i.e. the temperature required for desorption). The more labile the
oxygen, the more available it is for reaction and subsequently the more active the
catalyst.
Oxygen has a different thermal conductivity to helium, meaning the desorption of
oxygen leads to a difference of conductivity of the gas mixture. This change is

Chapter 2 Experimental
52
measured by a thermal conductivity detector (TCD) as a function of either time or
temperature. TPD curves are the representation of the TCD signal versus
temperature.
Oxygen TPD was carried out using a ChemBET TPR/TPD equipped with a TCD to
monitor oxygen evolution. A pre-treatment in He up to 550 oC was performed,
followed by dosing of oxygen using 10 %O2/He at 550 oC, the sample was cooled to
room temperature and the gas changed to He, followed by desorption of oxygen
up to 850 °C at 10 °C min-1 and held for 10 min at the maximum temperature (Tmax),
using an attenuation of 2, TCD sensitivity of 150 and flow 30 mL min-1. The sample
mass used was typically 60 mg.
2.3.10 Brunauer Emmett Teller surface area determination (BET)
Total surface area is an important characteristic of a catalyst and is commonly
determined using the Brunauer Emmett Teller (BET) technique.21 The data
produced is characterised by a specific isotherm which plots the number of
molecules adsorbed relative to pressure. The number of molecules can be
converted to volume of gas physisorbed or surface coverage. The BET isotherm
allows multilayer adsorption and enables the different enthalpies of these layers to
be accounted for.
The pore structure defines the isotherm shape that is produced when N2 adsorption
takes place. There are 4 different types of isotherms shown in Fig. 2.4, with the BET
isotherm being based on either type I or type II. Type I refers to the formation of a
monolayer, whilst type II refers to the gradual formation of a monolayer and
pressure increase that leads to the formation of a multilayer. Type IV refers to the
formation of a monolayer followed by the filling of the micropores. The black dot
in the isotherms in Fig. 2.4 represent the point at which a monolayer has formed.

Chapter 2 Experimental
53
Fig. 2.4. Nitrogen adsorption isotherm types, showing the many types of adsorption that are possible with the dot representing the point at which a monolayer has formed, adapted from reference 22
The BET equation can be represented in a linear form to give a gradient of [(C-
1)/VmC], which equates to the volume of surface adsorbed gas. Based on the
molecules adsorbed, the surface area can be determined, i.e. molecule size
multiplied by number of molecules adsorbed. 23
𝑃
𝑉(𝑃𝑜 − 𝑃)=
1
𝑉𝑚𝐶+
(𝐶 − 1)
𝑉𝑚𝐶 .
𝑃
𝑃𝑜
Eq. 6. BET equation where V = Volume of gas adsorbed, Vm = monolayer volume, Po = saturation gas pressure, P = specific gas pressure, C = BET constant that accounts for the enthalpies of adsorption for the monolayer and subsequent layers.
𝐶 = 𝑒Δ𝐻𝐷
𝑜− Δ𝐻𝑉𝐴𝑃𝑜
𝑅𝑇
Eq. 7. Equation for the C constant described above, where ΔHDo is the enthalpy of
desorption (strength of adsorbate – surface interaction) and ΔHVAPo is the enthalpy
of vaporisation (Adsorbate – adsorbate interaction in multilayer) 24.
Nitrogen adsorption isotherms were collected using either Quantachrome
Quadrasorb evo or a Micrometric 3Flex (where necessary i.e zeolites, which have
micropores which can not be analysed using the Quantachrome Quadrasorb evo).
For the Quantachrome Quadrasorb evo a 20-point analysis was performed using N2
as the adsorbate gas. Samples were degassed for 14 h at 300 oC prior to analysis.
With the 3Flex, samples (0.050 g) were degassed (250 °C, 9 h) prior to analysis.
Analyses was carried out at -196 °C with P0 measured continuously. Free space was

Chapter 2 Experimental
54
measured post analysis with He. Pore size analysis was carried out using Density
Functional Theory (DFT) (N2-Cylindrical Pores-Oxide surface) via the Micrometrics
3Flex software.
2.3.11 X-Ray Photoelectron Spectroscopy (XPS)
XPS is a commonly used characterisation technique that can be used for the analysis
of surface species, such as surface elemental analysis and determination of the
metal oxidation state. XPS is a surface technique and therefore information is only
obtained to a depth of 1 - 5 nm, depending on the photoelectron kinetic energy.
XPS is based upon the photoelectric effect; if a sample is irradiated with light of a
small enough wavelength electrons will be emitted, with the sample atoms
irradiated by a monochromatic X-Ray radiation source. If the energy of the incident
photon is equal to or greater than that of the binding energy of a core or valence
electron then the electron is ejected and has a resulting kinetic energy 25 as given
by the equation:
𝐸𝑘 = ℎ𝜐 − 𝐸𝑏 − 𝜑
Eq. 8. Equation used to calculate the resulting kinetic energy of an electron after being ejected from core. Where Ek = ejected electrons kinetic energy, h = Planck’s constant, υ = frequency of the incident radiation, Eb = binding energy of the electron, ϕ = work function of the spectrometer.
The binding energy depends on a number of factors such as; the element the
electron is emitted from, the orbital from which the electron is ejected and the
chemical environment of the atom from which the electron was emitted. All
elements have a characteristic binding energy of an ejected electron. Intensity at a
binding energy can therefore be correlated back to a specific element. It is also
possible to determine the oxidation state of the element present as the energy
levels of the core electrons depend on the oxidation state of the atom. For example,
a metal in an oxide form has a higher binding energy compared to that of the
metallic form due to having a higher resulting kinetic energy as the binding energy
of the electron is lower.
X-ray photoelectron spectroscopy (XPS) was performed using a Thermo Fisher
Scientific K-alpha+ spectrometer. A micro-focused monochromatic Al X-ray source
(72 W) was used to analyse samples over an area of 400 microns. Data was recorded

Chapter 2 Experimental
55
at pass energies of 150 eV for survey scans and 40 eV for high resolution scan with
1 eV and 0.1 eV step sizes respectively. A combination of both low energy electrons
and argon gas were used for charge neutralisation of the sample. Data analysis was
performed in CasaXPS using a Shirley type background and Scofield cross sections,
with an energy dependence of -0.6.
2.3.12 Solid State magic angle spin nuclear magnetic resonance
(MAS-NMR)
MAS-NMR spectroscopy is an experimental technique that provides information on
the chemical environment of atoms present in a solid sample. Solid State NMR
allows the study of atoms that have a magnetic moment due to having an uneven
number of protons and/or neutrons in the nucleus. Nuclear spin is quantised (I)
which can be either a whole or half number depending on the number of unpaired
protons and neutrons. There are 2I + 1 levels that are associated to nuclear spin,
when no magnetic field is applied these are the same. When a magnetic field is
applied these levels become different with 2I + 1 states that can either align or
oppose the magnetic field. The applied magnetic field causes the molecules to
resonate between the energy levels and this frequency that this occurs at is
characteristic of a molecule.
In liquid samples line broadening is not a problem as they are removed by rapid
molecular motions, i.e. tumbling. In solids this is not the case and therefore the
sample must be spun quickly (> 5 kHz) around the magic angle of θ = 54.7 °. Both
dipolar and chemical shielding interactions contain (3cos2θ-1) terms, in the liquid
state rapid isotropic tumbling occurs, averaging this spatial component to zero. In
the solid state by spinning at 54.7 °, the magic angle, it is possible to average the
anisotropic interaction to zero by using a rate of MAS greater than the interaction.
This makes the equation 3cos2θ-1 negligible and therefore removes the line
broadening, by mimicking the rapid tumbling that occurs in liquids and allows
higher resolution spectra to be obtained. Without satisfying this equation, i.e.
spinning at an angle that is not 54.7 °, the line broadening would not be removed
and the spectra would resemble an agglomeration of all species present in the
sample.13

Chapter 2 Experimental
56
Solid-state NMR spectra were obtained at the EPSRC UK National Solid-state NMR
Service at Durham. Solid state 1H Proton and 27Al spectra were recorded at 399.88
MHz using a Varian VNMRS spectrometer and a 4 mm (rotor outer diameter) magic-
angle spinning probe. They were obtained using a background suppression pulse
sequence, 128 repetitions with a 1 s recycle delay and a spin-rate of approximately
14 kHz. Spectral referencing was to external, neat tetramethylsilane carried out by
setting the resonance from adamantane to 1.9 ppm.
2.3.13 Diffuse Reflectance UV/Vis Spectroscopy (UV/Vis)
Diffuse Reflectance UV/Vis spectroscopy is a characterisation technique that can be
used to define the different species of an element present based on their response
to UV radiation. UV radiation exhibits wavelengths in the region of 200 – 400 nm.
In this region it is possible to promote valence electrons (HOMO) to higher energy
levels (LUMO), by absorbing photons of specific energy. The energy needed to
promote an electron from the HOMO to the LUMO depends on the bonding system
and atoms involved, therefore the wavelength at which an absorption band is
observed provides information on the ionic charge, environment and electronic
bonding, all of which have an effect on the transition energy.26 The Beer Lambert
law can be used to calculate the concentration of absorbing species based on the
absorbance as long as the correct molar extinction coefficient is used.
𝐴 = 𝜀[𝑐]𝑙
Eq. 9. Beer lambert law, where A = absorbance, ε = molar extinction coefficient, [c] = concentration, l = path length of sample cell.
Allowed electronic transitions are determined by the spin and Laporte selection
rules. The spin selection rule (ΔS = 0) means that changes in spin multiplicity are
forbidden. The Laporte selection states that for a transition to occur a change in
symmetry of the complex is needed. Some useful transitions such as d d
absorptions in transition metals are ‘not allowed’ due to the lack of change in the
symmetry, so does not satisfies the Laporte selection rule.
UV/Vis spectra are produced when a UV light source is shone on a catalyst and the
light that is reflected is measured, the wavelengths at which light is absorbed are
shown as peaks, where as troughs are seen when light is emitted. The higher the
absorbance value, the more of a particular wavelength is being absorbed. The

Chapter 2 Experimental
57
wavelength that corresponds to the highest absorption is usually referred to as
‘lambda-max’ λmax.
Diffuse Reflectance UV/Vis spectra was collected using an Agilent Cary 4000 UV/Vis
spectrophotometer. Prior to analysis samples were ground into a fine powder using
an agate pestle and mortar, then loaded into a sample cell. Background scans were
run on a high purity PTFE disc. Samples were scanned between 200 and 800 nm at
a scan rate of 150 nm min-1, with a UV-visible changeover wavelength of 350 nm.
2.3.14 Electron Microscope Techniques
Electron Microscopy (EM) is an extremely useful characterisation technique that is
used to determine the topology, morphology and elemental composition of a
sample. EM can also be used to determine the size and shape of supported metal
nano-particles, leading to particle size distributions. 25
EM is based on the interaction of an electron beam with a sample. As electrons
have wavelengths in the range of an atomic radius (< 1 Å) it is therefore possible to
obtain images with atomic detail.
Fig. 2.5. Diagram explaining how the electron beam interacts with the sample in electron microscope.

Chapter 2 Experimental
58
Fig. 2.5. shows the main processes of the electrons as they pass through the sample
that provide different information about the specimen. For instance, diffracted
electrons can give information about the crystallographic structure. Backscattered
electrons are also useful as these provide information about the distribution of
atoms in the sample, as the electron beam is scattered by the collision with atoms
in the sample, the heavier the atoms the greater the chance of an elastic collision
occurring due to their greater cross-sectional area. To keep the electron beam
focussed a vacuum is used. Different types of apertures and lenses are used to focus
the beam into a fine point on the sample and to produce different types of
emissions.
Scanning Electron Microscopy (SEM) detects either secondary or backscattered
electrons based on the beam position. SEM can be used to determine topology,
morphology and composition of a sample, up to a depth of 3 – 10 nm.
Transmission Electron Microscopy (TEM) detects both transmitted scattered and
unscattered electrons. Bright field images represent a 2D projection of the
transmitted electrons, with intensity dependent on the mass distribution of atoms
and the density and thickness of the sample. Dark field electrons represent those
electrons that have been diffracted by the sample and therefore are at an angle
that is different to that of the transmitted beam. It is possible to increase contrast
in the image by altering the attenuation of the electron beam and by altering the
thickness and density of the sample. TEM is commonly used in catalysis to
determine dispersion, particle size, morphology and chemical composition of
supported metal nano-particles.
STEM combines both Scanning Electron Microscopy (SEM) and Transmission
Electron Microscopy (TEM) operational modes. The user can select a specific region
of the sample to irradiate with the primary electron beam and obtain a bright or
dark field image. To obtain an image with an increased contrast of supported metal
nanoparticles, an image can be produced by the electrons that are diffracted by the
metal nano-particles, this is referred to as a dark field image. The intensity of a
HAADF image is proportional to the square of the atomic number, by the equation
((1.4)2 x atomic number)2, therefore heavy atoms are observed brighter but light
atoms can be difficult to observe.

Chapter 2 Experimental
59
High-Angle Annular Dark-Field Scanning Transmission Electron Microscopy
(HAADF-STEM) was performed by Dr. Qian He initially at Lehigh University and then
finally Diamond Light source. In both, a JEOL ARM 200CF AC-STEM instrument was
used and the samples were prepared using the dry dispersion route: The catalyst
powder was ground between two clean glass slides and then dry transferred onto
a holey carbon TEM grid.
2.3.15 Point of Zero Charge (PZC)
The point of zero charge (PZC) of an oxide support can have a significant effect on
metal dispersion and particle size during impregnation preparation of a catalyst. An
oxide support contains terminal hydroxyl groups that are protonated or
deprotonated depending on the acidity of the solution, the pH at which the
hydroxyl groups are overall neutral is the point of zero charge. It is important to
determine the point of zero charge of an oxide support before catalyst preparation
if an impregnation technique is to be used, as the pH of the impregnation solution
affects the species that will bind to the support. For example, if the pH of the
solution is below that of the PZC, the hydroxyl groups are protonated and become
positively charged, then the surface can absorb anionic metal complexes; above the
PZC, the hydroxyl groups are deprotonated and become negatively charged and
cations will be strongly absorbed. In the case of platinum, two different precursors
are used for preparation depending on the support PZC: if the pH < PZC,
chloroplatinic acid is used; if the pH > PZC platinum tetraamine is used (2.6), this is
termed electrostatic absorption. 27 The PZC of Al2O3 was determined and the pH of
the Pd solution used for impregnation were determined to see the effect of
electrostatic absorption on the catalysts preparation.

Chapter 2 Experimental
60
Fig. 2.6. Components of electrostatic adsorption mechanism, surface charging, metal adsorption and proton transfer. Reproduced from ‘Synthesis of solid catalysts’ pg 34. 27
PZC is determined by measuring the initial pH of a solution, adding a known mass
of support and measuring the final pH. Done over a range of pH from 1 – 14, these
two values are plotted against each other and the point at which a plateau is
observed is the point of zero charge. In this case, solutions of known pH were
prepared by serial dilution of 0.1 M NaOH and 0.1 M HCl to prepare 10 mL of
solution, of which 1 mL was used for the next dilution to leave 9 mL for experiment.
The initial pH was recorded, using a pH meter calibrated using pH 4, 7 and 9 buffer
solutions, followed by the addition of Al2O3 (0.9 g). The solution was stirred and left
to equilibrate for 15 minutes, and the final pH was recorded. The volumes and
weights used were selected in relation to the fact that the higher the m2 L-1 (surface
area per litre), the more obvious the plateau (Fig. 2.7). As the surface area of the
support is ca. 120 m2 g-1, this equates to 12000 m2 L-1, and based on the information
provided should provide an obvious plateau.

Chapter 2 Experimental
61
Fig. 2.7. Simulation of γ-alumina EpHL for various mass loadings (PZC = 8.0, DpK = 5.0 s, s = 180 m2 g-1). Reproduced from “A simple, accurate determination of Oxide PZC and the strong buffering effect of Oxide surfaces at incipient wetness.” 28

Chapter 2 Experimental
62
2.4 Reactor Experimental
2.4.1 Reactor set up and catalyst testing
All reported reactions were performed at atmospheric pressure in a continuous
flow fixed-bed reactor. Both stainless steel and quartz reactor tubes can be used
for this reactor, so either a 35 cm length of 6.5 mm outer diameter stainless steel
tube or a 20 cm length quartz tube with an internal diameter of 7 mm was packed
with 0.0625 g of catalyst, which was then sandwiched between two layers of glass
wool. The temperature range tested was 200 - 600 °C, with the temperature
measured on a N-type thermocouple. The temperature was held at each
temperature for 2 h to enable a steady state to be achieved before data was
collected. A mixture of Bronkhorst and MKS mass flow controllers were used to
control the incoming N2O, nitrogen, oxygen, methane, ethane, propane and helium,
for testing under a GHSV of 45,000 – 70,000 h-1, with a total flow of 100 mL min-1.
Two gas regimes were tested, N2O or N2O and C3H8 at either a composition of 1 %
reactants or 5 % reactants. All outgoing gaseous products were analysed online
using an Agilent 7890B Gas Chromatograph (GC) (columns: Haysep Q (80-100 mesh,
1.8 m) MolSieve 5A (80-100 mesh, 2 m) fitted with a thermal conductivity detector
(TCD) and flame ionisation detector (FID). The reactor scheme is shown in Scheme
2.1 with an image of the set up in Fig. 2.8.

Chapter 2 Experimental
63
Scheme 2.1. P&ID diagram of the propane ODH Reactor used to test catalysts throughout this thesis.
Fig. 2.8. Image of the propane ODH Reactor used to test catalysts throughout this thesis, located in Lab 1.86 in Cardiff Catalysis institute, Cardiff University Main Building.

Chapter 2 Experimental
64
2.4.2 Product analysis:
Agilent 7890B Gas Chromatograph (GC) fitted with an FID and TCD was used to
separate analytes. The reaction gas was injected into the GC using a six port valve
heated to 150 °C, with He used as the carrier gas. There are 3 six port valves in the
GC that are used to control the flow of analytes through each column and detector,
as shown in Table 2.2. At 0.5 min V3 is used to inject the analytes on to the HayeSep
Q and Mol Sieve column, after 2 mins, the Mol Sieve column is switched out and
the light analytes such as O2 and N2 are trapped on this column. This allows
hydrocarbons and CO2 top be eluted from the HayeSep Q column without
compromising the integrity of the Mol Sieve column, as CO2 irreversibly binds to it.
At 13 minutes, the Mol Sieve column is brought back into sequence by the switching
of valve 2, allowing the elution of the light gases.
Table 2.2. Valve sequence program, + = on, - = off.
Time
(min)
V3 Sample injection
Fill (-) Inject (+)
V1 (Methaniser bypass)
Series (+) Bypass (-)
V2 (Bypass)
Series (+) Bypass (-)
0.5 + - +
2 - - -
13 - + +
Hydrocarbons and CO2 were separated using a HayeSep Q column (80-100 mesh,
1.8 m). O2, N2 and other light gases were separated using a MolSieve 5A (80-100
mesh, 2 m) column.
To start the GC method, analyte sample is injected onto the GC columns by the
switching of valve 3 from the fill to inject position as shown in Fig. 2.9. In this
instance the second valve is in the series position that allows the gas to elute onto
both columns.
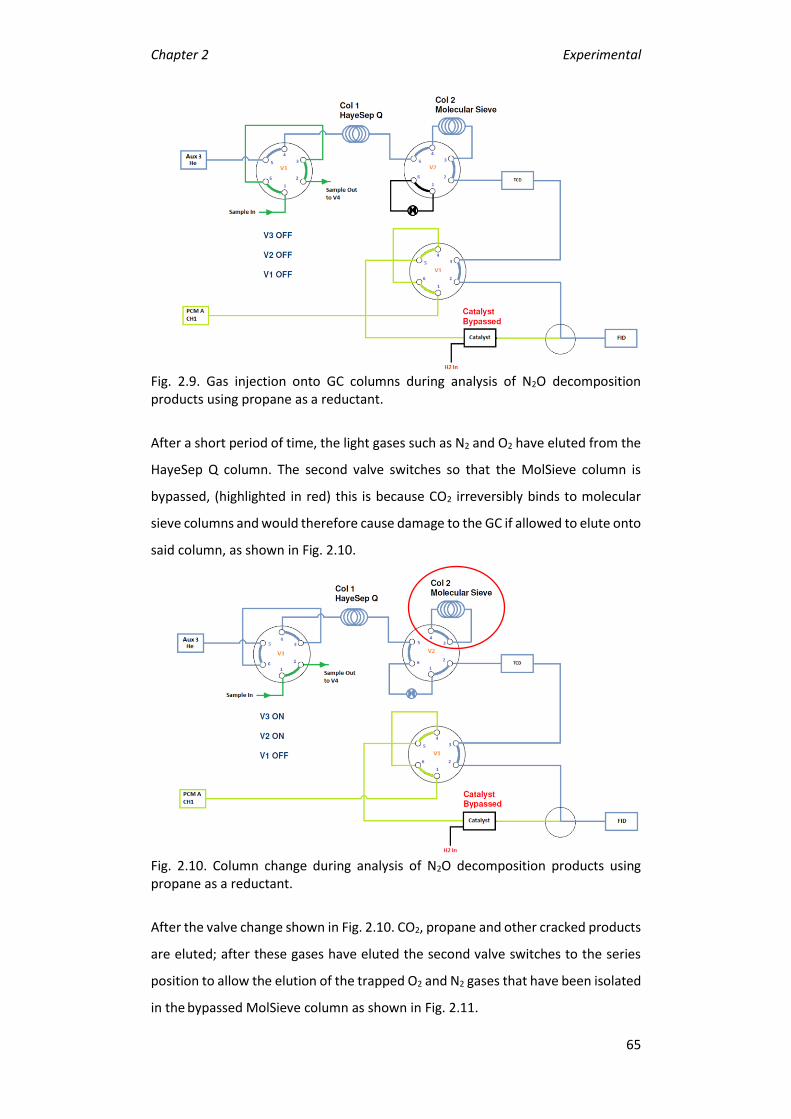
Chapter 2 Experimental
65
Fig. 2.9. Gas injection onto GC columns during analysis of N2O decomposition products using propane as a reductant.
After a short period of time, the light gases such as N2 and O2 have eluted from the
HayeSep Q column. The second valve switches so that the MolSieve column is
bypassed, (highlighted in red) this is because CO2 irreversibly binds to molecular
sieve columns and would therefore cause damage to the GC if allowed to elute onto
said column, as shown in Fig. 2.10.
Fig. 2.10. Column change during analysis of N2O decomposition products using propane as a reductant.
After the valve change shown in Fig. 2.10. CO2, propane and other cracked products
are eluted; after these gases have eluted the second valve switches to the series
position to allow the elution of the trapped O2 and N2 gases that have been isolated
in the bypassed MolSieve column as shown in Fig. 2.11.

Chapter 2 Experimental
66
Fig. 2.11. Column change and methaniser utilisation during analysis of N2O decomposition products using propane as a reductant.
Finally the methaniser (Ni catalyst at 350 °C) must be brought inline to allow the
combustion of all gases to methane before being analysed by the FID, as shown in
Fig. 2.11. This is done so that CO2 and CO can be analysed on the FID channel rather
than the TCD channel and give better response.
To achieve an effective separation and elution of all products the column oven was
set to an isothermal program at 125 °C. Analytes were identified by comparing their
retention times with those of commercial standards. O2, N2 and N2O were detected
in the TCD channel whilst C3H8, CO2, CO and other carbon based products were
detected in the FID channel that is fitted with a methaniser. TCD is a universal
detector generally used for the detection of gaseous compounds by measuring the
difference in thermal conductivity of the analyte gas and the carrier gas. FID is
commonly used in the industry for the determination of hydrocarbon
concentrations based on the detection of ions formed during the combustion of
hydrocarbons in a hydrogen flame, with the response being proportional to the
concentrations of hydrocarbon present.

Chapter 2 Experimental
67
The retention times for all products are as follows:
Table 2.3. Retention times of all analytes seen in GC chromatograph.
Compound TCD Retention Time (min) FID Retention Time (min)
Carbon Dioxide 2.75 2.75
Nitrous Oxide 3.1 -
Water 5.44 -
Ethene - 3.95
Ethane - 4.42
Propene - 10.58
Propane - 11.54
Oxygen 14.54 -
Nitrogen 15.59 -
Methane - 17.8
Carbon Monoxide 18.62 18.62
Quantitative analysis was performed by quantifying reactants consumed and
products formed.
Propane and N2O conversion (%) were determined from the gas consumption with
the difference between the inlet and outlet concentration using the following
equations:
𝑃𝑟𝑜𝑝𝑎𝑛𝑒 𝑐𝑜𝑛𝑣𝑒𝑟𝑠𝑖𝑜𝑛 (%) = ((𝐶3𝐻8𝑖𝑛
− 𝐶3𝐻8𝑜𝑢𝑡
𝐶3𝐻8𝑖𝑛
) ∗ 100)
Eq. 10. Equation showing how propane conversion is calculated.
𝑁2𝑂 𝑐𝑜𝑛𝑣𝑒𝑟𝑠𝑖𝑜𝑛 (%) = ((𝑁2𝑂𝑖𝑛 − 𝑁2𝑂𝑜𝑢𝑡
𝑁2𝑂𝑖𝑛) ∗ 100)
Eq. 11. Equation showing how N2O conversion is calculated.
All products (apart from water) were calibrated for by injecting known
concentrations of each gas. The response factor (RF = peak area/analyte
concentration) was obtained from the calibration plot that correlates the
concentration with peak area.
Blank experiments conducted in an unfilled reactor tube showed insignificant
activity over the temperature range tested. Repeat experiments were performed

Chapter 2 Experimental
68
to enable the error of the testing methodology to be calculated, with an error of ±
3 % N2O conversion. Where propane was present in the reaction carbon balances
were in the range of 100 ± 5 %.
Error bars are not shown through this thesis as the errors produced are so small
that the bars are smaller than the figure icons used on the graphs and are therefore
not visible.
Repeat experiments were performed for all catalyst tests, along with most
characterisation data that has a source of intrinsic error that could not be
eliminated. For example, BET surface area measurements are an average of three.
Where there was doubt over an XRD measurement, these were performed again to
check any phases present. If the decomposition pathway of a catalyst precursor
was not comparable to literature the TGA was run again. For some techniques, it
was only possible to run the analysis once, such as ICP, SS NMR, HAADF-STEM and
XPS where there are costs associated with the analysis. In some catalyst cases it
was not possible to perform repeats due to limited catalyst quantity produced, i.e.
a used catalyst.
2.5 References
1 G. Pekridis, C. Athanasiou, M. Konsolakis, I. V. Yentekakis and G. E.
Marnellos, Top. Catal., 2009, 52, 1880–1887.
2 M. Morad, M. Sankar, E. Cao, E. Nowicka, T. E. Davies, P. J. Miedziak, D. J.
Morgan, D. W. Knight, D. Bethell, A. Gavriilidis and G. J. Hutchings, Catal. Sci.
Technol., 2014, 4, 3120–3128.
3 M. M. Forde, L. Kesavan, M. I. Bin Saiman, Q. He, N. Dimitratos, J. A. Lopez-
Sanchez, R. L. Jenkins, S. H. Taylor, C. J. Kiely and G. J. Hutchings, ACS Nano,
2014, 8, 957–969.
4 M. M. Forde, R. D. Armstrong, R. McVicker, P. P. Wells, N. Dimitratos, Q. He,
L. Lu, R. L. Jenkins, C. Hammond, J. A. Lopez-Sanchez, C. J. Kiely and G. J.
Hutchings, Chem. Sci., 2014, 3603–3616.
5 M. A. Peña and J. L. G. Fierro, Chem. Rev., 2001, 101, 1981–2017.
6 P. N. Trikalitis and P. J. Pomonis, Appl. Catal. A Gen., 1995, 131, 309–322.

Chapter 2 Experimental
69
7 S. Ishikawa, D. R. Jones, S. Iqbal, C. Reece, D. J. Morgan, D. J. Willock, P. J.
Miedziak, J. K. Bartley, J. K. Edwards, T. Murayama, W. Ueda and G. J.
Hutchings, Green Chem., 2017, 19, 225–236.
8 J. Yuan, S. S. Li, L. Yu, Y. M. Liu, Y. Cao, H. Y. He and K. N. Fan, Energy Environ.
Sci., 2013, 6, 3308–3313.
9 L.-C. Wang, Q. Liu, M. Chen, Y.-M. Liu, Y. Cao, He and K.-N. Fan, J. Phys. Chem.
C, 2007, 111, 16549–16557.
10 U. Holzwarth and N. Gibson, Nat. Nanotechnol., 2011, 6, 534.
11 P. Scherrer, Göttinger Nachrichten Math. Phys., 1918, 2, 98–100.
12 International Centre for Diffraction Data,
www.icdd.com/profile/overview.htm, 03-05–2018.
13 A. Cheetham and P. Day, Solid State Chemistry Techniques, Oxford Science
Publications, 1st edn., 1987.
14 J. W. Niemantsverdriet and I. Chorkendorff, Concepts of Modern Catalysis
and Kinetics, Wiley, 1st edn., 2003.
15 T. Gilson and P. Hendra, Laser Raman Spectroscopy, John Wiley & Sons Ltd,
United Kindgom, 1st edn., 1970.
16 A. Cheetham and P. Day, Solid-State Chemistry: Techniques, United
Kindgom, 1st edn., 1990.
17 L. Smart and E. Moore, Solid State Chemistry: An Introduction, Taylor &
Francis, United States, 3rd edn., 2005.
18 Agilent Technologies,
http://www.chem.agilent.com/Library/brochures/5991-3696EN.pdf, 2013,
20-05–2018.
19 E. Metcalfe, Atomic Absorption and Emission Spectroscopy, Wiley-Blackwell,
1st edn., 1987.
20 P. A. Webb, MIC Tech. Publ., 2003, 13, 1–4.
21 S. Brunauer, P. H. Emmett and E. Teller, J. Am. Chem. Soc., 1938, 60, 309.
22 G. Rothenberg, in Applied Organometallic Chemistry, Wiley-VCH Verlag

Chapter 2 Experimental
70
GmbH & Co. KGaA, 2008, vol. 22, pp. 412–412.
23 K. W. Kolasinski, Surface Science: Foundations of Catalysis and Nanoscience,
Wiley-Blackwell, 2nd edn., 2008.
24 G. Attard and C. Barnes, Surfaces, Oxford University Press, 1st edn., 1998.
25 J. W. Niemantsverdriet, Spectroscopy in Catalysis, Wiley-VCH Verlag GmbH
& Co. KGaA, 3rd edn., 2000.
26 R. A. Schoonheydt, Chem. Soc. Rev., 2010, 39, 5051–5066.
27 K. P. De Jong, Synthesis of Solid Catalysts, Wiley-VCH Verlag GmbH & Co.
KGaA, 1st edn., 2009, vol. 39.
28 J. Park and J. R. Regalbuto, J. Colloid Interf. Sci., 1995, 175, 239–252.

Chapter 3 Identifying active Fe species for N2O decomposition
71
3 Identifying the active Fe species for
N2O decomposition in Fe-ZSM-5 catalysts
3.1 Abstract
The influence of active Fe species on the decomposition of N2O over Fe-ZSM-5
catalysts prepared by Chemical Vapour Impregnation (CVI) were investigated. Two
parent H-ZSM-5 zeolites (Si:Al ratio 23 or 30) were used to prepare various weight
loadings of Fe-ZSM-5 catalysts. Initially Si:Al ratio and Fe weight loading were tested
before focussing on the effect of acid treatment and Fe speciation on a single
weight loading. Characterisation by UV/vis, XPS and ICP-OES showed that acid
washing lead to a reduction of ca. 60 % Fe loading compared to the parent 0.4 wt. %
Fe-ZSM-5 catalyst. At 600 °C, the TOF of N2O decomposition increased from 1.60 s-
1 for the parent catalyst to 3.99 s-1 for the acid washed catalyst with a weight loading
of 0.16 %. The rate limiting step of this reaction is the removal of oxygen from the
surface of the catalyst after the decomposition of N2O has taken place. Therefore
propane was added to the gas feed as a reductant to remove any inhibiting oxygen
species that remain on the surface of the catalyst. When propane is present the
loading of Fe is not important as it is possible to achieve similar decomposition
levels using both high and low loaded catalysts. However, when only N2O is present
in the gas feed, low metal loadings Fe-ZSM-5 catalysts are not capable of achieving
high conversions due to the low proximity of active framework Fe3+ ions and extra-
framework α-Fe species, which limits oxygen recombination and desorption. Acid
washing removes Fe from these active sites and deposits it on the surface of the
catalyst as FexOy, leading to a drop in activity. UV/Vis spectroscopy was used to
identify the Fe species present in the catalyst and to speculate on the active species.
High loadings of Fe do not lead to an active catalyst when propane is present, due
to the formation of FexOy nanoparticles and clusters during catalyst preparation.
These are inactive species which lead to a decrease in overall efficiency of the Fe
ions and consequentially a lower TOF.

Chapter 3 Identifying active Fe species for N2O decomposition
72
3.2 Keywords
Nitrous Oxide, Iron Zeolites, Fe-ZSM-5, N2O Decomposition, Acid Washing, Iron
Species, Chemical Vapour Impregnation, UV/Vis, XPS.
3.3 Introduction
Iron zeolites have been commonly used for the decomposition of N2O 1, with H-
ZSM-5 frequently being used as a support.2–4 Low Si:Al ratios are necessary for high
N2O conversion, due to the presence of active Fe species that form on the Al moiety
of the zeolite framework. Therefor low Si:Al ratios can lead to a higher
concentration of active species. 2,5,6
During the decomposition of N2O, the rate limiting step is the recombination of
oxygen to form O2, as N2O binds to the active site, N2 desorbs, leaving an oxidised
active site. Adding a reductant to the gas feed can promote the removal of oxygen
and increase the rate of reaction at lower temperatures. Propane 5,7–10 ethane,
methane and CO 5,11–15 have all been used as a reductant.
When iron is deposited on zeolites it is possible to form four distinct Fe species: 5,16–
18
• Framework Fe3+,
• Isolated Fe3+ or Fe2+,
• Fe oxo-species,
• FeOx species.
Extra framework Fe is considered the active species, due to having the ability to
form α-Oxygen.19–25 α-Oxygen is formed by decomposing N2O over reversible redox
α-Fe sites that have the capacity to switch between Fe2+ and Fe3+ as shown in the
mechanism below.26,27
N2O + (Fe2+)α (Fe3+ - O·-)α + N2 28
The aim of this chapter is to investigate the importance of different Fe species in
Fe-ZSM-5 for the decomposition of N2O in the presence and absence of a reductant,
such as propane. In addition, comparing different Fe loadings, the merit of acid
washing to increase the efficiency of the Fe in the active catalyst is discussed. UV-

Chapter 3 Identifying active Fe species for N2O decomposition
73
Vis spectroscopy used to identify the different Fe species, and to suggest the active
Fe component for N2O decomposition.
3.4 Effect of Si:Al ratio and Fe loading
Various weight loading Fe-ZSM-5 catalysts were prepared by chemical vapour
impregnation, using both 23 and 30 Si:Al ratio, and calcined at 550 °C in static air
for 3 hours at 10 °C min-1. Initially 0.4 wt. % and 1.25 wt. % iron loadings were
prepared and the effect of Si:Al investigated, with further 0.16 wt. % and 2.5 wt. %
Fe loadings prepared and characterised to find a suitable catalyst for acid washing.
0.4 wt. % Fe catalyst was acid washed by 10 v/v% HNO3 at 50 °C for 10 min to
produce a catalysts with a final Fe weight loading of 0.16 wt. %. A 0.16 wt. % Fe
catalyst prepared by CVI for comparison.
Catalysts were tested under two regimes, N2O only (5 % N2O, balance He) or N2O
and Propane (5 % N2O, 5 % C3H8, balance He) over the temperature range of 400 –
600 °C, with a total flow of 100 ml min-1, using 0.06 g catalyst.
Fe-ZSM-5 catalysts with Fe loadings of 0.4 wt. % and 1.25 wt. % and Si:Al ratios of
23 or 30 were tested for N2O decomposition. From the data shown in Table 3.1 it is
clear that the lower Si:Al ratio catalysts exhibit a higher relative activity. This is in
part due to the increased amount of aluminium present within the support that
enables the formation of Fe-Al sites which have been shown previously to be the
active site for N2O decomposition. 2,5,6 This in turn explains why a lower Fe:Al ratio
leads to a higher activity (Table 3.1). Which is due to the increased Al content, and
therefore an increased number of Fe-Al sites (α-Fe). α-Fe species can only form on
Al sites, as the term refers to Fe that is coordinated to Al, therefore the more Al the
more α-Fe that is possible to form. Decomposition of N2O leads to oxidised α-Fe
sites remaining on the surface of the catalyst, these sites preventing turnover of
N2O. When propane is added to the gas stream the gas acts a reductant and reduces
the oxidised α-Fe increasing the TOF.24,29–33 Higher Fe loadings also increase the
activity of the catalysts, this is due to the increased number of active sites that could
be present. Due to the higher activity of the Fe-ZSM-5 (23) parent zeolite catalyst,
further investigation was carried out on the zeolite with this Si:Al ratio.5

Chapter 3 Identifying active Fe species for N2O decomposition
74
Table 3.1. Influence of Fe:Al ratio on 0.4 wt. % Fe and 1.25 wt. % Fe-ZSM-5 for N2O Decomposition both with and without propane present.
Catalyst Fe:Al Ratio N2O conversion
at 550 °C without
propane (%)
N2O conversion
at 550 °C with
propane (%)
0.4 wt. % Fe-ZSM-5 (23) 0.072 20 90
0.4 wt. % Fe-ZSM-5 (30) 0.092 12 81
1.25 wt. % Fe-ZSM-5 (23) 0.224 35 81
1.25 wt. % Fe-ZSM-5 (30) 0.288 29 68
Reaction Conditions: Total flow rate 100 ml min-1, 0.06 g catalyst, temperature range 400-600 °C, GHSV 45000 h-1, either 5 % N2O/He or 5 % N2O, 5 % C3H8 in He.
UV/Vis spectroscopy was performed on the various catalysts to understand how
the Si:Al ratio effects the species of Fe present after preparation (Fig. 3.1). When Fe
is supported on H-ZSM-5, the four UV-active species absorb at 200-250 nm (isolated
Fe3+ in framework sites), 250-350 nm (isolated or oligomeric extra framework Fe
species in zeolite channels), 350-450 nm (iron oxide clusters) and > 450 nm (large
surface oxide species).17,34 Fig. 3.1 illustrates the correlation between a lower Si:Al
ratio and the increased density of extra-framework α-Fe due to higher relative
absorbance in the region 250-350 nm.
Fig. 3.1. UV/Vis spectra of a series of Fe-ZSM-5 (23 or 30) catalysts and H-ZSM-5 support. - Framework Fe3+, - Extra framework α-Fe species, - FexOy clusters, - Large FexOy species. a - H-ZSM-5 (23), b – H-ZSM-5 (30), c – 0.4 wt. %Fe-ZSM-5 (23), d – 0.4 wt. % Fe-ZSM-5 (30), e – 1.25 wt. % Fe-ZSM-5 (23), f – 1.25 wt. % Fe-ZSM-5 (30), g – 2.5 wt. % Fe-ZSM-5 (23).

Chapter 3 Identifying active Fe species for N2O decomposition
75
An additional Fe-ZSM-5 (23) catalyst with a 2.5 wt. % weight loading was prepared
and compared to the 0.4 and 1.25 wt. % catalysts. Fig. 3.2 (closed symbols) shows
how the conversion of N2O of the three Fe-ZSM-5 (23) catalysts changes over the
temperature range of 400 – 600 °C. The supports were tested to confirm that the
supports alone are not active for the decomposition of N2O. The increase in weight
loading of Fe in Fe-ZSM-5 lead to an increase in conversion of N2O up to 70 % over
the 1.25 wt. % catalyst, compared to 40 % conversion over the 0.4 wt. % Fe-ZSM-5
catalyst. However, increasing the weight loading further to 2.5 % did not increase
the conversion further (Fig. 3.2). The lower loaded 0.4 wt. % Fe catalyst showed
limited activity despite the presence of active extra-framework α-Fe from analysis
of the UV/Vis spectra (Fig. 3.1). It is possible that this is due to the rate limiting
oxygen recombination step, after decomposition α-Fe become oxidised and
inactive, with the proximity of the adsorbed oxygen species to combine and form
molecular oxygen and regenerate the active site not close enough, therefore,
effectively leaving the α-Fe site blocked. It is important to note that the three
weight loading catalysts all achieved similar activity at lower temperatures. This is
because the catalyst activity is limited by the proximity of active sites, as described
previously. When the activity is low all active sites can be used with out needing to
be regenerated. The theory of the active sites being blocked by oxygen could be
tested by stopping the flow of N2O and continuing to heat the catalyst. If oxygen is
seen then this is generated form the removal of O2 from the active site, the catalyst
could then be cooled and N2O added back into the stream and a higher conversion
should be noted.

Chapter 3 Identifying active Fe species for N2O decomposition
76
Fig. 3.2. The influence of Fe weight loading on N2O conversion over Fe-ZSM-5 catalysts. Closed symbols: N2O present 5 % N2O/He, Open Symbols: N2O + Propane present: 5 % N2O, 5 % C3H8 in He, - 0.4 wt. % Fe-ZSM-5 (23), - 1.25 wt. % Fe-ZSM-5 (23), - 2.5 wt. % Fe-ZSM-5 (23). Conditions; total flow rate 100 ml min-1, 0.06g catalyst, temperature range 200-600 °C, GHSV 45000 h-1.
Higher loadings of Fe lead to a higher proportion of active framework and extra-
framework species. In the N2O only reactions, this increased density of active sites
leads to an increase in the rate of oxygen recombination and therefore a higher N2O
conversion due to the regeneration of active sites. UV/Vis spectroscopy (Fig. 3.1.)
shows that there are number of appreciable Fe species present in the high loading
catalysts, especially noting the high proportion of FeOx nano-particle and cluster
species, which are not active for N2O decomposition,3,25,35 indicating that not all Fe
present is utilised for the reaction. Therefore, while a significant proportion of Fe
is not active, there is a high concentration of active α-Fe that can allow oxygen
recombination and efficient, high N2O conversion.
The presence of a reductant such as propane shifts the N2O decomposition activity
to 400 – 450 °C from a much higher temperature of > 600 °C (Fig. 3.2. open
symbols). Propane is acting as a reductant 5,8,10,36,37 by removing any remaining
oxygen that blocks the α-Fe active sites, and lowers the rate of N2O decomposition.
Thereby, oxygen recombination is the rate-limiting step in the reaction. Propane

Chapter 3 Identifying active Fe species for N2O decomposition
77
activates the oxidised α-Fe sites forming CO and CO2 in the process, this
regeneration cycle allows the reaction to proceed.31,32,38–40 At low temperatures (<
450 °C) minor quantities of propene (90 % selectivity at < 6 % conversion) are
produced by oxidative dehydrogenation of propane alongside some ethene and
ethane via a cracking mechanism. However, at higher temperatures the selectivity
shifts exclusively to combustion products such as CO and CO2.
XPS was performed on the series of Fe-ZSM-5 catalysts. Typically, metal oxide O 1s
binding energies are around 529 – 530 eV, this corresponds to the Fe-O fitting seen
at 529.9 eV in Fig. 3.3. 41 Typically Al-O and Si-O binding energies are seen around
531 and 532.9 eV respectively. 41–43 This relates to the fitting at 532.5 eV, this is a
combination of both Al-O and Si-O bonding as found in the ZSM-5 framework.44–46
With more Si present in the zeolite framework, the binding energy is shifted to a
higher value compared to Al-O to represent the distribution of the framework. This
is more evident in the O 1s XPS spectrum of the H-ZSM-5 zeolites; in the (23) zeolite
there is more Al present than in the (30) zeolite and therefore the binding energy
is shifted closer to that of Al-O than Si-O. In the case of Fe-O species, the higher the
Fe weight loading the more Fe-O seen in the XPS spectra. This is due to the
increased % of bulk Fe-O found within the catalyst as confirmed by UV/Vis
spectroscopy, this is especially true in the 1.25 wt. % Fe-ZSM-5 (23) and (30) and
the 2.5 wt. % Fe-ZSM-5 (23) catalysts.
Comparing the reaction data (Fig. 3.2.), UV/Vis spectroscopy (Fig. 3.1.), and XPS
oxygen region (Fig. 3.3.), it is possible to observe that the more active catalyst have
a higher proportion of framework and extra framework α-Fe species. In the case of
the 0.4 wt. % Fe-ZSM-5 catalyst, UV/Vis spectroscopy shows a major absorbance in
the region that correlates to framework and extra framework α-Fe species, with
only a small absorbance due to FeOx nanoparticles and bulk species. XPS of the O
region confirms the limited presence of these species. When considering the poor
activity of the 1.25 wt. % Fe-ZSM-5 catalyst, it is possible to connect this to the
presence of FeOx nanoparticles and bulk species: UV/Vis shows a large absorbance
due to these species, and XPS shows a large split in the oxygen environment, with
a large response due to Fe-Ox compared to lower loadings.

Chapter 3 Identifying active Fe species for N2O decomposition
78
Fig. 3.3. XPS data of the O 1s region of H-ZSM-5 (23) and (30) and various Fe-ZSM-5 (23) and (30) catalysts. Legend: Red – O-ZSM-5 fitting, Blue – Fe-Ox fittings.
3.5 Acid Washing Fe-ZSM-5 catalysts
Peneau et al. showed that, by using dilute HNO3, it is possible to remove excess iron
and spectator species from the catalyst; the group investigated the effect of acid
washing on the selective oxidation of ethane by H2O2.18 They showed it was possible
to increase both the the catalytic activity and stability of the catalysts by acid
washing for short periods of time. The 0.4 wt. % Fe-ZSM-5 (23) catalyst was selected
for acid washing due to the presence of extra-framework α-Fe species and minor
levels of spectator FexOy nano-particulates and clusters. Furthermore, previous
work with acid washing in the group has shown it is difficult to distinguish between
the Fe species present at higher weight loadings.47,48 For the calcined catalyst, post-
acid washing ICP-OES analysis showed a reduction in the Fe loading to 0.16 wt. %
compared to 0.4 wt. % of the parent material.
Fig. 3.4a demonstrates the activity of the as prepared parent catalyst, the acid
washed catalyst, a 0.16 wt. % Fe-ZSM-5 (prepared by CVI for comparison to the AW
catalyst), and the analogous H-ZSM-5 supports. The supports were tested to
confirm that the supports alone are not active for the decomposition of N2O. The

Chapter 3 Identifying active Fe species for N2O decomposition
79
parent catalyst [0.4 wt. % Fe-ZSM-5 (23)] has a conversion of 40 % at 600 °C,
however, when comparing this to the acid washed catalyst the conversion at 600 °C
was lower, at 25 %. It is thought that this difference in activity is due to the removal
of framework Fe3+ ions, which are extracted and deposited on the surface of the
catalyst as nanoparticles of FeOx. This is complemented by UV/Vis spectroscopy
(Fig. 3.5), which shows there is a decrease in intensity at 250 nm due to extra-
framework Fe and an increase in intensity at 350 nm due to FeOx species. In the low
loaded 0.16 wt. % Fe-ZSM-5 (23) catalyst, UV/Vis spectroscopy shows that only
framework Fe3+ and extra-framework α-Fe species of Fe are present. The high
intensity of active sites (frame work and extra-framework α-Fe species) should
produce a catalyst that has a high activity, however, this is not the case. The low
loading and high dispersion of Fe means that the proximity of Fe species to each
other is very low; the proximity is crucial to achieve high activity in N2O
decomposition. 49–51 When propane is present in the gas feed (Fig. 3.4b) the
proximity of the active sites is not as closely linked to the activity, as propane can
remove oxygen to form COx and regenerate the Fe active site in the process.

Chapter 3 Identifying active Fe species for N2O decomposition
80
Fig. 3.4. Influence of Fe loading and acid washing over Fe-ZSM-5 catalysts for N2O conversion; - 0.16 wt. % Fe-ZSM-5 (23), - 0.4 wt. % Fe-ZSM-5 (23), - 0.4 wt. % Fe-ZSM-5 (23) Acid washed, - H-ZSM-5 (23), - H-ZSM-5 (23) Acid washed. (a) Closed symbols: Conditions; 5 % N2O/He, total flow rate 100 ml min-1, 0.06g catalyst, temperature range 400-600 °C, GHSV 45000 h-1. (b) Open symbols: Conditions; 5 % N2O, 5 % C3H8 in He total flow rate 100 ml min-1, 0.06g catalyst, temperature range 400-600 °C, GHSV 45000 h-1.
(a)
(b)

Chapter 3 Identifying active Fe species for N2O decomposition
81
Fig. 3.5. UV/Vis spectra of a series of Fe-ZSM-5 (23) catalysts and H-ZSM-5 support. - Framework Fe3+, - Extra framework α-Fe species, - FexOy clusters, - Large FexOy species. a - H-ZSM-5 (23), b – H-ZSM-5 (23) AW, c - 0.16 wt. % Fe-ZSM-5 (23), d – 0.4 wt. % Fe-ZSM-5 (23), e – 0.4 wt. % Fe-ZSM-5 (23) AW, f – 1.25 wt. % Fe-ZSM-5 (23), g – 2.5 wt. % Fe-ZSM-5 (23)
UV/Vis spectroscopy enabled the influence of Fe loading on N2O decomposition
with and without propane to be investigated further. In the parent zeolite H-ZSM-
5 (23), UV/Vis shows an absorbance at 220 nm (Fig. 3.5.) which indicates that
framework Fe3+ species are present, these are likely to be impurities from the
manufacturing process.52 UV/Vis spectroscopy shows that during acid washing of
H-ZSM-5 (23) the framework Fe3+ species are re-dispersed with extra framework Fe
species now present in the support. The absorbance at 300 nm has increased in
intensity, meaning more extra framework Fe species present. Based on the
absorbance at 250 and 280 nm, the 0.16 wt. % Fe-ZSM-5 has both framework and
extra-framework Fe ions, whereas both the 1.25 wt. % and 2.5 wt. % Fe-ZSM-5
catalysts have all species of Fe present with absorbances at 250 nm (framework),
280 nm (extra-framework Fe), 400 nm (FeOx nanoparticles) and 450 nm (large FeOx
clusters). The presence of FeOx species are confirmed by studying the oxygen region

Chapter 3 Identifying active Fe species for N2O decomposition
82
in XPS. The UV/Vis spectra of 1.25 wt. % and 2.5 wt. % show the four different
species (Fig. 3.5.); in the 0.4 wt. % Fe-ZSM-5 catalyst there are three species of Fe
present: framework Fe3+, extra-framework α-Fe and large FeOx clusters. After acid
washing, the iron has been re-distributed (the same as the acid washed support),
with now four species of Fe present. The most important change however is the
drop-in intensity of the absorbance due to the extra-framework α-Fe species, these
have been extracted and deposited as FeOx nanoparticles and clusters.
Further characterisation with XPS (Table 3.2) and surface area analysis (Table 3.3)
was performed on a selection of catalysts. XPS measurements revealed the drastic
loss of Fe from the surface of the catalyst following acid washing, with the atomic %
of Fe falling from 2.02 to 0.28 %, which was accompanied by a large loss in intensity
of the Fe peak (Fig. 3.6). A decrease in the surface to bulk Fe ratio was observed
using XPS and ICP-OES, from 5.05 for the 0.4 wt. % Fe-ZSM-5 (23) catalyst to 1.75
after acid washing. This confirmed that Fe was preferentially removed from the
surface of the catalyst rather than from the micro-porous channels. The Fe 2p XPS
binding energy for both the 0.4 wt. % Fe-ZSM-5 (23) calcined and acid washed was
711 eV, with a satellite binding energy of 719 eV, that indicates Fe3+ species are
present.53,54 Once Fe has been added to the zeolite support, the binding energy of
both Al and Si shift to a higher value. With Al moving from 102.9 eV in H-ZSM-5 to
103.4 eV in the Fe catalysts, and Si shifting from 74.1 eV to 74.9 eV. The shift in
binding energy of the constituent zeolite framework elements confirms the
presence of framework Fe3+ species and that Fe has substituted into the zeolite
lattice.55–57

Chapter 3 Identifying active Fe species for N2O decomposition
83
Fig. 3.6. XPS data of the Fe region of various Fe-ZSM-5 (23) catalysts, including calcined and acid washed catalysts.

Chapter 3 Identifying active Fe species for N2O decomposition
84
Table 3.2. Surface composition, Fe binding energies of a series of Fe-ZSM-5 (23) + (30) catalysts and H-ZSM-5 (23) + (30) supports as reported by XPS analysis.
Catalyst Al 2p (at%)
O 1s (at%)
Si 2p (at%)
Fe 3p (at%)
Al Binding energy
(eV)
Si Binding Energy
(eV)
Fe Binding energy
(eV)
Fe satellite Binding
energy (eV)
H-ZSM-5 (23) 3.33 62.77 33.90 - 102.9 74.1 - -
H-ZSM-5 (23) AW 1.96 70.02 28.02 - 103.6 75.3 - -
0.4 wt. % Fe-ZSM-
5 (23) 2.58 63.36 32.13 1.91 103.4 74.9 711.2 719.0
0.4 wt. % Fe-ZSM-
5 (23) AW 2.72 63.20 33.70 0.39 103.5 74.7 711.0 719.0
0.16 wt. % Fe-
ZSM-5 (23) 2.60 69.70 27.30 0.41 103.5 74.7 711.8 -
1.25 wt. % Fe-
ZSM-5 (23) 2.36 56.88 28.44
12.3
2 103.6 75.0 711.2 718.9
2.5 wt. % Fe-ZSM-
5 (23) 3.21 61.32 27.38 8.09 102.9 74.7 711.1 718.9
H-ZSM-5 (30) 1.91 63.12 34.97 - 103.0 74.3 - -
0.4 wt. % Fe-ZSM-
5 (30) 1.82 63.27 34.39 0.52 103.3 74.8 710.3 -
1.25 wt. % Fe-
ZSM-5 (30) 1.44 68.66 26.52 3.37 103.5 74.5 711.3 719.0
Surface area measurements were performed on all catalysts. For the H-ZSM-5 (23)
catalysts the surface area remained constant at around 430 m2 g-1, and for the H-
ZSM-5 (30) catalysts remained at around 350 m2 g-1 after iron loading. The
micropore volume of H-ZSM-5 (23) was calculated to be 0.167 cm3 g-1, which varies
slightly when iron is added (± 0.022 cm3 g-1) (Table 3.3). However, the micropore
volume does not greatly change after acid washing has been performed (± 0.005
cm3 g-1). The consistency of the surface area and micropore volume during catalyst
preparation, calcination and acid washing suggests that H-ZSM-5 is stable under
pre-treatment conditions.

Chapter 3 Identifying active Fe species for N2O decomposition
85
Table 3.3. Surface area and micropore volume of a series of Fe-ZSM-5 (23) + (30) catalysts and H-ZSM-5 (23) + (30) supports.
Catalyst Surface Area (m2 g-1) Micropore Volume (cm3 g-1)
H-ZSM-5 (23) 423 0.167
0.4 wt. % Fe-ZSM-5 (23) 437 0.169
0.4 wt. % Fe-ZSM-5 (23) AW 428 0.164
0.16 wt. % Fe-ZSM-5 (23) 402 0.152
1.25 wt. % Fe-ZSM-5 (23) 379 0.145
2.5 wt. % Fe-ZSM-5 (23) 401 0.152
H-ZSM-5 (30) 345 0.129
0.4 wt. % Fe-ZSM-5 (30) 352 0.133
1.25 wt. % Fe-ZSM-5 (30) 375 0.149
Degas conditions – 9 h at 250 °C prior to analysis.
It was not possible to see any Fe reflections in the XRD patterns of Fe-ZSM-5 (23)
catalysts (Fig. 3.7), due to the detection limit on small particles being less than 5
nm, which indicates the all Fe present is < 5 nm in size. This is in line with previous
characterisation data, in which we see only framework and extra-framework
species and some nanoparticles of FeOx, with very few bulk species seen. However,
there are notable changes in the spectrum, such as the changes in intensity of the
(011) and (200) reflections at 7.94 ° and 8.90 °. These intense low 2θ reflections
tell us a great deal of information about the amount of aluminium present: higher
Al content will lead to higher intensity of reflections at these low 2θ values.58–60 Fig.
3.7 illustrates the decrease in intensity of these reflections after acid washing
indicating that some Al has been removed during this process.

Chapter 3 Identifying active Fe species for N2O decomposition
86
Fig. 3.7. XRD pattern of H-ZSM-5 (23) and various Fe-ZSM-5 (23) catalysts.
It is extremely difficult to resolve the active Fe species, therefore turnover
frequency (TOF) over the catalysts was calculated for N2O decomposition (Fig. 3.9a)
using the total moles of Fe present in the catalyst using Eq. 2. The decision to use
total moles was taken after trying to resolve the active species in UV/Vis
spectroscopy (Fig. 3.8). Deconvoluting these species is not possible due to the
degree of overlap in the absorbance profile of the species present, and the
subjective nature of fitting peaks to broad spectrums, as shown in Fig. 3.8.
Following on from the subjective nature of the fittings it is also not possible to
quantitatively define the area of each fitting as the UV/Vis spectroscopy was not
performed using the Kubelka Munk model.61 Hence total Fe moles was used for the
TOF calculation as described in Eq. 2.
𝑇𝑢𝑟𝑛𝑜𝑣𝑒𝑟 𝐹𝑟𝑒𝑞𝑢𝑒𝑛𝑐𝑦 (𝑇𝑂𝐹) = 𝑚𝑜𝑙 𝑜𝑓 𝑁2𝑂 𝑐𝑜𝑛𝑣𝑒𝑟𝑡𝑒𝑑 𝑝𝑒𝑟 𝑠𝑒𝑐𝑜𝑛𝑑
𝑡𝑜𝑡𝑎𝑙 𝑚𝑜𝑙 𝑜𝑓 𝐹𝑒 𝑓𝑟𝑜𝑚 𝑠𝑦𝑛𝑡ℎ𝑒𝑠𝑖𝑠 (Eq. 2)

Chapter 3 Identifying active Fe species for N2O decomposition
87
Fig. 3.8. UV-vis spectra of a series of Fe-ZSM-5 (23) catalysts and H-ZSM-5 support. - Framework Fe3+ (blue), - Extra framework species (red), - FeOx clusters (orange), - Large FeOx species (purple). a - H-ZSM-5 (23), b – H-ZSM-5 (23) AW, c - 0.16 wt. %Fe-ZSM-5 (23), d – 0.4 wt. % Fe-ZSM-5 (23), e – 0.4 wt. % Fe-ZSM-5 (23) AW, f – 1.25 wt. % Fe-ZSM-5 (23), g – 2.5 wt. % Fe-ZSM-5 (23).
The 0.16 wt. % Fe-ZSM-5 (23) catalyst achieved a TOF of ca. 3.99 s-1 at 600 °C. The
TOF of the acid washed support H-ZSM-5 (23) at 600 °C is an order of magnitude
greater than the Fe based catalysts when propane is present (Fig. 3.9b). Despite the
N2O conversion being half that of the Fe based catalyst (52 % at 600 °C) the amount
of iron present is only trace (245 ppm) which is located in the framework positions.
Therefore, the parent zeolite has an extremely high TOF due to the ppm of Fe
present, however, a very low yield of nitrogen was observed. It can be reasoned
that the acid washed support shows activity due to the redistribution of iron
through acid washing from the framework position to extra frame-work α-Fe, which
are the active species for N2O decomposition.19,20,25 When comparing the TOF of
the fresh and acid washed Fe catalyst, the TOF increased from 0.69 s-1 to 0.94 s-1 at
600 °C. Though, when comparing the same catalysts when propane is present in
the gas feed the difference in activity is less significant, with both catalysts
achieving 95 % N2O conversion at 550 °C (Fig. 3.9b). The TOF of the acid washed
catalyst is 2 and a half times that of the calcined catalyst (Fig. 3.9b). However, the

Chapter 3 Identifying active Fe species for N2O decomposition
88
TOF over the low loaded 0.16 wt. % Fe-ZSM-5 (23) catalyst is ca. 8.5 s-1 at 550 °C
when propane is present in the gas feed. Compared to literature examples this
catalyst out performs others; Park et al. reported a TOF of 1.8 s-1 for N2O
decomposition at 550 °C using 1.96 wt. % Fe-ZSM-5 (27).62 Compared to the TOF
achieved by the low loaded catalyst of 2.59 s-1 at similar conditions and the same
temperature, this demonstrates the superior activity of the low loaded catalyst
when propane is present.

Chapter 3 Identifying active Fe species for N2O decomposition
89
Fig. 3.9. TOF of N2O decomposition over a series of Fe-ZSM-5 catalysts that have been calcined or acid washed. - 0.16 wt. % Fe-ZSM-5 (23), - 0.4 wt. % Fe-ZSM-5 (23), - 1.25 wt. % Fe-ZSM-5 (23), - 2.5 wt. % Fe-ZSM-5 (23) - 0.4 wt. % Fe-ZSM-5 (23) AW. (a) Closed symbols, Conditions; 5 % N2O/He, total flow rate 100 ml min-1, 0.06g catalyst, temperature range 400-600 °C, GHSV 45000 h-1. (b) Open symbols, Conditions; 5 % N2O, 5 % C3H8 in He, total flow rate 100 ml min-
1, 0.06g catalyst, temperature range 400-600 °C, GHSV 45000 h-1.
(a) N2O
(b) N2O + Propane
Chapter 3 Identifying active Fe species for N2O decomposition
90
3.6 Conclusions
When prepared by CVI, low loaded Fe-ZSM-5 (23) catalysts have only two species
of Fe present, framework Fe3+ and isolated extra framework α-Fe, as shown by
UV/Vis spectroscopy. When higher loadings are prepared by this method, there are
two extra species of Fe present, FeOx nanoparticles and large clusters, these are not
active species for the decomposition of N2O and are, therefore, not desirable. Here
it is shown that framework and extra-framework α-Fe species are active for the
decomposition of N2O and lead to high conversions when a reductant such as
propane is present. For example 0.16 wt. % Fe-ZSM-5 (23) has only the two active
species of Fe present, and out performs all other catalysts even though the loading
of Fe is very low.
However, when the reductant is not present, the activity of the catalysts are limited
by the slow desorption of oxygen that occurs when the Fe species are highly
dispersed and oxygen recombination is inhibited. This oxygen recombination and
desorption becomes the rate limiting step. At higher weight loadings and with only
N2O present in the gas feed, the activity of the catalysts increase as the density of
the active sites increases, increasing the rate of molecular oxygen recombination
and desorption. This is visible in the higher weight loading catalysts with 1.25 wt. %
Fe-ZSM-5 (23) and 2.5 wt. % Fe-ZSM-5 (23) out performing that of the 0.4 wt. % Fe-
ZSM-5 (23) for N2O decomposition. However, as soon as a reductant is added to the
gas feed the catalytic activity is similar at 600 °C between the three weight loadings,
as shown in Fig. 3.2. As described, this is due to the dispersion of the active sites
and the limiting effect this has on the oxygen recombination, which is the rate
determining step; this effect is removed when propane is added as a reductant to
the feed as this cleaves any oxygen atoms and reduces the active site ready for
another incoming N2O molecule.
Initially literature suggested that it would be possible to selectively remove FeOx
nano-particles and clusters from the surface of the catalyst by performing an acid
washing pre-treatment step. However, when acid washing is performed it is not
possible to remove FeOx from the surface of the catalyst but instead Fe is extracted
from pores in the active extra-framework positions and deposited on the surface,
which leads to a decrease in conversion but an increase in TOF. The decrease in
conversion is due to the removal of active α-Fe species, whereas the increase in
Chapter 3 Identifying active Fe species for N2O decomposition
91
TOF is due to the removal of around 60 % of the weight loading of Fe. Although acid
washing did not remove iron as predicted, it did mean that a catalyst with the same
very low weight loading was prepared by chemical vapour impregnation. This low
loading catalyst (0.16 wt. % Fe) has only the active species of Fe present and is the
most active catalyst. The TOF for this catalyst (8.5 s-1) outperforms that of all other
catalysts in the series due to the extremely low Fe weight loading and very high
activity. Park et al. reported a TOF of 1.8 s-1 for N2O decomposition at 550 °C using
1.96 wt. % Fe-ZSM-5 (27).62 Compared to this catalyst, the TOF achieved by the low
loaded catalyst is 2.59 s-1 more active at similar conditions and the same
temperature, therefore demonstrating the superior activity of the low loaded
catalyst when propane is present.
3.7 Future work
Literature shows that steaming pre-treatments can be used to extract Fe from the
pores and into the extra-framework sites,63–67 which would be interesting to study
in future work. The extraction of Fe from pores and into the extra-framework sites
should lead to an increase in conversion as it has been shown that extra-framework
α-Fe sites are active for N2O decomposition. It would be interesting to see the
lowest weight loading of Fe capable of N2O decomposition and whether either the
chemical vapour impregnation preparation method and the steaming pre-
treatment would be able to prepare a catalyst with only α-Fe present.
Characterisation of the used catalysts could lead to the further identification of the
active site and give a better understanding of the catalyst. Another method to
confirm that the active sites are in fact α-Fe and formed on the Al sites in the ZSM-
5 framework would be to prepare the same weight loading catalyst on a silicate
support which has no Al present, and should therefore not be able to form α-Fe and
be an inactive catalyst. Following on from this theory, it would be interesting to
look at even lower SiAl ratio ZSM-5 supports. These would contain a higher
percentage of Al atoms and would further enable the formation of the active α-Fe
species, producing a better catalyst.
3.8 Comments
Figures in this chapter have been reproduced with permission from Springer. 68

Chapter 3 Identifying active Fe species for N2O decomposition
92
3.9 References
1 M. I. Konsolakis, ACS Catal., 2015, 5, 6397–6421.
2 M. Rauscher, K. Kesore, R. Mönnig, W. Schwieger, A. Tißler and T. Turek,
Appl. Catal. A Gen., 1999, 184, 249–256.
3 B. M. Abu-Zied, W. Schwieger and A. Unger, Appl. Catal. B Environ., 2008,
84, 277–288.
4 S. Sklenak, P. C. Andrikopoulos, B. Boekfa, B. Jansang, J. Nováková, L. Benco,
T. Bucko, J. Hafner, J. Ddeek and Z. Sobalík, J. Catal., 2010, 272, 262–274.
5 H. Abdulhamid, E. Fridell and M. Skoglundh, Top. Catal., 2004, 30/31, 161–
168.
6 I. Melián-Cabrera, E. R. H. van Eck, S. Espinosa, S. Siles-Quesada, L. Falco, A.
P. M. Kentgens, F. Kapteijn and J. A. Moulijn, Appl. Catal. B Environ., 2017,
203, 218–226.
7 H. Ohtsuka, T. Tabata, O. Okada, L. M. F. Sabatino and G. Bellussi, Catal.
Letters, 1997, 44, 265–270.
8 H. Ohtsuka, T. Tabata, O. Okada, L. M. . Sabatino and G. Bellussi, Catal.
Today, 1998, 42, 45–50.
9 R. W. Van Den Brink, S. Booneveld, M. J. F. M. Verhaak and F. A. De Bruijn,
Catal. Today, 2002, 75, 227–232.
10 G. Centi and F. Vazzana, Catal. Today, 1999, 53, 683–693.
11 G. Djéga-Mariadassou, F. Fajardie, J. F. Tempère, J. M. Manoli, O. Touret and
G. Blanchard, J. Mol. Catal. A Chem., 2000, 161, 179–189.
12 L. He, L. C. Wang, H. Sun, J. Ni, Y. Cao, Y. He and K. N. Fan, Angew. Chemie -
Int. Ed., 2009, 48, 9538–9541.
13 K. Teramura, T. Tanaka, H. Ishikawa, Y. Kohno and T. Funabiki, J. Phys. Chem.
B, 2004, 108, 346–354.
14 K. Yogo, M. Ihara, I. Terasaki and E. Kikuchi, Chem. Lett., 1993, 22, 229–232.
15 R. Burch and P. K. Loader, Appl. Catal. B Environ., 1994, 5, 149–164.

Chapter 3 Identifying active Fe species for N2O decomposition
93
16 A. Ates, C. Hardacre and A. Goguet, Appl. Catal. A Gen., 2012, 441–442, 30–
41.
17 J. Pérez-Ramírez, J. C. Groen, A. Brückner, M. S. Kumar, U. Bentrup, M. N.
Debbagh and L. A. Villaescusa, J. Catal., 2005, 232, 318–334.
18 V. Peneau, R. D. Armstrong, G. Shaw, J. Xu, R. L. Jenkins, D. J. Morgan, N.
Dimitratos, S. H. Taylor, H. W. Zanthoff, S. Peitz, G. Stochniol, Q. He, C. J.
Kiely and G. J. Hutchings, ChemCatChem, 2017, 9, 642–650.
19 K. Sun, H. Zhang, H. Xia, Y. Lian, Y. Li, Z. Feng, P. Ying and C. Li, Chem.
Commun., 2004, 2480–2481.
20 E. J. M. Hensen, Q. Zhu, M. M. R. M. Hendrix, A. R. Overweg, P. J. Kooyman,
M. V. Sychev and R. A. Van Santen, J. Catal., 2004, 221, 569–583.
21 V. I. Sobolev, G. I. Panov, A. S. Kharitonov, V. N. Romannikov, A. M. Volodin
and K. G. Ione, J. Catal., 1993, 139, 435–443.
22 G. I. Panov, A. S. Kharitonov and V. I. Sobolev, Appl. Catal. A, Gen., 1993, 98,
1–20.
23 G. I. Panov, V. I. Sobolev and A. S. Kharitonov, J. Mol. Catal., 1990, 61, 85–
97.
24 G. D. Pirngruber, J. Catal., 2003, 219, 456–463.
25 J. Pérez-Ramírez, F. Kapteijn and A. Brückner, J. Catal., 2003, 218, 234–238.
26 G. I. Panov, E. V. Starokon, L. V. Pirutko, E. A. Paukshtis and V. N. Parmon, J.
Catal., 2008, 254, 110–120.
27 M. V. Parfenov, E. V. Starokon, L. V. Pirutko and G. I. Panov, J. Catal., 2014,
318, 14–21.
28 Y. K. Chow, N. F. Dummer, J. H. Carter, C. Williams, G. Shaw, D. J. Willock, S.
H. Taylor, S. Yacob, R. J. Meyer, M. M. Bhasin and G. J. Hutchings, Catal. Sci.
Technol., 2017, 154–163.
29 H. Guesmi, D. Berthomieu and L. Kiwi-Minsker, J. Phys. Chem. C, 2008, 112,
20319–20328.
30 C. Sang, B. H. Kim and C. R. F. Lund, J. Phys. Chem. B, 2005, 109, 2295–2301.

Chapter 3 Identifying active Fe species for N2O decomposition
94
31 N. Hansen, A. Heyden, A. T. Bell and F. J. Keil, J. Phys. Chem. C, 2007, 111,
2092–2101.
32 B. R.Wood, J. A. Reimer and A. T. Bell, J. Catal., 2002, 209, 151–158.
33 K. Sun, H. Xia, E. Hensen, R. van Santen and C. Li, J. Catal., 2006, 238, 186–
195.
34 M. S. Kumar, J. Perez-Ramirez, M. N. Debbagh, B. Smarsly, U. Bentrup and
A. Bruckner, Appl. Catal. B Environ., 2006, 62, 244–254.
35 J. Pérez-Ramírez, F. Kapteijn, G. Mul and J. a. Moulijn, Chem. Commun.,
2001, 693–694.
36 H. Ohtsuka, T. Tabata, O. Okada, L. M. F. Sabatino and G. Bellussi, 1997, 44.
37 R. W. Van Den Brink, S. Booneveld, M. J. F. M. Verhaak and F. A. De Bruijn,
in Catalysis Today, 2002, vol. 75, pp. 227–232.
38 C. Sang, B. H. Kim and C. R. F. Lund, J. Phys. Chem. B, 2005, 109, 2295–2301.
39 D. A. Bulushev, L. Kiwi-minsker and A. Renken, Ind. Eng. Chem. Res., 2004,
211, 2004.
40 H. Guesmi, D. Berthomieu and L. Kiwi-Minsker, J. Phys. Chem. C, 2008, 112,
20319–20328.
41 J. C. Dupin, D. Gonbeau, P. Vinatier and A. Levasseur, Phys. Chem. Chem.
Phys., 2000, 2, 1319–1324.
42 A. Y. Stakheev, E. S. Shpiro and J. Apijok, J. Phys. Chem., 1993, 97, 5668–
5672.
43 J. van den Brand, P. C. Snijders, W. G. Sloof, H. Terryn and J. H. W. de Wit, J.
Phys. Chem. B, 2004, 108, 6017–6024.
44 R. B. Borade, A. Adnot and S. Kaliaguine, Zeolites, 1991, 11, 710–719.
45 R. B. Borade, Zeolites, 1987, 7, 398–403.
46 J. M. Stencel, J. R. Diehl, L. J. Douglas, C. A. Spitler, J. E. Crawford and G. A.
Melson, Colloids and Surfaces, 1982, 4, 305–329.
47 Y. K. Chow, N. F. Dummer, J. H. Carter, R. J. Meyer, R. D. Armstrong, C.

Chapter 3 Identifying active Fe species for N2O decomposition
95
Williams, G. Shaw, S. Yacob, M. M. Bhasin, D. J. Willock, S. H. Taylor and G.
J. Hutchings, ChemPhysChem, 2018, 19, 402–411.
48 J. Xu, R. D. Armstrong, G. Shaw, N. F. Dummer, S. J. Freakley, S. H. Taylor and
G. J. Hutchings, Catal. Today, 2016, 270, 93–100.
49 D. A. Bulushev, L. Kiwi-Minsker and A. Renken, J. Catal., 2004, 222, 389–396.
50 L. Kiwi-Minsker, D. A. Bulushev, A. Renken and P. Prechtl, Ind. Eng. Chem.
Res., 2007, 46, 4178–4185.
51 J. Pérez-Ramírez, F. Kapteijn, G. Mul and J. A. Moulijn, J. Catal., 2002, 208,
211–223.
52 C. Hammond, M. M. Forde, M. H. Ab Rahim, A. Thetford, Q. He, R. L. Jenkins,
N. Dimitratos, J. A. Lopez-Sanchez, N. F. Dummer, D. M. Murphy, A. F. Carley,
S. H. Taylor, D. J. Willock, E. E. Stangland, J. Kang, H. Hagen, C. J. Kiely and G.
J. Hutchings, Angew. Chemie - Int. Ed., 2012, 51, 5129–5133.
53 M. C. Biesinger, B. P. Payne, A. P. Grosvenor, L. W. M. Lau, A. R. Gerson and
R. S. C. Smart, Appl. Surf. Sci., 2011, 257, 2717–2730.
54 P. C. J. Graat and M. A. J. Somers, Appl. Surf. Sci., 1996, 100–101, 36–40.
55 S. Södergren, H. Siegbahn, H. Rensmo, H. Lindström, A. Hagfeldt and S.-E.
Lindquist, J. Phys. Chem. B, 1997, 101, 3087–3090.
56 W. Chen, Q. Xu, Y. S. Hu, L. Q. Mai and Q. Y. Zhu, J. Mater. Chem., 2002, 12,
1926–1929.
57 A. Y. Stakheev, E. S. Shpiro and J. Apijok, J. Phys. Chem., 1993, 97, 5668–
5672.
58 A. S. Al-Dughaither and H. de Lasa, Ind. Eng. Chem. Res., 2014, 53, 15303–
15316.
59 Y. T. Kim, K. D. Jung and E. D. Park, Appl. Catal. B Environ., 2011, 107, 177–
187.
60 M. M. J. Treacy and J. B. Higgins, Collection of Simulated XRD Powder
Patterns for Zeolites, Elsevier, 4th edn., 2001.
61 J. H. Nobbs, Rev. Prog. Color. Relat. Top., 1985, 15, 66–75.

Chapter 3 Identifying active Fe species for N2O decomposition
96
62 J. H. Park, J. H. Choung, I. S. Nam and S. W. Ham, Appl. Catal. B Environ.,
2008, 78, 342–354.
63 K. Sun, H. Zhang, H. Xia, Y. Lian, Y. Li, Z. Feng, P. Ying and C. Li, Chem.
Commun., 2004, 216, 2480–2481.
64 K. A. Dubkov, N. S. Ovanesyan, A. A. Shteinman, E. V. Starokon and G. I.
Panov, J. Catal., 2002, 207, 341–352.
65 A. Ribera, I. W. C. E. Arends, S. De Vries, J. Pérez-Ramírez and R. A. Sheldon,
J. Catal., 2000, 195, 287–297.
66 G. I. Panov, A. K. Uriarte, M. A. Rodkin and V. I. Sobolev, Catal. Today, 1998,
41, 365–385.
67 Q. Zhu, E. J. Hensen, B. L. Mojet, J. H. van Wolput and R. A. van Santen, Chem
Commun, 2002, 1232–1233.
68 N. Richards, E. Nowicka, J. H. Carter, D. J. Morgan, N. F. Dummer, S. Golunski
and G. J. Hutchings, Top. Catal., 2018, 61, 1983–1992.

Chapter 4 Effect of particle size on Pd-Al2O3
97
4 The effect of particle size on Pd-
Al2O3 catalysts for N2O decomposition.
4.1 Abstract
The preparation of efficient supported metal catalysts is of great importance in
heterogeneous catalysis and the consequences of many synthesis variables are not
fully understood. The catalytic activity of palladium supported on gamma alumina
(Pd-γAl2O3) was found to be highly dependent on reaction cycles and catalyst
preparation methodology for N2O decomposition. Analysis of a series of 2.6 wt. %
Pd-Al2O3 catalysts revealed the presence of physisorbed water on the support prior
to metal deposition. In-situ XRD measurements showed that the thermal stability
of Pd nanoparticles was enhanced if water was removed prior to metal deposition.
The activity and stability of the catalysts following Pd deposition were greatly
influenced by the point of zero charge of the support and the presence of water
species on the surface of the support. Additionally, the presence of chloride species
on the catalyst surface were identified as inhibiting the catalytic activity, with
multiple reaction cycles shown to remove these species and a subsequent increase
in activity observed (10.3 molN2O h-1 kgcat-1
at 550 °C in the first use, increased to 28.7
molN2O h-1 kgcat-1 in the 4th use at the same temperature). Although Pd dispersion
was partly predictive of catalytic activity, the removal of surface water by calcining
the support before palladium deposition resulted in improved activity. Comparison
catalysts were prepared using a deposition technique that has been shown
previously to control particle size; however, this requires an increased
concentration of Cl ions, therefore, resulting in increased Pd-Cl species in the final
catalyst. This increase in Pd-Cl species should hinder the catalytic activity but
interestingly, this is not the case due to the fine control of particle size leading to a
more positive effect on the decomposition rate.

Chapter 4 Effect of particle size on Pd-Al2O3
98
4.2 Keywords
Nitrous Oxide Decomposition, Particle Size, CO Chemisorption, HAADF-STEM, Pd-
Al2O3.
4.3 Introduction
Pd-Al2O3 catalysts have not been extensively studied in literature for the
decomposition of N2O into N2 and O2, 1–5 however similar catalytic systems have
been demonstrated to exhibit high activity and stability in other applications. 6–11
Pekridis et al. reported a T100 (i.e. the temperature to reach 100 % conversion) of
425 °C using a 2 wt. % Pd-Al2O3 catalyst prepared by wet-impregnation. The group
also showed that the addition of propane to the gas feed lowered the T100 to 400 °C.
1 As described previously, the rate limiting step in the decomposition of N2O is
typically the recombination of oxygen to form O2. 12–18 Therefore, propane acts as
reductant that can facilitate the abstraction of oxygen from the oxidised active site,
significantly increasing the observed rate of N2O decomposition at lower
temperatures. 1,2 Christoforou et al. reported that 72 % conversion was possible
using 2 wt. % Pd-Al2O3 at 600 °C, but the addition of propane to the feed lowers this
temperature by over 200 °C with 100 % N2O conversion. 2 Doi et al. utilised a higher
weight loading of 5 % with only 60 ppm N2O in the gas stream, and showed that it
was possible to decompose this low concentration at 300 °C; however, air was used
as the balance gas in this reaction and it has been shown since that the addition of
oxygen to the feed increases the activity. 5 It is important to note that in most cases
the addition of oxygen to the gas feed limits the conversion of N2O, because the
oxygen present oxidises the active site of the catalysts. 1,19,20
Tateishi et al. also demonstrated that a higher weight loading was also active for
this reaction with a commercial 5 wt.% Pd-Al2O3 catalyst achieving 100 %
conversion at 320 °C, though the catalyst prepared in house by the group by wet
impregnation required 500 °C to achieve the same conversion under the same
conditions. 4 Pekridis et. al. prepared a 2 wt. % Pd-Al2O3 catalyst and achieved 90 %
compared to 95 % when propane is present at 350 °C, however when comparing
the Pd:N2O molar ratio Pekridis had a ratio of 1:0.23 compared to the research in

Chapter 4 Effect of particle size on Pd-Al2O3
99
this chapter at 1:3.80, therefore, the catalysts in this chapter outperform the
previous literature catalyst. 1
This work investigates the importance of surface species and particle size on Pd-
Al2O3 catalysts for the decomposition of N2O in the presence and absence of a
reductant, propane. The effect of removal of surface species such as water and
chloride ions have been investigated by different pre-treatments and support pre-
treatments. In addition to comparing how activity changes based on these pre-
treatments, these have been evaluated for the control the particle size and
consequently, catalyst activity. Through pre-treatment of the catalyst support prior
to metal deposition, catalytic activity significantly increased, resulting in a decrease
of the T100 from 550 °C to 400 °C. Pd-Al2O3 catalysts show promise for N2O
decomposition when a reductant (such as propane) is added to the gas feed and
show high stability over extended periods of time. 1
4.4 Effect of reaction cycle on catalytic activity
A blank reaction was performed with only quartz wool and no catalyst. No
conversion of N2O was measured over the temperature range of 300 – 600 °C,
indicating the reactor was not active over the temperature range of interest (Table
4.1 Entry 1). Decomposition of N2O was studied using 2.6 wt. % Pd-Al2O3 prepared
by wet impregnation, with a pre-treatment (1 h at 600 °C, 13 % O2, 87 mL min-1)
over the temperature range 300 – 600 °C. The fresh catalyst (Table 4.1 entry 2) was
able to convert at a rate of 10.3 molN2O h-1 kgcat-1 at 550 °C, while the catalyst by
Tzitzious et al. converted at a rate of 20.9 molN2O h-1 kgcat-1 at the same
temperature.21
Table 4.1. The effect of multiple reaction cycles or heat treatments on N2O conversion over 2.6 wt. % Pd-Al2O3 catalysts.
Entry Catalyst (2.6
wt. % Pd-Al2O3)
T50a
(°C)
Conversion
at 550 °C
(%)
Decomposition Rate at
550 °C
(molN2O h-1 kgcat-1)
1 Blank - 0 0
2 Fresh 577 24 10.3
3 2R 565 39 16.7
4 3R 542 56 24.0
5 4R 527 67 28.7
6 5R 540 57 24.4
7 5HT 584 22 9.4 a the temperature at 50 % N2O conversion; R – Reaction cycle

Chapter 4 Effect of particle size on Pd-Al2O3
100
Large quantities of N2O are produced in the tail gases of industrial processes such
as the production of nitric acid and therefore catalysts have been designed to
convert this into less destructive non-greenhouse gases. With stability being a key
factor in industrial use, catalyst re-use was studied as an indicator as to how the
catalysts would behave in start-up-shut down procedures. To investigate stability
of the catalyst, the catalyst was reused with a pre-treatment between each use,
which showed an increase in N2O conversion with each use, up to the fourth use
(Table 4.1 entries 3-5). After the second reaction cycle the decomposition rate
increased from 16.7 to 24.0 molN2O h-1 kgcat-1, this increased to a maximum at the
4th use (4R) of 28.7 molN2O h-1 kgcat-1. The fifth cycle saw a decrease in the
decomposition rate to 24.4 molN2O h-1 kgcat-1. The observed increase in activity after
multiple uses was investigated by replicating the five heat treatment cycles ex situ,
i.e. in a furnace (flowing air at 600 °C for 1 h) to simulate reaction conditions and
potentially remove the remaining chloride species. The activity of this catalyst
(denoted 5HT) did not compare to that of the multiple use catalyst (Fig. 4.1), but
was comparable to the fresh catalyst. The decomposition rate at 550 °C was 9.4
molN2O h-1 kgcat-1.
Fig. 4.1. The effect of multiple uses or heat treatments on N2O decomposition using a 2.6 wt. % Pd-Al2O3 catalyst. Reaction Conditions: 1 % N2O/He total flow 100 mL min-1, GHSV: 76690 h-1 Legend: - 2.6 wt. % Pd-Al2O3 Fresh, - 2.6 wt. % Pd-Al2O3 5HT, - 2.6 wt. % Pd-Al2O3 5R.

Chapter 4 Effect of particle size on Pd-Al2O3
101
The Pd-Al2O3 catalysts were characterised to understand the origin in the difference
in activity. The samples of interest were the fresh 2.6 wt. % Pd-Al2O3 catalyst, the
catalyst after five reaction cycles (5R) and the catalyst after five heat-treatments in
the furnace (5HT). Fig. 4.2 shows the XRD patterns; the support exhibits only
alumina reflections, as does the fresh 2.6 wt. % Pd-Al2O3 catalyst with these
assigned as γ-Al2O3 (3 1 1) 2θ = 37.1 °, (4 0 0) 2θ = 46.0 ° and (4 4 0) 2θ = 66.6 °. 22
In contrast, the 5R and 5HT catalysts exhibited reflections due to Pd. These
reflections were assigned as PdO (1 0 1) 2θ = 33.855 °, PdO (3 1 1) 2θ = 54.900 ° and
PdO (2 1 1) 2θ = 71.485 °. 23 A Pd0 reflection was observed at Pd (1 1 1) 2θ = 42.034 °.
24 There is no reflection present for metallic Pd in the fresh catalyst, this indicates
that the particle size of Pd is below the nanoparticle detection limit, around 5 nm,
or not present. In contrast, the 5R and 5HT catalysts exhibited reflections due to Pd
as PdO (1 0 1) 2θ = 33.855 o, PdO (3 1 1) 2θ = 54.900 o and PdO (2 1 1) 2θ = 71.485
o 23. A Pd0 reflection was observed at Pd (1 1 1) 2θ = 42.034 o 24. In the used (4R and
5R) and 5HT catalysts there are reflections present due to both PdO and Pd, this
presence of reflections suggests that Pd nanoparticles have sintered as the particles
are now observable by XRD.
Fig. 4.2. XRD data for 2.6 wt. % Pd-Al2O3 and γ-Al2O3 Legend: (a) – Al2O3, (b) 2.6 wt. % Pd-Al2O3 Fresh, (c) 2.6 wt. % Pd-Al2O3 4R, (d) 2.6 wt. % Pd-Al2O3 5R, (e) 2.6 wt. % Pd-Al2O3 5HT, dashed line – PdO, solid line – Pd. 22,23
Chapter 4 Effect of particle size on Pd-Al2O3
102
The improvement in activity on repeated uses may have been caused by the
removal of residual Cl species that has been reported to poison the catalyst. 25 This
would be achieved over the reaction cycles through a process of converting any
remaining Pd-Cl species to PdO. X-Ray photoelectron spectroscopy (XPS) was used
to investigate the surface composition and oxidation state of Pd in more detail.
Most literature Pd XPS spectra consist of two peaks at 336.8 eV and 334.9 eV, with
the peak at 336.8 eV ascribed to PdO-Al2O3 as previously reported by Batista et al.
26 while the peak at 334.9 eV was attributed to Pd0 on Al2O3. 27,28 Depending on
catalyst preparation techniques, Pd-Cl species can also be present in the spectrum
and correspond to the peaks at 338.2 eV.29 Each Pd species will have two peaks
assigned to it due to the spin orbit splitting value of 5.3 eV.30,31 For example Pd2+
(Pd 3d 5/2) has a major peak at ca. 336.8 eV whilst the second peak (Pd 3d 3/2) at
ca. 342.1 eV. 30,31. All catalysts show only PdO and Pd-Cl species and the
concentration of these species was observed to change as the catalyst was
subjected to reaction conditions. Specifically, the proportion of Pd-Cl species
decreased while PdO species increased, overall. The 5R catalyst shows an increase
in PdCl species over the 4R catalysts. This is not because the catalyst has gained Cl,
but because the % Pd present has decreased meaning more of the surface of the
Pd is in the form PdCl as sintering has taken place (Table 4.2). When the catalyst
was heated in the furnace (5HT) almost all the PdCl species were removed (Fig. 4.3),
however, the catalytic activity is not improved above that of the fresh catalyst.
When the catalyst is used/heated multiple times the % of Pd-Cl decreases, this is
accompanied by a decrease in the intensity of Cl in the Cl 2p region ( not shown).
As the number of heat treatments increases the surface concentration of total Pd %
decreases (Table 4.2), this indicates that the % of Pd at the surface has decreased,
which can indicate Pd sintering or agglomeration has taken place. This is seen
dramatically between the 4R and 5R catalysts with the at.% of Pd dropping from
0.40 to 0.11 %. As described, this is due to the decrease in the surface of Pd
available for analysis due to sintering or agglomeration.

Chapter 4 Effect of particle size on Pd-Al2O3
103
Fig. 4.3. XPS spectra for various 2.6 wt. % Pd-Al2O3 catalysts. Each spectra is fitted with two peaks corresponding to PdO and Pd-Cl species. Legend: Red and Blue – PdO, Orange and Purple – PdCl. 2.6 wt.% Pd-Al2O3 (a) Fresh, (b) 5HT, (c) 5R. Table 4.2. Surface composition of Pd-Al2O3 catalysts as reported by XPS analysis.
Catalyst Pd 3d
(at.%)
% of PdO (337
eV) (%) 26
% of PdCl (339 eV)
(%) 29
2.6 wt. % Pd-γAl2O3 Fresh 0.46 50 50
2.6 wt. % Pd-γAl2O3 4R 0.40 78 22
2.6 wt. % Pd-γAl2O3 5R 0.11 72.7 27.3
2.6 wt. % Pd-γAl2O3 5HT 0.25 92 8
The XRD patterns indicate that with increased reaction cycles and heat treatments
Pd sintering took place. Furthermore, XPS measurements indicated that in addition
to sintering the population of Pd-Cl species decreased across the samples.
However, the N2O decomposition activity of the 4R sample when compared to the
5HT sample is suggestive of another factor not examinable by XPS or XRD, such as
particle size. Therefore, HAADF-STEM was performed on the samples to provide a
greater insight into the particle size changes suggested by XRD and XPS.
Comparison of fresh 5R and 5HT 2.6 wt. % Pd-Al2O3 samples by electron microscopy
are shown in Fig. 4.4. The fresh catalyst possesses Pd particles in the range of 1-5
nm (Fig. 4.4a). Large Pd particles (> 10 nm) of PdO are present after five reaction
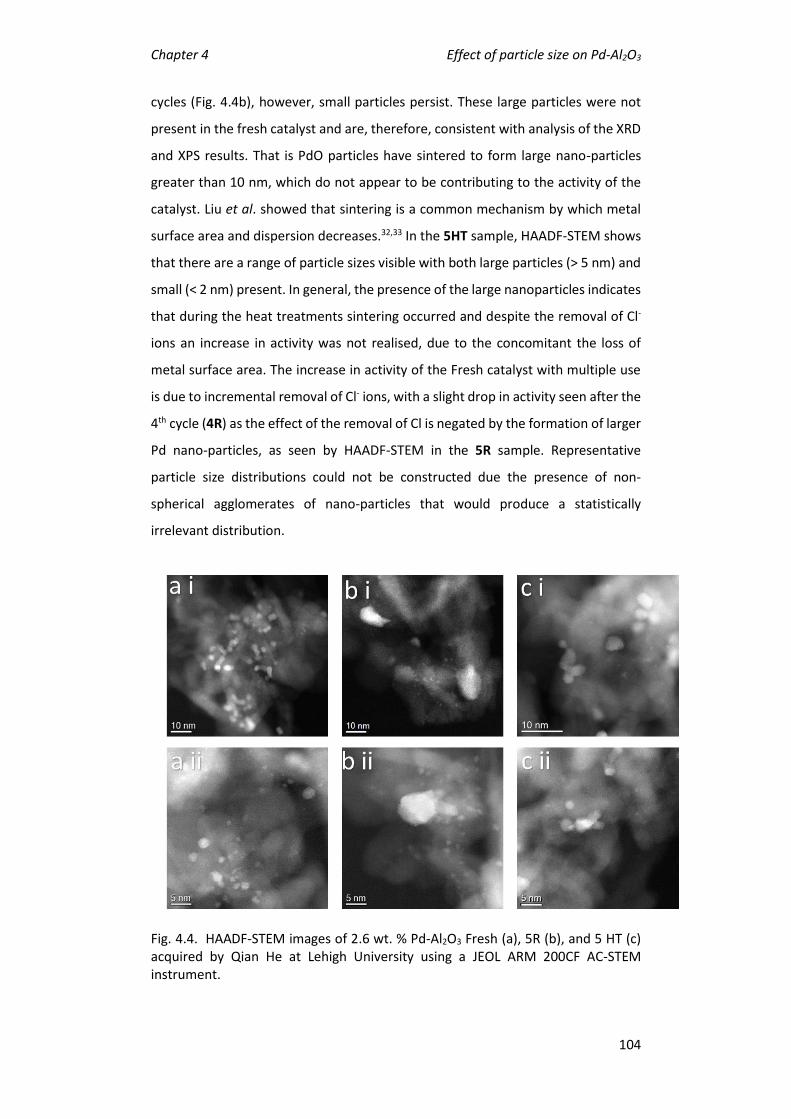
Chapter 4 Effect of particle size on Pd-Al2O3
104
cycles (Fig. 4.4b), however, small particles persist. These large particles were not
present in the fresh catalyst and are, therefore, consistent with analysis of the XRD
and XPS results. That is PdO particles have sintered to form large nano-particles
greater than 10 nm, which do not appear to be contributing to the activity of the
catalyst. Liu et al. showed that sintering is a common mechanism by which metal
surface area and dispersion decreases.32,33 In the 5HT sample, HAADF-STEM shows
that there are a range of particle sizes visible with both large particles (> 5 nm) and
small (< 2 nm) present. In general, the presence of the large nanoparticles indicates
that during the heat treatments sintering occurred and despite the removal of Cl-
ions an increase in activity was not realised, due to the concomitant the loss of
metal surface area. The increase in activity of the Fresh catalyst with multiple use
is due to incremental removal of Cl- ions, with a slight drop in activity seen after the
4th cycle (4R) as the effect of the removal of Cl is negated by the formation of larger
Pd nano-particles, as seen by HAADF-STEM in the 5R sample. Representative
particle size distributions could not be constructed due the presence of non-
spherical agglomerates of nano-particles that would produce a statistically
irrelevant distribution.
Fig. 4.4. HAADF-STEM images of 2.6 wt. % Pd-Al2O3 Fresh (a), 5R (b), and 5 HT (c) acquired by Qian He at Lehigh University using a JEOL ARM 200CF AC-STEM instrument.

Chapter 4 Effect of particle size on Pd-Al2O3
105
The Fresh Pd catalyst prepared by impregnation was tested for N2O decomposition,
and when used multiple times the activity increased. XPS showed that the majority
of Cl species that remain from the catalyst preparation were removed and HAADF-
STEM indicated that there was an increase in small, well dispersed nano-particles.
To replicate the removal of any chlorine species that remained on the catalyst, a
heat-treatment cycle was employed. The activity was the same as seen previously
in the fresh catalyst. Even though almost all Cl species had been removed during
the heat treatments, the STEM images indicate that sintering has taken place as
there are only a small number of small nano-particles present in the 5HT sample,
with mainly large nano-particles (> 5 nm) seen. Therefore the increase in activity
that is expected from the removal of Cl species is not observed, due to the decrease
in metal surface area available for reaction.
4.5 Effect of support calcination on catalytic
activity.
Initial results suggest that alongside the presence of Cl-, the size of the Pd particles
strongly contribute to the rate of N2O decomposition. To achieve similar levels of
activity as with the 5th reaction cycle 2.6 wt. % Pd-Al2O3 catalyst without carrying
out multiple catalyst tests the support was calcined before catalyst preparation
(denoted as SC). As Al2O3 is a hygroscopic, it was hypothesised that the removal of
surface water species and carbonates (XPS C 1s region showed peak at 289.7 eV)
could enhance the dispersion of Pd, as these species may block Al2O3 pores. 34,35 A
2.6 wt. % Pd-Al2O3 catalyst was prepared by wet impregnation using γ-Al2O3 that
had been calcined in flowing air at 600 °C at 10 °C min-1 for 4 h. The removal of
water during the calcination, as shown by SS MAS NMR (Fig. 4.8), lead to a change
in the point of zero charge of the γ-Al2O3, from PZC = 8.43 for the untreated support,
with this changing to 8.04 after calcination (Fig. 4.5 and Fig. 4.6). The R2 values of
both polynomial fittings show good fittings to the data, the fresh PZC curve has a
R2 of 0.97902, whilst the calcined PZC curve has a R2 value of 0.98854. The pH of
the PdCl solution used to prepare the catalysts was recorded to be pH 1, with the
species of Pd confirmed as PdCl3(H2O)- by Raman spectroscopy (Fig. 4.7). Both peaks
can be assigned to Pd-Cl stretches, the symmetric stretch at 296 cm-1 and 342 cm-1
due to out of phase mode of Pd-Cl. 36 When the pH of the solution is lower than

Chapter 4 Effect of particle size on Pd-Al2O3
106
that of the PZC, the surface will be protonated and will strongly interact with anions
37,38 therefore the decrease in PZC of the calcined catalyst will mean the surface is
less positively-charged during the catalyst preparation. This modification in surface
charge may be beneficial for the dispersion of the Pd nanoparticles on the support,
as is the case for the preparation of gold catalysts by deposition-precipitation.39
Therefore the 2 wt. % Pd-Al2O3 SC would be expected to have a better dispersion
than the palladium supported on the untreated support. An accurate Pd weight
loading on both the fresh and SC Pd-Al2O3 catalysts was performed with ICP-OES,
both catalysts had a 2.61 wt. % Pd loading.
Fig. 4.5. Calculation of Point of Zero Charge (PZC) for untreated Al2O3. R2 = 0.97902

Chapter 4 Effect of particle size on Pd-Al2O3
107
Fig. 4.6. Calculation of Point of Zero Charge (PZC) for calcined Al2O3. R2 = 0.98854
Fig. 4.7. Raman Spectra of PdCl2 solution using a 514 nm laser at 100 % power and 100 scans.

Chapter 4 Effect of particle size on Pd-Al2O3
108
The properties of the untreated, as received Al2O3 and calcined Al2O3 support were
investigated using solid state magic angle spinning (MAS) 1H NMR (Fig. 4.8). Both
spectra contain a single broad peak that is associated to the protons of physisorbed
water. The difference in broadness is related to the quantity of water absorbed on
the surface of the support. There are more physisorbed water molecules in the
fresh sample than the calcined sample even though these are present in both. Both
spectra have a large resonance at 4.6 ppm that corresponds to hydrogen bonded
water on the Al2O3 surface. The untreated Al2O3 spectra has a shoulder present that
is not present in the calcined sample; this shoulder at 1.2 ppm is due to the
presence of non-hydrogen bonded physisorbed water.40,41 In this spectra there is
also a slight shoulder at 7 ppm; this resonance is due to Brønsted acid sites that are
produced when water adsorbs onto a Lewis acidic site.42 The lack of the two
shoulder resonances indicates that water was removed during the calcination
treatment.
Fig. 4.8. Solid-state 1H NMR spectrum of Al2O3 untreated (red) and calcined (black)
TGA of both the untreated and the calcined Al2O3 show a gradual decrease in mass
loss over the temperature range tested for both the fresh and the calcined Al2O3
(Fig. 4.9). The mass loss is due to the removal of water, in the case of the untreated
Al2O3 both chemisorbed and physisorbed water. In the case of the calcined Al2O3,

Chapter 4 Effect of particle size on Pd-Al2O3
109
only chemisorbed water was removed. The calcined Al2O3 loses more mass due to
the fact that water was removed from the surface during the calcination, leaving
an extremely clean surface but, as alumina is hygroscopic, it absorbs water from
the atmosphere, with more absorbed now that the surface is clean, due to the
increased lability of the surface. The fresh sample loses 0.62 mg (10.91 mg starting
weight) after exposure to 800 °C, whereas the calcined Al2O3 loses 0.71 mg (10.53
mg starting weight) after the same treatment.
Fig. 4.9. TGA showing the mass loss over the temperature range of 800 °C of both fresh (red) and calcined Al2O3 (black) in nitrogen, heated at 10 °C min-1.
A TGA of reaction conditions was performed on both the fresh and SC catalyst to
monitor the weight loss during the reaction, the profile is as described below:
1. A. Reaction pre-treatment in air to 200 °C,
1. B. Second part of pre-treatment, 200-600 °C and hold for 1 hour.
2. Cool from 600 °C to 50 °C.
3. Change gas from Air to 1% N2O/N2 and hold for 1 hour at 50 °C.
4. A. Heat to 400 °C and hold for 1 hour,
4. B. Increase temperature at 50 °C intervals and hold at each temperature
for 1 hour.
Both catalysts show mass loss in the first and 4th steps of the profile, whilst mass
gain is seen in steps 2 and 3. Fig. 4.10 shows the difference between the two
catalysts, most differences are seen in the pre-treatment step, with the SC catalyst

Chapter 4 Effect of particle size on Pd-Al2O3
110
loosing ca. 6 % in the first step compared to ca. 10 % with the fresh support. The
fresh catalyst also gains more weight when the gas is changed to 1 % N2O/N2 (step
3) compared to the SC catalyst. The reaction profile in step 4 is very similar in both
cases. From this we can determine that the weight loss during the 1st step is due to
the removal of water bound to the Al2O3. This first step is not as drastic in the SC
catalyst because the water is removed during the support calcination before
catalyst preparation, with any physisorbed water that may have reabsorbed
removed in the calcination step after metal loading.
Fig. 4.10. Graph showing weight change for 2 wt.% Pd-Al2O3 Fresh and SC per step of the reaction shown the TGA’s above. Legend: Black – Step 1 a < 200 °C, Red – Step 1 b: 200 - 600 °C, Green - Step 2, Blue – Step 3, Orange – Step 4a < 400 °C, Purple – Step 4b: 400 - 600 °C.
HAADF-STEM shows similar Pd nanostructures present in the fresh and SC catalysts
with nanoparticles and clusters present in both samples (Fig. 4.11). However,
HAADF-STEM indicates that in the SC catalyst there are an increased quantity of
small nanoparticles than in the fresh catalyst (Fig. 4.11). The HAADF-STEM of the
SC catalyst has many nanoparticles less than 1 nm and some nanoparticles in the
range of 3 – 8 nm. When compared to the used catalyst, there are significantly more
smaller nanoparticles present in the SC catalyst, for example in the images in Fig.

Chapter 4 Effect of particle size on Pd-Al2O3
111
4.4.a there are no nanoparticles that are sub 1 nm, whereas these are easily
identifiable in the SC catalyst Fig. 4.11b.
Fig. 4.11. HADDF-STEM images of 2.6 wt. % Pd-Al2O3 Fresh (a) and Support calcined (SC) (b) acquired by Qian He at Lehigh University using a JEOL ARM 200CF AC-STEM instrument.
The SC catalyst was evaluated for N2O decomposition and compared to the fresh
and 5R catalysts (Fig. 4.12). The T50 obtained over the SC catalyst was found to be
561 °C and compared to the values of 577 and 540 °C over the fresh and 5R
catalysts. The support pre-treatment step has increased the N2O decomposition
rate to 15.9 molN2O h-1 kgcat-1 at 550 °C and is indicative of the formation of a higher
density of active small Pd nano-particles. Performing a comparable reaction cycle
with the SC catalyst resulted in a modest increase of the decomposition rate to 18.8
molN2O h-1 kgcat-1 at 550 °C and a decrease of the T50 to 556 °C over the fifth use
catalyst (SC 5R). The modest improvement in the decomposition rate suggests that
the PdCl population has decreased as with the 5R sample.
Propane acts as reductant that can facilitate the abstraction of oxygen from the
oxidised active site, significantly increasing the observed rate of N2O decomposition
at lower temperatures. 1,2,12–18 Here the presence of propane lowers the
temperature required by almost 200 °C. Reactions were carried out with the

Chapter 4 Effect of particle size on Pd-Al2O3
112
addition of propane in the gas feed (1 %). The dramatic increase in decomposition
activity is observed with all catalysts but is most noticeable with the SC catalyst:
with N2O only, 95 % conversion is achieved at 600 °C; in the presence of propane
95 % conversion is achieved at 350 °C.
Fig. 4.12. The effect on N2O conversion of heat treatments on 2.6 wt. % Pd-Al2O3.
Reaction Conditions: total flow 100 mL min-1, GHSV: 76690 h-1 300 - 600 °C, Closed symbols: 1 % N2O/He, Open symbols: 1 % N2O/1 % C3H8/He. Legend: - 2.6 wt. % Pd-Al2O3 Fresh, - 2.6 wt. % Pd-Al2O3 5R, - 2.6 wt. % Pd-Al2O3 SC.
ICP-OES was performed to determine an accurate Pd weight loading on both the
fresh and SC 2.6 wt. % Pd-Al2O3 catalyst. Analysis showed both catalysts have a 2.61
wt. % Pd loading. Therefore, the change in activity is not considered to be due to a
difference in Pd loading.
The superior dispersion of Pd on the SC catalyst, as evidenced by HAADF-STEM,
implies that the anchoring of Pd is stronger on the calcined support. To examine
directly the stability of the Pd species on the surface of the Al2O3, in situ XRD was
performed. The in-situ XRD profiles of 2.6 wt. % Pd-Al2O3 and SC catalysts are
illustrated in Fig 4.13.a and b respectively. The samples were heated in 1 % N2O/N2
and cooled in N2 at 50 °C intervals. The in situ XRD patterns of 2.6 wt. % Pd-Al2O3
shows that small PdO reflections were present at 500 °C, with the intensity of the

Chapter 4 Effect of particle size on Pd-Al2O3
113
PdO reflections not increasing past 550 °C, with Pd0 reflections forming at the same
temperatures. In the SC catalyst PdO and Pd reflections were not visible until at
least 600 °C. The difference in temperature required to observe reflections
corresponding to nanoparticles of PdO and Pd indicates that the Pd nanoparticles
are more strongly anchored to the calcined Al2O3 than the untreated support.
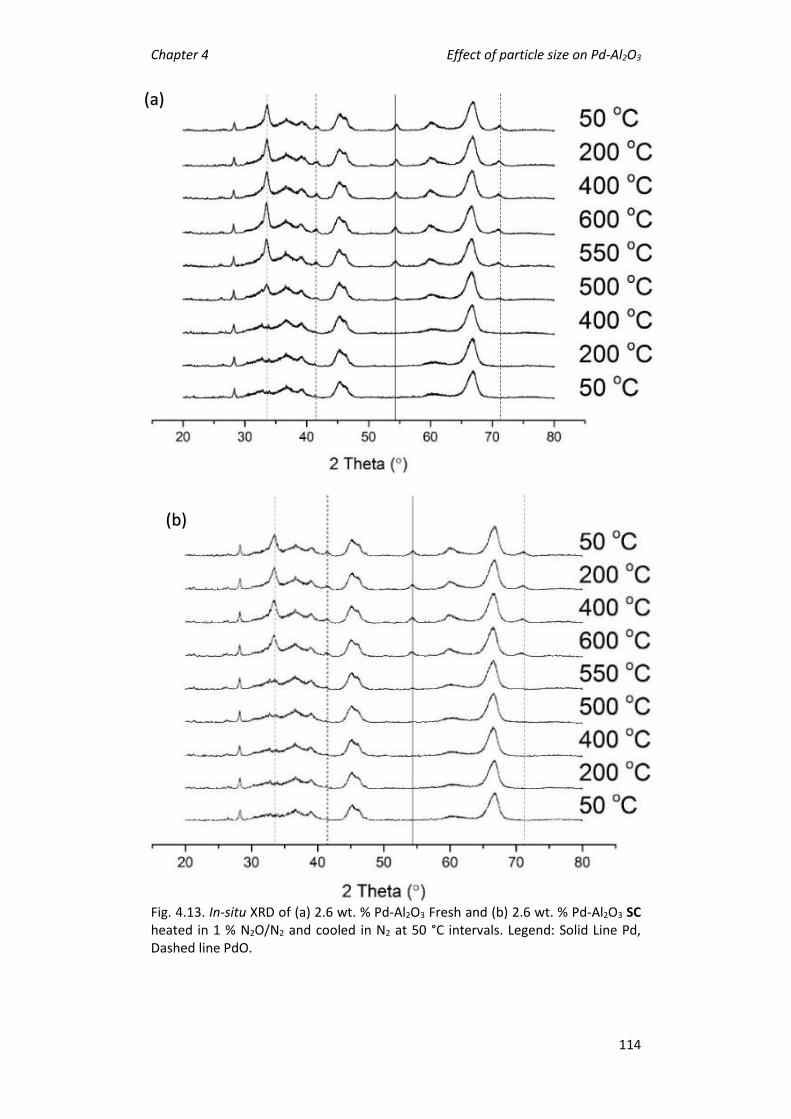
Chapter 4 Effect of particle size on Pd-Al2O3
114
Fig. 4.13. In-situ XRD of (a) 2.6 wt. % Pd-Al2O3 Fresh and (b) 2.6 wt. % Pd-Al2O3 SC heated in 1 % N2O/N2 and cooled in N2 at 50 °C intervals. Legend: Solid Line Pd, Dashed line PdO.
(a)
(b)

Chapter 4 Effect of particle size on Pd-Al2O3
115
The average particle size of the Pd present on the surface were further investigated
with CO chemisorption of the fresh and SC catalysts. It is assumed that all Pd
particles are hemispherical and that one CO molecule will bind to one Pd atom: we
acknowledge that STEM has shown this is not the case but this will give an average
particle size and metal surface area. Metal nanoparticle dispersion increased
modestly from 24.7 % to 27.5 % with the fresh to the SC catalyst (Table 4.3). The
average particle size of Pd particles in the SC catalyst decreased when compared to
the fresh catalyst. This decrease in average particle size indicated that the
nanoparticles found on the SC catalyst are smaller and further support the
inference that smaller particles are more active than larger particles for N2O
decomposition. This is due to the smaller particles having a larger surface area per
gram of metal and this small change in particle size facilitates an increased
decomposition reaction rate through the increased surface area available.
Table 4.3. Dispersion and metal surface area as calculated by CO Chemisorption on 2.6 wt. % Pd-Al2O3 fresh and SC.
Catalyst Metal Surface Area
(m2 g-1)
Avg. crystallite
size (nm)
Dispersion
(%)
2.6 wt. % Pd-Al2O3 Fresh 2.9 1.51 24.7
2.6 wt. % Pd-Al2O3 SC 3.2 1.36 27.5
4.6 How the control of particle size by modified
impregnation catalyst preparation technique
effects catalytic activity
The catalytic activity for N2O decomposition when propane is present over the fresh
and SC catalysts is markedly different (Fig. 4.12). To investigate the effect of particle
size, the catalysts were re-prepared using a modified impregnation (MI) technique
which has been shown previously to produce catalysts with a very narrow particle
size distribution.43
Palladium was deposited with the MI technique on a calcined alumina and an as-
received alumina and examined by XPS, XRD, CO chemisorption and HAADF-STEM.
The Pd loading of the MI prepared catalysts was analysed by ICP-OES and was found
to be lower (2.1 wt.%) than the traditionally prepared impregnation catalysts (2.6

Chapter 4 Effect of particle size on Pd-Al2O3
116
wt. %). The materials were examined by CO chemisorption (Table 4.4) and revealed
that the average Pd particle size, 1.25 and 1.28 nm was smaller than the analogue
impregnation catalysts displayed in Table 4.3. However, the metal surface area was
found to be lower and can be assigned to the lower Pd loading of the MI catalysts.
When comparing the XRD patterns of 2.1 wt. % Pd-Al2O3 MI catalysts, it is clear that
there are no Pd or PdO reflections (Fig. 4.14). This indicates that the Pd species are
smaller than the detection limit of XRD, which is consistent with the CO
chemisorption data.
Table 4.4. Dispersion and metal surface area as calculated by CO Chemisorption on 2.1 wt. % Pd-Al2O3 fresh and SC prepared by modified impregnation.
Catalyst Metal Surface Area
(m2 g-1)
Avg. particle size
(nm)
Dispersion
(%)
2.1 wt.% Pd-Al2O3 Fresh MI 2.8 1.25 29.8
2.1 wt.% Pd-Al2O3 SC MI 2.7 1.28 29.3
Fig. 4.14. XRD data for a - γ-Al2O3 calcined, b – 2.1 wt. % Pd-Al2O3 MI and c – 2.1 wt. % Pd-Al2O3 SC MI. Legend dashed line – PdO, solid line – Pd0.
The modified impregnation technique requires an excess of HCl to be added during
the preparation. This facilitates the deposition of Pd and the subsequently observed
metal particle control, through altering the support PZC and inducing an increased
interaction between the Pd precursor and the support. Characterisation by XPS
shows a high ratio of PdO to PdCl in the modified impregnation catalysts. For both
the un-calcined support catalyst (2.1 wt. % Pd-Al2O3 Fresh MI) and the calcined
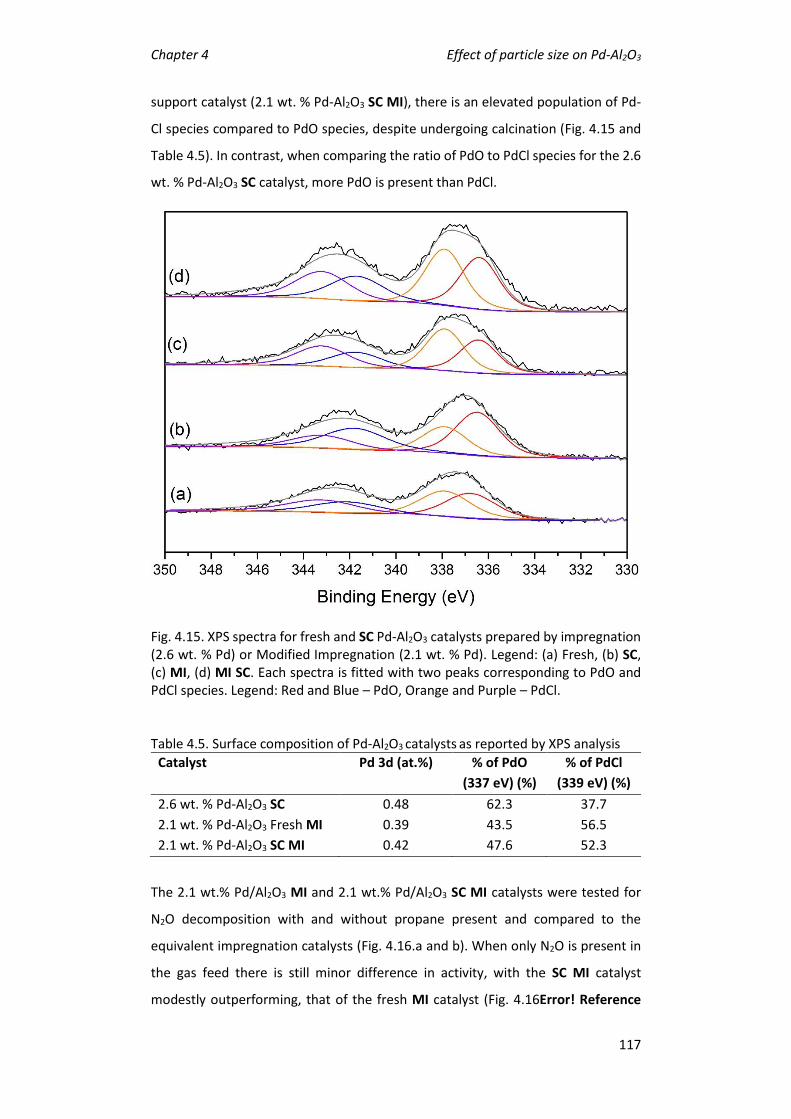
Chapter 4 Effect of particle size on Pd-Al2O3
117
support catalyst (2.1 wt. % Pd-Al2O3 SC MI), there is an elevated population of Pd-
Cl species compared to PdO species, despite undergoing calcination (Fig. 4.15 and
Table 4.5). In contrast, when comparing the ratio of PdO to PdCl species for the 2.6
wt. % Pd-Al2O3 SC catalyst, more PdO is present than PdCl.
Fig. 4.15. XPS spectra for fresh and SC Pd-Al2O3 catalysts prepared by impregnation (2.6 wt. % Pd) or Modified Impregnation (2.1 wt. % Pd). Legend: (a) Fresh, (b) SC, (c) MI, (d) MI SC. Each spectra is fitted with two peaks corresponding to PdO and PdCl species. Legend: Red and Blue – PdO, Orange and Purple – PdCl. Table 4.5. Surface composition of Pd-Al2O3 catalysts as reported by XPS analysis
Catalyst Pd 3d (at.%) % of PdO
(337 eV) (%)
% of PdCl
(339 eV) (%)
2.6 wt. % Pd-Al2O3 SC 0.48 62.3 37.7
2.1 wt. % Pd-Al2O3 Fresh MI 0.39 43.5 56.5
2.1 wt. % Pd-Al2O3 SC MI 0.42 47.6 52.3
The 2.1 wt.% Pd/Al2O3 MI and 2.1 wt.% Pd/Al2O3 SC MI catalysts were tested for
N2O decomposition with and without propane present and compared to the
equivalent impregnation catalysts (Fig. 4.16.a and b). When only N2O is present in
the gas feed there is still minor difference in activity, with the SC MI catalyst
modestly outperforming, that of the fresh MI catalyst (Fig. 4.16Error! Reference

Chapter 4 Effect of particle size on Pd-Al2O3
118
source not found..a). The MI catalysts outperform the corresponding impregnation
catalysts, and further support the supposition that the N2O decomposition reaction
is sensitive to the active surface composition and structure. This reactivity can be
attributed to the increased dispersion of smaller and more active metal particles
available for N2O decomposition to occur, based on the results from CO
Chemisorption (Table 4.4). However, the increased Cl- on the surface of the MI
catalysts restricts the activity to only the minor improvement observed. The T50
obtained over the MI catalyst was found to be 576 °C and compared to the values
of 547 °C over the MI SC catalyst. Therefore, the support pre-treatment step has
increased the N2O decomposition rate from 16.3 molN2O h-1 kgcat-1 to 21.9 molN2O h-
1 kgcat-1 at 550 °C.
When propane was added to the reaction mixture the effect of calcining the
support prior to Pd deposition was negated (Fig. 4.16b). The activity of the MI
catalysts was lower, at ca. 78 % N2O conversion compared to that of the SC catalyst,
but higher than that of the fresh supported Al2O3 catalyst at 350 °C, compared to
96 % for SC and 7 % for the fresh catalyst (Fig. 4.16a). The activity of both MI
catalysts was comparable: the decomposition rate was ca. 30 molN2O h-1 kgcat-1 at
350 °C with propane present. It is possible that residual chlorine species may inhibit
the reaction as observed with the catalysts that underwent increasing reaction
cycles. However, it is clear that the influence of calcining the support prior to metal
impregnation is negated with the MI catalysts for this reaction with propane.

Chapter 4 Effect of particle size on Pd-Al2O3
119
Fig. 4.16. The effect on N2O conversion of catalyst preparation over Pd-Al2O3 Fresh (filled symbols) and SC catalysts (open symbols): - 2.6 wt.% Pd Fresh, - 2.6 wt.% Pd SC, - 2.1 wt.% Pd MI, - 2.1 wt.% Pd SC MI. Reaction conditions; (a), 1 % N2O/He, total flow 100 ml min-1, GHSV: 75900 h-1, (b), 1 % N2O/1 % C3H8/He, total flow 100 ml min-1, GHSV: 75900 h-1.
(a)
(b)
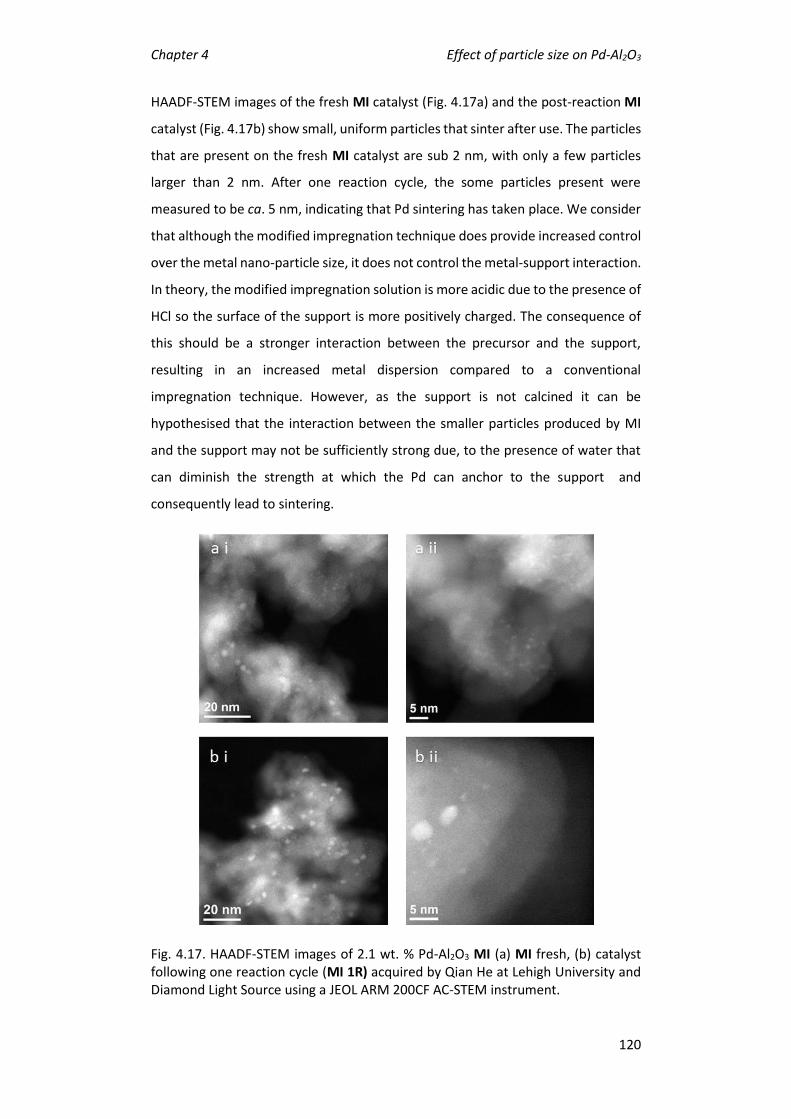
Chapter 4 Effect of particle size on Pd-Al2O3
120
HAADF-STEM images of the fresh MI catalyst (Fig. 4.17a) and the post-reaction MI
catalyst (Fig. 4.17b) show small, uniform particles that sinter after use. The particles
that are present on the fresh MI catalyst are sub 2 nm, with only a few particles
larger than 2 nm. After one reaction cycle, the some particles present were
measured to be ca. 5 nm, indicating that Pd sintering has taken place. We consider
that although the modified impregnation technique does provide increased control
over the metal nano-particle size, it does not control the metal-support interaction.
In theory, the modified impregnation solution is more acidic due to the presence of
HCl so the surface of the support is more positively charged. The consequence of
this should be a stronger interaction between the precursor and the support,
resulting in an increased metal dispersion compared to a conventional
impregnation technique. However, as the support is not calcined it can be
hypothesised that the interaction between the smaller particles produced by MI
and the support may not be sufficiently strong due, to the presence of water that
can diminish the strength at which the Pd can anchor to the support and
consequently lead to sintering.
Fig. 4.17. HAADF-STEM images of 2.1 wt. % Pd-Al2O3 MI (a) MI fresh, (b) catalyst following one reaction cycle (MI 1R) acquired by Qian He at Lehigh University and Diamond Light Source using a JEOL ARM 200CF AC-STEM instrument.

Chapter 4 Effect of particle size on Pd-Al2O3
121
The reactivity data highlights the structural sensitivity of the active site and how
important the relationship between Pd dispersion and presence of PdCl is. The
increase in Pd dispersion resulted in an increase in activity as seen when the
support is calcined before catalyst preparation. However, removal of Cl- from the
catalyst surface as with the catalysts that have undergone four or five reaction
cycles can lead to an improvement in activity despite the onset of Pd sintering and
reduced Pd dispersion. Further activity gains can be observed through careful
control of the Pd dispersion, through the MI technique, despite a high density of
PdCl. Therefore, the balance between a high Pd dispersion and the presence of PdCl
appears to favour the former.
4.7 Conclusions
The effect of heat treatment conditions on 2.6 wt. % Pd-Al2O3 catalysts have been
investigated for the catalytic decomposition of N2O into N2 and O2 in the absence
and presence of a reducing agent (C3H8). It was found that the use of several
reaction cycles increases the conversion of N2O from 58 % to 96 % at 600 °C. These
multiple use catalysts also show improved stability on-stream. It has also been
demonstrated that by calcining the support before catalyst preparation, similar
conversions as the multiple use catalyst can be achieved in the first cycle of the
support calcined catalyst. This enables high activity to be achieved on initial use
rather than on the 5th cycle of use (5R). It is suggested that this is due to the removal
of water species lowering the PZC of the support, which indicates a reduced
interaction between the Pd ion and the support surface, leading to the formation
of smaller nanoparticles. When a reductant is present, the temperature at which
100 % conversion is observed is shifted from 550 °C to 350 °C. The presence of the
reductant enhances the decomposition of N2O to N2, however a limited amount of
O2 is measured, suggesting that the reductant was acting as a scavenger of oxygen
to form cracked, oxidation products and water. When the support was calcined
before catalyst preparation, the resultant catalyst was formed of small Pd
nanoparticles. Reaction data indicates that small nanoparticles are the more active
species, as when the particle size is controlled by using a modified impregnation
preparation method the activity of both catalysts is the same, therefore further
adding credit to the theory that the particle size, and subsequently dispersion,
control the activity of a Pd-Al2O3 catalysts for N2O decomposition.
Chapter 4 Effect of particle size on Pd-Al2O3
122
4.8 Future Work
The effect of PZC and metal interaction can be studied further by using a range of
reducible and non-reducible supports such as MgO, SiO2 (irreducible) and CeO2,
TiO2 (reducible).44 The investigation of the interaction of the metal and support at
different PZC can lead to the formation of a new preparation method that controls
the deposition of metal and subsequently particle size. As particle size is normally
an influential controlling factor in the activity of catalysts, the creation of a new
preparation method that can control this would be relevant to all in the field.
Following on from the discussion on the effect of the presence of Cl ions, there are
preparation methods that can be used that do not require a Cl precursor to be used,
such as Chemical Vapour Impregnation (CVI). This preparation method utilises a
Pd(acac)2 precursor and is also solvent free, meaning no additional water species
are present to hinder the deposition of metal nanoparticles. This can give an
indication as to the effect that both the solvent and the Cl species are having on the
conversion of N2O.
4.9 References
1 G. Pekridis, C. Athanasiou, M. Konsolakis, I. V. Yentekakis and G. E.
Marnellos, Top. Catal., 2009, 52, 1880–1887.
2 S. C. Christoforou, E. A. Efthimiadis and I. A. Vasalos, Catal. Letters, 2002, 79,
137–147.
3 M. Machida, T. Watanabe, S. Ikeda and T. Kijima, Catal. Commun., 2002, 3,
233–238.
4 Y. Tateishi, T. Tsuneyuki, H. Furukawa, S. Kagawa, I. Moriguchi, Y. Kanmura
and Y. Teraoka, Catal. Today, 2008, 139, 59–63.
5 K. Doi, Y. Y. Wu, R. Takeda, A. Matsunami, N. Arai, T. Tagawa and S. Goto,
Appl. Catal. B Environ., 2001, 35, 43–51.
6 K. Zorn, S. Giorgio, E. Halwax, C. R. Henry, H. Gronbeck and G. Rupprechter,
J. Phys. Chem. C, 2011, 115, 1103–1111.
7 T. Maillet, C. Solleau, J. Barbier and D. Duprez, Appl. Catal. B Environ., 1997,

Chapter 4 Effect of particle size on Pd-Al2O3
123
14, 85–95.
8 A. S. Ivanova, E. M. Slavinskaya, R. V. Gulyaev, V. I. Zaikovskii, O. A. Stonkus,
I. G. Danilova, L. M. Plyasova, I. A. Polukhina and A. I. Boronin, Appl. Catal. B
Environ., 2010, 97, 57–71.
9 D. Roth, P. Gélin, A. Kaddouri, E. Garbowski, M. Primet and E. Tena, Catal.
Today, 2006, 112, 134–138.
10 D. Gao, C. Zhang, S. Wang, Z. Yuan and S. Wang, Catal. Commun., 2008, 9,
2583–2587.
11 J. Lu, B. Fu, M. C. Kung, G. Xiao, J. W. Elam, H. H. Kung and P. C. Stair, Science,
2012, 335, 1205–1208.
12 H. Guesmi, D. Berthomieu and L. Kiwi-Minsker, J. Phys. Chem. C, 2008, 112,
20319–20328.
13 C. Sang, B. H. Kim and C. R. F. Lund, J. Phys. Chem. B, 2005, 109, 2295–2301.
14 N. Hansen, A. Heyden, A. T. Bell and F. J. Keil, J. Phys. Chem. C, 2007, 111,
2092–2101.
15 D. A. Bulushev, L. Kiwi-minsker and A. Renken, Ind. Eng. Chem. Res., 2004,
211, 2004.
16 K. Sun, H. Xia, E. Hensen, R. van Santen and C. Li, J. Catal., 2006, 238, 186–
195.
17 G. D. Pirngruber, J. Catal., 2003, 219, 456–463.
18 B. R.Wood, J. A. Reimer and A. T. Bell, J. Catal., 2002, 209, 151–158.
19 S. Parres-Esclapez, M. J. Illan-Gomez, C. S. M. de Lecea and A. Bueno-Lopez,
Appl. Catal. B Environ., 2010, 96, 370–378.
20 M. Konsolakis, I. V. Yentekakis, G. Pekridis, N. Kaklidis, A. C. Psarras and G.
E. Marnellos, Appl. Catal. B Environ., 2013, 138–139, 191–198.
21 V. K. Tzitzios and V. Georgakilas, Chemosphere, 2005, 59, 887–891.
22 F. Hu, X. Wu, Y. Wang and X. Lai, RSC Adv., 2015, 5, 54053–54058.
23 B. Ngamsom, N. Bogdanchikova, M. A. Borja and P. Praserthdam, Catal.

Chapter 4 Effect of particle size on Pd-Al2O3
124
Commun., 2004, 5, 243–248.
24 Y. Ning, Z. Yang and H. Zhao, Platin. Met. Rev., 1996, 40, 80–87.
25 P. Marécot, A. Fakche, B. Kellali, G. Mabilon, P. Prigent and J. Barbier,
Applied Catal. B, Environ., 1994, 3, 283–294.
26 J. Batista, A. Pintar, D. Mandrino, M. Jenko and V. Martin, Appl. Catal. A
Gen., 2001, 206, 113–124.
27 J. Z. Shyu, K. Otto, W. L. H. Watkins, G. W. Graham, R. K. Belitz and H. S.
Gandhi, J. Catal., 1988, 114, 23–33.
28 L. Liu, F. Zhou, L. Wang, X. Qi, F. Shi and Y. Deng, J. Catal., 2010, 274, 1–10.
29 A. Tressaud, S. Khairoun, H. Touhara and N. Watanabe, Zeitschrift Anorg.
und Allg. Chemie, 1986, 540, 291–299.
30 J. C. Zhou, C. M. Soto, M.-S. Chen, M. A. Bruckman, M. H. Moore, E. Barry,
B. R. Ratna, P. E. Pehrsson, B. R. Spies and T. S. Confer, J. Nanobiotechnol.,
2012, 10, 18.
31 M. C. Militello and S. J. Simko, Surf. Sci., 1997, 3, 402–409.
32 R. J. Liu, P. A. Crozier, C. M. Smith, D. A. Hucul, J. Blackson and G. Salaita,
Appl. Catal. A Gen., 2005, 282, 111–121.
33 J. J. Chen and E. Ruckenstein, J. Catal., 1981, 69, 254–273.
34 W. Chen, Y. Ding, X. Song, T. Wang and H. Luo, Appl. Catal. A Gen., 2011,
407, 231–237.
35 N. Yao, J. Chen, J. Zhang and J. Zhang, Catal. Commun., 2008, 9, 1510–1516.
36 C. Drew Tait, D. R. Janecky and P. S. Z. Rogers, Geochim. Cosmochim. Acta,
1991, 55, 1253–1264.
37 J. Park and J. R. Regalbuto, J. Colloid Interf. Sci., 1995, 175, 239–252.
38 K. P. De Jong, Synthesis of Solid Catalysts, Wiley-VCH Verlag GmbH & Co.
KGaA, 1st edn., 2009, vol. 39.
39 P. Munnik, P. E. De Jongh and K. P. De Jong, Chem. Rev., 2015, 115, 6687–
6718.

Chapter 4 Effect of particle size on Pd-Al2O3
125
40 C. E. Bronnimann, I. ssuer Chuang, B. L. Hawkins and G. E. Maciel, J. Am.
Chem. Soc., 1987, 109, 1562–1564.
41 E. C. Decanio, J. C. Edwards and J. W. Bruno, J. Catal., 1994, 148, 76–83.
42 M. Hunger, D. Freude, H. Pfeifer, H. Bremer, M. Jank and K. P. Wendlandt,
Chem. Phys. Lett., 1983, 100, 29–33.
43 M. Morad, M. Sankar, E. Cao, E. Nowicka, T. E. Davies, P. J. Miedziak, D. J.
Morgan, D. W. Knight, D. Bethell, A. Gavriilidis and G. J. Hutchings, Catal. Sci.
Technol., 2014, 4, 3120–3128.
44 A. R. Puigdollers, P. Schlexer, S. Tosoni and G. Pacchioni, ACS Catal., 2017, 7,
6493–6513.

Chapter 5 Lattice oxygen and surface area for N2O decomposition
126
5 Effect of lattice oxygen species
and surface area of Perovskites on N2O
decomposition.
5.1 Abstract
Perovskites have been prepared by various methods and tested for N2O
decomposition. Initially, a citric acid preparation was utilised with altering of A and
B ratios in order to increase phase purity. Following this, the catalysts were re-
prepared by the SAS technique to produce perovskites with a higher surface area.
The materials were also prepared by the oxalic acid precipitation method for
comparison. It has been shown that, by altering the A and B ratios, it is possible to
reduce the temperature required to produce a pure phase perovskite. The low
temperature is crucial to form a perovskite with a higher surface area, which has
implications when studying reactions such as N2O decomposition, which has been
shown to have a high dependency on surface area.1–4 The use of different
preparation methods also enables the production of perovskites with varying
oxygen species, as determined by XPS and O2-TPD. This work has confirmed the
importance of lattice oxygen species that have high oxygen mobility for the
decomposition of N2O. Lattice oxygen has been shown to be crucial as the rate
limiting step in the decomposition of N2O, as the formation of molecular oxygen is
limited by surface adsorbed O species being within a distance at which
recombination is possible. An abundance of mobile lattice oxygen therefore aids
recombination and facilitates the regeneration of active sites for N2O
decomposition. Two perovskite catalysts have been the focus of this work,
La0.75Sr0.25Co0.81Fe0.19Ox (LSCF) and Pr0.75Ba0.25CoOx (PBC). The LSCF catalyst follows
the trend that an increase in the amount of lattice oxygen present (predicted by
XPS) results in a higher activity, with the most active and lattice oxygen rich catalyst
resulting from the citric acid preparation method. The PBC catalyst differed from
Chapter 5 Lattice oxygen and surface area for N2O decomposition
127
the above trend, as the most active catalyst did not have the highest percentage of
lattice oxygen shown by XPS; however, activity was correlated with an increase in
amount of mobile oxygen species. In this case, the SAS precipitation preparation
method produced a catalyst with mobile oxygen species and a high surface area.
The LSCF catalyst prepared by citric acid achieved 85 % conversion of N2O at 500 °C,
and the PBC catalyst prepared by SAS converted 95 % N2O at 500 °C, with both
showing stability over a 24 hour period under reaction conditions at 450 °C.
5.2 Introduction
Perovskites are a class of materials represented by the formula ABO3, with the A
site generally being a large, often rare earth element such as La. The B site is
generally a smaller transition metal element such as Co or Fe. The substitution of
elements into the A or B site leads to the formation of abnormal valencies on the B
site cation, which results in oxygen vacancies, Sr or Ce are often used for A site
substitution.2
Perovskites are known for their low cost and high structural and thermal stability,
which usually arises due to the high temperatures required during preparation to
form the perovskite phase.5–9 This high temperature preparation leads to low
specific surface areas, typically less than 10 m2 g-1.2,5,10–13 Perovskites are also known
for their oxygen mobility and oxygen storage capacity, with oxygen mobility
contributing greatly to their high catalytic activity for N2O decomposition.14–17 The
most notable perovskite catalysts for N2O decomposition are given in Table 5.1.

Chapter 5 Lattice oxygen and surface area for N2O decomposition
128
Table 5.1. Table showing the most relevant perovskite systems for N2O decomposition.
Catalyst Conditions Conversion Reference
LaCoO3 0.5 % N2O, He, WHSV =
120 000 mL g-1 h-1
100 % at 550 °C
50 % at 455 °C
18
Pr0.8Ba0.2MnO3 0.5 g, 0.5 % N2O, He
balance.
GHSV = 7500 h-1
100 % at 550 °C
50 % at 442 °C
19
La0.7Ba0.3Mn0.8In0.2O3 10 % N2O in He, 20 ml
min -1 W/F = 3.0 g s cm-
3
92 % at 500 °C
50 % at 443 °C
20
La0.75Sr0.25MnO3 0.15 % N2O
GHSV = 30 800 h-1
50 % at 725 °C 21,22
La0.4Sr0.6FeO3 0.15 % N2 GHSV = 30
800 h-1
50 % at 815 °C 23
5.3 Preparation of perovskite catalysts by citric acid
Perovskites were prepared using the citrate preparation method as described in
Chapter 2.2.7, dried overnight and then heat treated in a chamber furnace at 400
or 550 °C depending when the last major mass loss was observed on the TGA
profile. Following this, the materials were calcined at an appropriate temperature
defined by in situ XRD to produce the following pure phase perovskites:
• Ba0.5Pr0.5CoOx (BPC)
• SrCo0.81Fe0.19Ox (SCF)
• La0.75Sr0.25CoOx (LSC)
All catalysts in this section were prepared using citric acid and a mixture of metal
nitrates. The combined decomposition of citric acid and metal nitrates can lead to
a runaway exothermic reaction and ultimately an explosion if the heat treatment is
not controlled. Therefore, it is crucial to perform TGA of the catalysts before heat
treatments are performed to optimise conditions. The TGA of the precursors can
give an indication of the temperature of decomposition. For example, in the TGA of
citric acid there is one major weight loss at 240 °C shown below (Fig. 5.1).

Chapter 5 Lattice oxygen and surface area for N2O decomposition
129
Fig. 5.1 TGA of Citric Acid up to 900 °C at 5 °C min-1 in air at 50 ml min-1.
The TGA profile of LSC (Fig. 5.2) shows a major weight loss at 170 °C due to
decomposition of the citric acid and La nitrate, followed by further weight losses at
300 °C due to a combination of La and Co nitrate decomposition with a final mass
loss event seen at 600 °C due to the decomposition of Sr nitrate. This is known by
performing TGA’s of the individual precursors. To successfully form the pure phase
perovskite, the catalyst was heat-treated to a high temperature determined by in
situ XRD. To perform an in situ XRD, the sample must be packed into a sample
holder. It is crucial that when the sample is heated the sample remains flat and the
holder fully filled; therefore, the catalysts must be pre-treated to limit mass loss
when the in situ XRD is performed. For the LSC catalyst a temperature of 400 °C was
chosen as all major mass loss events had occurred below this point (Fig. 5.2).
Importantly, all pre-treatments were performed at 1 °C min-1 in a chamber oven,
and held at the maximum temperature for 2 hours to ensure that the exothermic
reaction was controlled and the heat-treatment was performed safely.

Chapter 5 Lattice oxygen and surface area for N2O decomposition
130
Fig. 5.2 TGA of La0.75Sr0.25CoOx up to 850 °C at 5 °C min-1 in air at 50 ml min-1.
The same TGA process described previously was also performed for BPC (Fig. 5.3)
and SCF (Fig. 5.4) catalysts. Both show a mass loss below 200 °C that can be
associated to the decomposition of citric acid into CO2. In BPC (Fig. 5.3) there is
another mass loss at 300 °C that is due to the decomposition of Co nitrate and Ba
nitrate, followed by a minor mass loss at 580 °C due to the decomposition of Pr
nitrate. Therefore, a pre-treatment temperature of 400 °C was selected for this
catalyst. The SCF sample (Fig. 5.4) exhibited mass losses in two events up to 350 °C
and are due to the decomposition of Co and Fe nitrates, with the final mass loss
event due to the decomposition of Sr nitrate. For this catalyst a pre-treatment
temperature of 550 °C was selected.

Chapter 5 Lattice oxygen and surface area for N2O decomposition
131
Fig. 5.3. TGA of Ba0.5Pr0.5CoOx up to 850 °C at 5 °C min-1 in air at 50 ml min-1.
Fig. 5.4. TGA of SrCo0.81Fe0.19Ox up to 850 °C at 5 °C min-1 in air at 50 ml min-1.
Following the appropriate pre-treatments, In situ XRD was performed to determine
the lowest temperature at which a phase pure perovskite was formed. The in situ
XRD profile described in chapter 2.3.2 was used.
The in situ XRD of LSC (Fig. 5.5) shows the profiles from 550 to 850 °C, with a
perovskite structure seen in all spectra; however, the purity increases with
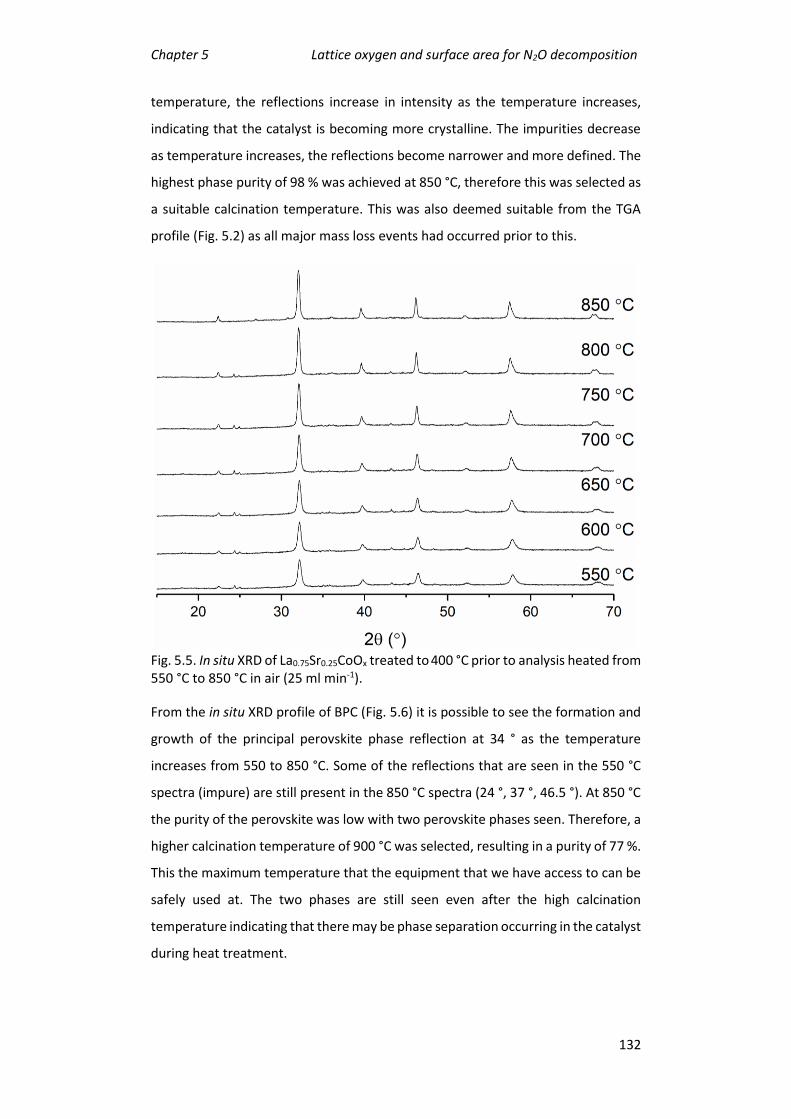
Chapter 5 Lattice oxygen and surface area for N2O decomposition
132
temperature, the reflections increase in intensity as the temperature increases,
indicating that the catalyst is becoming more crystalline. The impurities decrease
as temperature increases, the reflections become narrower and more defined. The
highest phase purity of 98 % was achieved at 850 °C, therefore this was selected as
a suitable calcination temperature. This was also deemed suitable from the TGA
profile (Fig. 5.2) as all major mass loss events had occurred prior to this.
Fig. 5.5. In situ XRD of La0.75Sr0.25CoOx treated to 400 °C prior to analysis heated from 550 °C to 850 °C in air (25 ml min-1).
From the in situ XRD profile of BPC (Fig. 5.6) it is possible to see the formation and
growth of the principal perovskite phase reflection at 34 ° as the temperature
increases from 550 to 850 °C. Some of the reflections that are seen in the 550 °C
spectra (impure) are still present in the 850 °C spectra (24 °, 37 °, 46.5 °). At 850 °C
the purity of the perovskite was low with two perovskite phases seen. Therefore, a
higher calcination temperature of 900 °C was selected, resulting in a purity of 77 %.
This the maximum temperature that the equipment that we have access to can be
safely used at. The two phases are still seen even after the high calcination
temperature indicating that there may be phase separation occurring in the catalyst
during heat treatment.

Chapter 5 Lattice oxygen and surface area for N2O decomposition
133
Fig. 5.6 In situ XRD of Ba0.5Pr0.5CoOx treated to 400 °C prior to analysis heated from 550 °C to 850 °C in air (25 ml min-1).
The in situ XRD of SCF given in Fig. 5.7 shows the profiles from 550 to 850 °C. Here,
small differences are observed as the temperature increases from 550 to 800 °C,
with shrinking of the reflections present at 24, 26 and 36.5 °. This is paired with the
formation of new reflections, most notably at 32 and 27 °, that are present in the
final material at 850 °C. As with BPC, a pure phase SCF perovskite is not formed at
850 °C, with a Co3O4 phase seen. Therefore, a higher calcination temperature of
900 °C was required (again the maximum temp possible of the furnaces), resulting
in a purity of 81 %.
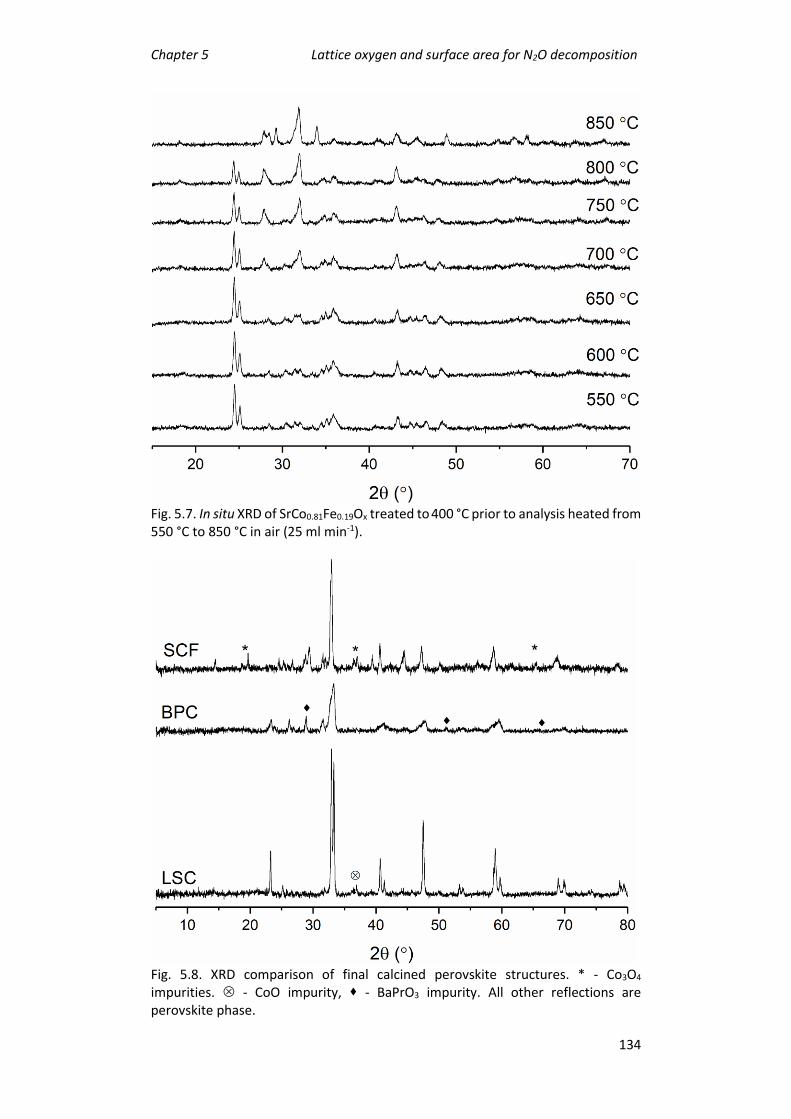
Chapter 5 Lattice oxygen and surface area for N2O decomposition
134
Fig. 5.7. In situ XRD of SrCo0.81Fe0.19Ox treated to 400 °C prior to analysis heated from 550 °C to 850 °C in air (25 ml min-1).
Fig. 5.8. XRD comparison of final calcined perovskite structures. * - Co3O4 impurities. - CoO impurity, - BaPrO3 impurity. All other reflections are perovskite phase.
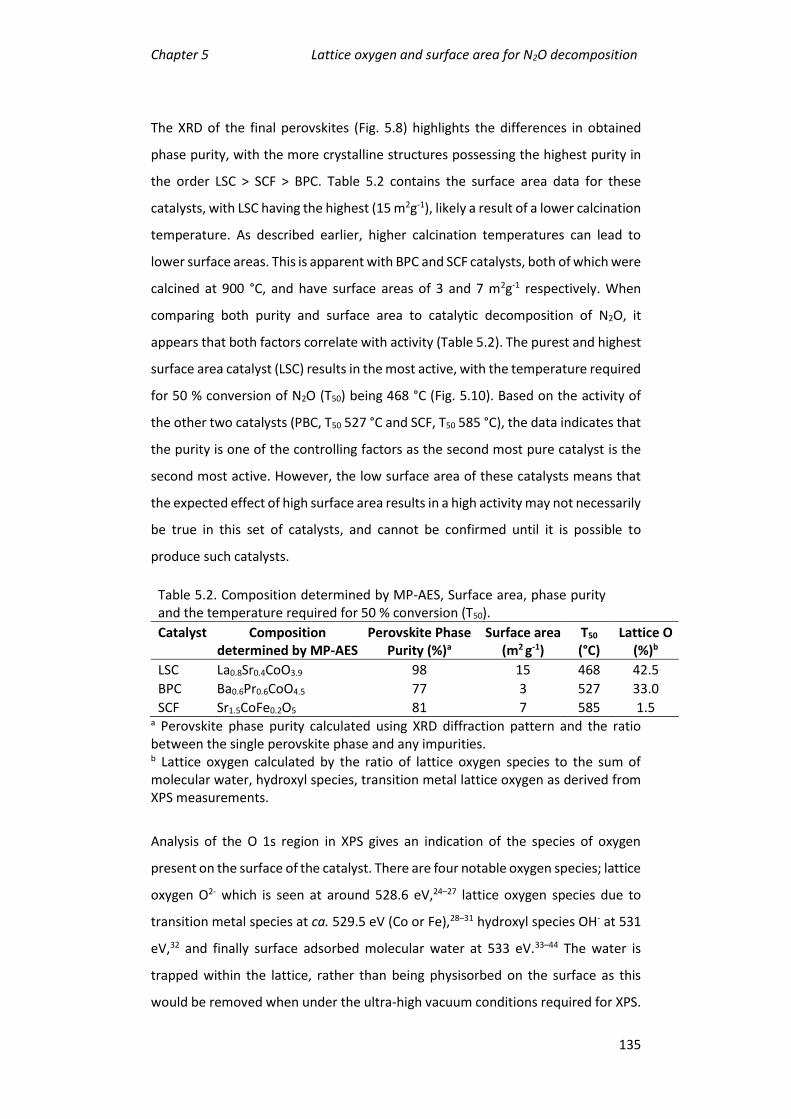
Chapter 5 Lattice oxygen and surface area for N2O decomposition
135
The XRD of the final perovskites (Fig. 5.8) highlights the differences in obtained
phase purity, with the more crystalline structures possessing the highest purity in
the order LSC > SCF > BPC. Table 5.2 contains the surface area data for these
catalysts, with LSC having the highest (15 m2g-1), likely a result of a lower calcination
temperature. As described earlier, higher calcination temperatures can lead to
lower surface areas. This is apparent with BPC and SCF catalysts, both of which were
calcined at 900 °C, and have surface areas of 3 and 7 m2g-1 respectively. When
comparing both purity and surface area to catalytic decomposition of N2O, it
appears that both factors correlate with activity (Table 5.2). The purest and highest
surface area catalyst (LSC) results in the most active, with the temperature required
for 50 % conversion of N2O (T50) being 468 °C (Fig. 5.10). Based on the activity of
the other two catalysts (PBC, T50 527 °C and SCF, T50 585 °C), the data indicates that
the purity is one of the controlling factors as the second most pure catalyst is the
second most active. However, the low surface area of these catalysts means that
the expected effect of high surface area results in a high activity may not necessarily
be true in this set of catalysts, and cannot be confirmed until it is possible to
produce such catalysts.
Table 5.2. Composition determined by MP-AES, Surface area, phase purity and the temperature required for 50 % conversion (T50).
Catalyst Composition determined by MP-AES
Perovskite Phase Purity (%)a
Surface area (m2 g-1)
T50 (°C)
Lattice O (%)b
LSC La0.8Sr0.4CoO3.9 98 15 468 42.5
BPC Ba0.6Pr0.6CoO4.5 77 3 527 33.0
SCF Sr1.5CoFe0.2O5 81 7 585 1.5 a Perovskite phase purity calculated using XRD diffraction pattern and the ratio between the single perovskite phase and any impurities. b Lattice oxygen calculated by the ratio of lattice oxygen species to the sum of molecular water, hydroxyl species, transition metal lattice oxygen as derived from XPS measurements.
Analysis of the O 1s region in XPS gives an indication of the species of oxygen
present on the surface of the catalyst. There are four notable oxygen species; lattice
oxygen O2- which is seen at around 528.6 eV,24–27 lattice oxygen species due to
transition metal species at ca. 529.5 eV (Co or Fe),28–31 hydroxyl species OH- at 531
eV,32 and finally surface adsorbed molecular water at 533 eV.33–44 The water is
trapped within the lattice, rather than being physisorbed on the surface as this
would be removed when under the ultra-high vacuum conditions required for XPS.

Chapter 5 Lattice oxygen and surface area for N2O decomposition
136
Lattice oxygen is also referred to as β oxygen, with oxygen vacancies being referred
to as α oxygen. The oxygen region of the spectra of both BPC and LSC show all four
species of oxygen as being present. Most notably a large percentage of lattice
oxygen species are present in both, with 43 % in the LSC catalyst and 33 % in BPC,
with the rest of the percentage made up from lattice oxygen from transition metal
species and hydroxyl species. It is important to note that the least active catalyst in
this series (SCF) has very limited lattice oxygen present in the XPS spectra (Table
5.2), and generally as the lattice oxygen species concentration increase the activity
also increases (remembering the influence of other factors such as surface area,
oxygen vacancies and mobility). The surface does not contain these lattice oxygen
species, instead the carbon region indicates that the surface contains a thin layer
of carbonate species that could have formed when Sr came into contact with the
atmosphere.45 There is a large peak at 531 eV in the O 1s spectra that can either be
a contribution from OH- or CO3- species, in this case it is from carbonate species,
confirmed by the carbon spectra. The Sr carbonate species is hygroscopic, as shown
by the large peak assigned to molecular water on the surface at 533 eV, ca. 14 % of
the O 1s spectra. Notably, the oxide of Sr is found at a slightly lower binding energy
than other elements, with a response seen at 527 eV.46–49 The lack of lattice oxygen
observed may be a result of the surface sensitive nature of XPS with an analysis
depth of ca. 8-10 nm. Therefore, an abundance of lattice oxygen in the bulk will not
be represented.

Chapter 5 Lattice oxygen and surface area for N2O decomposition
137
Fig. 5.9. XPS O 1s region of LSC, BPC and SCF catalysts. Fittings: Red – lattice O2-, Blue – lattice O2- transition metal, Orange – hydroxyl species OH- and Purple – molecular water on surface.
The lower activity of the LSC catalyst indicates that lattice oxygen species are crucial
for the decomposition of N2O (Fig. 5.10). This is due to N2O adsorption taking place
at a vacant site, such as a coordinatively unsaturated metal, followed by
decomposition and release of N2, with adsorbed O. The rate-limiting step of this
reaction is the recombination of oxygen, therefore, a high lattice oxygen
concentration with sufficient mobility can aid this reaction step and produce a more
active catalyst. In the case of SCF, the lack of lattice oxygen indicates that the mobile
oxygen from N2O saturates the deficient sites and does not facilitate oxygen
recombination at low temperatures, with temperatures greater than 600 °C
required for oxygen recombination.
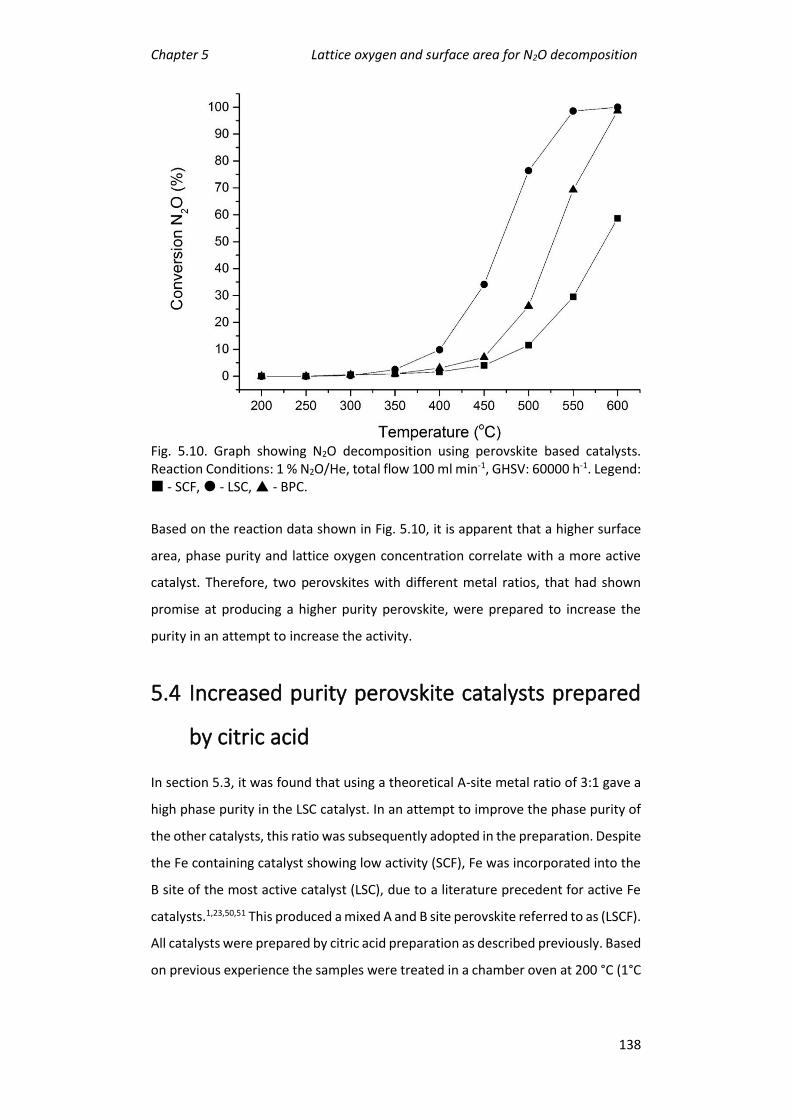
Chapter 5 Lattice oxygen and surface area for N2O decomposition
138
Fig. 5.10. Graph showing N2O decomposition using perovskite based catalysts. Reaction Conditions: 1 % N2O/He, total flow 100 ml min-1, GHSV: 60000 h-1. Legend: - SCF, - LSC, - BPC.
Based on the reaction data shown in Fig. 5.10, it is apparent that a higher surface
area, phase purity and lattice oxygen concentration correlate with a more active
catalyst. Therefore, two perovskites with different metal ratios, that had shown
promise at producing a higher purity perovskite, were prepared to increase the
purity in an attempt to increase the activity.
5.4 Increased purity perovskite catalysts prepared
by citric acid
In section 5.3, it was found that using a theoretical A-site metal ratio of 3:1 gave a
high phase purity in the LSC catalyst. In an attempt to improve the phase purity of
the other catalysts, this ratio was subsequently adopted in the preparation. Despite
the Fe containing catalyst showing low activity (SCF), Fe was incorporated into the
B site of the most active catalyst (LSC), due to a literature precedent for active Fe
catalysts.1,23,50,51 This produced a mixed A and B site perovskite referred to as (LSCF).
All catalysts were prepared by citric acid preparation as described previously. Based
on previous experience the samples were treated in a chamber oven at 200 °C (1°C

Chapter 5 Lattice oxygen and surface area for N2O decomposition
139
min-1, 2 hours) and calcined at 500 °C (1 °C min-1, 3 hours) before in situ XRD was
used to determine the final calcination temperature.
The perovskite prepared were as follows:
• La0.75Sr0.25Co0.81Fe0.19Ox (LSCF)
• Pr0.75Ba0.25CoOx (PBC)
In situ XRD was performed on PBC (Fig. 5.11) and LSCF (Fig. 5.12) from 550 to 850 °C,
and in both cases the pure phase perovskite was formed at 550 °C, which is
remarkably low. After cooling to 25 °C there is a shift in the reflections for the PBC
catalyst (Fig. 5.11). In the case of LSCF (Fig. 5.12) there is a visible split in the
reflections after cooling, most notably at 22.5 °. When the perovskites are subject
to heating conditions further mass loss of catalysts precursors of around 20 % is
expected, which can cause the sample to physically contract, reducing the sample
volume and disrupt the XRD path, causing a shift or split in reflections seen.
Secondly this could be due to the formation of different phase during the cooling
process. However, as the catalysts does not need to be heated to 850 °C, this was
not subjected to further investigation. Powder XRD measurements were taken after
calcination at 550 °C on both catalysts to confirm the phase present.

Chapter 5 Lattice oxygen and surface area for N2O decomposition
140
Fig. 5.11. In situ XRD of Pr0.75Ba0.25CoOx treated to 500 °C prior to analysis heated from 550 °C to 850 °C in air (5 ml min-1).
Fig. 5.12. In situ XRD of La0.75Sr0.25Co0.81Fe0.19Ox treated to 500 °C prior to analysis heated from 550 °C to 850 °C in air (5 ml min-1).

Chapter 5 Lattice oxygen and surface area for N2O decomposition
141
As the temperature required to form a pure phase indicated by in situ XRD for both
PBC and LSCF was very low, a TGA was performed to confirm that no further mass
loss events occur after this temperature, as this would indicate that a pure phase
perovskite had not been formed. In the case of PBC (Fig. 5.13) the last major mass
loss occurred at 570 °C, indicating that the pure phase can form after being held at
550 °C for an extended period of time. The major mass loss events occur at 170 °C
(citric acid decomposition), 300 °C (Co and Ba nitrates decomposition) followed by
the final decomposition at 570 °C (Pr nitrate).
Fig. 5.13. TGA of Pr0.75Ba0.25CoOx up to 850 °C at 5 °C min-1 in air at 50 ml min-1.
In relation to LSCF (Fig. 5.14), the last major mass loss occurred a 580 °C, indicating
that the pure phase can form at 550 °C, when held at 550 °C for 3 hours. The major
mass loss events occur at 160 °C (citric acid, La and Fe nitrate decomposition),
300 °C (Co nitrate decomposition) followed by the final decomposition at 580 °C (Sr
nitrate).

Chapter 5 Lattice oxygen and surface area for N2O decomposition
142
Fig. 5.14. TGA of La0.75Sr0.25Co0.81Fe0.19Ox up to 850 °C at 5 °C min-1 in air at 50 ml min-
1.
Powder XRD of the final catalysts was performed to confirm the phase present. In
the case of PBC (Fig. 5.15), a pure phase forms at 550 °C. Further experiments were
conducted to assess whether the second pre-treatment at 500 °C is required. The
catalyst was prepared without this step and XRD was subsequently performed. It is
possible to see from the XRD reflections that no change is noted, and therefore the
second step is not necessary as a phase purity of 100 % is achieved regardless of
whether the pre-treatment step was performed. Similarly, for the LSCF catalyst (Fig.
5.16) the second pre-treatment at 500 °C was deemed unnecessary, as the same
phase forms when this step is omitted. In both cases, a cubic structure is noted by
XRD, with all reflections assigned to the cubic structure, in the phase present.

Chapter 5 Lattice oxygen and surface area for N2O decomposition
143
Fig. 5.15. XRD comparison of effect of intermediate pre-treatment at 500 °C on phase purity of Pr0.75Ba0.25CoOx. Temperatures in the labels are the pre-treatment temperatures.
Fig. 5.16. XRD comparison of effect of intermediate pre-treatment at 500 °C on phase purity of La0.75Sr0.25Co0.81Fe0.19Ox. Temperatures in the labels are the pre-treatment temperatures.

Chapter 5 Lattice oxygen and surface area for N2O decomposition
144
In addition to phase purity and relatively high surface area, the oxygen species
present in the catalyst have shown to be an important influence in the activity of
the catalyst for N2O decomposition. Therefore, through analysis of the O 1s region
in the XPS of PBC and LSCF (Fig. 5.17) it is possible to predict the activity. The high
percentage of lattice oxygen present at the surface in LSCF could suggest a high
oxygen mobility due to the increased concentration of lattice oxygen species and
therefore an increased activity compared to LSC and SCF. The PBC catalyst contains
less amounts of lanthanide lattice oxygen species to the previously studied BPC, but
comparable lattice oxygen when both the lanthanide and transitional lattice oxygen
species are combined, 38 % in BPC and 39 % in PBC. Therefore, based on the
increase in purity and similar lattice O2- the catalyst was predicted to be slightly
better than the first-generation catalyst. An increased purity should lead to a more
active catalyst as all active metal is incorporated into the active structure, rather
than being present as an inactive impurity.
Fig. 5.17. XPS O 1s region of PBC and LSCF catalysts prepared by citric acid decomposition. Fittings: Red – lattice O2-, Blue – lattice O2- transition metal, Orange – hydroxyl species OH- and Purple – molecular water on surface.

Chapter 5 Lattice oxygen and surface area for N2O decomposition
145
When comparing the N2O conversion of the second-generation catalysts to the first,
both outperform the preceding catalysts. Fig. 5.18 shows the catalytic activity, with
N2O conversion over BPC increasing from 7 % at 450 °C to 58 % over the PBC catalyst
(T50 decreases from 527 °C, to 445 °C). These catalytic activity results illustrated in
Table 5.3 suggest that the increase in phase purity and the presence of lattice
oxygen has led to a higher activity. The low surface area may further hinder the
activity of the PBC catalyst, despite the surface area of the catalyst being higher
than seen previously, now achieving 12 m2 g-1 compared to 3 m2 g-1; this is due to
the low calcination temperature required to form a pure phase perovskite. The
higher the heat treatment the lower the surface area, this is due to the higher
surface area structure collapsing during the heating process. The structures
basically crumble at higher temperatures.
LSCF also demonstrated higher activity than both the original LSC and SCF catalysts,
with 62 % conversion at 450 °C (T50 decreased to 432 °C from 468 °C (LSC) and 585 °C
(SCF)). The incorporation of Fe into the B site of the LSC catalyst allowed the use of
a lower calcination temperature to form a phase pure perovskite. The surface area
of the catalyst remained consistent at 15 m2 g-1 without Fe (LSC), to 13 m2 g-1 with
Fe. By incorporating Fe, the percentage of surface lattice oxygen species remained
the same, with 39 % in LSCF and 42 % in LSC, but a large increase on the 1 % seen
in the SCF catalyst. As the concentration of surface lattice oxygen and the surface
area have remained constant in the LSC to LSCF catalysts, this indicates that another
factor is contributing to the increase in activity. One hypothesis could be that
although the concentration of lattice oxygen species remains, the same the mobility
of these species is different, with the more active catalyst having more mobile
oxygen species, which can be confirmed by O2 TPD experiments. As the mobile
oxygen species are necessary to aid oxygen recombination during the
decomposition of N2O.

Chapter 5 Lattice oxygen and surface area for N2O decomposition
146
Fig. 5.18. Comparison of catalyst activity of all citric acid catalysts over the temperature range of 200 to 600 °C for N2O Decomposition. Reaction conditions: 1 % N2O/He, total flow 100 ml min-1. Legend: - BPC, - LSC, - SCF, - PBC 200 °C + 550 °C, - LSCF 200 °C + 550 °C.
Literature reports suggest that a high surface area will lead to an active catalyst. 1–
4,52 Most attempts at increasing the surface area of perovskites have found success
through supporting the perovskites on high surface area supports. Alini et al.
supported a CaMn0.6Cu0.4O3 perovskite on a CeO2-ZrO2 support, the surface area of
this catalyst increased from 15 m2 g-1 to 63 m2 g-1, with a 10 % perovskite loading.
The N2O conversion over the catalyst increased from 58 % to 67 % at 500 °C. The
group linked both the increase in surface area and the contribution of the supports
oxygen mobility to increase in activity observed.1 However Dacquin et al. reported
that it was possible to increase the surface area of a LaCoO3 from 12 to 50 m2 g-1 by
changing the preparation method from templating to reactive grinding. The group
stated that the highest surface area catalysts was the most active for N2O
decomposition even though the phases of perovskite present remain constant
between preparation methods and that the increase in activity is down to the
increases in specific surface area and the higher density of oxygen vacancies
present. 51 Therefore, subsequent work focused on using a different preparation
method to produce a pure phase, high surface area perovskite.

Chapter 5 Lattice oxygen and surface area for N2O decomposition
147
Table 5.3. Composition determined by MP-AES, surface area, phase purity and the temperature required for 50 % conversion (T50).
Catalyst Composition determined by MP-AES
Perovskite Phase Purity (%)a
Surface area (m2 g-1)
T50 (°C)
Lattice O (%)b
LSCF LaSr0.5CoFe0.1O5.8 100 13 432 34.2
PBC Pr0.8Ba0.4CoO5.9 100 12 445 19.1 a Perovskite phase purity calculated using XRD diffraction pattern and the ratio between the single perovskite phase and any impurities. b Lattice oxygen calculated by the ratio of lattice oxygen species to the sum of molecular water, hydroxyl species, transition metal lattice oxygen as derived from XPS measurements.
5.5 Increased purity and surface area perovskite
catalysts prepared by supercritical antisolvent
preparation
As shown in 5.4, the purity of the perovskite can be increased by altering the ratio
in the A and B sites. Furthermore, these ratios allow lower temperatures to be
implemented in order to form the pure perovskite phase under calcination. These
ratios were therefore utilised with different preparation methods in an attempt
form higher surface area materials. High surface area perovskites are
characteristically very difficult to form, with surface area typically being less than
10 m2 g-1. Supercritical anti-solvent (SAS) preparation was explored, as it has been
shown previously to produce high surface area materials, with respect to
conventional perovskite preparation methods. 53
The perovskites prepared by supercritical anti-solvent as described in section 2.2.8
were as follows:
• La0.75Sr0.25Co0.81Fe0.19Ox (LSCF SAS)
• Pr0.75Ba0.25CoOx (PBC SAS)
TGA was once again used to determine a suitable pre-treatment temperature as
major mass loss was expected and therefore not suitable to use an untreated
sample for in situ XRD. For LSCF SAS (Fig. 5.19) the mass loss events all take place
below 600 °C. The major event at up to 100 °C is due to the loss of methanol and
water, followed by the decomposition of the metal precursors between 150 and

Chapter 5 Lattice oxygen and surface area for N2O decomposition
148
600 °C. There are no well-defined mass loss events with La acetyl acetone (125, 200
and 520 °C), Sr acetate (230 and 475 °C), Fe acetate (80 and 285 °C) and Co acetate
(90, 135, 215 and 315 °C) precursors decomposing over the range of 150 and 600 °C.
Therefore 300 °C was selected as a suitable pre-treatment temperature, if the
catalyst was heated to the temperature at which the final mass loss event occurred
at 600 °C) then it would be possible that the phase transformation would be missed
as the previous series of catalysts were a pure phase perovskite at 550 C. The pre-
treatment consisted of 300 °C at 1 °C min-1 for 2 hours in a chamber furnace.
Fig. 5.19. TGA of La0.75Sr0.25Co0.81Fe0.19Ox prepared by SAS up to 850 °C at 5 °C min-1 in flowing air at 50 ml min-1.
The TGA of the PBC SAS sample (Fig. 5.20) revealed that all major loss events
occurred below 650 °C. As before, a major mass loss below 100 °C due to the loss
of methanol and water from the sample, followed by decomposition of the metal
precursors between 150 – 640 °C. There are many mass loss events that occur over
the temperature range 150- 640 °C due to the decomposition of the following
precursors, Pr acetate (170, 275-380 and 560 °C), Ba acetate (225, 325, 445 and
500 °C) and Co acetate (90, 135, 215 and 315 °C). Therefore, 300 °C was selected as
a suitable pre-treatment temperature, for the same reason as previously described,
the pre-treatment consisted of 300 °C at 1 °C min-1 for 2 hours in a chamber furnace.

Chapter 5 Lattice oxygen and surface area for N2O decomposition
149
Fig. 5.20 TGA of Pr0.75Ba0.25CoOx prepared by SAS up to 850 °C at 5 °C min-1 in flowing air at 50 ml min-1.
In situ XRD was performed to determine the temperature at which a pure phase
perovskite is formed. For the LSCF SAS (Fig. 5.21) sample, the perovskite phase
starts to form at 550 °C, although it does not fully form until 800 °C, with the purity
reaching a maximum of 93 % at this temperature. Most reflections correspond to a
rhombohedral structure, except the single reflection at 36 ° which corresponds to
a cubic structure. A high temperature is required for calcination (800 °C), which may
also lead to a low surface area perovskite. In the XRD at 50 °C, after cooling, there
is a splitting of the reflections, most notably at 33 °. As described previously this
could be due to the mass loss that takes place during the heating process, which
results in an incorrectly filled in situ XRD cell and subsequently an imperfect surface
on which the XRD diffraction pattern is recorded. Alternatively, it could be due to
the formation of a new phase system. In this case it is likely to be the second, with
a new phase formed that has a rhombohedral structure; the phase seen at 800 °C
is a cubic structure, that when cooled, transforms to a rhombohedral structure. An
XRD measurement was performed at room temperature after calcination at 800 °C
and confirmed a single rhombohedral phase present.

Chapter 5 Lattice oxygen and surface area for N2O decomposition
150
Fig. 5.21. In situ XRD of La0.75Sr0.25Co0.81Fe0.19Ox treated to 300 °C prior to analysis heated from 550 °C to 800 °C in air (20 ml min-1). Dashed line – impurity, all other reflections perovskite phase.
In the case of the PBC SAS (Fig. 5.22) sample, the perovskite phase does not start
to form until 600 °C, with a 100 % pure phase forming at 700 °C. The same
reflections can be observed in all spectra taken above 700 °C, this is an indication
of final phase formation, the reflections are indicative of an orthorhombic
structure.
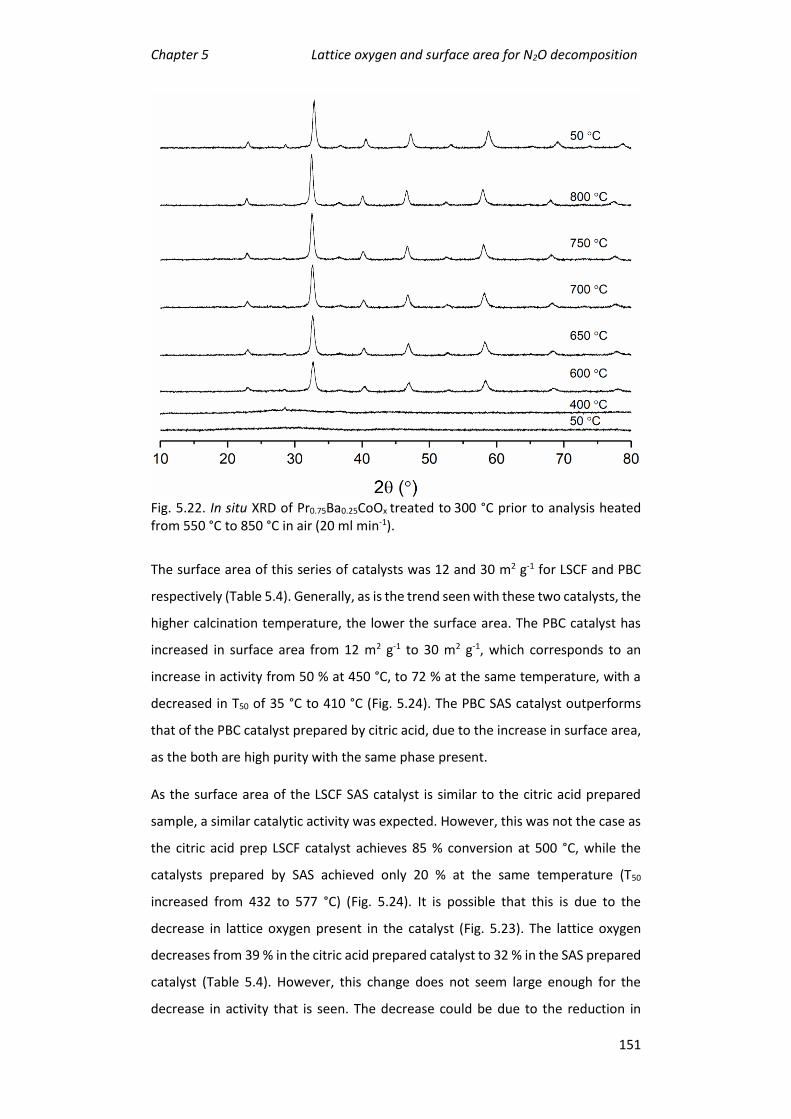
Chapter 5 Lattice oxygen and surface area for N2O decomposition
151
Fig. 5.22. In situ XRD of Pr0.75Ba0.25CoOx treated to 300 °C prior to analysis heated from 550 °C to 850 °C in air (20 ml min-1).
The surface area of this series of catalysts was 12 and 30 m2 g-1 for LSCF and PBC
respectively (Table 5.4). Generally, as is the trend seen with these two catalysts, the
higher calcination temperature, the lower the surface area. The PBC catalyst has
increased in surface area from 12 m2 g-1 to 30 m2 g-1, which corresponds to an
increase in activity from 50 % at 450 °C, to 72 % at the same temperature, with a
decreased in T50 of 35 °C to 410 °C (Fig. 5.24). The PBC SAS catalyst outperforms
that of the PBC catalyst prepared by citric acid, due to the increase in surface area,
as the both are high purity with the same phase present.
As the surface area of the LSCF SAS catalyst is similar to the citric acid prepared
sample, a similar catalytic activity was expected. However, this was not the case as
the citric acid prep LSCF catalyst achieves 85 % conversion at 500 °C, while the
catalysts prepared by SAS achieved only 20 % at the same temperature (T50
increased from 432 to 577 °C) (Fig. 5.24). It is possible that this is due to the
decrease in lattice oxygen present in the catalyst (Fig. 5.23). The lattice oxygen
decreases from 39 % in the citric acid prepared catalyst to 32 % in the SAS prepared
catalyst (Table 5.4). However, this change does not seem large enough for the
decrease in activity that is seen. The decrease could be due to the reduction in

Chapter 5 Lattice oxygen and surface area for N2O decomposition
152
purity between the two catalysts: the catalyst prepared using citric acid has a purity
of 100 % but the catalysts prepared by SAS has a purity of only 93 %. This is not a
drastic decrease in purity compared to the decrease in activity; therefore, the
decrease in activity could be indicative that the lattice oxygen species present are
not as mobile as in the citric acid prepared catalyst.
Fig. 5.23. XPS O 1s region of PBC and LSCF catalysts prepared by SAS. Fittings: Red – lattice O2-, Blue – lattice O2- transition metal, Orange – hydroxyl species OH- and Purple – molecular water on surface.

Chapter 5 Lattice oxygen and surface area for N2O decomposition
153
Fig. 5.24. Effect of preparation method on both Pr0.75Ba0.25CoOx and La0.75Sr0.25Co0.81Fe0.19Ox for N2O decomposition over the temperature range of 200 to 600 °C. Reaction conditions: 1 % N2O/He, total flow 100 ml min-1. Legend: - PBC, - PBC SAS, - LSCF, - LSCF SAS.
Table 5.4. Composition determined by MP-AES, Surface area, phase purity and the temperature required for 50 % conversion (T50).
Catalyst Composition determined by MP-AES
Perovskite Phase Purity (%)a
Surface area (m2 g-1)
T50 (°C)
Lattice O (%)b
LSCF SAS La0.8Sr0.1CoFe0.2O5.2 93 12 577 29.5
PBC SAS Pr0.6Ba0.3CoO4.2 100 30 410 24.5 a Perovskite phase purity calculated using XRD diffraction pattern and the ratio between the single perovskite phase and any impurities. b Lattice oxygen calculated by the ratio of lattice oxygen species to the sum of molecular water, hydroxyl species, transition metal lattice oxygen as derived from XPS measurements.
Additional work on this topic was designed to further investigate the effect of
surface area, purity and lattice oxygen concentration on the activity of perovskite
catalysts for N2O decomposition. This was achieved by preparing the two most
active catalysts (PBC and LSCF) by another preparation method. The following
section details the effect of using an oxalic acid preparation method.

Chapter 5 Lattice oxygen and surface area for N2O decomposition
154
5.6 Increased purity perovskite catalysts prepared
by oxalic acid precipitation method
In the previous sections (5.3, 5.4 and 5.5) it has been shown that the purity of the
perovskite can be increased by altering the ratio in the A and B sites. The same
ratios have been used in this section for comparison, but with different preparation
methods. In this section, an oxalic acid precipitation method, described in section
2.2.7, has been used to prepare the perovskites LSCF and PBC.
The perovskite prepared were as follows:
• La0.75Sr0.25Co0.81Fe0.19Ox (LSCF Oxalic)
• Pr0.75Ba0.25CoOx (PBC Oxalic)
As shown previously, TGA has been used to determine a suitable pre-treatment
temperature as major mass loss was expected and therefore not suitable to use an
untreated sample for in situ XRD. For LSCF Oxalic (Fig. 5.25) the mass loss events all
take place below 650 °C with a substantial event around 100 °C due to the loss of
oxalic acid. This is followed by the decomposition of the metal precursors between
150 and 650 °C. The most notable loss occurred at 270 °C, due to the decomposition
of the Co, La and Fe precursors, with other mass loss events occurring at 200 °C,
due to oxalic acid and Fe nitrate decomposition, and at 650 °C due to the
decomposition of Sr nitrate. Therefore, 300 °C was selected as a suitable pre-
treatment temperature even though the final mass loss event occurred at 650 °C.
This is because if the catalysts was pre-treated to 650 °C, the perovskite phase may
of already formed and the temperature at which this occurred at will not be known.
The citric acid prepared PBC and LSCF catalysts formed pure phase perovskites at

Chapter 5 Lattice oxygen and surface area for N2O decomposition
155
550 °C, this would have been missed in this case. The pre-treatment is performed
using a ramp rate of 1 °C min-1, for 2 hours in a chamber oven.
Fig. 5.25. TGA of La0.75Sr0.25Co0.81Fe0.19Ox prepared by oxalic acid prep up to 850 °C at 5 °C min-1 in flowing air at 50 ml min-1.
In the case of PBC Oxalic (Fig. 5.26), the last major event loss occurs around 600 °C.
A significant mass loss below 100 °C, due to the removal of oxalic acid from the
sample, is followed by decomposition of the metal precursors between 250 –
600 °C. Most notably, the major mass loss event occurred at 280 °C due to the
decomposition of the Co and Pr precursors, with other mass loss events occurring
at 175 °C due to oxalic acid decomposition, 350°C due to Pr nitrate and at 600 °C
due to the decomposition of Ba nitrate. Therefore, as described previously, 300 °C
was selected as a suitable pre-treatment temperature.

Chapter 5 Lattice oxygen and surface area for N2O decomposition
156
Fig. 5.26. TGA of Pr0.75Ba0.25CoOx prepared by oxalic acid prep up to 850 °C at 5 °C min-1 in flowing air at 50 ml min-1.
In situ XRD was performed to determine the temperature that a pure phase
perovskite can be formed. For LSCF Oxalic (Fig. 5.27), the perovskite phase starts to
form at 600 °C but does not fully form until 800 °C. All reflections correspond to the
formation of a 100 % pure rhombohedral phase. Therefore, a high temperature is
required for calcination, suggesting that a low surface area perovskite may be
formed. In the XRD diffraction pattern at 50 °C, after cooling, there is a splitting of
the reflections most notably at 33 °. As described previously, this could be due to
the expected mass loss that occurs during the heating process, and therefore an
imperfect surface may form within the sample cell, on which a perfect XRD
diffraction pattern cannot be recorded. Alternatively, it could be due to the
formation of a new phase system. In this case it is likely to be the second, a new
phase has formed that has a rhombohedral structure, as the phase seen at 800 °C
is a cubic structure that when cooled transforms to a rhombohedral structure. An
XRD measurement was performed after calcination and confirmed a single phase
present, confirming the transformation from a cubic to rhombohedral structure.

Chapter 5 Lattice oxygen and surface area for N2O decomposition
157
Fig. 5.27. In situ XRD of La0.75Sr0.25Co0.81Fe0.19Ox, treated to 200 °C prior to analysis, heated from 550 °C to 850 °C in air (20 ml min-1).
In the case of PBC (Fig. 5.28) the perovskite phase does not start to form until
550 °C, with a pure phase forming at 700 °C. The same reflections are seen in all
spectra above 700 °C, this is an indication of final phase formation. The purity of
this catalyst reaches a maximum of 96 % at 700 °C, therefore, this temperature was
selected for the final calcination temperature. The major reflections are indicative
of a tetragonal structure, with the impurities having a cubic structure. The
reflections of the impurity phase are seen at 28.7, 36.6 and 56.5 °. After cooling to
50 °C, there is a shift in the reflections, with all 2θ values increasing by +0.47 ° to
+0.99 °. This is due to the contraction of the solid after heating, leaving an imperfect
surface that the XRD diffraction pattern is recorded on.

Chapter 5 Lattice oxygen and surface area for N2O decomposition
158
Fig. 5.28. In situ XRD of Pr0.75Ba0.25CoOx, treated to 200 °C prior to analysis, heated from 550 °C to 850 °C in air (20 ml min-1). Dashed line – Impurities. All other reflections perovskite phase.
As suggested previously, the oxygen species present in the perovskite may play a
large part in the activity. XPS can be used to determine the oxygen species present,
with four main species seen: lattice oxygen from lanthanide elements, lattice
oxygen from transition metals, hydroxyl species or molecular water. 33–35,54
Molecular water is lost during the reaction due to the increase in temperature,
while the hydroxyl species just block the surface of the catalysts.
In the case of LSCF (Fig. 5.29), all oxygen species are present, most notably there is
a large peak associated to lattice oxygen. In addition to lattice oxygen being
required, oxygen mobility has also been shown to be crucial in the decomposition
of N2O due to the requirement to recombine O to form O2 in the rate determining
step. If there is a large amount of lattice oxygen present that is mobile, this can then
bind with the deposited O forming O2 and regenerate the active site. In LSCF, 34 %
of the oxygen present is in the form of lattice oxygen, similar to what is seen in the
citric acid preparation, therefore the activity should be comparable. In PBC, again
all oxygen species are present (Fig. 5.29), with 27 % of the oxygen present as lattice
oxygen. This is the highest percentage of lattice oxygen across all the PBC catalysts

Chapter 5 Lattice oxygen and surface area for N2O decomposition
159
prepared by different preparation methods, and therefore this was predicted to be
the most active catalysts in the series.
Fig. 5.29. XPS O 1s region of PBC and LSCF catalysts prepared by oxalic acid precipitation method. Fittings: Red – lattice O2-, Blue – lattice O2- transition metals, Orange hydroxyl species OH-, and Purple – molecular water on surface.
The activity of the LSCF Oxalic catalyst was not as good as the citric acid prepared
catalyst, with 80 % conversion achieved at 550 °C compared to the LCSF catalyst
which 98 % at the same temperature (T50 increased from 432 to 475°C) (Fig. 5.30.
a). Although both catalysts have the same percentage of lattice oxygen the mobility
of the species present may be different. The oxalic acid prepared catalysts may have
less mobile lattice oxygen species compared to the citric acid prepared catalyst,
leading to a lower activity. The surface area of the LSCF catalysts has remained fairly
consistent across preparation methods, from 12 – 14 m2 g-1 (Table 5.5), indicating
that for this catalyst the surface area is not as important a factor as initially thought.
When the conversion is normalised by surface area (Fig. 5.30 b) there is no change
in trends seen as the surface area values are all so similar.

Chapter 5 Lattice oxygen and surface area for N2O decomposition
160
Fig. 5.30. (a) Effect of preparation method on La0.75Sr0.25Co0.81Fe0.19Ox for N2O decomposition over the temperature range of 200 to 600 °C. (b) Surface area normalised reaction data showing the effect of preparation method on La0.75Sr0.25Co0.81Fe0.19Ox for N2O decomposition over the temperature range of 200 to 600 °C. Reaction conditions: 1 % N2O/He, total flow 100 ml min-1. Legend: - LSCF Citric, - LSCF SAS, - LSCF Oxalic.
When comparing the O2-TPD profiles of the three catalysts it is possible to compare
the mobility of the lattice oxygen present. As there is no response in the region <
700 °C meaning only β-oxygen (also referred to as lattice oxygen) is considered to
be present. A greater response during the O2-TPD indicates a higher mobility of
lattice oxygen present. The lower the temperature at which a response is noted,
the more mobile the oxygen species present are. 13,37,55–58 As mobility increases, the
activity of the catalysts should also increase, if the mobility of the oxygen is as
important as it has been described.21,23,58,59 Fig. 5.31 displays the O2-TPD
experiments of LSCF prepared by the three preparation methods. As predicted by
XPS, the SAS preparation produced the catalyst with the lowest response, with the
signal forming at the highest temperature; this corresponds to lattice oxygen that
is not mobile, hence producing a non-active catalyst. The catalyst is not completely
inactive, due to the small signal response seen at around 700 °C that corresponds
to a small amount of mobile lattice oxygen. The oxalic and citric catalysts have
similar responses at 750 °C, therefore, the mobility of the lattice oxygen is similar
at these temperatures hence why at low temperatures the activity of the catalysts
is similar. All catalysts show no response in the O2-TPD between 300 – 700 °C, this
is the region in which α-Oxygen is present. α-Oxygen is also referred to as oxygen
vacancies; this indicates that there are a very limited number of oxygen vacancies
with in this series of catalysts. Oxygen vacancies are important in this reaction as it
is thought that the oxygen terminal of N2O could bind at a vacancy site and then
initiate the decomposition of N2O, as shown in Mechanism 1.
(a) (b)

Chapter 5 Lattice oxygen and surface area for N2O decomposition
161
𝑁2𝑂(𝑔𝑎𝑠) + 𝑂𝑣𝑎𝑐 → 𝑁2𝑂(𝑎𝑑𝑠)
𝑁2𝑂(𝑎𝑑𝑠) → 𝑁2 (𝑔𝑎𝑠) + 𝑂(𝑎𝑑𝑠)
𝑂(𝑎𝑑𝑠) + 𝑂(𝑎𝑑𝑠) → 𝑂2 (𝑔𝑎𝑠) + 2 𝑂𝑣𝑎𝑐
Mechanism 1. N2O decomposition mechanism on the surface of a perovskite. Showing the use of oxygen vacancies and the importance of the mobility of lattice oxygen (Oads).
If there are limited number of the oxygen vacancy sites, then the catalyst may be
limited in activity. The citric acid prepared catalyst does outperform that of the
oxalic catalyst as past 750 °C more lattice oxygen is desorbed and therefore more
mobile and available for reaction. Here the trend in activity is related to the lattice
oxygen percentage and the mobility of these species, the more mobile lattice
oxygen the more active the catalyst for N2O decomposition.
Fig. 5.31. Oxygen temperature programmed desorption (O2-TPD) of La0.75Sr0.25Co0.81Fe0.19Ox catalysts, Black - Citric prep, Red - SAS prep, Blue - Oxalic prep.
In the case of the PBC material, all preparation methods lead to the production of
catalysts with very similar activity for N2O decomposition at temperatures greater
than 500 °C (Fig. 5.32 a). However, at temperatures lower than this the difference
in activity is more notable: the oxalic acid catalyst achieves a T50 431 °C, compared

Chapter 5 Lattice oxygen and surface area for N2O decomposition
162
to T50 445 °C for the citric catalyst and T50 410 °C for the SAS catalyst. This does not
follow the trend that the more lattice oxygen the more active the catalyst for N2O
decomposition. Lattice oxygen does affect the activity, but is not the only
contributing factor, with surface area playing a role. The activity in terms of lattice
oxygen should follow the order, oxalic acid prep as the most active, followed by SAS
and then the citric acid as the least active. However, in reality the most active
catalyst is prepared by SAS precipitation method, followed by oxalic and then citric
acid preparation methods. This could be linked to the surface area as the SAS
catalyst has an extremely high surface area of 30 m2 g-1 compared to 12 m2 g-1 for
the oxalic and 9 m2 g-1 for the citric acid prep. Therefore, when the N2O conversion
data is normalised to surface area the oxalic acid prepared PBC catalyst out
performs the other two preparation methods, even though this has the lowest
percentage of lattice oxygen (Fig. 5.32 b). This is due to the catalyst having the most
mobile oxygen species, as shown by O2-TPD (Fig. 5.33). As mentioned previously
there are three oxygen species that can be identified during O2 TPD, with
desorption below 300 °C indicating that chemically adsorbed O2 is present. α-
Oxygen desorbs at 300 – 700 °C which is oxygen that is present in an oxygen
vacancy. Finally, at temperatures greater than 700 °C, lattice oxygen (β-O)
desorbs. .13,37,55–58 In the case of the PBC sample, the activity very closely follows the
trend of the more mobile the lattice O present, the more active the catalyst. The
SAS catalyst has the greatest response in the region 300 – 700 °C and therefore has
the most oxygen vacancies, which are thought to be the active site based on
Mechanism 1. Secondly, as shown in Fig. 5.31, the peak due to lattice oxygen for
the SAS catalyst is at the lowest temperature (775 °C) and therefore has the most
mobile lattice oxygen out of the three preparation methods. The oxalic catalyst has
the second largest response between 300 – 750 °C, with the lattice oxygen peak at
785 °C, which results in this catalyst displaying the second highest catalytic activity.
The citric acid prepared catalyst has the lowest catalytic activity as it has the least
oxygen vacancies and the least mobile lattice oxygen (800 °C). As described before,
a low oxygen mobility may limit oxygen recombination after N2O has adsorbed and
dissociated to N2 and O on the surface. As the adsorbed O must combine with
another O species to form O2, if the surface species are not mobile then this step

Chapter 5 Lattice oxygen and surface area for N2O decomposition
163
becomes rate determining (Mechanism 1). Therefore, the most active catalyst is
the catalyst with the most oxygen defects and the most mobile lattice oxygen.
Fig. 5.32. (a) Effect of preparation method on Pr0.75Ba0.25CoOx for N2O decomposition over the temperature range of 200 to 600 °C. (b) Surface area normalised reaction data showing the effect of preparation method on Pr0.75Ba0.25CoOx for N2O decomposition over the temperature range of 200 to 600 °C. Reaction conditions: 1 % N2O/He, total flow 100 ml min-1. Legend: - PBC Citric, - PBC SAS, - PBC Oxalic.
Fig. 5.33. Oxygen temperature programmed desorption (O2-TPD) of Pr0.75Ba0.25CoOx catalysts, Black - Citric prep, Red - SAS prep, Blue - Oxalic prep.
(a) (b)

Chapter 5 Lattice oxygen and surface area for N2O decomposition
164
Table 5.5. Composition determined by MP-AES, Surface area, phase purity and the temperature required for 50 % conversion (T50).
Catalyst Composition determined by MP-AES
Perovskite Phase Purity (%)a
Surface area (m2 g-1)
T50 (°C)
Lattice O (%)b
LSCF Oxalic La1Sr0.3CoFe0.2O5.5 100 14 475 34.2
PBC Oxalic Pr0.8Ba0.1CoO4.9 96 9 431 26.7 a Perovskite phase purity calculated using XRD diffraction pattern and the ratio between the single perovskite phase and any impurities. b Lattice oxygen calculated by the ratio of lattice oxygen species to the sum of molecular water, hydroxyl species, transition metal lattice oxygen as derived from XPS measurements.
Table 5.6 shows the comparison between all catalysts discussed in this Chapter.
When noting the trends, it is possible to see that by changing the ratio from BPC
where Ba and Pr are 50:50 in the A site to, PBC, where Pr:Ba is 75:25 in the A site,
the purity increases from 77 % to 100 %, along with the T50 decreasing from 527 to
445 °C. Therefore, changing the ratio has improved the purity and subsequently the
catalytic activity. Then, when comparing the three preparation methods for the PBC
catalyst the SAS prepared catalyst, produces the catalysts with the lowest T50
(410 °C). There are a few factors that could be at play here: the first is the higher
surface area that is achieved using the SAS preparation method, the second being
the % of lattice oxygen and the mobility of such species and then the presence of
oxygen vacancies with in the catalyst. Overall, the SAS preparation method
produces the catalyst with the largest signal response in the α-O region (vacancies)
and has the earliest onset of signal in the β-O region, indicating the most mobile
lattice oxygen species and the most oxygen vacancies. Along with a relatively high
surface area of 30 m2g-1, this produces the most active catalysts in the series.
The LSC and SCF perovskites elemental ratio were combined, and the purity of the
perovskite phase increased from 98 and 81 % respectively to 100 %; The activity of
the catalyst also increased with the T50 dropping from 468 and 527, respectively, to
432 °C. Again, altering the elemental ratios in the A and B site has led to the
production of a pure phase catalyst with increased activity for N2O decomposition.
When comparing preparation method of the LSCF perovskite, the citric acid
preparation mentioned previously produces the most active catalyst. This could be
due to a number of factors, the first being that the more mobile the lattice oxygen
present the more active the catalyst. With the earliest onset in the 700 – 850 °C
region in the O2-TPD being from the citric acid prepared LSCF perovskite. Secondly
the difference in activity between preparation methods may be due to the different

Chapter 5 Lattice oxygen and surface area for N2O decomposition
165
phases of perovskite present: in both the SAS and oxalic acid prepared perovskite a
rhombohedral phase is present, where as in the citric acid prepared perovskite a
cubic phase is present, as shown in Fig. 5.34. Both these factors may result in the
most active LSCF perovskite prepared by citric acid method.
Table 5.6. Comparison between all catalysts, preparation method, composition determined by MP-AES, surface area, phase purity and the temperature required for 50 % conversion (T50).
Catalyst Prep method
Calcination Temperature
(°C)
Composition determined by MP-
AES
Perovskite Phase Purity
(%)a
Surface area (m2
g-1)
T50 (°C)
Lattice O (%)b
LSC Citric Acid 900 La0.8Sr0.4CoO3.9 98 15 468 42.6
BPC Citric Acid 850 Ba0.6Pr0.6CoO4.5 77 3 527 33.0
SCF Citric Acid 900 Sr1.5CoFe0.2O5 81 7 585 1.5
LSCF Citric Acid 550 LaSr0.5CoFe0.1O5.8 100 13 432 34.2
PBC Citric Acid 550 Pr0.8Ba0.4CoO5.9 100 12 445 19.1
LSCF SAS 800 La0.8Sr0.1CoFe0.2O5.2 93 12 577 29.5
PBC SAS 700 Pr0.6Ba0.3CoO4.2 100 30 410 24.5
LSCF Oxalic 750 La1Sr0.3CoFe0.2O5.5 100 14 475 34.2
PBC Oxalic 700 Pr0.8Ba0.1CoO4.9 96 9 431 26.7 a Perovskite phase purity calculated using XRD diffraction pattern and the ratio between the single perovskite phase and any impurities. b Lattice oxygen calculated by the ratio of lattice oxygen species to the sum of molecular water, hydroxyl species, transition metal lattice oxygen as derived from XPS measurements.
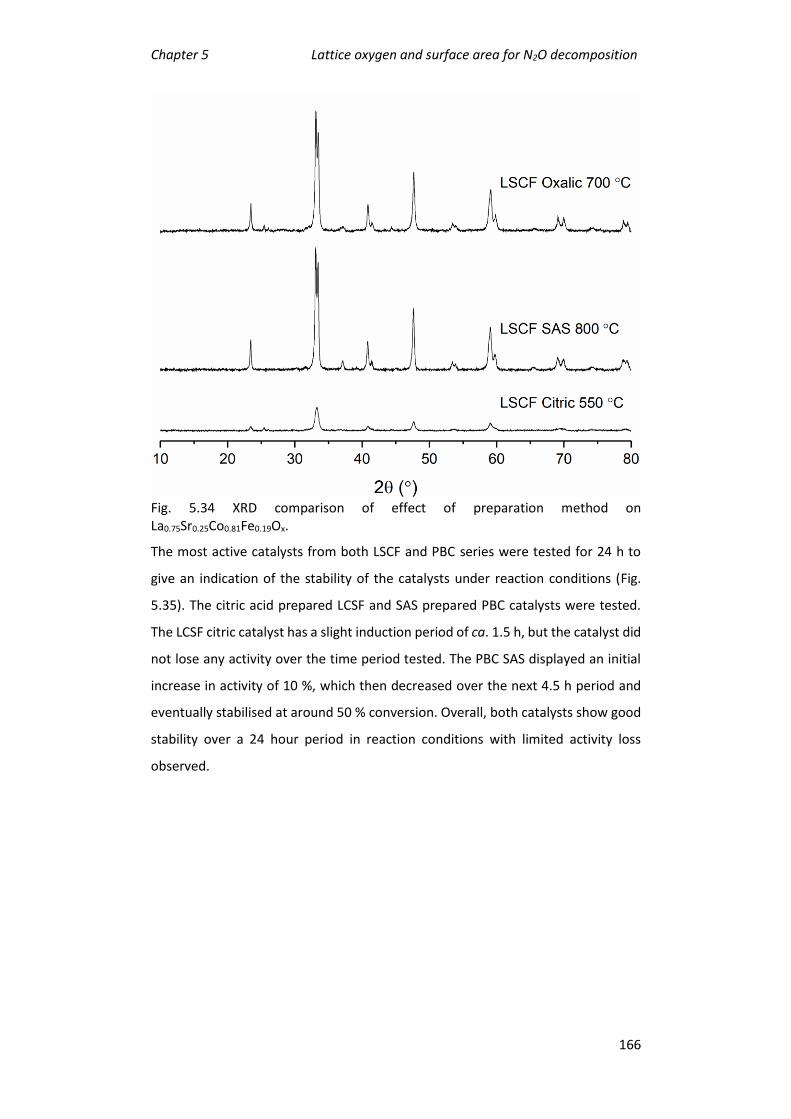
Chapter 5 Lattice oxygen and surface area for N2O decomposition
166
Fig. 5.34 XRD comparison of effect of preparation method on La0.75Sr0.25Co0.81Fe0.19Ox.
The most active catalysts from both LSCF and PBC series were tested for 24 h to
give an indication of the stability of the catalysts under reaction conditions (Fig.
5.35). The citric acid prepared LCSF and SAS prepared PBC catalysts were tested.
The LCSF citric catalyst has a slight induction period of ca. 1.5 h, but the catalyst did
not lose any activity over the time period tested. The PBC SAS displayed an initial
increase in activity of 10 %, which then decreased over the next 4.5 h period and
eventually stabilised at around 50 % conversion. Overall, both catalysts show good
stability over a 24 hour period in reaction conditions with limited activity loss
observed.

Chapter 5 Lattice oxygen and surface area for N2O decomposition
167
Fig. 5.35. Time online data of most active catalyst form each series for N2O Conversion. Reaction conditions: 1 % N2O/He, total flow 100 ml min-1, 450 °C, 24 h. Legend: dashed line PBC SAS, solid line LSCF Citric.
5.7 Conclusions
The effect of A and B site ratios along with preparation method of several
perovskites have been investigated for the decomposition for N2O. It has been
found that by altering the ratios of the A and B site cations makes it is possible to
produce a pure phase perovskite at low temperatures, and by altering the
preparation method it is possible to produce a perovskite with different oxygen
species. This work has confirmed the importance of lattice oxygen species that have
high oxygen mobility for the decomposition of N2O. Mobile lattice oxygen has been
shown to be crucial, as the rate-limiting step in the decomposition of N2O is the
formation of oxygen. This is limited by adsorbed O species being within a distance
at which recombination is possible. However, if there is a great deal of mobile
lattice oxygen present then these can aid recombination and regenerate the active
site for N2O decomposition. In the case of LSCF the activity correlates with the more
mobile lattice oxygen present, the more active the catalyst. The most mobile lattice
oxygen, and therefore activity, was obtained with the citric acid preparation. The
PBC catalyst also followed the trend that the more mobile the lattice species

Chapter 5 Lattice oxygen and surface area for N2O decomposition
168
present the more active the catalyst. In the case of the PBC catalysts, there was also
the presence of oxygen vacancies to compare, with more oxygen vacancies leading
to a more active catalyst as these could be the active site. The most active catalyst
was prepared via the SAS method, as this resulted in the highest amount of mobile
lattice oxygen. When comparing to literature examples (Table 5.1) both these
catalysts outperform the best literature perovskite at similar conditions, with
Pr0.2Ba0.8MnO3 achieving 50 % conversion at 442 °C, 19 whereas the catalysts tested
here can convert 50 % of the N2O at 432 °C and at 410 °C for the LSCF Citric and PBC
SAS catalyst respectively.
5.8 Future Work
To further understanding the in LSCF perovskite series, the same cubic or
rhombohedral phase could be prepared for all preparation methods as this will
confirm whether one structure is more active than the other. This requires a low
temperature calcination to form the cubic structure and a high temperature to form
the rhombohedral structure.
To further understand the perovskite catalyst and how N2O decomposition takes
place, H2-TPR should be performed to measure the reducibility of the catalysts. The
reducibility of the catalysts has been shown in literature by Russo et. al. to be a key
factor in the reaction mechanism. 4 The following mechanism is generally accepted
for the decomposition of N2O into N2 and O2. 2,4
𝑁2𝑂 + ∗ → 𝑁2𝑂 ∗ (1)
𝑁2𝑂 ∗ → 𝑁2 + 𝑂 ∗ (2)
2 𝑂 ∗ → 𝑂2 + 2 ∗ (3)
𝑂 ∗ + 𝑁2𝑂 ∗ → 𝑂2 + 𝑁2 + ∗ (4)
Mechanism 2. Decomposition of N2O at an oxygen vacancy on the surface of a perovskite. * = Ovac
In Mechanism 2, the catalyst becomes oxidised in the 2nd step and needs to be able
to reduce the active site by removal of oxygen to regenerate the active site for
further reactions. The reduction can take place via two routes, Eq. 3 by the Eley
Rideal mechanism or by Eq. 4 which follows the principles of Langmuir

Chapter 5 Lattice oxygen and surface area for N2O decomposition
169
Hinshelwood. The perovskite must therefore be reducible for these steps to take
place, H2-TPR can give an indication to this. The lower the reduction temperature,
the more reducible the catalyst. Russo stated that the LaCoO3 catalyst tested
“exhibited the highest activity as a consequence of its greater capability to be
reduced at comparatively low temperature during TPR runs, a key requirement for
nitrous oxide catalytic decomposition.” 4 The recombination of the oxygen species
can also be aided by oxygen mobility, as recombination takes place at vacancy sites
and lattice oxygen is used to fill these vacancies and aid recombination, hence
mobile oxygen is crucial. Therefore, the study of reduction profiles, with the most
easily reduced indicating an active catalyst for N2O decomposition.
5.9 References
1 S. Alini, F. Basile, S. Blasioli, C. Rinaldi and A. Vaccari, Appl. Catal. B Environ.,
2007, 70, 323–329.
2 F. Kapteijn, J. Rodriguez-Mirasol and J. A. Moulijn, Appl. Catal. B Environ.,
1996, 9, 25–64.
3 N. Labhasetwar, G. Saravanan, S. Kumar Megarajan, N. Manwar, R.
Khobragade, P. Doggali and F. Grasset, Sci. Technol. Adv. Mater., 2015, 16,
036002.
4 N. Russo, D. Mescia, D. Fino, G. Saracco and V. Specchia, Ind. Eng. Chem.
Res., 2007, 46, 4226–4231.
5 M. I. Konsolakis, ACS Catal., 2015, 5, 6397–6421.
6 J. Hwang, R. R. Rao, L. Giordano, Y. Katayama, Y. Yu and Y. Shao-Horn,
Science (80-. )., 2017, 358, 751–756.
7 R. J. H. Voorhoeve, D. W. Johnson, J. P. Remeika and P. K. Gallagher, Science
(80-. )., 1977, 195, 827–833.
8 M. A. Peña and J. L. G. Fierro, Chem. Rev., 2001, 101, 1981–2017.
9 G. Centi and S. Perathoner, Microporous Mesoporous Mater., 2008, 107, 3–
15.
10 L. A. Isupova, G. M. Alikina, S. V Tsybulya, N. N. Boldyreva, G. N. Kryukova, I.

Chapter 5 Lattice oxygen and surface area for N2O decomposition
170
S. Yakovleva, V. P. Isupov and V. A. Sadykov, Int. J. Inorg. Mater., 2001, 3,
559–562.
11 J. Zhu, D. Xiao, J. Li, X. Xie, X. Yang and Y. Wu, J. Mol. Catal. A Chem., 2005,
233, 29–34.
12 J. Zhu, X. Yang, X. Xu and K. Wei, J. Phys. Chem. C, 2007, 111, 1487–1490.
13 J. Zhu, Z. Zhao, D. Xiao, J. Li, X. Yang and Y. Wu, J. Mol. Catal. A Chem., 2005,
238, 35–40.
14 H. Tanaka and M. Misono, Curr. Opin. Solid State Mater. Sci., 2001, 5, 381–
387.
15 L. Marchetti and L. Forni, Appl. Catal. B Environ., 1998, 15, 179–187.
16 R. J. H. Voorhoeve, J. P. Remeika and L. E. Trimble, Ann. N. Y. Acad. Sci., 1976,
272, 3–21.
17 J. Il Jung, H. Y. Jeong, J. S. Lee, M. G. Kim and J. Cho, Angew. Chemie - Int.
Ed., 2014, 53, 4582–4586.
18 N. Russo, D. Mescia, D. Fino, G. Saracco and V. Specchia, Ind. Eng. Chem.
Res., 2007, 46, 4226–4231.
19 S. Kumar, A. Vinu, J. Subrt, S. Bakardjieva, S. Rayalu, Y. Teraoka and N.
Labhsetwar, Catal. Today, 2012, 198, 125–132.
20 T. Ishihara, M. Ando, K. Sada, K. Takiishi, K. Yamada, H. Nishiguchi and Y.
Takita, J. Catal., 2003, 220, 104–114.
21 D. V. Ivanov, E. M. Sadovskaya, L. G. Pinaeva and L. A. Isupova, J. Catal.,
2009, 267, 5–13.
22 D. V. Ivanov, L. G. Pinaeva, L. A. Isupova, A. N. Nadeev, I. P. Prosvirin and L.
S. Dovlitova, Catal. Letters, 2011, 141, 322–331.
23 D. V. Ivanov, L. G. Pinaeva, L. A. Isupova, E. M. Sadovskaya, I. P. Prosvirin, E.
Y. Gerasimov and I. S. Yakovleva, Appl. Catal. A Gen., 2013, 457, 42–51.
24 Thermofisher, https://xpssimplified.com/elements/praseodymium.php,
2019-03–19.
25 Thermofisher, https://xpssimplified.com/elements/barium.php, 2019-03–

Chapter 5 Lattice oxygen and surface area for N2O decomposition
171
19.
26 Thermofisher, https://xpssimplified.com/elements/strontium.p, 2019-03–
19.
27 Thermofisher, https://xpssimplified.com/elements/lanthanum.php, 2019-
03–19.
28 J. L. G. Fierro and L. G. Tejuca, Appl. Surf. Sci., 1987, 27, 453–457.
29 K. Tabata, Y. Hirano and E. Suzuki, Appl. Catal. A Gen., 1998, 170, 245–254.
30 Thermofisher, https://xpssimplified.com/elements/iron.php, 2019-03–19.
31 Thermofisher, https://xpssimplified.com/elements/cobalt.php, 2019-03–19.
32 M. A. Morris, M. O. Connell, A. K. Norman and C. F. Hu, Catal. Today, 1999,
47.
33 A. Worayingyong, P. Kangvansura and S. Kityakarn, Colloids Surfaces A
Physicochem. Eng. Asp., 2008, 320, 123–129.
34 Y. Zhang-Steenwinkel, J. Beckers and A. Bliek, Appl. Catal. A Gen., 2002, 235,
79–92.
35 P. Wang, L. Yao, M. Wang and W. Wu, J. Alloys Compd., 2000, 311, 53–56.
36 C. Sui, X. Niu, Z. Wang, F. Yuan and Y. Zhu, Catal. Sci. Technol., 2016, 6, 8505–
8515.
37 S. Kumar, Y. Teraoka, A. G. Joshi, S. Rayalu and N. Labhsetwar, J. Mol. Catal.
A Chem., 2011, 348, 42–54.
38 A. Bianconi, A. Kotani, K. Okada, R. Giorgi, A. Gargano, A. Marcelli and T.
Miyahara, Am. Phys. Soc. Phys. Rev. B, 1988, 38, 3433–3437.
39 P. G. Corradini, E. Antolini and J. Perez, Phys. Chem. Chem. Phys., 2013, 15,
11730–11739.
40 M. F. Sunding, K. Hadidi, S. Diplas, O. M. Løvvik, T. E. Norby and A. E.
Gunnæs, J. Electron Spectros. Relat. Phenomena, 2011, 184, 399–409.
41 P. Zou, M. Yao, J. Chen, Y. Peng and X. Yao, Ceram. Int., 2016, 42, 4120–4125.
42 K. Maiti, J. Fink, S. de Jong, M. Gorgoi, C. Lin, M. Raichle, V. Hinkov, M.

Chapter 5 Lattice oxygen and surface area for N2O decomposition
172
Lambacher, A. Erb and M. S. Golden, Phys. Rev. B, 2009, 80, 165132.
43 A. Rodrigues, S. Bauer and T. Baumbach, Ceram. Int., 2018, 44, 16017–
16024.
44 D. Cabrera-German, G. Gomez-Sosa and A. Herrera-Gomez, Surf. Interface
Anal., 2016, 48, 252–256.
45 J. Stoch, 1991, 17, 165–167.
46 S. Tanigawa, T. Takashima and H. Irie, J. Mater. Sci. Chem. Eng., 2017, 05,
129–141.
47 J. C. Dupin, D. Gonbeau, P. Vinatier and A. Levasseur, Phys. Chem. Chem.
Phys., 2000, 2, 1319–1324.
48 P. Mack, Spectroscopic analysis of solid oxide fuel cell material with XPS,
2009.
49 H. Van Doveren and J. A. T. Verhoeven, J. Electron Spectros. Relat.
Phenomena, 1980, 21, 265–273.
50 Y. Wu, X. Ni, A. Beaurain, C. Dujardin and P. Granger, Appl. Catal. B Environ.,
2012, 125, 149–157.
51 J. P. Dacquin, C. Dujardin and P. Granger, Catal. Today, 2008, 137, 390–396.
52 S. Royer, D. Duprez, F. Can, X. Courtois, C. Batiot-Dupeyrat, S. Laassiri and H.
Alamdari, Chem. Rev., 2014, 114, 10292–10368.
53 C. D. Evans, S. A. Kondrat, P. J. Smith, T. D. Manning, P. J. Miedziak, G. L.
Brett, R. D. Armstrong, J. K. Bartley, S. H. Taylor, M. J. Rosseinsky and G. J.
Hutchings, Faraday Discuss., 2016, 188, 427–450.
54 N. A. Merino, B. P. Barbero, P. Eloy and L. E. Cadús, Appl. Surf. Sci., 2006,
253, 1489–1493.
55 J. Zhu, H. Li, L. Zhong, P. Xiao, X. Xu, X. Yang, Z. Zhao and J. Li, ACS Catal.,
2014, 4, 2917–2940.
56 K. L. Pan, S. J. Yu, S. Y. Yan and M. B. Chang, J. Air Waste Manag. Assoc.,
2014, 64, 1260–1269.
57 Z. Zhao, X. Yang and Y. Wu, Appl. Catal. B Environ., 1996, 8, 281–297.

Chapter 5 Lattice oxygen and surface area for N2O decomposition
173
58 J. P. Dacquin, C. Lancelot, C. Dujardin, P. Da Costa, G. Djega-Mariadassou, P.
Beaunier, S. Kaliaguine, S. Vaudreuil, S. Royer and P. Granger, Appl. Catal. B
Environ., 2009, 91, 596–604.
59 C. Li, Y. Shen, S. Zhu and S. Shen, RSC Adv., 2014, 4, 29107–29119.

Chapter 6 Conclusions and Future Work
174
6 Conclusions and Future Work
6.1 N2O and the environment
Nitrous Oxide (N2O) is a greenhouse gas that has a devastating effect on the
atmosphere, with a global warming potential of roughly 300 times that of CO2. 1–3
With the control on the emissions not yet legislated in many cases, the use and
emissions of N2O continue to rise. The emission of N2O from anthropogenic sources
such as agriculture 4, nitric acid plants 1 and fuel combustion 4 amongst others
contribute to the destruction of the ozone layer and the formation of an ozone hole
above the south pole. 5,6 This leads to global warming, an increase in sea
temperature and levels, causing devastating changes to the earth as we currently
know it, such as land and life loss. Subsequently, as a race we need to wake up to
the fact that N2O is now one of the most threatening major polluting greenhouse
gas, that should be legislated and the use of which strictly controlled.
6.2 Fe-ZSM-5 Catalysts
6.2.1 Conclusions
Iron zeolite catalysts have been used extensively for the decomposition of N2O over
the last 100 years, with Fe-ZSM-5 being the catalyst of choice. 7–10 Here, Si:Al ratio,
Fe weight loading and acid washing have been investigated. The work has shown
agreement with literature that low Si:Al ratios are necessary for the decomposition
of N2O and this is because of the formation of α-Fe, that can only form on the Al
moiety, hence more Al leads to the presence of more α-Fe species, and
consequently more active sites. 8,11,12
Here, catalysts have been prepared by CVI and when low weight loadings such as
0.16 % Fe-ZSM-5 were prepared there are only two species of Fe present, as
framework Fe3+ and isolated extra-framework, confirmed by UV/Vis spectroscopy.
At higher loadings two more species of Fe are present, as FeOx nanoparticles and

Chapter 6 Conclusions and Future Work
175
large clusters; these are non-active species and therefore lead to an inefficient
catalyst. In this work, it is confirmed that the species of Fe necessary for N2O
decomposition are framework and extra-framework species, as the 0.16 % Fe-ZSM-
5 catalyst out-performs all other catalysts when a reductant is present in the gas
feed even though it has the lowest percentage of Fe out of all the catalysts tested.
As discussed previously, the mechanism of N2O decomposition involves the
reduction of the surface to regenerate the active site by the removal of an absorbed
oxygen species. This is the rate limiting step and without the presence of a
reductant the higher weight loadings (1.25 and 2.5 wt.% Fe) out-perform the lower
weight loadings. This is due to the increase in the density of active sites and the
subsequent increase in oxygen recombination. As soon as a reductant is added to
the gas feed the activity of all three weight loadings is similar at 600 °C. The effect
of the density of active sites is removed when a reductant is added to the gas feed,
as the reductant will cleave any oxygen atoms that are present on the surface and
reduce the active site ready for another incoming N2O molecule.
Acid washing had been shown in literature to be a suitable technique to selectively
remove FeOx nano-particles and clusters from the surface of a catalyst. 13 This was
not the case when performed on 0.4 wt.% Fe-ZSM-5, with Fe being extracted from
the pores in the extra-framework position and deposited on the surface of the
catalysts instead as nano-particles and clusters. This results in a decrease in
conversion due to the removal of active α-Fe species and an increase in TOF due to
the removal of around 60 % of weight loading of Fe. A catalyst with the same weight
loading was prepared by CVI, for comparison to the acid washed catalyst, and it was
discovered that it was possible to produce a low weight loading catalyst that has
only the two active species of Fe present, producing the most active catalyst. This
catalysts had a TOF of 2.59 x10³ s-1 and has a superior activity to all other catalysts
in the series. When compared to literature, the TOF is far higher than that reported
by Park et al. who achieved a TOF of 1.8 x10⁻³ s-1 for N2O decomposition at 550 °C
using 1.96 wt. % Fe-ZSM-5 (27).14 At similar conditions and the same temperature
the 0.16 wt.% Fe-ZSM-5 catalysts achieves a TOF of 1.44 x10⁶ s-1, demonstrating the
greater activity of the low loaded catalyst when propane is present.

Chapter 6 Conclusions and Future Work
176
6.2.2 Future Work
The scope of this study did not extend to the use of steaming pre-treatments which
have been shown in literature to enhance Fe-ZSM-5 catalysts for N2O
decomposition. Literature has shown that the reason for this increase in activity is
due to the removal of Fe from the pores and into the extra-framework sites. 15–19
This in turn creates the α-Fe species that have been shown in this work to be the
active species for N2O decomposition and would therefore be predicted to produce
a more active catalyst. It would be interesting to study whether it is possible to
prepare a low loading catalyst by CVI that has only framework and extra-framework
species that, following a steaming pre-treatment, would produce a catalysts with
only α-Fe species present, and what effect this has on the catalytic activity for N2O
decomposition.
Finally, to confirm that in fact the species of Fe that are active for N2O
decomposition is α-Fe, it would be possible to prepare a catalyst with the same
weight loading on a silicate support as the α-Fe moiety can only form on the Al sites
in the ZSM-5 framework. In silicates these species will not be produced and would
therefore lead to an inactive catalyst.
6.3 Pd-Al2O3 Catalysts
6.3.1 Conclusions
The effect of heat treatment conditions, reaction cycling and chlorine
concentration on 2.6 wt. % Pd-Al2O3 catalysts have been investigated for the
catalytic decomposition of N2O into N2 and O2 in the absence and presence of a
reducing agent (C3H8). After several reaction cycles, the conversion of N2O
increased from 58 % after the first use to 96 % during the fourth use at 600 °C.
These multiple use catalysts also show improved stability on-stream. By calcining
the support before catalyst preparation, it is possible to achieve the same
conversion in the first use of the support calcined catalyst, therefore, showing it is
possible to attain high activity on the initial use rather than after multiple reaction
cycles. It is hypothesised that this is due to the removal of water species, lowering
the PZC of the support, due to the Pd solution containing PdCl3(H2O)- ions, there is
Chapter 6 Conclusions and Future Work
177
reduced interaction between the Pd ion and the support surface, which leads to
the formation of smaller nanoparticles. As the pH of the solution is lower than that
of the PZC, the surface is protonated and will strongly interact with anions;
therefore with the decrease in PZC as the support is calcined, the surface is less
positively charged and this leads to a weaker interaction between the nanoparticles
and the surface, as a result smaller well dispersed nanoparticles. 20,21
When a reductant is added to the gas feed, the temperature at which 100 % N2O
conversion is seen is shifted from 550 °C to 350 °C. The reductant enriches the
decomposition of N2O to N2, however, a limited amount of O2 is measured. This,
alongside the presence of CO2 and CO indicate that the propane is acting as a
scavenger of oxygen to form cracked, oxidation products and water. During the
decomposition of N2O, the recombination of oxygen is the rate limiting step,
therefore oxygen remains on the surface blocking the active site. The presence of
a reductant increases the conversion of N2O by acting as an oxygen scavenger
regenerating the active site.
When the support was calcined before catalyst preparation, and deposited with Pd,
the species formed were small Pd nanoparticles. The improvement in conversion
of N2O seen with these catalysts indicates that the small nanoparticles are the
active species. When the particle size is controlled, by using a modified
impregnation technique, the activity of both the untreated and treated support
catalysts is the same. This adds further weight to the hypothesis that the particle
size (and subsequently dispersion) control the activity of Pd-Al2O3 catalysts for N2O
decomposition.
6.3.2 Future Work
The effect of metal support interaction can be studied further by altering the PZC
of a series of reducible and non-reducible supports to measure the interaction of
the metal precursor and support. Differing interactions of the metal and support
can lead to the formation of different particle size ranges as seen in the discussion
of Chapter 4. This can be investigated in different supports to see if a single
preparation method that controls particle size can be produced, following on from
the work of Regabulto and co-workers.21 They have determined that, if the pH of
the precursor solution is below that of the PZC, the hydroxyl groups are protonated,

Chapter 6 Conclusions and Future Work
178
and then the surface can absorb anionic metal complexes; above the PZC, the
hydroxyl groups are deprotonated and become negatively charged and cations will
be strongly absorbed. The increase in difference between the PZC and pH of the
precursor solution effects the strength of interaction and subsequently particle
size. The production of a preparation technique with strict controls can be used to
predict and control particle size. Particle size has shown to be a prevailing factor in
catalysis,22–26 therefore a method that could reliably predict and control the effect
of metal precursor and support interaction leading to particle size would be of
interest to the entire catalysis field.
In the Chapter there was a lot of discussion about the existence of Cl in the catalysts
and the presence of PdCl species that were possibly limiting the activity of the
catalysts. One way to investigate this further is to use a chlorine free preparation,
which is possible by using Chemical Vapour Impregnation (CVI), where Pd(acac)2 is
used as the metal precursors. The support and the precursor are mixed together
and heated under vacuum until the precursor ligands sublime and removed, leaving
the deposited metal behind. This removes the effect of the Cl- ions and will give a
further understanding of the effect. Another interesting thing about this
preparation method is that it is solvent free, meaning the interaction between the
metal and the support cannot be hindered by the presence of water species. This is
interesting as water is removed during the support calcination, which can be
reabsorbed from the solvent, which could mean a better metal support interaction.
This is just a hypothesis that needs testing to fully understand, but it would be
important to be mindful that there are now two factors at play in this preparation
method and they would both need to be investigated thoroughly.
Finally, another avenue of interesting work to investigate would be the effect of
alternative reductants. A variety of reductants have been used in literature, such as
methane, ethane, propane and CO. 11,27–35 it would be interesting to explore the
effect on conversion of N2O using alternative reductants. For example if methane
improves the activity as much as propane then there is scope for removing two
greenhouse gases, methane and N2O in one reaction.

Chapter 6 Conclusions and Future Work
179
6.4 Perovskites
6.4.1 Conclusions
Perovskites have shown a literature precedent to be used as catalysts for the
decomposition of N2O into nitrogen and oxygen.36–45 Based on this work, a study
was performed by altering the A and B site ratios to in perovskites with the aim of
improving purity and surface area, using three different preparation methods, with
the effect on surface area and purity noted. By altering the A and B site ratios, it is
possible to produce a pure phase perovskite at temperatures lower than the
literature norm. When the preparation method was altered, it was noted that the
oxygen species differed between methods even though the components were the
same. This work has further highlighted the importance of lattice oxygen species
and the requirement for a high oxygen mobility in the decomposition of N2O. The
rate limiting step for the decomposition of N2O is the recombination of absorbed
molecular oxygen to form oxygen. The recombination is limited due to the distance
between the molecular oxygen species; therefore, highly mobile lattice oxygen is
required to bridge these distances and enable recombination and regeneration of
the active sites.
In the LSCF catalysts the activity closely follows the trend that the more mobile
lattice oxygen is present in the more active the catalyst. The catalyst with the
largest response during O2-TPD, and therefore the more mobile the oxygen, was
attained by using citric acid preparation method and resulted in the most active
catalyst with a T50 of 432 °C. A similar trend was also noted in the PBC series of
catalysts, but there was also the factor of oxygen vacancies to compare. More
oxygen vacancies lead to a more active catalysts, which illustrates that oxygen
vacancies are one of the active sites. The most active catalyst was prepared via the
SAS preparation method and achieved a T50 of 410 °C, which was the catalysts with
the highest amount of mobile lattice oxygen. Compared to literature (Section 5.1,
Table 5.1), both these catalysts outperform the most active perovskite for N2O
decomposition, Pr0.2Ba0.8MnO3, which has a T50 at 442 °C under similar conditions.41
Chapter 6 Conclusions and Future Work
180
6.4.2 Future Work
Catalyst reducibility has been shown to be a key factor in the decomposition of N2O
by Russo et al.46 Therefore to understand how the perovskite catalysts operate, H2-
TPR should be performed to give an insight to the reducibility of the catalyst. The
following mechanism is generally accepted for the decomposition of N2O into
N2and O2. 46,47
𝑁2𝑂 + ∗ → 𝑁2𝑂 ∗ (1)
𝑁2𝑂 ∗ → 𝑁2 + 𝑂 ∗ (2)
2 𝑂 ∗ → 𝑂2 + 2 ∗ (3)
𝑂 ∗ + 𝑁2𝑂 ∗ → 𝑂2 + 𝑁2 + 2 ∗ (4)
Mechanism 3. Decomposition of N2O at an oxygen vacancy on the surface of a perovskite. * = Ovac
In step 2 of the reaction mechanism, the catalyst becomes oxidised and needs to
be able to reduce the active site by removing oxygen that enables the active site to
be regenerated and allow further reactions to take place. The reduction process
can take place either through step 3, a Langmuir Hinshelwood, or by step 4 an Eley
Rideal mechanism. Therefore high reducibility is an advantageous property of the
catalyst, H2-TPR can give an indication of the reducibility of the perovskite. Russo
and co-workers tested a LaCoO3 catalyst and stated that the catalyst “exhibited the
highest activity as a consequence of its greater capability to be reduced at
comparatively low temperature during TPR runs, a key requirement for nitrous
oxide catalytic decomposition.” 46 Secondly the recombination of oxygen species
(the rate limiting step) can also be aided by oxygen mobility. Recombination usually
takes place at vacancy sites and lattice oxygen is used to fill these vacancies and aid
recombination, hence mobile oxygen is crucial. The study of reduction profiles
would easily be able to select an active catalyst for N2O decomposition.
6.5 Final Comments and Comparisons
Throughout this thesis different reaction conditions have been used meaning that
it has not been completely clear which catalysts are the most active. Therefor for
clarity, the rate of the most active catalysts in each chapter have been normalised

Chapter 6 Conclusions and Future Work
181
for comparison (Table 7). As you can see in Table 7 the most active catalyst is the
0.16 wt.% Fe-ZSM-5 (23) catalyst, has a higher rate of reaction, even though this
catalysts does not have the highest conversion. This is due to the gas feed
containing 5 times the number of moles of N2O as the other catalysts, and therefore
has the opportunity to convert more N2O. The perovskite catalysts, LCSF Citric and
PBC SAS both convert 100 % of the N2O present, it would be interesting to test these
catalysts under a regime whereby they are exposed to more N2O, as is the case with
the Fe-ZSM-5 catalysts. Finally, the Pd-Al2O3 catalyst do not show great promise
when compared to the other catalysts in this thesis. These catalysts do not convert
enough N2O with out propane present to be deemed active catalysts, but this does
change when propane is present and these catalysts would then be in the same ball
park as the perovskite catalysts, converting 100 % N2O at 550 °C.
Table 7. Comparison of most active catalysts in this thesis by a normalised rate.
Catalyst Conversion at 550 °C (%) Rate in molN2O kgcat-1 h-1
0.16 wt.% Fe-ZSM-5 (23) 30 67
2.6 wt.% Pd-Al2O3 4R 67 28.7
2.6 wt.% Pd-Al2O3 5R 57 24.4
LSCF Citric 98 43.8
PBC SAS 100 44.6
6.6 References
1 J. Pérez-Ramírez, F. Kapteijn, K. Schöffel and J. A. Moulijn, Appl. Catal. B
Environ., 2003, 44, 117–151.
2 J. Weimann, Best Pract. Res. Clin. Anaesthesiol., 2003, 17, 47–61.
3 P. Grace and L. Barton, http://theconversation.com/meet-n2o-the-
greenhouse-gas-300-times-worse-than-co2-35204, 2015-10–29.
4 Intergovernmental Panel on Climate Change, Climate Change 2007
Synthesis Report, 2008.
5 R. W. Portmann, J. S. Daniel and a. R. Ravishankara, Philos. Trans. R. Soc. B

Chapter 6 Conclusions and Future Work
182
Biol. Sci., 2012, 367, 1256–1264.
6 A. R. Ravishankara, J. S. Daniel and R. W. Portmann, Science, 2009, 326, 123–
125.
7 M. I. Konsolakis, ACS Catal., 2015, 5, 6397–6421.
8 M. Rauscher, K. Kesore, R. Mönnig, W. Schwieger, A. Tißler and T. Turek,
Appl. Catal. A Gen., 1999, 184, 249–256.
9 B. M. Abu-Zied, W. Schwieger and A. Unger, Appl. Catal. B Environ., 2008,
84, 277–288.
10 S. Sklenak, P. C. Andrikopoulos, B. Boekfa, B. Jansang, J. Nováková, L. Benco,
T. Bucko, J. Hafner, J. Ddeek and Z. Sobalík, J. Catal., 2010, 272, 262–274.
11 H. Abdulhamid, E. Fridell and M. Skoglundh, Top. Catal., 2004, 30/31, 161–
168.
12 I. Melián-Cabrera, E. R. H. van Eck, S. Espinosa, S. Siles-Quesada, L. Falco, A.
P. M. Kentgens, F. Kapteijn and J. A. Moulijn, Appl. Catal. B Environ., 2017,
203, 218–226.
13 V. Peneau, R. D. Armstrong, G. Shaw, J. Xu, R. L. Jenkins, D. J. Morgan, N.
Dimitratos, S. H. Taylor, H. W. Zanthoff, S. Peitz, G. Stochniol, Q. He, C. J.
Kiely and G. J. Hutchings, ChemCatChem, 2017, 9, 642–650.
14 J. H. Park, J. H. Choung, I. S. Nam and S. W. Ham, Appl. Catal. B Environ.,
2008, 78, 342–354.
15 K. Sun, H. Zhang, H. Xia, Y. Lian, Y. Li, Z. Feng, P. Ying and C. Li, Chem.
Commun., 2004, 216, 2480–2481.
16 K. A. Dubkov, N. S. Ovanesyan, A. A. Shteinman, E. V. Starokon and G. I.
Panov, J. Catal., 2002, 207, 341–352.
17 A. Ribera, I. W. C. E. Arends, S. De Vries, J. Pérez-Ramírez and R. A. Sheldon,
J. Catal., 2000, 195, 287–297.
18 G. I. Panov, A. K. Uriarte, M. A. Rodkin and V. I. Sobolev, Catal. Today, 1998,
41, 365–385.
19 Q. Zhu, E. J. Hensen, B. L. Mojet, J. H. van Wolput and R. A. van Santen, Chem

Chapter 6 Conclusions and Future Work
183
Commun, 2002, 1232–1233.
20 J. Park and J. R. Regalbuto, J. Colloid Interf. Sci., 1995, 175, 239–252.
21 K. P. De Jong, Synthesis of Solid Catalysts, Wiley-VCH Verlag GmbH & Co.
KGaA, 1st edn., 2009, vol. 39.
22 G. C. Bond, Surf. Sci., 1985, 156, 966–981.
23 M. Arenz, K. J. J. Mayrhofer, V. Stamenkovic, B. B. Blizanac, T. Tomoyuki, P.
N. Ross and N. M. Markovic, J. Am. Chem. Soc., 2005, 127, 6819–6829.
24 K. J. J. Mayrhofer, B. B. Blizanac, M. Arenz, V. R. Stamenkovic, P. N. Ross and
N. M. Markovic, J. Phys. Chem. B, 2005, 109, 14433–14440.
25 G. L. Bezemer, J. H. Bitter, H. P. C. E. Kuipers, H. Oosterbeek, J. E. Holewijn,
X. Xu, F. Kapteijn, A. J. Van Diilen and K. P. De Jong, J. Am. Chem. Soc., 2006,
128, 3956–3964.
26 M. K. Min, J. Cho, K. Cho and H. Kim, Electrochim. Acta, 2000, 45, 4211–4217.
27 H. Ohtsuka, T. Tabata, O. Okada, L. M. F. Sabatino and G. Bellussi, Catal.
Letters, 1997, 44, 265–270.
28 H. Ohtsuka, T. Tabata, O. Okada, L. M. . Sabatino and G. Bellussi, Catal.
Today, 1998, 42, 45–50.
29 R. W. Van Den Brink, S. Booneveld, M. J. F. M. Verhaak and F. A. De Bruijn,
Catal. Today, 2002, 75, 227–232.
30 G. Centi and F. Vazzana, Catal. Today, 1999, 53, 683–693.
31 G. Djéga-Mariadassou, F. Fajardie, J. F. Tempère, J. M. Manoli, O. Touret and
G. Blanchard, J. Mol. Catal. A Chem., 2000, 161, 179–189.
32 L. He, L. C. Wang, H. Sun, J. Ni, Y. Cao, Y. He and K. N. Fan, Angew. Chemie -
Int. Ed., 2009, 48, 9538–9541.
33 K. Teramura, T. Tanaka, H. Ishikawa, Y. Kohno and T. Funabiki, J. Phys. Chem.
B, 2004, 108, 346–354.
34 K. Yogo, M. Ihara, I. Terasaki and E. Kikuchi, Chem. Lett., 1993, 22, 229–232.
35 R. Burch and P. K. Loader, Appl. Catal. B Environ., 1994, 5, 149–164.

Chapter 6 Conclusions and Future Work
184
36 H. Tanaka and M. Misono, Curr. Opin. Solid State Mater. Sci., 2001, 5, 381–
387.
37 L. Marchetti and L. Forni, Appl. Catal. B Environ., 1998, 15, 179–187.
38 R. J. H. Voorhoeve, J. P. Remeika and L. E. Trimble, Ann. N. Y. Acad. Sci., 1976,
272, 3–21.
39 J. Il Jung, H. Y. Jeong, J. S. Lee, M. G. Kim and J. Cho, Angew. Chemie - Int.
Ed., 2014, 53, 4582–4586.
40 N. Russo, D. Mescia, D. Fino, G. Saracco and V. Specchia, Ind. Eng. Chem.
Res., 2007, 46, 4226–4231.
41 S. Kumar, A. Vinu, J. Subrt, S. Bakardjieva, S. Rayalu, Y. Teraoka and N.
Labhsetwar, Catal. Today, 2012, 198, 125–132.
42 T. Ishihara, M. Ando, K. Sada, K. Takiishi, K. Yamada, H. Nishiguchi and Y.
Takita, J. Catal., 2003, 220, 104–114.
43 D. V. Ivanov, E. M. Sadovskaya, L. G. Pinaeva and L. A. Isupova, J. Catal.,
2009, 267, 5–13.
44 D. V. Ivanov, L. G. Pinaeva, L. A. Isupova, A. N. Nadeev, I. P. Prosvirin and L.
S. Dovlitova, Catal. Letters, 2011, 141, 322–331.
45 D. V. Ivanov, L. G. Pinaeva, L. A. Isupova, E. M. Sadovskaya, I. P. Prosvirin, E.
Y. Gerasimov and I. S. Yakovleva, Appl. Catal. A Gen., 2013, 457, 42–51.
46 N. Russo, D. Mescia, D. Fino, G. Saracco and V. Specchia, Ind. Eng. Chem.
Res., 2007, 46, 4226–4231.
47 F. Kapteijn, J. Rodriguez-Mirasol and J. A. Moulijn, Appl. Catal. B Environ.,
1996, 9, 25–64.