nicotine-modulated gene expression profiles … · nicotine-modulated gene expression profiles in...
TRANSCRIPT

NICOTINE-MODULATED GENE EXPRESSION PROFILES IN MCF7
BREAST CANCER CELL LINE AND INVOLVEMENT OF ESTROGEN IN
CHRNA5 EXPRESSION
A THESIS SUBMITTED TO THE DEPARTMENT OF MOLECULAR BIOLOGY
AND GENETICS AND THE INSTITUTE OF ENGINEERING AND SCIENCE OF
BILKENT UNIVERSITY
IN PARTIAL FULFILLMENT OF THE REQUIREMENTS FOR THE DEGREE OF
MASTER OF SCIENCE
BY RÜMEYSA BIYIK
AUGUST 2009

I certify that I have read this thesis and that in my opinion it is fully adequate, in scope,
and in quality, as a thesis for the degree of Master of Science
__________________________________
Assist. Prof. Dr. Ozlen Konu
I certify that I have read this thesis and that in my opinion it is fully adequate, in scope,
and in quality, as a thesis for the degree of Master of Science
__________________________________
Assist. Prof. Dr. Sreeparna Banerjee
I certify that I have read this thesis and that in my opinion it is fully adequate, in scope,
and in quality, as a thesis for the degree of Master of Science
__________________________________
Assist. Prof. Dr. Uygar Tazebay
I certify that I have read this thesis and that in my opinion it is fully adequate, in scope,
and in quality, as a thesis for the degree of Master of Science
__________________________________
Prof. Dr. Mehmet Baray
Director of the Institute of Engineering and Science

ii
TO MY FAMILY, TO KONU LAB LABORTORY
AND TO MY PRIMARY SCHOOL TEACHER ( AYŞE YETİŞMİŞ)

iii
ABSTRACT
NICOTINE-MODULATED GENE EXPRESSION PROFILES IN MCF7 BREAST
CANCER CELL LINE AND INVOLVEMENT OF ESTROGEN IN CHRNA5
EXPRESSION
Rümeysa BIYIK
M.Sc. in Molecular Biology and Genetics
Advisor: Asst. Prof. Özlen KONU
August 2009, 152 pages
Breast cancer, highly heterogeneous in nature, has been classified into multiple molecular
subtypes based on hormone receptor status and also possess variable genetic and environmental
etiologies. Prognosis and therapy of breast cancer depends on the presence or absence of these
molecular markers. Nicotine, the major psychoactive addictive component in tobacco smoke,
has been associated with multiple cancers because of its ability to increase cell proliferation,
migration, and angiogenesis, and to decrease apoptosis. Nicotine binds to cholinergic receptors
made up of multiple subunits, one of which, the alpha 5 (CHRNA5) whose polymorphisms have
recently been implicated in nicotine addiction and lung cancer as functional. Microarray
datasets provide genomic and functional information on the whole transcriptome when exposed
to a certain treatment or under different pathological conditions allowing for molecular
classification. The association between nicotine use and breast cancer has been controversial
and to our knowledge no high-throughput expression profiling of breast cancer cells exposed to
nicotine exists in the literature. In the present study, we determined that 1 uM nicotine affects
cell proliferation in MCF7 cells measured by MTT assay only under serum starvation (0.1%
Serum) condition at days 5 or 7 but not earlier. Similarly, effects on the protein levels of
selected molecular markers with roles in proliferation and/or apoptosis, i.e., CyclinE, bcl-xl, and
p53 were affected under serum starved conditions in more pronounced ways. Effects of nicotine

iv
at the transcriptome level were studied in MCF7 cells when exposed to 1uM Nicotine using
Affymetrix Human HGU133 plus 2 arrays under the 10% serum levels. Our findings indicated
that nicotine affects multiple pathways including MAPK, focal adhesion, and apoptosis
although the magnitude of changes was mild. Preliminary analyses performed under serum-
starvation indicated that starvation resulted in drastic changes in MCF7 transcriptome, some of
which can be reversed, by 1uM nicotine. CHRNA5 expression was highly modulated by serum
levels. Multiple microarray datasets on breast cancer cell lines and primary tumors in GEO were
re-analyzed to assess the dependency of CHRNA5 expression on estrogen. Our findings were:
1) CHRNA5 expression increased in the presence of estrogen in a dose- and time-dependent
fashion; 2) CHRNA5 was found to be a likely secondary target of estrogen; 3) CHRNA5
expression was higher in ER negative and/or Grade 3 breast cancer patients, implicating
CHRNA5 with prognosis; 4) DNA replication and cell cycle genes seemed to be highly
correlated with CHRNA5 expression; 5) the coexpressed genes could predict ER and Grade
status of primary tumors with high accuracies. In conclusion, cholinergic signaling as
modulated by nicotine through acetylcholine receptors might have a role in breast cancer
etiology. CHRNA5 represents a novel candidate for breast cancer diagnostic and prognostic
studies.

v
ÖZET
MCF7 MEME KANSER HÜCRE HATTINDA NİKOTİNDEN ETKİLENMİŞ GEN
İFADE PROFİLLERİ VE CHRNA5 İFADESİNDE ESTROJENİN ROLÜ
Rümeysa BIYIK
Master Tezi, Moleküler Biyoloji ve Genetik Bölümü
Tez Yöneticisi: Yrd. Doç. Özlen Konu
Ağustos, 2009 152 sayfa
Heterojen bir yapısı olan meme kanseri bir çok moleküler alttipe ayrılmış olup birbirinden
farklı genetik ve çevresel nedenlerden kaynaklanabilir. Meme kanserinin prognozu ve tedavisi
sözü edilen moleküler belirteçlerin varlığına bağlıdır. Tütünün en belirgin fizyoaktif ve bağlılık
yapıcı maddesi olan nikotin, hücre bölünmesi, hareketi ve anjiogenezi arttırması ve apoptozu
önlemesi dolayısı ile birden fazla kanser ile ilintilendirilmiştir. Nikotin bir çok altüniteden
oluşan kolinerjik reseptörlere bağlanır; bunlardan biri olan alfa 5 (CHRNA5) fonksiyonel
polimorfizmleri dolayısı ile nikotin bağımlılığı ve akciğer kanseri ile ilintilendirilmiştir.
Mikrodizin verisetleri genomik ve işlevsel bilgiyi bir ajana maruz kalma ya da farklı patolojik
durumlarda tüm transkriptom düzeyinde moleküler bir gruplamaya olanak verecek şekilde
sağlarlar. Nikotin kullanımı ve meme kanseri arasındaki ilişki tartışmalı olup bilgimiz dahilinde
nikotine maruz kalan hücrelerde şimdiye kadar yüksek ölçekli ifade profillemesi yapılmamıştır.
Bu çalışmada, MTT assay ile ölçüldüğü üzere, 1 uM nikotin, 0.1% serum açlığına maruz kalan
MCF7 hücrelerinin bölünmesini 5. ve 7. günlerden itibaren etkilemiştir. Benzer bir şekilde,
bölünme ve apoptozda görevli moleküler belirteçlerin, örneğin, CyclinE, bcl-xl, p53, protein
miktarları da serum açlığı halinde daha belirgin bir şekilde gözlenmiştir. 10% serum altında
büyütülen MCF7 hücrelerinin 1 uM nicotine verdikleri yanıt Affymetrix İnsan HGU133 plus 2
mikrodizinleri kullanarak çalışılmıştır. Bulgularımız, nikotinin MAPK, apoptoziz ve fokal
adhezyon gibi sinyal yolaklarını etkilediğini göstermekle birlikte değişikliklerin miktarı
düşüktür. Serum açlığı uygulanarak yapılan ön çalışmalar serum eksikliğinin ifade profilinde
oldukça etkili olduğunu gösterdi; bu değişikliklerin bazıları 1 uM nikotin ile geri çevrilebilir

vi
görünmektedir. CHRNA5 ifadesi serum seviyesinden etkilenmiştir. CHRNA5 ifadesinin
estrogene bağımlığını test etmek üzere GEO veritabanından çok sayıda meme kanser hücre hattı
ve primer tümör verisi incelenmiştir. Bulgularımız şöyle özetlenebilir: 1) CHRNA5 ifadesi
estrojenin varlığında doza ve zamana bağlı olarak yükselmiştir; 2) CHRNA5 estrojenin ikincil
bir hedefi olabilir; 3) CHRNA5 ifadesi ER negatif ve Grade 3 hastalarında daha yüksek olup bu
durum CHRNA5’i prognoz ile ilişkilendirir; 4) DNA replikasyon ve hücre döngüsü genleri
CHRNA5 ifadesi ile yüksek derecede korelasyon gösterir; 5) CHRNA5 ile birlikte ifade olan
genler primer tümörlerin ER ve Grade statüsünü yüksek bir doğrulukla tahmin edebilirler.
Sonuç olarak, nikotinin asetilkolin reseptörleri yoluyla değiştirebildiği kolinerjik sinyaller
meme kanser etiolojisinde yer taşıyabilir. CHRNA5 meme kanser prognostik ve diagnostik
çalışmalarında yeni bir hedef teşkil etmektedir.

vii
ACKNOWLEDGEMENTS
First of all, I would like to express my gratitude for my thesis advisor Assist. Prof. Dr. Özlen
Konu for her guidance throughout this study. Being her student was a true privilege since she
was always accessible for questions and discussions and very supportive during hard times.
I would like to thank Assoc. Prof. Dr. Işık Yuluğ and Bilge Kılıç for perfoming the microarray
experiments. I would also like to thank Öztürk’s group and Akçalı’s group for providing me
antibodies.
I would like to express my deepest thanks to Ceren Sucularlı who has provided me with
experimental support right from the beginning of my study until the very end, always being
there when I needed to ask something. I would like to thank Onur Kaya for sharing ideas about
projects. I would also thank all Konu Lab members for friendly and comfortable atmosphere in
the lab.
I would like to thank the entire MBG faculty and lab members for creating a friendly,
comfortable and helpful atmosphere to do research in.
Of course, my deepest gratitude goes to my family for their patience, unconditional love and
support throughout my life.
I would thank TÜBİTAK for supporting me with scholarship 2210 during my M.Sc. research.
This thesis in part was supported by a grant from TUBITAK (TBAG-106T0548 to O.K).

viii
TABLE OF CONTENTS
NUMBER/NAME PAGE
ABSTRACT iii
ÖZET v
ACKNOWLEDGEMENTS vii
TABLE OF CONTENTS viii
LIST OF FIGURES x
LIST OF TABLES xv
ABBREVIATIONS xvii
CHAPTER 1: INTRODUCTION 1
1.1. Cholinergic Signaling 1
1.1.1. Tobacco use, cancer and nicotine 1
1.1.2. The structure and function of nicotinic acetylcholine receptors (nAChRs) 2
1.1.3. CHRNA5 (Nicotinic acetylcholine receptor alpha 5) 6
1.1.1.1. Function of CHRNA5 6
1.1.1.2. Polymorphism studies of CHRNA5 in connection with nicotine
dependence 7
1.1.1.3. Polymorphism and expression studies of CHRNA5 in regard to cancer 9
1.1.4. Effect of nicotine on cell proliferation 10
1.1.5. Effects of nicotine on apoptosis 12
1.1.6. Effects of nicotine on angiogenesis 14
1.1.7. The association between smoking and breast cancer 15

ix
1.2. Breast Cancer 16
1.2.1. Histological Grade in Breast Cancer 19
1.2.2. Estrogen and Estrogen Receptor in Breast Cancer 21
1.2.3. Hormone Therapy in Breast Cancer 24
1.2.4. Cell Culture Cancer Models 25
1.1.1.4. MCF7 Cells as a Model For The Estrogen Studies: 26
1.1.1.5. Effects of serum starvation on cells 26
1.3. Microarray Technology 27
1.3.1. Microarray studies on nicotine-mediated signaling: 29
CHAPTER 2: MATERIALS AND METHODS 31
2.1. Materials 31
2.2. Solutions and media 32
2.2.1. General solutions 32
2.2.2. Tissue culture solution 32
2.2.3. Protein Extraction and Western blotting solutions 33
2.3. Laboratory Methods 34
2.3.1. Tissue Culture techniques 34
2.3.2. Nicotine treatment protocol 34
2.3.3. RNA experiments 36
2.3.4. Protein experiments 36
2.3.5. Microarray analysis 39
2.4. Microarray Meta-analysis 41
2.4.1. Preparation of expression data 41
2.4.2. Features of the breast cancer microarray experiments 42
2.4.3. Experimental features of the in vitro public microarray experiment 44

x
2.4.4. Microarray analysis 46
2.4.5. Analysis of Data 47
2.4.6. Regression Analysis 47
2.4.7. Analysis of Co-expressed Genes 48
2.5. Statistical Analysis of Cell Proliferation 48
CHAPTER 3. AIMS AND STRATEGY 46
CHAPTER 4: RESULTS 51
4.1. Nicotine-mediated Signaling Pathways via Microarray Experiments in MCF7 Cell
Line 51
4.1.1. The dose-and time-dependent effect of nicotine on breast cancer cell
proliferation 51
4.1.2. Nicotine modulates Cyclin E protein expression in a serum-dependent
manner 53
4.1.3. Nicotine modulates p53 and Bcl-xl protein levels in a serum-dependent
manner 54
4.1.4. Genome-wide profiling of nicotine exposure in MCF7 cells 55
4.1.5. RNA and Microarray data quality assessment 56
4.1.6. Nicotine’s effect on MCF7 transcriptome under the physiological serum
conditions 61
4.1.7. Preliminary analyses of MCF7 transcriptome under serum starvation and
nicotine treatment 69
4.1.7.1. Nicotine treatment under starvation might lead to recovery of cell
expression in a subset of probesets 77
4.1.7.2. Nicotine modulates expression independent of serum starvation for a
subset of probesets 84
4.1.8. Cholinergic nAChR receptor expression analysis 89

xi
4.2. Involvement of Estrogen in CHRNA5 Signaling 95
4.2.1. CHRNA5 Expression Analysis in Breast Cancer Cell Lines 95
4.2.1.1. Estrogen treatment increases CHRNA5 expression 96
4.2.1.2. Estrogen induces the expression of CHRNA5 in a dose- and time-
dependent manner 99
4.2.1.3. CHRNA5 is the secondary target of estrogen signaling 104
4.2.1.4. Estrogen-independent MCF7 sublines have higher CHRNA5
expression 107
4.2.2. CHRNA5 Expression Analysis in Breast Cancer studies 110
4.2.2.1. ER status 111
4.2.2.2. Histological Grade 112
4.2.2.3. Hormone therapy 115
4.2.3. Analysis of Correlated Genes with CHRNA5 117
CHAPTER 5: DISCUSSION 122
5.1. Nicotine-mediated Signaling in MCF-7 Cells 122
5.2. Involvement of Estrogen in CHRNA5 Expression 128
5.3. Future Perspectives 130
CHAPTER 6: APPENDICES 133
REFERENCES 136

xii
LIST OF FIGURES
NUMBER/NAME PAGE
Figure 1.1.1. Structure of nicotine 2
Figure 1.1.2. Schematic organization of a single subunit and the pentameric nAChR 3
Figure 1.1.3. “The diverse functions of the homomeric α7 nAChR and of the heteromeric
α4β2nAChRs” 6
Figure 1.1.4. Schematic representation of the proliferative activity of nicotine via α7nAChR in
cells 11
Figure 1.1.5. Model signaling pathways summarizing the anti-apoptotic activity of nicotine 14
Figure 1.2.1. “Prognostic factors of breast cancer” 17
Figure 1.2.2. The anatomy of human breast 20
Figure 1.2.3. “Model representing the mechanistically distinct molecular pathways used in the
regulatory actions of ERs” 23
Figure 2.3.1. The schematic representation of semi-dry transfer 38
Figure 2.4.1. Establishment of OHT-resistant, ICI-resistant MCF7 cells and maintenance of
wild-type MCF7 cells 46
Figure 4.1.1. Time- and dose-dependent effects of nicotine treatment on MCF7 cell
proliferation/growth at 10% serum 52
Figure 4.1.2. Time- and dose-dependent effects of nicotine treatment on MCF7 cell
proliferation/growth at 0.1% serum 53
Figure 4.1.3.Cyclin E expression in response to nicotine treatment under different serum
conditions 54
Figure 4.1.4. The anti-apoptotic effects of nicotine under different serum conditions 55
xiii
Figure 4.1.5. RNA integrity graphs of microarray samples 56
Figure 4.1.6. Quality control plots of microarray samples 59
Figure 4.1.7. RNA degradation plots of microarray experiments 60
Figure 4.1.8. Scatter plot of probesets with or without nicotine treatment in 10% serum
conditions 62
Figure 4.1.9. GO analysis of nicotine treatment in 10% serum 67
Figure 4.1.10. Scatter plot of probesets with or without nicotine treatment in 0.1% serum
conditions 70
Figure 4.1.11. GO analysis of nicotine treatment in 0.1% serum 75
Figure 4.1.12. GO analysis of genes which nicotine treated cells in 0.1% serum had similar
response to untreated cells in 10% serum 81
Figure 4.1.13. Cluster analysis of genes which nicotine treated cells in 0.1% serum had similar
response to untreated cells in 10% serum 83
Figure 4.1.14. GO analysis of genes inversely correlated between 0.1% serum-nicotine and 10%
serum samples 87
Figure 4.1.15. Cluster analysis of probesets inversely correlated between 0.1% serum-nicotine
and 10% serum samples 88
Figure 4.1.16. Cluster analysis of nAChRs in respose to nicotine treatment at different serum
conditions 90
Figure 4.2.1. Estrogen effect on CHRNA5 expression in the data set GSE3529 (Rae, Johnson et
al. 2005) using BT474, T47D and MCF7 cell lines 97
Figure 4.2.2. CHRNA5 expression in response to E2 98
Figure 4.2.3: CHRNA5 expression to estrogen dose-dependent treatment 100

xiv
Figure 4.2.4: CHRNA5 expression in response to hormone starvation 101
Figure 4.2.5. CHRNA5 expression in response to time-dependent E2 exposure 103
Figure 4.2.6. CHRNA5 expression in response to E2 exposure in the presence or absence of
translation inhibitor cycloheximide 105
Figure 4.2.7. CHRNA5 expression in response to short-time E2 exposure 106
Figure 4.2.8. CHRNA5 expression in response to E2 in different MCF7 sublines 108
Figure 4.2.9. CHRNA5 expression in estrogen-independent MCF7 clones 109
Figure 4.2.10. CHRNA5 expression based on ER status 111
Figure 4.2.11. CHRNA5 expression based on histological grade level 113
Figure 4.2.12. CHRNA5 expression based on histological grade with ER status 114
Figure 4.2.13. CHRNA5 expression based on therapy status with grade 116
Figure 4.2.14. GO analysis of correlated genes 119
Figure 6.1. pS2 expression 133
Figure 6.2. MYC and E2F1 expression in response to E2 in the presence or absence of
cycloheximide 134
Figure 6.3. MYC and E2F1 expression in response to E2 for 2 h 135
xv
LIST OF TABLES
NUMBER/NAME PAGE
Table 1.2.1. Morphological features of breast cancer 20
Table 2.4.1. Publicly available gene expression data from estrogen studies on cell line 41
Table 2.4.2. Publicly available gene expression data from primary breast cancer studies 42
Table 2.4.3. The distribution of data according to ER, grade and treatment status 43
Table 4.1.1. Description table of the microarray samples and RIN values 57
Table 4.1.2. Data associated with Figure 4.1.6 59
Table 4.1.3. Pathway analysis of nicotine treatment in 10% serum 68
Table 4.1.4. Pathway analysis of nicotine treatment in 0.1% serum 76
Table 4.1.5. Pathway analysis of genes which nicotine treated cells in 0.1% serum had similar
response to untreated cells in 10% serum 78
Table 4.1.6. Pathway analysis of genes inversely correlated between 0.1% serum-nicotine and
10% serum samples 85
Table 4.1.7. Results of class comparison analysis of nAChRs under 10 % serum conditions 91
Table 4.1.8. Results of fold-change of nAChRs under serum starvation 92
Table 4.1.9. Results of fold-change of nAChRs between serum starvation and physiological
serum concentrations 94
Table 4.2.1. Class comparison results of in vitro studies 95
Table 4.2.2. Regression analysis of dose-dependent and time-dependent data 102
Table 4.2.3. Class comparison results of primary breast tumor studies 110
Table 4.2.4. Correlated genes with CHRNA5 117

xvi
Table 4.2.5. Pathway analysis of correlated genes with CHRNA5 118
Table 4.2.6. Prediction analysis results for the correlated genes according to ER status 120
Table 4.2.7. Prediction analysis results for the correlated genes according to histological grade
121

xvii
ABBREVIATIONS
Ach Acetylcholine
APS Ammonium Persulphate
Bcl-xl Bcl-2-like protein 1
CHRNA5 Cholinergic Receptor, nicotinic, alpha 5
E2 Estrogen, estradiol
ER Estrogen Receptor
GEO Gene Expression Omnibus
GFR Growth Factor Receptor
GO Gene Ontology
ICI Fulvestrand
MAPK Mitogen-activated Protein Kinase
nAChRs Nicotinic Acetylcholine Receptor
OHT Tamoxifen
RIN RNA Integrity
SNP Single Nucleotide Polymorphism
TEMED Tetramethylethylenediamine

1
CHAPTER 1: INTRODUCTION
1.1. Cholinergic Signaling
1.1.1. Tobacco use, cancer and nicotine:
Smoking is one of the leading causes of cancer–related deaths worldwide. Recent
studies suggest that 25% of all cancers in men and 4% in women are related to smoking
(Stewart and Kleihues 2003). Studies carried out in Europe, Japan and North America also
demonstrate that 91% of all lung cancers in men and 69% in women are related to cigarette
smoking (Stewart and Kleihues 2003). In addition, smoking is one of the main risks for the
oesophagus, larynx, oral cavity and stomach cancers for males and females (Sasco, Secretan
et al. 2004).
4000 different chemicals are found in cigarette smoke and more than 60 are identified
as carcinogens according to the study of International Agency for Research on Cancer (IARC
2004). Nicotine, first isolated from the tobacco plant Nicotiana tabacum (Fig. 1.1.1) by
German chemists Posselt and Riemannin in 1828, is the principal psychoactive and addictive
component in tobacco; and it is highly addictive (Catassi, Servent et al. 2008). Consequently,
smokers are exposed to a diverse array of carcinogens and other bioactive compounds in
tobacco, making tobacco use the leading cause of premature deaths in developed countries
(Peto and Doll 1992). The common idea is that the carcinogens in cigarette smoke are
converted into the bulky compounds and these compounds react with DNA, thereby leading
to DNA adducts and genetic alterations in cancer (Catassi, Servent et al. 2008). However,
recent studies challenge this conception and suggest that components such as nicotine act as
signaling molecules modulating cellular homeostasis (Dasgupta and Chellappan 2006;
Dasgupta, Kinkade et al. 2006; Dasgupta, Rastogi et al. 2006). On the other hand, multiple
studies about the therapeutic effects of nicotine for Parkinson’s disease, Alzheimer’s disease,
and ulcerative colitis are present (Jani and Regueiro 2002; Quik and Kulak 2002; Sabbagh,
Lukas et al. 2002).

2
Figure 1.1.1. Structure of nicotine. A) Tobacco plant. B) Chemical structure of nicotine.
Modified from (Catassi, Servent et al. 2008).
Nicotine absorption takes place through the oral cavity, skin, lung, urinary bladder, and
gastrointestinal tract (Schevelbein, Eberhardt et al. 1973). Nicotine levels in blood increase
rapidly during the completion of cigarette smoking because nicotine is readily absorbed once
it reaches the lungs (Catassi, Servent et al. 2008). Other routes for absorption include skin
and stomach; skin allows for diffusion at different rates while stomach is acidic thus does not
enable rapid absorption. However, nicotine is well absorbed in the small intestine due to the
higher pH and a large surface area (Hukkanen, Jacob et al. 2005).
1.1.2. The structure and function of nicotinic acetylcholine receptors (nAChRs):
Nicotinic acetylcholine receptors (nAChR/CHRNs) are ion channels located on the
plasma membrane of neuronal and non-neuronal cells and tissues (Sobel and Changeux 1977;
Lindstrom, Anand et al. 1996; Lukas, Changeux et al. 1999; Sharma and Vijayaraghavan
2002; Gotti and Clementi 2004; Wessler and Kirkpatrick 2008). 10α subunits (α1-α10) and

3
4β subunits (β1-β4) are identified (Lukas, Changeux et al. 1999). A functional receptor
complex consists of homo- or heteropentamer of α1–α10 and β1–β4 subunits that are
arranged symmetrically around an axis perpendicular to the membrane. The composition and
stoichiometry of the subunits determine the cation selectivity, desensitization kinetics and
spatial distribution (Catassi, Servent et al. 2008). Although nAChRs were first identified in
the neuronal system, recent studies indicate the presence of nAChRs in a variety of non-
neuronal cells (Egleton, Brown et al. 2008).
All nAChR subunits possess a large extracellular domain, four transmembrane regions
(M1–M4) with an α-helix structure, a large cytoplasmic domain between M3 and M4 and
finally a short extracellular C-terminal tail (Fig. 1.1.2). The loops present on the extracellular
regions of nAChR maintain the ACh binding site while transmembrane segment of M2
contributes to the lining of the pore (Corringer, Le Novere et al. 2000). The structural
coupling between these domains plays key roles in signal transduction between the natural
ligand acetylcholine (Ach) binding and the ion channel gating, the depolarization of the post-
synaptic membrane, and the propagation of an action potential. Aside from the
agonistic/antagonist binding site, diverse interaction sites are present on nAChRs for both
non-competitive inhibitors and allosteric modulators (Hogg, Buisson et al. 2005).
Figure 1.1.2. Schematic organization of a single subunit and the pentameric nAChRs (Russo,
Catassi et al. 2006).

4
In recent years, crystallographic structure studies about the extracellular domain of
nAChRs, electronic microscopy images and several biochemical studies on the ligand
binding sites have increased the understanding of the interactions of different nAChRs with
diverse ligands as well as the molecular level of these interactions and the primary motion
leading to the receptor activation. These findings have become important for the drug-design
related to the therapy of neurological disorders such as Alzheimer’s or Parkinson’s disease,
schizophrenia, anxiety, pain or epileptic disorders (Newhouse, Singh et al. 2004; Singh,
Potter et al. 2004).
Acetylcholine is the physiological agonist for all nAChRs (Wessler and Kirkpatrick
2008). Rapid conformational alterations from resting basal state to active or open–channel
state may occur in nAChRs, similar to allosteric receptors. Long-exposure to acetylcholine
leads to stabilization of the receptor in a closed desensitized state (Corringer, Le Novere et al.
2000). Similar to acetylcholine, nicotine binds as an agonist to α subunits of nAChRs. These
interactions lead to conformational changes in the receptor and open the gate on the
intracellular side of the ion channel in the plasma membrane. Consequently, ions flow into
the cells (Lindstrom, Anand et al. 1996). Increased level of cations in the cells leads to
membrane depolarization via decreasing the negative charges on the intracellular side of the
plasma membrane. Then, membrane depolarization opens gates on the intracellular side of
the plasma membrane of voltage-activated Ca++ channels, thereby resulting in an additional
influx of Ca++. Finally, all these events activate many diverse responses such as the release
of neurotransmitters, growth, angiogenic and neurotrophic factors, and stimulation of
different signaling cascades involved in the regulation of cell proliferation, apoptosis,
migration and differentiation (Kunzelmann 2005; Kunzelmann, Sun et al. 2005; Roderick and
Cook 2008).
α7nAChR and α4β2nAChRs are the best studied receptors with respect to the
biological effects of nicotine; and they are found most abundantly in the mammalian brain.
Although prolonged exposure to agonists leads to down-regulation of other types of cellular
receptors, prolonged nicotine exposure upregulates the expression of nAChRs (Kunzelmann
2005). Like acetylcholine, nicotine interacts with higher affinity with the heteromeric
nAChRs, particularly the α4β2nAChR, rather than with the α7nAChR7 (Barik and
5
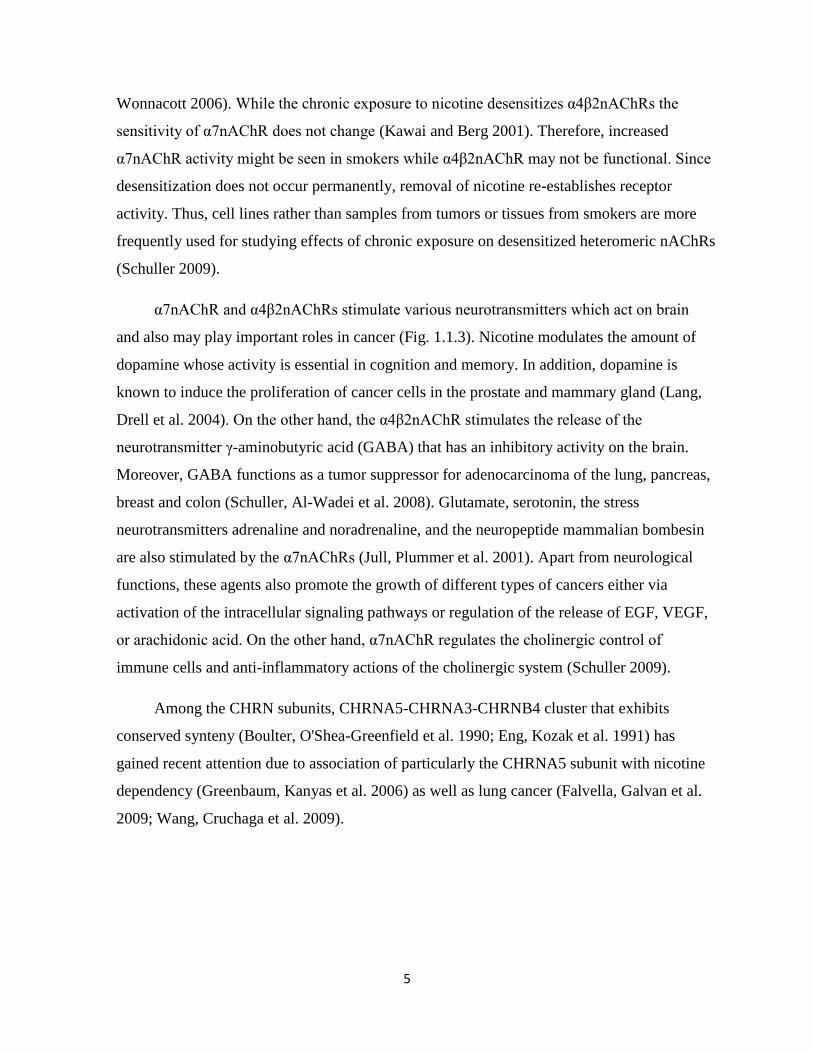
Wonnacott 2006). While the chronic exposure to nicotine desensitizes α4β2nAChRs the
sensitivity of α7nAChR does not change (Kawai and Berg 2001). Therefore, increased
α7nAChR activity might be seen in smokers while α4β2nAChR may not be functional. Since
desensitization does not occur permanently, removal of nicotine re-establishes receptor
activity. Thus, cell lines rather than samples from tumors or tissues from smokers are more
frequently used for studying effects of chronic exposure on desensitized heteromeric nAChRs
(Schuller 2009).
α7nAChR and α4β2nAChRs stimulate various neurotransmitters which act on brain
and also may play important roles in cancer (Fig. 1.1.3). Nicotine modulates the amount of
dopamine whose activity is essential in cognition and memory. In addition, dopamine is
known to induce the proliferation of cancer cells in the prostate and mammary gland (Lang,
Drell et al. 2004). On the other hand, the α4β2nAChR stimulates the release of the
neurotransmitter γ-aminobutyric acid (GABA) that has an inhibitory activity on the brain.
Moreover, GABA functions as a tumor suppressor for adenocarcinoma of the lung, pancreas,
breast and colon (Schuller, Al-Wadei et al. 2008). Glutamate, serotonin, the stress
neurotransmitters adrenaline and noradrenaline, and the neuropeptide mammalian bombesin
are also stimulated by the α7nAChRs (Jull, Plummer et al. 2001). Apart from neurological
functions, these agents also promote the growth of different types of cancers either via
activation of the intracellular signaling pathways or regulation of the release of EGF, VEGF,
or arachidonic acid. On the other hand, α7nAChR regulates the cholinergic control of
immune cells and anti-inflammatory actions of the cholinergic system (Schuller 2009).
Among the CHRN subunits, CHRNA5-CHRNA3-CHRNB4 cluster that exhibits
conserved synteny (Boulter, O'Shea-Greenfield et al. 1990; Eng, Kozak et al. 1991) has
gained recent attention due to association of particularly the CHRNA5 subunit with nicotine
dependency (Greenbaum, Kanyas et al. 2006) as well as lung cancer (Falvella, Galvan et al.
2009; Wang, Cruchaga et al. 2009).

6
Figure 1.1.3. “The diverse functions of the homomeric α7 nAChR and of the heteromeric
α4β2nAChRs” (Schuller 2009).
1.1.3. CHRNA5 (Nicotinic acetylcholine receptor alpha 5)
1.1.3.1. Function of CHRNA5:
A functional CHRN receptor is an ion channel that can either be homomeric or
heteromeric pentamer of a given set of subunits (Lukas, Changeux et al. 1999). Auxial
7
CHRNA5 can form funtional pentamers with α3β4, α3β2 (Conroy, Vernallis et al. 1992) or
with α4β2 CHRNs (Ramirez-Latorre, Yu et al. 1996). The presence of CHRNA5 subunit in
α3β4 or α3β2 receptors may lead to functional changes including increased Ca++
permeability and desensitization (Gerzanich, Wang et al. 1998). Similarly, CHRNA5 subunit
forming a pentamer with α4β2, which is the most abundant CHNR in the brain, increases
conductance of these receptors and leads to a higher rate of desensitization (Ramirez-Latorre,
Yu et al. 1996). Interestingly, CHRNA5 knock-out mice show no anatomical abnormalities in
brain or other tissues; and these mice have normal level of mRNAs encoding other nAChR
subunits (Wang, Orr-Urtreger et al. 2002). On the other hand, CHRNA5 knockout mice
become less sensitive to nicotine-induced seizures and more resistant to the nicotine-induced
hypo-locomotion in specific mouse strains although these mice demonstrate unchanged
epibatidine and α-bungarotoxin binding ability in the brain (Salas, Orr-Urtreger et al. 2003).
The nicotinic acetylcholine receptor subunit alpha 5 mediates short-term effects of nicotine in
vivo (Salas, Orr-Urtreger et al. 2003). Another study implicates cholinergic signaling through
CHRNA5 in modulation of the severity of colitis symptoms since CHRNA5 knockout mice
exhibit severe experimental colitis when compared with wild type controls (Orr-Urtreger,
Kedmi et al. 2005).
1.1.3.2. Polymorphism studies of CHRNA5 in connection with nicotine
dependence:
Recent studies related to the nicotine dependence and lung cancer risks have focused on
the cluster of CHRNA3-CHRNA5-CHRNB4. One of the first studies that revealed an
association of single nucleotide polymorphisms (SNPs) in cholinergic receptors with
smoking phenotypes in women was by Greenbaum et al. (Greenbaum, 2006 #65). The
authors demonstrated that multiple SNPs from a set of cholinergic receptor subunits might be
associated with smoking initiation, nicotine dependence, neuroticism, or novelty seeking
behaviors, and in particular, implicated SNPs in CHRNA7 and CHRNA5 with the severity of
nicotine dependence (Greenbaum, Kanyas et al. 2006). Rigbi et al. analyzed a set of 39 SNPs

8
in 11 different CHRN subunits on a group of female college students identifying CHRNA5
along with others in association with response inhibition, selective-sustained attention. More
recently small or large scale genome wide studies have taken over the scene to study
cholinergic signaling component driven genomic associations in populations that vary in
gender and ethnicity (Rigbi, Kanyas et al. 2008). A non-synonymous SNP of CHRNA5, i.e.,
rs16969968 (D398N), was first identified for being a significant risk variant in developing
nicotine dependence upon exposure to smoking in a large scale yet focused genome-wide
study (Saccone, Hinrichs et al. 2007). Later, Heitjan et al. also identified a SNP (rs871058)
on CHRNA5, located near to the rs16969968, while screening for a pharmocogenetic marker
in the clinical trial of bupropion versus placebo for smoking cessation (Heitjan, Guo et al.
2008). Grucza et al. found that rs16969968 was associated with a protective effect in cocaine
dependence while it was a risk variant in nicotine dependence (Grucza, Wang et al. 2008).
SNPs of CHRNA3, CHRNA5, and CHRNB4 cluster also were associated with early age of
the initiation of both alcohol and tobacco use in young adults of Caucasian and Hispanic
origin (Schlaepfer, Hoft et al. 2008).
A common haplotype in CHRNA5/CHRNA3 from a large scale study investigating
6000 SNPs on close to 2000 genes was associated with predisposition to nicotine dependence
based on the number of cigarettes smoked per day (Berrettini, Yuan et al. 2008). Stevens et
al. compared heavy smokers with light smokers to find out two different groups in the
CHRNA5-CHRNA3-CHRNB4 cluster related to heavy smoking while rs16969968 was
found to be the most likely candidate for the polymorphism responsible for increased risk of
heavy smoking (Stevens, Bierut et al. 2008). Caporaso et al. recently provided further
evidence that intensity of smoking was associated with rs16969968 while Saccone et al.
extended their studies and showed that CHRNA5-CHRNA3-CHRNB4 together with others
were associated with initiation of nicotine dependence (Caporaso, Gu et al. 2009; Saccone,
Saccone et al. 2009). Weiss et al. investigated the relationship between age dependent-
addiction and the CHRNA5-CHRNA3-CHRNB4 cluster in three different populations of
European origins (Weiss, Baker et al. 2008). They showed that specific haplotypes in this
cluster were significantly associated with severity of nicotine dependence in populations
started smoking before 16 but not in those started after 16. Taken together, these studies
9
implicated the CHRNA5-CHRNA3-CHRNAB4, and especially CHRNA5 in establishment
of smoking behavior and addiction while demonstrating a strong genetic component.
1.1.3.3. Polymorphism and expression studies of CHRNA5 in regard to
cancer
Apart from these studies implicating the CHRNA3-CHRNA5-CHNRB4 cluster with
smoking parameters and behaviors, independent studies mapped these loci on 15q25 in
association with lung cancer (Amos, Wu et al. 2008; Hung, McKay et al. 2008; Thorgeirsson,
Geller et al. 2008).
According to Hung et al., rs16969968 was associated with the lung cancers but this
association was independent of nicotine addiction (Hung, McKay et al. 2008). On the other
hand, Amos et al. found out that variation at rs8034191 was associated with both lung cancer
and smoking behavior (Amos, Wu et al. 2008). Evidently, CHRN variants were more directly
related to the lung cancer than the other smoking related cancers since in non-smoking
populations no significant risk was associated with renal and bladder cancers (Spitz, Amos et
al. 2008).
CHRNA5 strongly being implicated as a risk factor for lung cancer development also
accelerated research on its functional attributes using different systems. Earlier studies
focused on the antisense regulation of CHRNA5 and CHRNA3 since these two genes shared
evolutionarily conserved overlapping 3’UTR sequences that might allow for
CHRNA3/CHRNA5 duplex formation as shown in human neuroblastoma SY5Y cells (Solda,
Boi et al. 2005). In support of such a potential regulation, a 30-fold increase in CHRNA5
expression and a decrease in expression of CHRNA3 were found in a group of lung
adenocarcinoma patients and controls from Italy (Falvella, Galvan et al. 2009). In addition,
they found a direct relationship between mRNA expression and allelic composition implying
D398N (rs16969968) SNP with a functional role in lung cancer (Falvella, Galvan et al.
10
2009). In another study, Wang et al. studied with rs16969968 and rs588765 SNPs and found
that D398N amino acid variant in CHRNA5 (rs16969968) led to altered receptor function
rather than the level of mRNA expression; and both rs16969968 and rs588765 were
associated with the nicotine dependence and lung cancers (Wang, Cruchaga et al. 2009).
Bierut et al. investigated the functional role of D398N variant in D398 or N398 transfected
HEK293T cells. Accordingly, N398 variant demonstrated a lower response to nicotine than
D398 nevertheless N398 did not affect the receptor expression (Bierut, Madden et al. 2007).
The association of lung cancer risk variants in CHRNA3 and CHRNA5 with intensity of
smoking and exposure to carcinogenic nitrosamine (NNK) in cigarettes in regard to nicotine
metabolism also have been well established: carriers with a T variant of rs1051730
(CHRNA3) and/or A variant of rs16969968 (CHRNA5) were exposed to higher NNK levels
than noncarriers even if they smoked the same amount (Le Marchand, Derby et al. 2008).
On the other hand, not many studies focused on the role of CHRNA5 expression in
other cancer types. Among them, nicotine exposure to keratinocytes led to up-regulation of
CHRNA5 via the PKC pathway while this up-regulation was transient and followed by
CHRNA7 up-regulation. Since inclusion of CHRNA5 in α3β2 and α3β4 CHRNs increased
the Ca++ permeability, this suggested that up-regulation of CHRNA5 expression may lead to
the intracellular accumulation of Ca++ and up-regulation of CHRNA7 via of CaMKII and
p38 MAPK pathway. This study further demonstrated that the normal differentiation pattern
of kerotinocytes involved the sequential expression of cholinergic receptors with differential
Ca+ permeability (Arredondo, Chernyavsky et al. 2008). In another study, Song et al. found
that CHRNA5 expression was higher in tumor samples from squamous cell lung cancer
(SCC) patients and higher CHRNA5 expression was associated with lesser differentiated
state in SCC cell lines (Song, Sekhon et al. 2008).
1.1.4. Effect of nicotine on cell proliferation:
The proliferative activity of nicotine has been shown in various normal and cancer cells
(Gotti and Clementi 2004; Schuller 2007). Conti-Fine et al. and Zeidler et al. demonstrate

11
that nicotine causes increase in level of growth factors such as BDNF, VEGF, HGF, VEGF-
C, TGF-β, PDGF and TGF-α as well as growth factor receptors such as VEGFR-2, PDGFR,
HGFR and EGFR, thereby, promoting cell proliferation (Conti-Fine, Navaneetham et al.
2000; Zeidler, Albermann et al. 2007). In addition, studies using selective antagonists such as
α –bungarotoxin, hexamethonium and RNAi show that α7nAChR plays a key role in the
proliferative activity of nicotine (Heeschen, Weis et al. 2002; Trombino, Cesario et al. 2004;
Dasgupta, Rastogi et al. 2006).
Figure 1.1.4. Schematic representation of the proliferative activity of nicotine via α7nAChR
in cells. α-BT: α -bungarotoxin; Hex: hexamethonium (Egleton, Brown et al. 2008).
Nicotine’s interaction with α7-nAChR promotes the formation of an oligomeric
complex, including β-arrestin, Src and α7-nAChR, which in turn leads to the activation of Src
(Fig. 1.1.4). Activated Src initiates the MAP kinase pathway and induces Raf-1 interaction

12
with RB. Then, E2F, Rb and Raf-1 come together and make complexes to bind the
proliferative promoters. Established mitogenic signaling causes the removal of Raf-1 and Rb,
leaving free E2F1 on the proliferative promoters. Finally, all these events promote the cells to
enter into the S-phase. In another nicotine-induced mitogenic pathway by α7-nAChR, influx
of Ca++
into the cells initiates the ERK and MEKK1 activation. Consequently, MEKK1 leads
to the activation of NF-kB, which forces cells toward an S-phase entry (Egleton, Brown et al.
2008).
1.1.5. Effects of nicotine on apoptosis:
Several studies show that nicotine leads to resistance against apoptosis induced by
extracellular stress stimuli such as opioids, UV radiation, Ca2+ ionophores, neurotoxins, oxi-
dative stress and anticancer drugs; and such resistance might help induce survival in lung
cancer, oral cancer, and head and neck cancers (Dasgupta, Kinkade et al. 2006; Zeidler,
Albermann et al. 2007). In addition to cancer cells, nicotine can also protect normal cells
such as NHBE cells, airway epithelial cells, endothelial cells, human gingival fibroblasts and
renal epithelial cells against apoptosis induction (Zeidler, Albermann et al. 2007).
The molecular mechanisms of anti-apoptotic activity of nicotine have been investigated
by several groups. Figure 1.1.5 shows one of the best models: nicotine exerts its anti-
apoptotic activity via binding to nAChRs or β-adrenergic receptors (Schuller, Tithof et al.
1999; Trombino, Cesario et al. 2004; Dasgupta, Rastogi et al. 2006). In one route, nicotine
induces the activity of PKC/MAPK pathway and initiates the phosphorylation of Bcl2 and
Bad, thereby inhibiting cell death (Mai, May et al. 2003; Xin and Deng 2005; Xin, Gao et al.
2007). Alternatively, nicotine triggers the activity of PI3K-AKT pathway leading to
phosphorylation of Bax and Bad and upregulation of XIAP and survivin; so it protects the
cell against apoptosis (Dasgupta, Kinkade et al. 2006). In addition to these pathways, nicotine
also stimulates the PKA pathway to protect cells from apoptotic induction (Jin, Gao et al.
2004).

13
Aside from the anti-apoptotic activity, some studies demonstrate the pro-apoptotic
activity of nicotine. Berger et al. show the pro-apoptotic effects of nicotine on
undifferentiated rat hippocampal progenitor cells via induction of p21 and p53 expression
(Berger, Gage et al. 1998). However, nicotine does not induce apoptosis in cells commenced
to differentiate. In another study, after treatment of embryonic rat brain with 1, 10 or 100 μM
nicotine for 48 h, apoptosis takes place (Roy, Andrews et al. 1998). Yamamura et al. find that
nicotine triggers the influx of Ca++
into cells causing cell death in glioblastoma cell lines
(Yamamura, Amano et al. 1998). According to these studies, nicotine may induce apoptosis
in less differentiated embryonic cells especially when cell are treated with higher doses.

14
Figure 1.1.5. Model signaling pathways summarizing the anti-apoptotic activity of nicotine
(Egleton, Brown et al. 2008).
1.1.6. Effects of nicotine on angiogenesis:
Cucina et al., Conklin et al. and Cooke demonstrate that nicotine induces the expression
of endothelial growth factors like bFGF, PDGF-BB and VEGF, and endothelial nitric oxide

15
synthase (e-NOS) in endothelial cells. These findings encourage researchers to investigate the
pro-angiogenic activity of nicotine (Cucina, Sapienza et al. 2000; Conklin, Zhao et al. 2002;
Cooke 2007). Heeschen et al. provide direct evidence for the angiogenic activity of nicotine
in both the cell culture and animal models. They find that nicotine induces the angiogenic
tubule formation in collagen gels, upregulates capillary and collateral growth and leads to
tissue perfusion in ischemic hind-limbs in mouse models. In addition to these, they show that
nicotine promotes angiogenesis in the Lewis lung carcinoma tumors injected to wild-type
mice and increase the neovascularization in the sinus of Apo-E-deficient mice (Heeschen,
Jang et al. 2001; Heeschen, Weis et al. 2002; Heeschen, Weis et al. 2003).
Recent studies implicate that nicotine promotes angiogenesis and tumor invasion in
lung and gastric cancers (Shin and Cho 2005; Shin, Wu et al. 2005; Shin, Wu et al. 2007).
Valenca et al. find that nicotine leads to morphologic alterations in the lungs of Wistar rats
associated with the increased angiogenesis, infiltration of mononuclear cells and irregular
collapse (Valenca, de Souza da Fonseca et al. 2004). Morimoto et al. use a murine excisional
wound model and show that nicotine promotes wound healing in addition to its pro-
angiogenic activity (Morimoto, Takemoto et al. 2008).
Besides the pro-angiogenic activity, several studies suggest that cigarette smoking
might play key role in metastatic spread of cancer (Murin and Inciardi 2001; Murin,
Pinkerton et al. 2004). Alteration of cell adhesion to ECM proteins and disruption of cell–cell
junctions are the important processes of invasion and metastasis. Since the decrease in E-
cadherin and β-catenin with a parallel increase in fibronectin and vimentin is thought to be
one of the indicators of epithelial to mesenchymal transition, findings of Dasgupta et al.
reveal that chronic treatment with nicotine leads to the downregulation of ECM proteins, E-
cadherin and β-catenin, and upregulation of fibronectin and vimentin in MCF7 and MDA-
MB-468 breast cancer cells (Dasgupta, Rizwani et al. 2009). In another study, PKC and
cdc42 have been associated with the nicotine-induced cell migration in MCF7 and MCF10A
breast cancer cells (Guo, Ibaragi et al. 2008).
1.1.7. The association between smoking and breast cancer:

16
The link between smoking and breast cancer risk is a controversial issue. Most studies
find that smoking is not associated with an increased risk for breast cancer whereas some
studies suggest that smoking increases the risk of breast cancer. According to the 2006 US
Surgeon General’s report, The Health Consequences of Involuntary Exposure To Tobacco
Smoke, there are some supporting evidence that smoking increases breast cancer risk yet not
conclusively (ACS 2008).
However, some of the recent studies have indicated that there is a statistically
significant association between the breast cancer risk and smoking. For example, relative risk
(RR) of breast cancer is higher in postmenopausal woman based on a meta-analysis (RR =
1.21, CI = 1.08-1.36) (Khuder, Mutgi et al. 2001). Furthermore, breast cancer risk increases
in women who have continued smoking within 5 years of menarche and smoked at least 20
cigarettes per day (Band, Le et al. 2002). Long-term smoking, estrogen positivity and steroid
receptor coactivator gene AIB1 genotype also effectively increase breast cancer risk (Colilla,
Kantoff et al. 2006). For women who continued smoking while having the disease,
radiotherapy has increased the risk of breast cancer after 10 years (RR = 3.08; 95% CI, 1.61
to 5.91) (Prochazka, Hall et al. 2005).
Nicotine, a nicotinic acetylcholine receptor agonist, modulates multiple cellular
signaling pathways. Although nicotine is the most potent addictive and signal modulatory
component in cigarette smoke, it has not been studied in detail in the context of breast
cancers.
1.2. Breast Cancer:
Breast cancer is one of the most common types of cancer, after the lung cancer, and is
the second leading cause of cancer death among women in the United States. According to
the American Cancer Society 2009 report, breast cancer is the most frequently diagnosed
cancer in women except the skin cancer (ACS 2009). Because of hormone dependency in

17
breast cancer, hormonal therapies together with options that include surgery, radio- and
chemo-therapy have been widely used to treat breast cancer patients (Bai and Gust 2009).
Again, according to American Cancer Society Report, 192,370 new cases of invasive
breast cancers are estimated among women and 1,910 new cases are expected in men during
2009. Incidence of breast cancer has decreased 2.2% per year from 1995 to 2005 (ACS
2009). This decrease implies the success of improved treatment and earlier diagnosis. To
date, the 5-year survival of breast cancer patients is 89% while in 1960s it was 63%. The
survival rate is higher in women diagnosed with localized breast cancer than women
diagnosed with cancer spreading to the other organs (ACS 2009).
Understanding of histological features and molecular alterations in breast cancer is
essential to find novel therapeutic approaches with higher success in curing the disease.
Although breast cancers are extensively heterogeneous, prognostic factors can be classified
based on three main factors according to Tsuda: (1) the extent of (macro- and
microscopically visible) tumor spread, (2) biological properties of the cancer cells, and (3)
host–tumor relationship (Fig. 1.2.1) (Tsuda 2008).
Figure 1.2.1. “Prognostic factors of breast cancer. These can be largely categorized into
factors of: 1 the extent of tumor spread, 2 biological properties if cancer cells, 3 host-tumor
relationship” (Tsuda 2008).

18
Breast cancer incidence rates are affected by many risk factors. Age, gender, genetics,
reproductive history, radiation, socio-economic status, place of residence, and ethnicity are
the best known risk factors in breast cancer (McPherson, Steel et al. 2000; Key, Verkasalo et
al. 2001; ACS 2008). For example, age of menarche is effective; higher risks of developing
breast cancer are observed in women having more menstrual cycles due to the higher
exposure to estrogen and progesterone hormones (McPherson, Steel et al. 2000). Having no
child or first child at a late age increases the risk of breast cancer (Kvale 1992; Albrektsen,
Heuch et al. 1995; Lambe, Hsieh et al. 1996). About 5% to 10% of breast cancer is associated
with the genetic predisposition. The most common inherited mutations in breast cancer
include BRCA1 and BRCA2 (Easton, Ford et al. 1993; Futreal, Liu et al. 1994; Easton, Ford
et al. 1995; Gayther, Mangion et al. 1997) while mutations in ATM, CHEK2, p53 and PTEN
genes also increase the risk for breast cancer development (Starink, van der Veen et al. 1986;
Swift, Reitnauer et al. 1987; Swift, Morrell et al. 1991). Use of alcohol is associated with
increased risk of breast cancer, and this risk is correlated with the amount of consumption
(Key, Verkasalo et al. 2001).
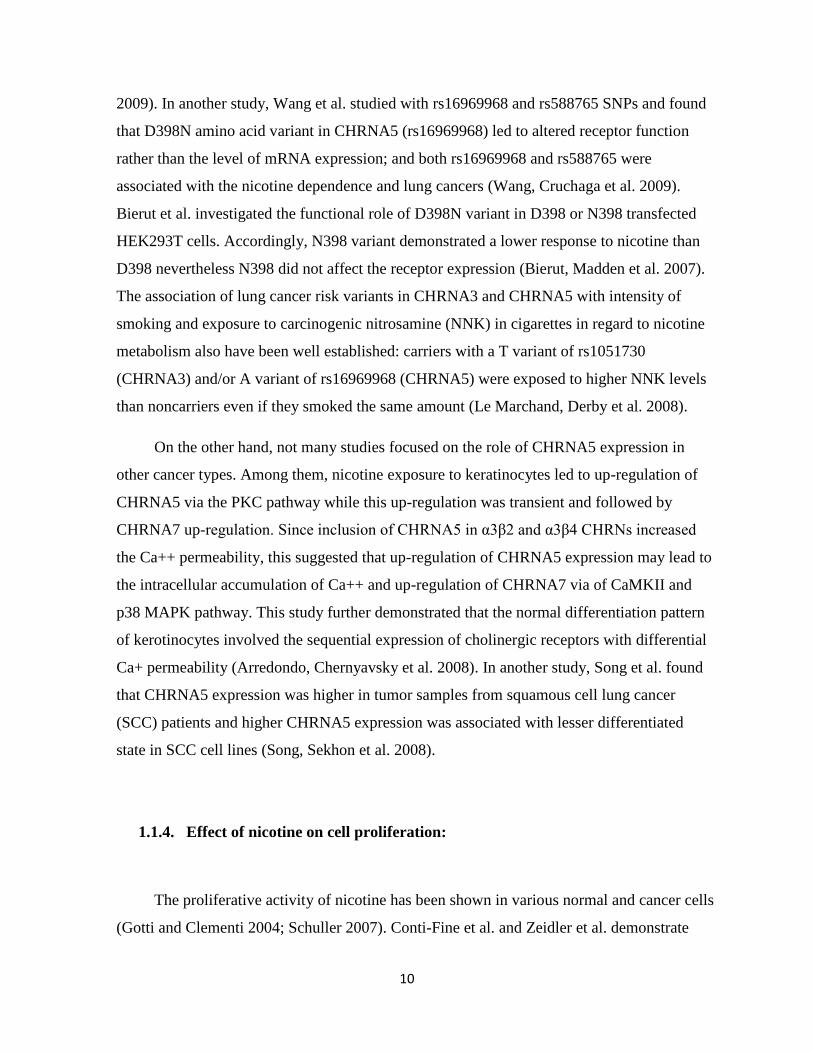
Breast cancer originates from the epithelial cells of the breast. Mostly, it is seen in
women, but in rare cases, men can develop breast cancers, as well (Beyrouti, Beyrouti et al.
2007). Mammary glands are responsible for production of the breast milk; ducts play a role in
carrying milk from the lobules to the nipple; and the fatty and connective tissue, blood
vessels, and lymph vessels are the essential parts of the breast (Fig. 1.2.2). In most cases,
breast cancers start in the ducts (ductal cancer), but sometimes they can be lobular. Several
types of breast cancer exist but ductal carcinoma in situ (DCIS), lobular carcinoma in situ
(LCIS), infiltrating ductal carcinoma (IDC) and infiltrating lobular carcinoma (ILC) are the
most common (Figure 1.2.2). Ductal carcinoma in situ is diagnosed in 25% of the
mammographic screening programs (Bircan, Kapucuoglu et al. 2006). It is a non-invasive
type of cancer and women diagnosed with DCIS can be cured (ACS 2008). Similarly, lobular
carcinoma in situ, also called lobular neoplasia, is classified as a type of non-invasive breast
cancer; women with LCIS may have increased risk of breast cancer (ACS 2008). Invasive (or
infiltrating) ductal carcinoma is the most common type of invasive breast cancer and is
highly heterogeneous.

19
Although factors related the extent of tumor spread and host-tumor relationship are
important to understand mechanisms underlying breast cancer development and prognosis, in
this study, we will focus on biological factors used to classify breast cancers and assign
prognosis, namely, the histological grade and estrogen receptor status.
1.2.1. Histological Grade in Breast Cancer:
Histological grade has been considered as a prognostic factor in breast cancer. The
common histological grading system has been modified from the Bloom and Richardson
grading system by Elston and Ellis, and now it is known as Nottingham combined
histological grade (Elston and Ellis 1990). These grading systems are based on three
morphologic features including percentage of tubule formation, degree of nuclear
pleomorphism and accurate mitotic count in a defined field area (Ignatiadis and Sotiriou
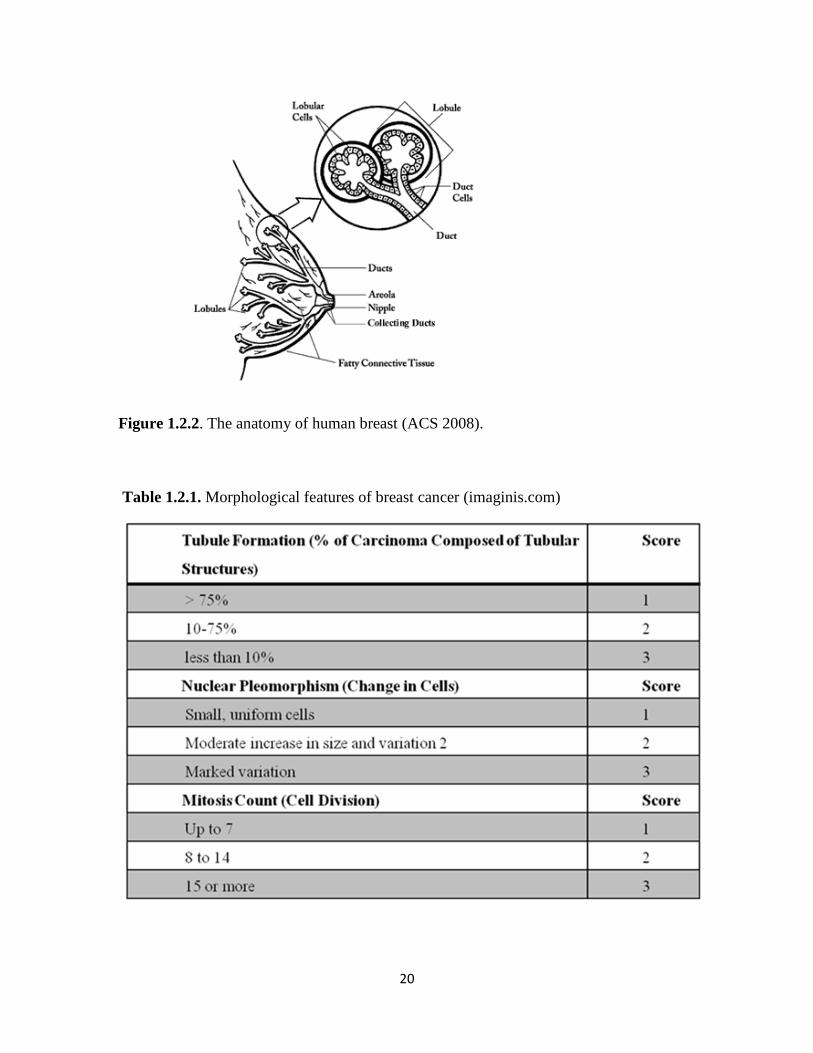
2008). Each morphological feature is then scored between 1-3 (Table 1.2.1) and the total
score determines the grade such that the total scores of 3- 5, 6-7 and 8-9 are considered as
Grade 1 tumor (well-differentiated), Grade 2 tumor (moderately-differentiated), Grade 3
tumor (poorly-differentiated), respectively. In terms of grading system, Grade 1 of IDC is
characterized by lower nuclear grade, and usually hormone receptor–positivity. On the other
hand, Grade III of IDC shows the higher nuclear grade and hormone receptor negativity and
genomic instability (Sims, Howell et al. 2007). Similar to IDC, invasive (or infiltrating)
lobular carcinoma (ILC) can metastasize to other parts of the body (ACS 2008). In addition,
similar Grading from I to III indicates the degree of nuclear grade and receptor positivity for
ILC, as well (Sims, Howell et al. 2007).
20
Figure 1.2.2. The anatomy of human breast (ACS 2008).
Table 1.2.1. Morphological features of breast cancer (imaginis.com)

21
In general, histological grading is a crucial criterion for estimating the risk of
recurrence of invasive ductal carcinoma and the choice of adjuvant therapies (Goldhirsch,
Glick et al. 2005; Goldhirsch, Wood et al. 2007). Since higher grade reflects mitotic activity,
both the histological grade and nuclear grade defined by Tsuda et al. have a common ground
(Tsuda, Sakamaki et al. 1998). Although independent of tumor size or lymph nodal status,
histological grade is a prognostic marker that significantly correlates with HER2
amplification, activation of p53, negativity of estrogen and progesterone receptors, and
accumulation of chromosome alterations (Tsuda 2008).
Gene expression profiling of breast cancer has been extensively studied to identify
prognostic signatures. However, a common prognostic signature is limited by the number of
individual studies that significantly support an mRNA or protein marker or a gene expression
signature, as more recently available through public data resources. In this respect, Sotiriou et
al. performed a large meta-analysis from the publicly available gene expression and clinical
data from 2,833 patients and defined co-expression modules for biological processes
underlying breast cancer development; these processes included proliferation, ER and HER2
signaling (Sotiriou, Wirapati et al. 2006). Accordingly, it is now possible to classify the
breast tumors into prognostically significant 3 main groups, namely ER–/HER–, HER2+ and
ER+/HER2–. In these groupings, proliferation remained the most significant feature of
histological grading in addition to being a powerful prognostic factor. Indeed, ER- breast
cancers usually are characterized with high proliferation indices (Ignatiadis and Sotiriou
2008). Therefore, these findings confirm the correlation of high grade tumor with ER
negativity (Tsuda 2008).
1.3. Estrogen and Estrogen Receptor in Breast Cancer:
Estrogens, a group of steroid compounds, have important roles during the development
and maintenance of normal sexual and reproductive system. They also act on cardiovascular,
musculoskeletal, immune, and central nervous systems in both men and women (Gustafsson

22
2003). 17β-estradiol (E2) is the most potent estrogen produced in the body. Estrogen exerts
its activity via binding estrogen receptors. Estrogen receptor (ER), a ligand-inducible
transcription factor, belongs to the nuclear receptor family and has to dimerize for becoming
active (Heldring, Pike et al. 2007). There are two types of estrogen receptor such as ER-α and
ER-β although many isoforms of these receptors also are present (Heldring, Pike et al. 2007).
Aside from being important in multiple biological processes, estrogens have a key role
in the growth and development of breast cancer. In general, estrogen leads to breast cancer
development via binding to ER-α rather than ER-β (Bai and Gust 2009). Therefore,
determining the ER status is the most essential factor to identify patients eligible for
preoperative or postoperative endocrine therapies. Hormone therapy is generally advised to
treat the ER+/PgR+ patients (Tsuda 2008). Immunohistochemistry (IHC) is mainly used to
evaluate the presence of ER whereas it is also possible to classify cell lines and/or tumors
based on profiling of a cluster of genes primarily or secondarily related to estrogen receptor
mRNA expression (West, Blanchette et al. 2001).
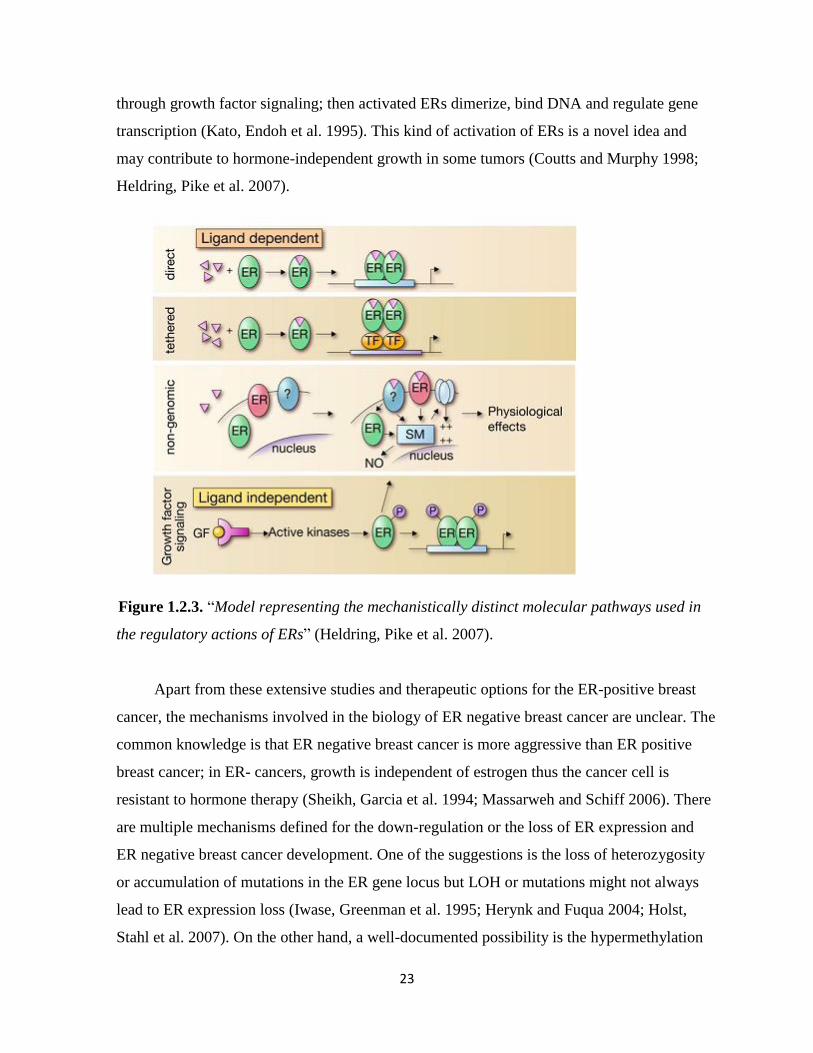
Estrogens and ERs regulate the biological processes in several distinct pathways
(Fig.1.2.3) (Hall, Couse et al. 2001). There are two possibilities, ER acts upon binding of a
ligand, or ligand-independently (Heldring, Pike et al. 2007). When the estrogen bound ER
directly binds to DNA to regulate the gene expression, the mechanism is called classical
(direct) pathway, which is the most known (Kushner, Agard et al. 2000). Besides the classical
pathway, the tethered pathway is where the estrogen binds to ER and then interacts with other
transcription factors; thereby regulation is performed by indirect DNA binding (Saville,
Wormke et al. 2000). The third pathway known as the nongenomic pathway where estrogen
activates a membrane associated receptor, either ER located closer to the membrane, or to a
different receptor, which in turn this binding initiates signaling cascades via second
messengers such as cAMP. These messengers activate ion channels and produce a rapid
physiological response without involving gene regulation (Saville, Wormke et al. 2000;
Simoncini, Mannella et al. 2004; Song, Fan et al. 2006; Song and Santen 2006). On the other
hand, estrogen receptor also can function in ligand-independent manner (the forth pathway in
Fig. 1.2.3). In such cases, activated kinases may activate ER through phosphorylation and
23
through growth factor signaling; then activated ERs dimerize, bind DNA and regulate gene
transcription (Kato, Endoh et al. 1995). This kind of activation of ERs is a novel idea and
may contribute to hormone-independent growth in some tumors (Coutts and Murphy 1998;
Heldring, Pike et al. 2007).
Figure 1.2.3. “Model representing the mechanistically distinct molecular pathways used in
the regulatory actions of ERs” (Heldring, Pike et al. 2007).
Apart from these extensive studies and therapeutic options for the ER-positive breast
cancer, the mechanisms involved in the biology of ER negative breast cancer are unclear. The
common knowledge is that ER negative breast cancer is more aggressive than ER positive
breast cancer; in ER- cancers, growth is independent of estrogen thus the cancer cell is
resistant to hormone therapy (Sheikh, Garcia et al. 1994; Massarweh and Schiff 2006). There
are multiple mechanisms defined for the down-regulation or the loss of ER expression and
ER negative breast cancer development. One of the suggestions is the loss of heterozygosity
or accumulation of mutations in the ER gene locus but LOH or mutations might not always
lead to ER expression loss (Iwase, Greenman et al. 1995; Herynk and Fuqua 2004; Holst,
Stahl et al. 2007). On the other hand, a well-documented possibility is the hypermethylation

24
of CpG islands within the ER promoter. Epigenetic silencing has been found in 25% of ER-
negative breast cancers (Yang, Phillips et al. 2001; Giacinti, Claudio et al. 2006).Other
possibilities include the altered activity of transcription factors acting on the ER promoter
(Castles, Oesterreich et al. 1997; Reid, Denger et al. 2002), mRNA degradation via miRNAs
(Reid, Denger et al. 2002; Adams, Furneaux et al. 2007), postranscritional modification
leading to degradation (Stoner, Saville et al. 2002), and finally silencing at the mRNA and
protein levels via hyperactivity of growth factor receptor (GFR) signaling (Holloway, Murthy
et al. 2004; Creighton, Hilger et al. 2006; Bayliss, Hilger et al. 2007). In addition,
hyperactivity of GFR signaling and its intermediates can lead to resistance to endocrine
therapy (Lopez-Tarruella and Schiff 2007).
Restoring the ER function is one of the most powerful therapeutic approaches to cure
the ER-negative breast cancer patients. One of them is the treatment of ER-negative breast
cancer with histone deacetylase inhibitors or agents inducing DNA demethylation to restore
ER-positivity (Yang, Phillips et al. 2001; Sharma, Smith et al. 2006). Another approach is
using a MAPK blockade to decrease the GFR/MAPK signaling activity (Bayliss, Hilger et al.
2007). After restored ER functions, hormonal therapy might be used to treat the patients.
1.3.1. Hormone Therapy in Breast Cancer:
Anti-estrogens are used to inhibit the physiological activities of E2 to prevent the
development of cancer in hormone therapy. Tamoxifen is the most common anti-estrogen
used in hormone therapy (Clarke, Liu et al. 2003). Although it functions as anti-estrogen in
breast cancer, it might act also as an estrogen agonist in some other tissues including the
bone, uterus, liver, and the cardiovascular system (McDonald and Stewart 1991; Rutqvist and
Mattsson 1993; Nuttall, Stroup et al. 2000; Chlebowski 2005). These agonistic activities
present advantages for the woman taking tamoxifen to enhance the bone maintenance while
protecting the blood-lipid profile and decreasing the coronary risk (McDonald and Stewart
1991; Dewar, Horobin et al. 1992). On the other hand, its agonistic activity stimulates the
endometrial hyperplesia in uterus and may function as a carcinogen in liver (Gal, Kopel et al.

25
1991; Ahotupa, Hirsimaki et al. 1994; Barakat 1996). The mechanism by which Tamoxifen
works is through competition with estrogen to bind the ER. Upon binding, it alters the
conformation of ER and thereby, blocks the ER dimerization and binding to DNA or to co-
activators, or makes the ER favorable to bind co-repressors (Huang, Norris et al. 2002; Shang
and Brown 2002). Therefore, Tamoxifen inhibits the estrogen-induced growth of breast
cancer. Another anti-estrogen used in breast cancer is RAL. Its activity is very similar to
tamoxifen but it blocks the endometrial cancer growth (Swaby, Sharma et al. 2007). Recent
studies indicate that aromatase inhibitors produce better results than tamoxifen treatment (Bai
and Gust 2009).
Despite estrogen-like activity of tamoxifen, pure anti-estrogens, such as fulvestrants, do
not have any agonistic effects. Fulvestrants interact with newly synthesized ER in the
cytoplasm and inhibit their nuclear transportation; the inhibited receptor is then degraded
(Dauvois, Danielian et al. 1992). Despite the initial response to hormone therapy, the tumor
may exhibit recurrence upon long-term therapy where patients become resistant to multiple
therapies. There are two main pathways leading to resistance to therapy: intrinsic (de novo)
and acquired (Hurvitz and Pietras 2008). Genetic polymorphism is one of the reasons for the
intrinsic resistance to tamoxifen however the intrinsic resistance mechanisms need further
study (Beverage, Sissung et al. 2007; Schroth, Antoniadou et al. 2007). On the other hand,
many studies focus on the acquired resistance. Activation of ER-regulated growth factor
pathways independent of steroid control, hyperactivity of GFR signaling and its components,
constitutively active ER mutants or variants are some of the mechanisms to elucidate the
acquired resistance (Fuqua, Wiltschke et al. 2000; Schiff, Massarweh et al. 2003; Schiff,
Massarweh et al. 2004; Normanno, Di Maio et al. 2005). Recent studies focus on the
understanding of the resistance mechanisms and improvement of the endocrine therapy
which is still one of the best therapies for the breast cancer patients (Hurvitz and Pietras
2008).
1.3.2. Cell Culture Cancer Models
26
1.3.2.1. MCF7 Cells as a Model For The Estrogen Studies:
MCF7 is an ER-α positive breast cancer cell line and its growth depends on the
presence of estrogen. In addition, distinct types of clones can be obtained under certain
conditions that alter the estrogen-sensitivity. Highly-sensitive MCF7/ BUS cells, estrogen-
independent MCF7:2A and MCF7:5C cells, and drug resistant MCF7 cells are some of the
examples (Pink, Jiang et al. 1995; Villalobos, Olea et al. 1995; Coser, Chesnes et al. 2003;
Fan, Yan et al. 2006). These modified types of clones help researchers understand the
estrogen signaling and hormone resistance mechanisms.
1.3.2.2. Effects of serum starvation on cells:
Serum starvation is widely used to obtain synchronized cells. Since serum starvation
prevents TOR protein activity and decreases the levels of cyclin D1, it leads to cell cycle
arrest in the G0/G1 phase (Kues, Anger et al. 2000; Cooper 2003; Demidenko and
Blagosklonny 2008). Under serum starved conditions, the entry into S phase does not occur.
If the cell cycle arrest is induced by serum starvation, the DNA synthesis stops (Cooper
2003). Kim et al. suggest that under serum withdrawal, MRPL41, mitochondrial ribosomal
protein L41, leads to cell cycle arrest via increasing the p21 (WAF1/CIP1) and p27 (Kip1)
levels (Kim, Yoo et al. 2005). Shin et al. use SK-OV-3 ovarian cancer cells. They show that
serum starvation induces the G1 cell cycle arrest without causing cell death and decreases
Skp2, CDK2 and CDK4 in protein level. Since Skp2 suppresses the p27 activity, Skp2
indirectly enhances the CDK2 activity (Shin, Hong et al. 2008). Therefore, they suggest that
serum starvation leads to cell cycle arrest via decreasing Skp2, CDK2 and CDK4 proteins
(Shin, Hong et al. 2008). In another study, serum starvation suppresses Cdc6 at both the
mRNA and protein levels in human diploid fibroblasts, and the addition of serum re-
establishes the expression (Williams, Shohet et al. 1997). Since PKCη interacts with cyclin E
in the absence of serum, serum starvation may inhibit the kinase activity of cyclin E/Cdk2
complex via PKCη (Shtutman, Hershko et al. 2003).

27
Besides the cell cycle arrest, serum starvation can trigger apoptosis. Hasan et al indicate
that serum starvation of V79 cells activates the p53, whose activity depends on PKC-α
(Hasan, Adams et al. 1999). On the other hand, Ming et al. use the p53 mutant cell lines to
examine apoptotic effect of serum starvation (Ming, Sakaida et al. 2008). They find that
serum starvation causes the transcription factors SP1 and p73 to bind the promoter of PUMA
and induce the expression through a p53-independent mechanism. In another study, Raf-1 has
a protective role in response to serum starvation in fibroblasts (Mikula, Schreiber et al. 2001).
Thiel et al. suggest that the signaling cascade BDNF → TrkB stimulation → PI3 kinase
activation → activation of AKT is essential to rescue the cell from serum withdrawal induced
apoptosis (Thiel, Ekici et al. 2009). eIF4E, eukaryotic initiation factor 4E, mediates the gene
expression to activate AKT; and AKT activation protects cells from apoptosis while eIF4E
prevents apoptosis induced by serum starvation (Culjkovic, Tan et al. 2008). Lu et al. use
HaCat cells and MEF cells in their studies showing that serum starvation leads to
phosphorylation of H2AX, a variant of the histone H2A family, and p38 (Lu, Shi et al. 2008).
Since blocking p38 abrogates the H2AX phosphorylation and apoptosis, they conclude that
serum starvation induces apoptosis via signaling pathway, p38/H2AX. The role of caspases is
unclear in serum starvation induced apoptosis; and the outcome depends on the cell culture
model system. Haviv et al. identifies caspase-2 as the main activator in PC-12 cells whereas
caspase-12 has an essential role in mouse AKR2-B fibroblasts (Zhu, Cowie et al. 1996;
Haviv, Lindenboim et al. 1998). On the other hand, Schamberger et al. find that caspase-8
and caspase-3 initiate apoptosis in rat 423 cells (Schamberger, Gerner et al. 2004). Taken
together, the role of caspases in apoptosis in response to serum starvation depends on the cell
culture model.
1.4. Microarray Technology:
The discovery of microarray technology is one of the biggest developments in biology
(Pease, Solas et al. 1994; Schena, Shalon et al. 1995). DNA microarrays provide an
opportunity for researchers to carry out large-scale quantitative experiments simultaneously.
28
Alterations in the expression rate of nearly all the genes in a genome, occuring in a particular
tissue or cell type, can be measured in disease states, during development, and in response to
gene disruptions or drug treatments. Profiling of gene expression patterns allow discovering
the mechanisms of disease and identifying disease subphenotypes, predicting disease
progression, providing functional information for the unannotated genes, grouping genes into
functional pathways, and estimating the activities of new compounds (Hughes, Roberts et al.
2000; Waring, Ciurlionis et al. 2001; Chuaqui, Bonner et al. 2002; Lock, Hermans et al.
2002; Ntzani and Ioannidis 2003; McMillian, Nie et al. 2004; Miklos and Maleszka 2004). In
addition to expression profiling, microarrays are designed from genome sequence itself to
discover novel genes, and binding sites of transcription factors, identify the alterations in
DNA copy number, and variations from a baseline sequence, such as in emerging strains of
pathogens or complex mutations in disease-causing human genes (Stoughton 2005). Multiple
microarray studies can also be compared using a relatively relaxed p value and higher fold
changes (Fan, Shi et al. 2009).
Besides the increased use of gene expression profiling, the analysis of such data has
serious problems (Michiels, Koscielny et al. 2005). Statistical knowledge is essential to
perform a valid analysis of microarray data, whereas there are a few statisticians familiar
with the microarray data despite the use of microarrays in many laboratories. Therefore,
biostatisticians of the Biometric Research Branch of the National Cancer Institute develop the
BRB-ArrayTools, which is non-commercial and user-friendly microarray analysis tool. In
addition to normalization of the microarray data, it has many objectives to perform further
analysis. Class comparison is one such methodology and provides the users with ability to
identify the differentially expressed genes among groups of specimens collected from
different types of tissues or under different experimental conditions. Another important
method is the class prediction. It is used to predict the class of a sample based on its
expression profile. Survival risk group prediction is the other important objectives for
standard clinical and pathological prognostic factors. In addition to these objectives, it has
many statistical tools such as cluster analysis, ANOVA, time-series analysis (Simon, Lam et
al. 2007).
29
The development of high-throughput technologies, especially microarray technologies,
provides the researchers to produce the large-scale expression datasets. This development
requires the development of bioinformatics tool to technologies to analyze tens of thousands
of genes simultaneously. WebGestalt, web-based integrated datamining system, developed by
Zhang groups is one of the essential tools to explore large gene sets. It is a user-friendly
bioinformatics tools to help the users for the management, information retrieval,
organization, visualization and statistical analysis of gene sets. It has different types of
methods such as Gene Ontology analysis, pathway analysis, and protein domain analysis
(Zhang, Kirov et al. 2005).
1.4.1. Microarray studies on nicotine-mediated signaling:
There exist a number of microarray studies focusing on different aspects of nicotine
mediated signaling both in a neuronal and non-neuronal context. For example, human
bronchial epithelial cells go through a large-scale change in their transcriptional profiles upon
exposure to 5 μM nicotine (4-10 hours) (Tsai, Chong et al. 2006). Cellular signaling
pathways responsive to nicotine include ERK and interleukin-8 signaling (Tsai, Chong et al.
2006). Saito et al. based on their study of nicotine-induced changes in brain revealed that
multiple MAPK signaling components, GABA receptors and protein phosphatases were
involved. Nicotine also acts differentially on rat brain tissues; genes affected by nicotine play
important roles in PKC, MAPK, NF-kappaB, and ubiquitin/proteosome signaling pathways
(Konu, Kane et al. 2001; Li, Konu et al. 2002; Kane, Konu et al. 2004; Saito, O'Brien et al.
2005). On the other hand, microarray studies performed using PC12 indicate that nicotine
might lead to modulation of several growth factors, heat-shock proteins, ribosomal and
proteosomal subunit expression together with mRNAs involved in mTOR signaling (Konu,
Xu et al. 2004). These studies are supportive of the findings that nicotine modulates
PI3K/AKT/PTEN/TOR signaling pathway elements. Although nicotine’s cellular effects
were studied in neuronal cell lines and tissues, no such study exists for breast cancers.
Considering that nicotine’s effects might be dependent on the state of the cells, i.e., actively

30
proliferating or growth-arrested may provide important insight into the regulation of cell
proliferation/growth related signaling pathways.

31
CHAPTER 2: MATERIALS AND METHODS
2. Materials and Methods
2.1. Materials:
General Reagents: The general laboratory chemicals were supplied from Sigma
Chemical Co. (St. Louis, USA), Merck (Darmstadt, Germany), Stratagene (Heidelberg,
Germany) and AppliChem (Darmstadt, Germany).
Proteins: Protein size marker was from MBI Fermantas (PageRuler Prestained,
SM0671).
Protein transfer materials: Immobilen P transfer (PVDF) membrane was from Roche
(Germany), and 3MM filter paper was from Whatman International Ltd. (Madison, USA).
Photography and autoradiography: The films used for autoradiography were from
KODAK (Rochester, USA) and the development of the films was performed with
Hyperprocessor (Amsderdam, UK).
Tissue reagents and cell lines: Dulbecco’s Modified Eagle’s Medium (DMEM), and
trypsin were obtained from Biochrom (UK); fetal bovine serum, penicillin/streptomycin, and
non-essential amino acid were supplied from Hyclone (Logan, USA). MCF7 is a human
breast carcinoma cell line was obtained from ATCC (HTB-22) and kindly provided by I.
Yulug, at Bilkent University, Dept. Molecular Biology and Genetics.
Kits: The RNA isolation kit was from Promega (Madison, USA; Z3100). ECL plus
western blotting reagent was from Amersham (UK; RPN2132) and SuperSignal West Femto
reagents were obtained from Perbio (UK; 34095). Vybrant MTT cell proliferation kit was
obtained from Invitrogen (USA; V13154).
Microarrays: HG-U133 plus 2 microarrays and reagents were supplied from Affymetrix
(USA).
Treatment reagents: Nicotine was supplied from Sigma (USA; 54-11-5).

32
Antibodies: p53 (BD Pharmingen, USA; 554290), calnexin (Sigma, USA; C4731)
antibodies, and anti-mouse HRP conjugated secondary antibody (Sigma, USA; A0168) were
kindly provided by M. Ozturk at Bilkent University, Dept. Molecular Biology and Genetics.
Bcl-xl (Santa Cruz, USA; sc-8396) and cyclinE (Santa Cruz, USA; sc-481) antibodies were
kindly provided by K. Can Akcali, at Bilkent University, Department of Molecular Biology
and Genetics. Anti-rabbit HRP conjugated secondary antibodies was obtained from Santa
Cruz (USA; sc-2004).
2.2. Solutions and media
2.2.1. General solutions:
10X PBS: 40 gr NaCl, 1 gr KCl, 7.2 gr Na2HPO4 and 1.2 gr KH2PO4 were dissolved in
400 ml dH2O and pH was adjusted to 7.4 with HCl. ddH2O was added to complete the final
volume 500 ml.
2 M NaCl: 58.44 gr NaCl in 500 ml dd . ddH2O.
10% SDS: 100gr SDS was dissolved n 900 ml ddH2O and heated to 68 0
C to assist
dissolution. Then, pH was adjusted to 7.2 and the final volume was completed to 1lt by
adding ddH2O.
2.2.2. Tissue culture solutions:
Growth medium: DMEM was supplemented with 10% fetal bovine serum, 1%
penicillin/streptomycin and 1% non-essential amino acids.
Starvation medium: DMEM was supplemented with 0.1% fetal bovine serum, 1%
penicillin/streptomycin and 1% non-essential amino acids.
Freezing solution: 5% DMSO and 95% growth media were mixed.
33
1XPBS: 1X PBS was prepared from 10X PBS stock solutions and pH was adjusted pH
at 7.4 followed by autoclaving and filtering before use.
Nicotine treatment solutions: 2 μl of nicotine was dissolved in 1248 μl of starvation
medium to make a 10 mM nicotine stock solution. For dilutions, a 10 μM nicotine solution
was prepared from the 10 mM Nicotine stock solution. All studies were performed in the
dark. For each experiment, 10 mM Nicotine stock solution was prepared fresh.
2.2.3. Protein Extraction and Western blotting solutions:
NP40 lysis buffer: 150 mM NaCl, 50 mM Tris.Cl at pH 8.0, 1% NP40 and 1X protease
inhibitor mix were mixed in dd H2O.
Bradford working solution: 10 mg Coomassie brilliant blue was dissolved in 5 ml
95% ethanol and 10 ml 85% phosphoric acid. ddH2O was added to complete the final volume
at 1 lt. Then, the solutions were filtered by using Whatman paper and stored at 4+ 0C in dark.
30% Acrylamide-bisacrylamide solutions: 29 gr acrylamide and 1 gr biacrylamide
were dissolved in 100 ml ddH2O and stored at 4+ 0C in the dark.
10% APS: 0.15 gr ammonium per sulfate was dissolved in 1 ml ddH2O.
1.5 Tris, pH 8.8: 54.45 gr Tris-base was dissolved in 150 ml dH2O and pH was
adjusted with 1 N HCl to 300 dH2O. It was stored at 4+ 0C.
1M Tris, pH 6.8: 12 gr Tris-base was dissolved in 60 ml dH2O and pH was adjusted
with 1 N HCl to 100 dH2O. It was stored in at 4+ 0C.
2X protein loading buffer: 50 mM Tris. HCl at pH 6.8, 2 mM EDTA at pH 6.8, 1%
SDS, 10% glycerol and 0.02% Bromophenol blue solutions.
5X Running Buffer: 15 gr Tris.base, 72 gr Glycine and 5 gr SDS were dissolved in
ddH2O and completed the final volume to 1 lt.
Semi-dry transfer buffer: 2.5 gr Glycine, 5.8 gr Tris base, 3.7 ml 10% SDS, 200 ml
MeOH were dissolved in ddH2O and completed the final volume to 1 lt.
10X TBS: 12.19 gr Tris-base and 87.76 gr NaCl were dissolved in 1 lt of ddH2O.
TBS-T: 0.1% Tween 20 was added into a 1XTBS solution and the pH was adjusted to
7.4.
34
Blocking Solution: 2.5 gr milk powder was dissolved in 50 ml 1X TBS-T (0.1%).
2.3. Laboratory Methods:
2.3.1. Tissue Culture techniques:
Growth conditions of MCF7 cell line: MCF7 breast carcinoma cell line was used as
the cell line model system. MCF7 cell line was derived from 69 year-old Caucasion female
and is a p53 positive and ER+ cell line. MCF7 cell line was maintained in Dubecco’s
Modified Eagle’s Medium (DMEM) supplemented with 10% fetal bovine serum (FBS), 1%
non-essential amino acids and 1% penicillin/streptomycin. The cells were incubated at a 370C
incubator with an atmosphere of 5% CO2 in air. The cells were passaged every 3-4 days
before reaching confluence. The growth medium was aspirated and cells were washed with
1X PBS twice; trypsinized; and were dispersed by pipetting with fresh medium before cells
were transferred to a new flask using a given set of dilutions depending on requirements.
DMEM and PBS were kept at 4 + 0C, trypsin was kept at - 20
0C. All solutions were warmed
to 370C before use.
Cryopreservation of cell lines: Exponentially growing cells were harvested by using
trypsin and neutralized by adding fresh growth medium. The cells were precipitated at 1200
rpm for 3 minutes. The cells were then re-suspended with freezing media, i.e., 5% DMSO in
growth medium. Then, cells in the freezing media were transferred into two cyrotubes and
stored at -800C overnight and then transferred to the liquid nitrogen tank for long-term
storage. To re-culture the frozen cells, they were thawed rapidly at 370C and mixed with 3 ml
growth medium; and centrifuged at 1200 rpm for 3 minutes. After removal of the
supernatant, the cells were re-suspended with fresh growth medium. Cells were grown in 75
cm2 flask in the incubator.
2.3.2. Nicotine treatment protocol:
35
Time- and dose-dependent nicotine treatment experiments: Cells were harvested by
trypsinization; neutralized by adding fresh media; and were counted. For 2 days treatment,
5000 cells/ well; for 3 days, 3000 cells/well; for 5 and 7 days, 1000 cells/well were seeded to
the 96 well-plates. There were four conditions: control (no treatment), 0.1, 1 and 10 μM
nicotine treatment and each condition consisted of 4 replicates. The cells were incubated for
24 h to attach the surface of the plate. After 24 h, the cell media were removed and cells were
incubated in the starvation media for 24 h to obtain quiescent cells. For the 10% serum
treatment, the treatment media (0.1, 1 and 10 μM nicotine in media) were prepared with
growth media and for the 0.1% serum treatment, media with 0.1% FBS were used for all
experimental groups (0.1, 1 and 10 μM nicotine in media). After obtaining quiescent cells, all
media were removed and replaced with freshly prepared treatment media for the 2 days and 3
days experiments. For 5 days and 7 days experiment, first, cells were incubated with the
treatment media for 3 days and then the media were replaced with freshly prepared treatment
media. The cells were then incubated in fresh media for 2 days (5 days experiment), or 4 days
(7 days experiment).
MTT proliferation assay: To measure the cell proliferation, Vybrant MTT cell
proliferation kit were used. 1 ml of 1X PBS was added to the each tube and mixed well. The
treatment media was removed; 100 μl of starvation medium was added to cells in each well
followed by addition of 10 μl of MTT solution. The cells were incubated for 4 h; the media
with MTT solution was removed and 100 μl DMSO was added. After 10 min of incubation,
the plates were read in Elisa-reader (Company, City) at 540 nm wavelengths. During
analysis, blank wells were used as background and an averaged blank reading value was
subtracted from the values obtained from treatment wells.
Nicotine treatment for RNA and protein experiments: Cells were harvested upon
trypsin treatment and neutralized by adding fresh media; and then counted. For the 10 %
serum conditions, 1.2 X10^6 cells were seeded to the 75 cm2 flask in growth media and were
incubated for 24 h for attachment. Then, the cells were incubated in the starvation medium
(0.1% FBS) for another 24 h. After synchronization, the treatment media were added (growth

36
media + 10% FBS for control cells or growth media + 10% FBS + 1μM nicotine) and cells
were incubated in the treatment medium for another 48 h. On the other hand, for the 0.1%
serum treatment, 2X10^6 cell were seeded to the 75 cm2 flasks and incubated in the growth
media for 24 h for attachment followed by 24 h serum starvation for obtaining quiescent
cells. The 48 h treatment medium contained growth media supplemented with 0.1% FBS, and
0 or 1 μM nicotine. Upon completion of the experiments, cells were scraped in ice-cold 1X
PBS; precipitated at 1200 rpm for 3 min; and the cell pellets were stored at -800C for further
experiments. Each experiment included 3 biological replicates for the RNA and protein
extractions.
2.3.3. RNA experiments:
Total RNA isolation: Total RNA isolation was performed using Promega SV Total
RNA isolation kit according to the manufacturer’s instructions. The RNA was eluted in a
total volume of 50 μl. The concentration of the isolated RNA and the ratio of absorbance at
260 nm to 280 nm were measured with the Nanodrop ND-1000 spectrophotometer
(NanoDrop Technologies, Montchanin, USA). If the concentration of RNA was found less
than 625 ng/μl the samples were vacuum dried to concentrate the RNA since 5 μg RNA in 8
μl was needed for the microarray experiments. The integrity of isolated RNA samples was
measured with the Agilent 2100 Bioanalyzer (Agilent Technologies, USA). Isolated RNA
samples were stored at -800C.
2.3.4. Protein experiments:
Protein extraction: The cell pellets were lysed in the NP40 lysis buffers by vortexing
every 5 min for half an hour on ice. Then, they were centrifuged at 13000 rpm for 30 min at
4+ 0C; the supernatant was collected and stored at -80
0C for Western blotting experiments.

37
Quantification of protein concentrations: The concentration of a cell lysate was
measured by Bradford assay. 2 μl of each sample or lysis buffer (for the blank) was mixed
with 98 μl of ddH2O and then 900 μl of Bradford working solution was added to the sample
and mixed well. After 5 min of incubation, the protein concentrations were measured at
OD595 nm versus the blank reagent. For the standard curve, 1 mg of BSA was measured and
dissolved in 1 ml of ddH2O. Then, 0, 1, 2, 4, 8, 16, and 32 μl of BSA solution was mixed
with 100, 99, 98, 96, 92, 84 and 68 μl of ddH2O, respectively and 900 μl of Bradford working
solution was added to the sample and mixed well. After 5 min of incubation, the OD595 nm
values were measured; and the standard curve was plotted with these values. The unknown
concentrations of the samples were calculated from the standard curve.
Western blotting:
SDS polyacrylamide gel electrophoresis: Resolving gel (12% polyacrylamide gel; 15
ml) was prepared as below:
dH2O 4.9 ml
30% Acrylamide mix 6.0 ml
1.5 M Tris, pH=8.8 3.8 ml
10% SDS 15O μl
10% APS 150 μl
TEMED 6 μl
Stacking gel (5% polyacrylamide gel; 8 ml) was prepared as below:
dH2O 5.5 ml
30% Acrylamide mix 1.3 ml
1.0 M Tris, pH=6.8 1 ml
10% SDS 80 μl
10% APS 80 μl
TEMED 8 μl
Equal amount of proteins were mixed with the 2X loading buffer containing 1% β-
mercaptoethanol and boiled for 5 min to denature the proteins. Then, the samples and the
Fermentas PageRuler Protein size marker were loaded on gel. Gels were run at 80 V for the
stacking gel and 120 V for the resolving gel in running buffer.

38
Protein transfer to solid support: Since all proteins were smaller than 120 kda, semi-
dry transfer was performed. Whatman paper and the PVDF membrane were cut at suitable
sizes. The membranes were incubated in 100% methanol for 30 seconds and then, incubated
with ddH2O for 2 min. After that, Whatman papers and membrane were incubated in the
semi-dry buffer for 5 min. Then the following arrangement shown in Figure 2.3.1 was
applied to transfer proteins.
Figure 2.3.1. The schematic representation of semi-dry transfer (Fermentas).
Immunological detection of immobilized proteins: After transfer, the membrane was
immersed in the 5% blocking solution for an hour on a slowly rotating platform to inhibit
non-specific binding. Upon blocking, the membrane was washed with TBS-T (0.1%) three
times, each for 10 min. Each antibody was diluted in the blocking solution at different
concentrations: calnexin: 1/500, Bcl-xl: 1/500, cyclin-E: 1/200 and p53: 1/1000. The
membrane was incubated with the primary antibody solutions for overnight at 4+ 0C on a
slowly rotating platform. The membrane was washed with TBS-T (0.1%) three times, each
for 10 min. The appropriate HRP-conjugated secondary antibody was diluted in blocking
solution (1:5000, as recommended by supplier). The membrane was incubated with the
secondary antibody solutions for an hour at room temperature again on a slowly rotating

39
platform; washed with TBS-T (0.1%) three times, each wash for 10 min. The membrane was
treated with ECL plus reagent (or Femto reagents depending on the protein signal) according
to the manufacturer’s instructions and then wrapped with stretch film. The autoradiography
was performed for various exposure times.
2.3.5. Microarray analysis:
Data normalization: All microarray experiments were carried out on Affymetrix U133
plus 2 GeneChips. 5 μg RNA in 8 μl was used for each sample. Amplification, labeling and
hybridizations were done under the supervision of Asssociate Prof. Işık Yuluğ by the
Genomics Core Facility assistant according to the manufacturer’s protocols. Affymetrix
analysis software (GCOS) was used to perform the preliminary probe-level quantification of
the microarray data for initial analysis including quality control. These data were further
normalized with the RMA normalization method using the BRB-Array tools, 3.7 Version.
The default option of RMA (with background correction, quantile normalization, and log
transformation) was used to generate the normalized intensity for each probeset. Quality
control of the arrays were performed using an option in BRB-Array tools, which provide
measurements on the RNA degradation parameters, and factors such as scaling factor and
background.
Selection of differentially expressed genes: Differentially expressed genes were
identified at each time point separately using the untreated 0.1% serum or 10% serum
controls against 0.1% serum 1 μM nicotine-treated samples or 10% serum 1 μM nicotine-
treated samples, respectively. To find the differentially expressed genes, BRB-Array Tools
were used for all analysis. A 1.2 fold change was used as the cut-off for 10% serum
experiment analysis. Unpaired-class comparison analysis with/without blocking batch effect
(i.e., different days of hybridization) were performed at the p<0.05. After that, the common
probe ID’s to both paired and unpaired class comparisons were used for further analysis.

40
Due to presence of a single replica of each condition in the 0.1% serum treatment
experiment, a 1.5 fold change value was used as the cut-off to determine a potential list of
differentially expressed genes. On the other hand, when comparing the gene expression of
10% serum control samples to the 0.1% serum control or to the 1 μM nicotine-treated
samples, this probeset list from the 0.1% serum analysis was used as a focused gene-set.
Focused gene sets have been frequently used in microarray meta-analysis to test the change
of expression for a given set of genes, which may be unique to a biological process or altered
under a particular treatment. Then, these probesets were separated into two groups: 1) probes
whose expression in response to 0.1% serum 1 μM nicotine-treatment with similarities to
those from 10% serum control samples rather to the 0.1% serum control samples; and 2)
probes whose expression in response to 0.1% serum 1 μM nicotin-treatment behaved unlike
of the 10% serum control samples.
Gene Ontology (GO) Analysis: After determining the differentially expressed
probesets, the GO analysis was performed to find the biological processes that were altered
via nicotine treatment and to assign potential function to the probesets differentially
expressed. To perform the GO analysis, Webgstalt (WEB-based GEne SeT AnaLysis
Toolkit; http://bioinfo.vanderbilt.edu/webgestalt) was used. When performing the GO
analysis, hyper-geometric tests were used at p<0.05 and presence of two genes in each
category was selected as a minimum requirement. GO levels 4, 5 or 6 were chosen for the
biological level and molecular functions graphics. If the groups were significant according to
selected criteria, the significant categories were shown in red color. In addition to GO
analysis, Biocarta and KEGG pathway analyses were performed using similar protocols.
Cluster analysis: Cluster analysis is commonly used to identify the degree of
association between objects. If the degree of association is high between the objects, they are
put into the same group, and if the degree of association is low between the objects, they are
categorized separately. During the cluster analysis, median gene centering was used before
hierarchical clustering: Genes and arrays were clustered; un-centered correlation coefficient
was calculated to find the similarity matrix; and finally, average linkage method was chosen
for the analysis. Cluster analysis was performed using the Cluster 3.0 software program and
the image analysis was done by using Java TreeView software (Saldanha 2004).
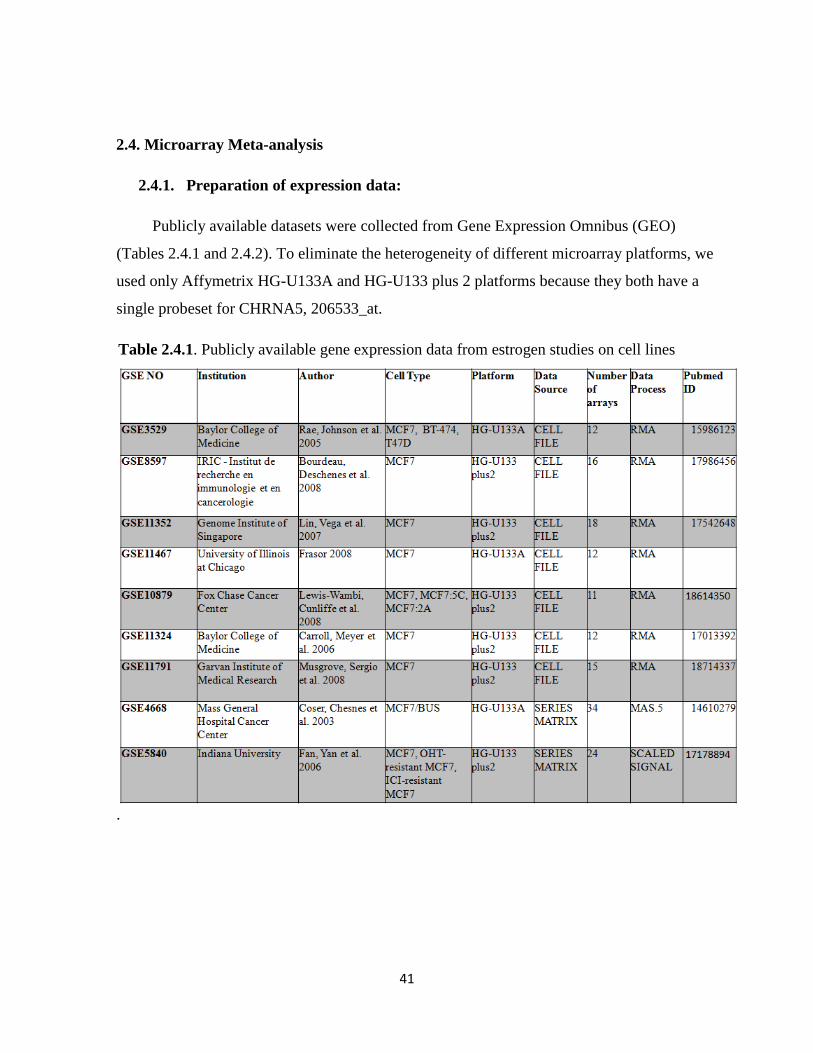
41
2.4. Microarray Meta-analysis
2.4.1. Preparation of expression data:
Publicly available datasets were collected from Gene Expression Omnibus (GEO)
(Tables 2.4.1 and 2.4.2). To eliminate the heterogeneity of different microarray platforms, we
used only Affymetrix HG-U133A and HG-U133 plus 2 platforms because they both have a
single probeset for CHRNA5, 206533_at.
Table 2.4.1. Publicly available gene expression data from estrogen studies on cell lines
.
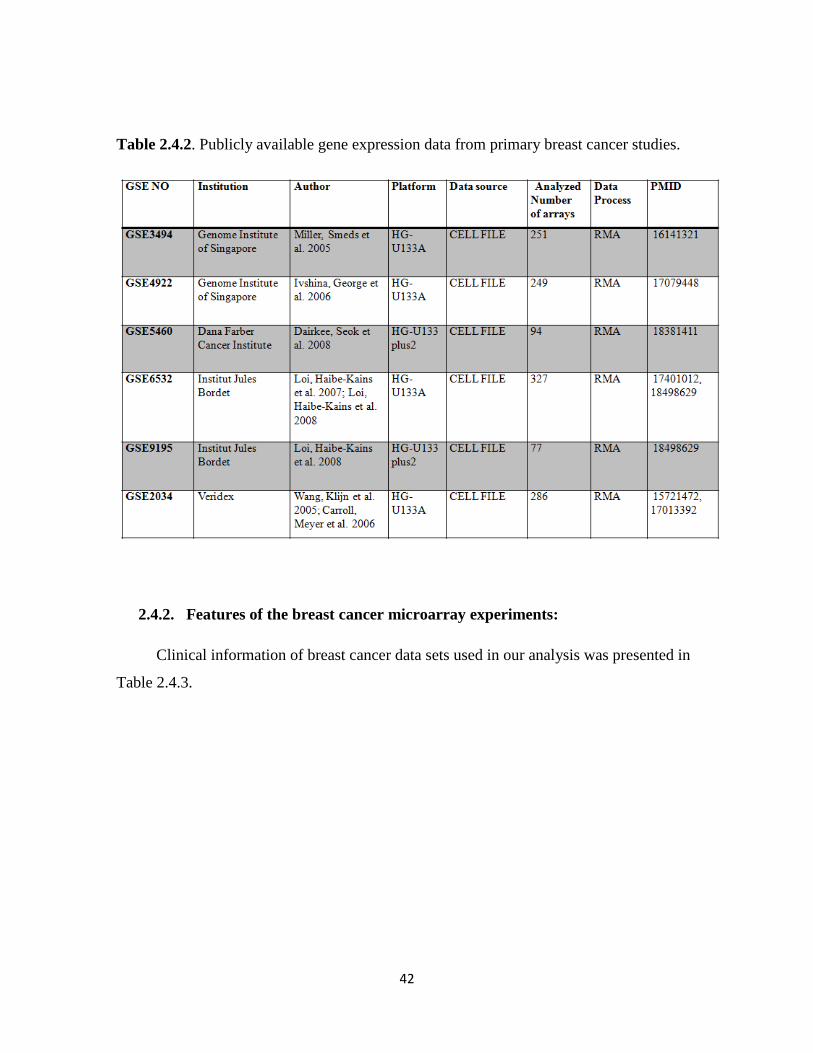
42
Table 2.4.2. Publicly available gene expression data from primary breast cancer studies.
2.4.2. Features of the breast cancer microarray experiments:
Clinical information of breast cancer data sets used in our analysis was presented in
Table 2.4.3.

43
Table 2.4.3. The distribution of data according to ER, grade and treatment status.
Some datasets from GEO or arrays from the datasets were not analyzed herein for the
following reasons indicated below:
GSE1456 performed by Pawitan et al. was eliminated because it did not have
information about the samples either from untreated or treated patients (Pawitan, Bjohle et al.
2004).
GSE6532 Loi et al. had 741 arrays in three different platforms: HG-U133A, B and
plus 2. Due to the absence of probeset for CHRNA5, data performed in HG-U133B was not
analyzed. Dataset performed in HG-U133 plus2 was from ER+ Tamoxifen treated patients.
Data was analyzed but the average absolute expression value of CHRNA5 was lower than 16,
which is not detectable by PCR, so it was not included in our analysis (Loi, Haibe-Kains et
al. 2007; Loi, Haibe-Kains et al. 2008).
44
GSE4922 Ivshina et al. had 578 arrays performed in two different platforms: HG-
U133A and HG-U133B. Similar to GSE6532, the dataset in HG-U133B was not analyzed.
On the other hand, NUH-sample series were eliminated due to the absence of information
about ER status and treatment (Ivshina, George et al. 2006).
GSE5460 Darkee et al. had 129 arrays but 35 arrays could not read from BRB-
ArrayTool. Therefore, the analysis was performed with only 94 arrays (Dairkee, Seok et al.
2008).
2.4.3. Experimental features of the in vitro public microarray experiments:
GSE3529: Three different ER-α positive estrogen dependent MCF7, T47D and BT-474
breast cancer cell lines were used. Before the estrogen treatment, cells were washed and
grown in steroid depleted phenol red-free IMEM media supplemented with 10% charcoal
stripped FBS for three days. After that, cells were treated with E2 for 24 hours (Rae, Johnson
et al. 2005).
GSE11791: MCF7 cells were grown in media supplemented with 10 nM ICI 182780
for 48 hours before the treatment. Then, cells were treated for 6h with either 100 nM E2 or
ethanol vehicle. As in the GSE11467, this data set contains different treatments in addition to
E2, which were eliminated from further analysis in the present study (Musgrove, Sergio et al.
2008).
GSE4668: MCF7/BUS cells were maintained in DMEM supplemented with 5%FBS.
Before the treatment, cells were washed three times with phenol red-free DMEM
supplemented with 5% charcoal-dextran stripped FBS and then grown in the presence of
varying concentrations of E2 (0 pM, 10 pM, 30 pM, 60 pM, and 100 pM) for 48 hours. In
another experiment, MCF7/BUS cells were subjected to hormone starvation for 0, 1 or 2 days
(Coser, Chesnes et al. 2003).
GSE11324: MCF7 cells were grown in a hormone-deprived media for 24 hours before
the treatment. Then, cells were stimulated with 100 nM estrogen for 0, 3, 6 or 12 hours
(Carroll, Meyer et al. 2006).

45
GSE11352: MCF-7 cells were grown to 80% confluence in D-MEM/F-12
supplemented with 10% FBS. Cells were switched to phenol red-free D-MEM/F-12 medium
supplemented with 0.5% charcoal-dextran stripped FBS for 24 h before the 10nM 17β-
estradiol (E2) was provided for 12, 24 and 48 hours in a time-course treatment (Lin, Vega et
al. 2007).
GSE8597: MCF-7 breast carcinoma cells were maintained in a-minimal Eagle’s
medium (a-MEM) supplemented with 10% fetal bovine serum (FBS). Before the treatment,
cells were grown in phenol red-free Dulbecco’s modified Eagle’s medium (DMEM)
containing 10% charcoal-treated FBS, 1% sodium pyruvate, 1% penicillin/streptomycin and
1%L-glutamine for 3 days. The day before hormonal stimulation, the medium was switched
to phenol red-free DMEM supplemented with 0.5% charcoal-treated FBS. Pretreatments
cycloheximide (10 mg/ml, Sigma) were started 1 h before hormonal treatment with/without
17b-estradiol (E2, 25 nM, Sigma), or vehicle (0.1% ethanol). Treatments were done for 24
hours (Bourdeau, Deschenes et al. 2008).
GSE11467: MCF-7 cells were treated with 10 nM E2, 10 ng/ml TNFa, or both for 2h.
Before analysis, the TNF-α with/without E2 treated samples were eliminated. E2 treated and
control samples were used (Frasor 2008).
GSE5840: Establishment of tamoxifen-(OHT-resistant-MCF7) and fulvestrant-(ICI-
resistant MCF7) resistant sublines: Three different media were used: a growth medium, a
hormone-free medium, and a basal medium. Figure 2.4.1 shows how to establish these
sublines. Wild-type MCF7 cells maintain were in the growth medium. OHT- resistant MCF7
cells were maintained in hormone-free medium supplemented with 10-7
mol/L OHT to
establish the tamoxifen-resistant subline, designated as MCF7-T. Finally, ICI-resistant cells
were maintained in the hormone-free medium supplemented with 10-7
mol/L fulvestrant to
establish the resistant subline, namely MCF7-F. Cells were continuously cultured under these
conditions for 12 months (Fan, Yan et al. 2006).

46
Figure 2.4.1. Establishment of OHT-resistant, ICI-resistant MCF7 cells and maintenance of
wild-type MCF7 cells (Fan, Yan et al. 2006).
GSE10879: Wild-type MCF7 cell and long-term estrogen deprived MCF-7:5C and
MCF-7:2A breast cancer cells lines (which are resistant to estrogen-deprivation; aromatase
inhibitor resistant) were used. These cells were grown in estrogen-free media (phenol red-
free RPMI medium supplemented with 10% 4X dextran-coated charcoal-treated fetal bovine
serum) until they were 70-80% confluent. In the result part, more information about
MCF7:5C and MCF7:2A will be given (Lewis-Wambi, Cunliffe et al. 2008).
2.4.4. Microarray analysis:
GEO datasets to be used in the study were divided into two groups, one dealing with
cell line studies, the other with primary human breast tumors (Tables above, Table 2.4.1.1
and 2.4.1.2). Furthermore, the datasets were normalized with RMA using BRB-tool which

47
uses Bioconductor R packages when raw .cel files were available, if unavailable, the series
matrix files were used and global median normalization was performed over the normalized
data for each GSM, separately.
2.4.5. Analysis of Data:
After the normalization step, class comparison analysis with random variance was
performed by using the BRB-tool (Simon, Lam et al. 2007) and the expression value of
CHRNA5 was exported from BRB Array Tools. In in vitro studies, student’s t tests were
used to calculate the level of differential expression at each treatment relative to the control.
In addition, one-way ANOVA and Fisher’s exact test was applied to suitable datasets
(Minitab 15). On the other hand, in breast cancer tumor studies, first, box-plots of samples
were performed to determine the outliers with expression values greater than 1.5 times the
interquartile range (IQR) away from the top or bottom of the box. In general, the fold-change
was not higher than 1.5 but outliers were 2-4 fold higher expression than the control
conditions. Therefore, the outliers were eliminated. Then, a t-test was used to calculate the
level of differential expression at each condition relative to the control condition. In ER
status studies (GSE3494, GSE5460, GSE2034, GSE6532 and GSE4922), the mean value of
ER+ samples was assumed as control samples, mean value was equalized to one and the fold-
change difference was calculated. In grade, studies involving grade with ER status, and the
therapy status, grade 1, ER+ grade 1 and untreated (ER+) grade 1 were assumed as the
control samples and a similar method in ER+ study was used to find the fold changes.
2.4.6. Regression Analysis:
Regression analysis is a commonly used statistical tool to explore the relationships
between variables. In our analysis, to determine the dose and time effects of estrogen,
regression analysis of GSE4668, GSE11324 and GSE11352 was performed. GSE4668 was

48
divided into two groups i.e., dose-dependent and time-dependent hormone starvation.
Polynomial regression analysis was performed via Minitab 15 for these data analyses. On the
other hand, linear regression analysis was performed for GSE11324 and GSE11352 datasets.
2.4.7. Analysis of Co-expressed Genes:
Probesets correlated positively or negatively with CHRNA5 at r = 0.7 were identified
from GSE8597, GSE11352, GSE11324, GSE11791, GSE4668 and GSE5840, individually.
GSE3529 and GSE11467 were not involved in these analysis because GSE3529 consisted of
three different cell lines and CHRNA5 was not altered in GSE11467 due to the short-time
estrogen exposure. After correlation analysis, the common probes were determined from
these data via BRB ArrayTool intersect genelist objectives. After determining the correlated
genes, GO analysis and pathway analysis were performed using Webgstalt. On the other
hand, Binary Tree class prediction analysis was performed via K-nearest neighbours (k= 3)
method, under p<0.05 to investigate the prediction ability of this genelist in terms of ER
status and grade status.
2.5. Statistical Analysis of Cell Proliferation:
In MTT assay, the significance of each treatment compared with the control was
calculated with ANOVA followed by Fisher’s Multiple Comparisons (Minitab 15).

49
CHAPTER 3: AIMS AND STRATEGY
Breast cancers commonly occur in women from multiple genetic and sporadic
backgrounds. Recent high-throughput studies revealed that the disease is heterogeneous, and
is associated with multiple risk factors one of which is smoking. However, the association
between smoking and breast cancer is not investigated in detail; furthermore it is
controversial. On the other hand, recent studies implicated nicotine, an agonist of nicotinic
acetylcholine receptors, with increased proliferation, anti-apoptosis, angiogenesis, and
metastasis, yet mostly in lung cancers. Recent studies also focus on gene expression profiling
of these cholinergic receptors, as well as on mechanisms through with the receptors act on
signaling pathways, including PI, MAPK, RAF1, and others. Most recently, CHRNA5, the
nicotinic acetylcholine subunit alpha 5 have been associated with nicotine addiction as well
as cancer development and became the focus in the field. However, the molecular effects of
nicotine on breast cancer cells under starvation or the expression of cholinergic receptors
and/or association of these with breast cancer are not clear or well studied to our knowledge.
Microarray technologies allow for characterization of the whole transcriptome under specific
treatments and conditions. Nicotine treatment has been studied in the context of neuronal cell
line and bronchial epithelial cells, however, breast cancer cell lines have not been studied in
this context; and we do not have any insight into the global regulation of transcription in
breast cancer cells when exposed to physiological concentrations of nicotine (in the range of
90nM-1μM).
Accordingly, our aim was to determine the proliferation and apoptotic response to
different doses of nicotine at different exposure times using cellular assays and molecular
markers. We also induced serum starvation stress to assess whether nicotine exposure was
able to rescue cells from growth arrest/apoptosis. Furthermore, we used microarrays to
profile expression under 1 uM nicotine treatment with or without serum to identify a set of
differentially expressed genes and to characterize generalized pathways involved in
nicotine’s effects on MCF7 breast cancer cells. Furthermore, we performed a large scale
meta-analysis of existing publicly available microarray datasets (in vitro and in vivo)
obtained from GEO, to assess the involvement of estrogen, estrogen receptor status, and

50
estrogen signaling on expression of CHRNA5, a gene recently identified as important in
nicotine addiction and lung cancer. Our aim was to predict the estrogen receptor and grade
status of primary breast tumors using CHRNA5 and its correlated partners, as the candidate
gene-list.
In summary, in the present thesis, I have tried to answer the following questions using
cell culture, microarray technology, statistics, and meta-analysis methods:
1) Does nicotine dose- and time-dependently affect MCF7 cell line proliferative and
apoptotic status?
2) What is the extent of transcriptional modulation by 1 μM nicotine for 2 days at
10% and 0.1% serum conditions?
3) What signaling pathways and Gene Ontologies, the differentially expressed genes
belong to for giving insights into further research with nicotine on breast cancers?
4) Is CHRNA5 expressed in ER+ and ER- breast cancer cell lines and tumors
differentially?
5) Is tamoxifen effective on CHRNA5 expression?
6) Is CHRNA5 expressed in Grade I, Grade II, and Grade III breast tumors,
differentially?
7) Do CHRNA5 and its correlated gene set module obtained from in vitro microarray
studies accurately predict primary tumor ER and Grade status?

51
CHAPTER 4: RESULTS
4.1. Nicotine-mediated Signaling Pathways via Microarray Experiments in MCF7 Cell
Line
4.1.1. The dose-and time-dependent effect of nicotine on breast cancer cell
proliferation:
Nicotine promotes the cell growth in different cancers such as lung, gastric and colon
cancer (Heeschen, Jang et al. 2001; Trombino, Cesario et al. 2004; Ye, Liu et al. 2004; Shin
and Cho 2005). To investigate the effect of nicotine on breast cancer cells, we treated the
MCF7 cells with different doses of nicotine for different periods of exposure times: 0.1, 1
and 10 μM for 2, 3, 5 and 7 days. Each MTT assay was performed once or twice and a
representative set was shown in Figure 4.1.1 for each condition. We showed that nicotine did
not promote the MCF7 cells proliferation/growth in a either dose-dependent or time-
dependent manner in the presence of 10% serum although 3 days treatment exhibited a
slightly significant decrease.

52
Figure 4.1.1. Time- and dose-dependent effects of nicotine treatment on MCF7 cell
proliferation/growth at 10% serum. MCF7 cells were treated with different dose of nicotine:
0.1, 1 and 10 μM for 2, 3, 5 or 7 days. A) 2 days; B) 3 days; C) 5 days; D) 7 days. * indicates
p<0.05 determined by one-way ANOVA.
In complete media condition, nicotine may not assert its growth promotion. Therefore,
to further examine growth promotion effect, MCF7 cells were treated with nicotine under
serum-starved conditions (0.1% serum in medium) in same doses and for the same periods.
Each MTT assay was performed once or twice and results in the Figure 4.1.2.A, B and C
included a representative set. On the other hand, due to the high variability in one of the day
7 experiment sets, the set demonstrating significance at 1μM nicotine treatment was shown
(Figure 4.1.2.D). Like before, as in the Figure 4.1.2 A and B, either 2 days or 3 days
treatment with nicotine did not induce cell growth. On the other hand, at day 5 (Fig. 4.1.2 C),
nicotine significantly increased the cell growth at all doses, similarly. At day 7, nicotine
significantly increased cell growth at 1 μM concentration (Fig. 4.1.2 D). These results
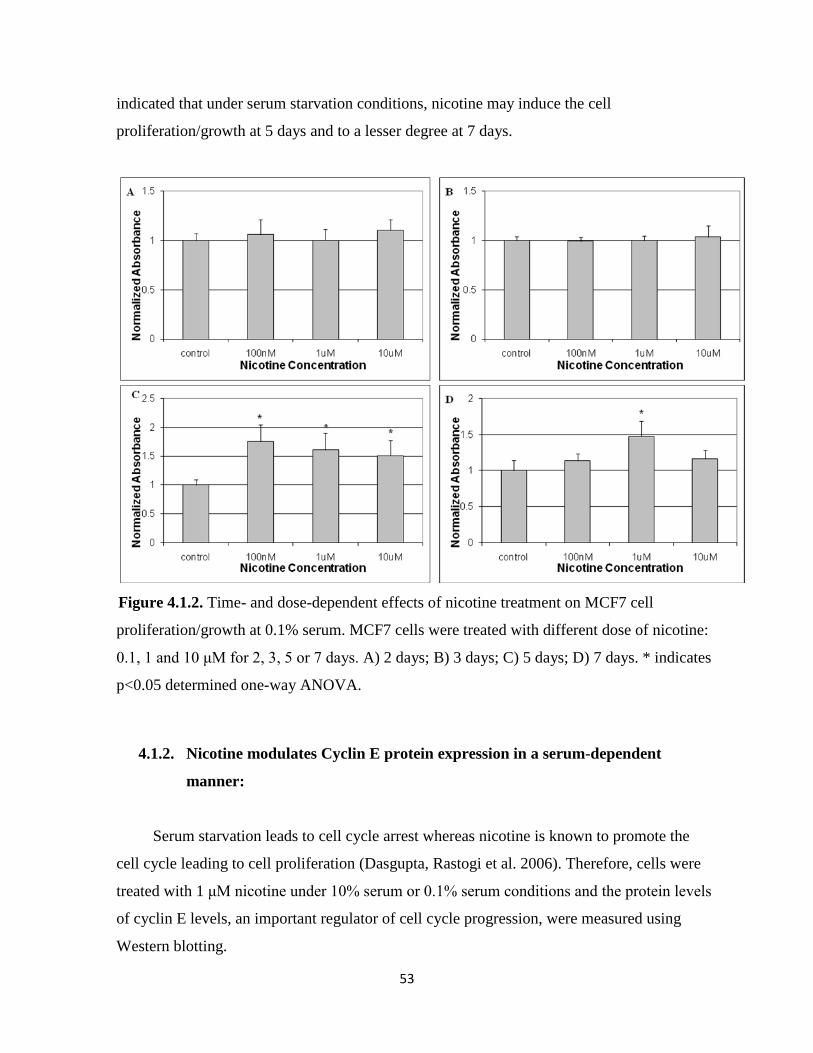
53
indicated that under serum starvation conditions, nicotine may induce the cell
proliferation/growth at 5 days and to a lesser degree at 7 days.
Figure 4.1.2. Time- and dose-dependent effects of nicotine treatment on MCF7 cell
proliferation/growth at 0.1% serum. MCF7 cells were treated with different dose of nicotine:
0.1, 1 and 10 μM for 2, 3, 5 or 7 days. A) 2 days; B) 3 days; C) 5 days; D) 7 days. * indicates
p<0.05 determined one-way ANOVA.
4.1.2. Nicotine modulates Cyclin E protein expression in a serum-dependent
manner:
Serum starvation leads to cell cycle arrest whereas nicotine is known to promote the
cell cycle leading to cell proliferation (Dasgupta, Rastogi et al. 2006). Therefore, cells were
treated with 1 μM nicotine under 10% serum or 0.1% serum conditions and the protein levels
of cyclin E levels, an important regulator of cell cycle progression, were measured using
Western blotting.
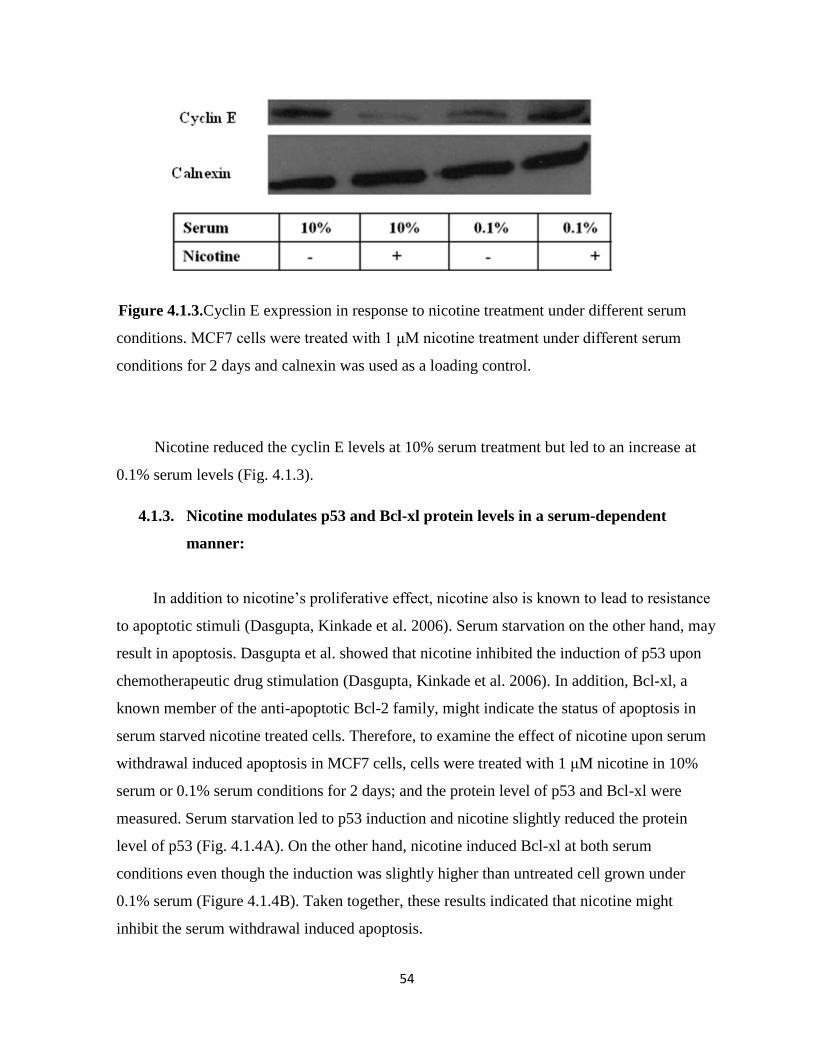
54
Figure 4.1.3.Cyclin E expression in response to nicotine treatment under different serum
conditions. MCF7 cells were treated with 1 μM nicotine treatment under different serum
conditions for 2 days and calnexin was used as a loading control.
Nicotine reduced the cyclin E levels at 10% serum treatment but led to an increase at
0.1% serum levels (Fig. 4.1.3).
4.1.3. Nicotine modulates p53 and Bcl-xl protein levels in a serum-dependent
manner:
In addition to nicotine’s proliferative effect, nicotine also is known to lead to resistance
to apoptotic stimuli (Dasgupta, Kinkade et al. 2006). Serum starvation on the other hand, may
result in apoptosis. Dasgupta et al. showed that nicotine inhibited the induction of p53 upon
chemotherapeutic drug stimulation (Dasgupta, Kinkade et al. 2006). In addition, Bcl-xl, a
known member of the anti-apoptotic Bcl-2 family, might indicate the status of apoptosis in
serum starved nicotine treated cells. Therefore, to examine the effect of nicotine upon serum
withdrawal induced apoptosis in MCF7 cells, cells were treated with 1 μM nicotine in 10%
serum or 0.1% serum conditions for 2 days; and the protein level of p53 and Bcl-xl were
measured. Serum starvation led to p53 induction and nicotine slightly reduced the protein
level of p53 (Fig. 4.1.4A). On the other hand, nicotine induced Bcl-xl at both serum
conditions even though the induction was slightly higher than untreated cell grown under
0.1% serum (Figure 4.1.4B). Taken together, these results indicated that nicotine might
inhibit the serum withdrawal induced apoptosis.

55
Figure 4.1.4. The anti-apoptotic effects of nicotine under different serum conditions. A) p53
B) Bcl-xl. MCF7 cells were treated with 1 μM nicotine treatment under different serum
conditions for 2 days and calnexin was used as a loading control.
4.1.4. Genome-wide profiling of nicotine exposure in MCF7 cells:
It was observed that 1 μM nicotine treatment was statistically significant at both the 5
days and 7 days treatment for recovery of the cell growth (Fig 4.1.2 C and D). Furthermore,
reports indicated that 1μM nicotine closely mimics the physiological concentration of
nicotine in the blood of smokers (Chu, Guo et al. 2005). Accordingly, 1 μM nicotine was
chosen as the dose to profile expression in MCF7. In addition, we wanted to examine the
relatively early effects of nicotine in breast cancer. Accordingly, medium supplemented with
10% serum as physiological conditions and the media supplemented with 0.1% serum as
serum-starved conditions were studied with or without nicotine exposure for 2 days.

56
4.1.5. RNA and Microarray data quality assessment:
Testing of the purity and integrity of the RNA is the most crucial step to obtain high
quality microarray datasets. Therefore, RIN (RNA integrity number) values of samples were
measured using BioAnalyzer before microarrays were hybridized (Fig. 4.1.5).
Figure 4.1.5. RNA integrity graphs of microarray samples. A and B represent samples
grown in media with 0.1% serum. C, D, E, and F represent samples grown in media
supplemented with 10% serum. A, C and E are the control samples whereas B, D and F are
the 1μM nicotine treated samples.
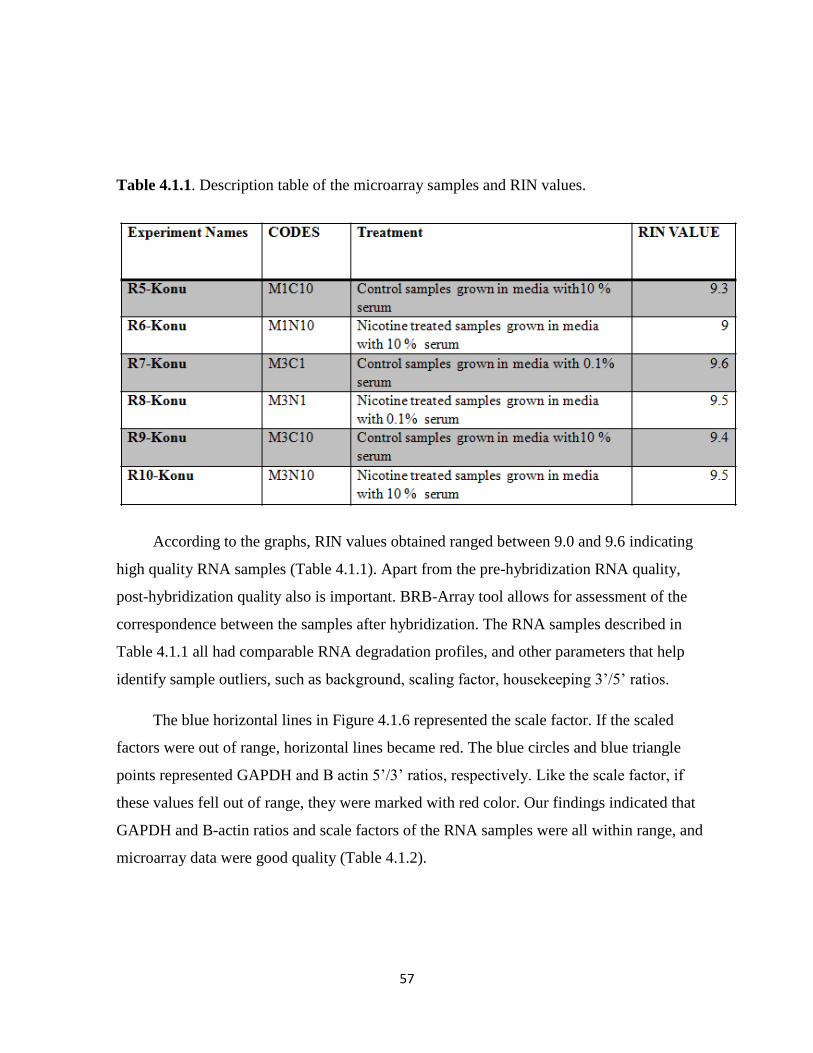
57
Table 4.1.1. Description table of the microarray samples and RIN values.
According to the graphs, RIN values obtained ranged between 9.0 and 9.6 indicating
high quality RNA samples (Table 4.1.1). Apart from the pre-hybridization RNA quality,
post-hybridization quality also is important. BRB-Array tool allows for assessment of the
correspondence between the samples after hybridization. The RNA samples described in
Table 4.1.1 all had comparable RNA degradation profiles, and other parameters that help
identify sample outliers, such as background, scaling factor, housekeeping 3’/5’ ratios.
The blue horizontal lines in Figure 4.1.6 represented the scale factor. If the scaled
factors were out of range, horizontal lines became red. The blue circles and blue triangle
points represented GAPDH and B actin 5’/3’ ratios, respectively. Like the scale factor, if
these values fell out of range, they were marked with red color. Our findings indicated that
GAPDH and B-actin ratios and scale factors of the RNA samples were all within range, and
microarray data were good quality (Table 4.1.2).
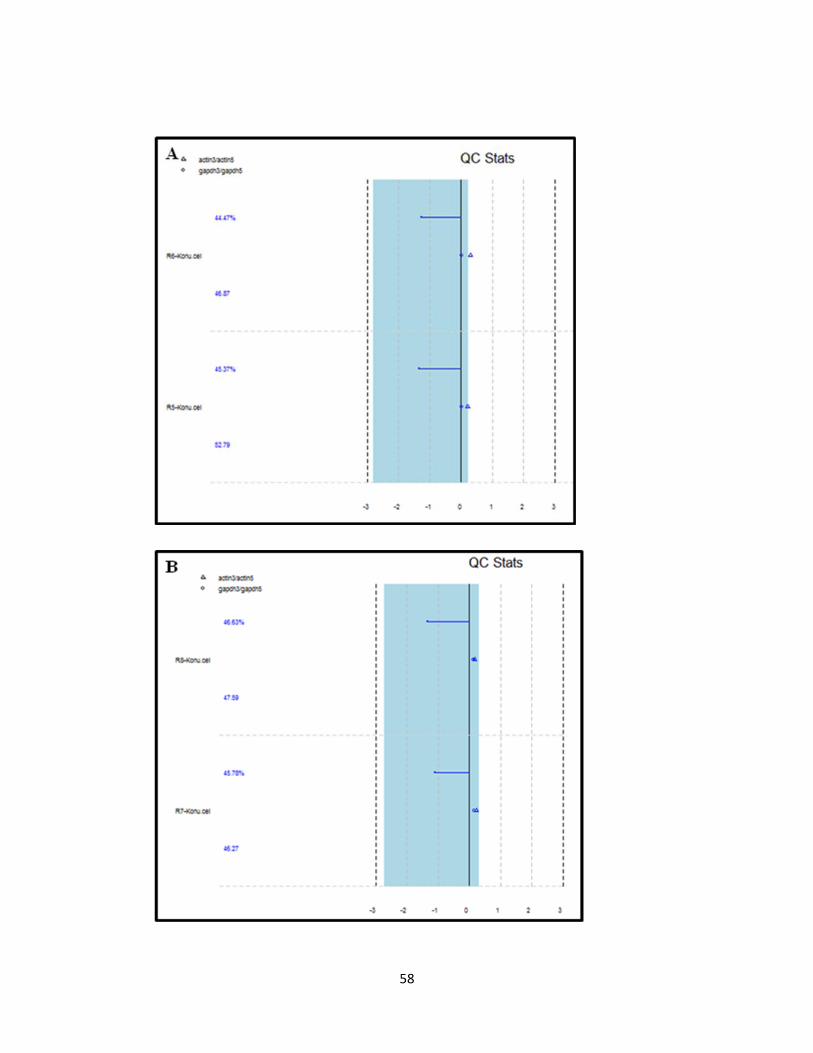
58
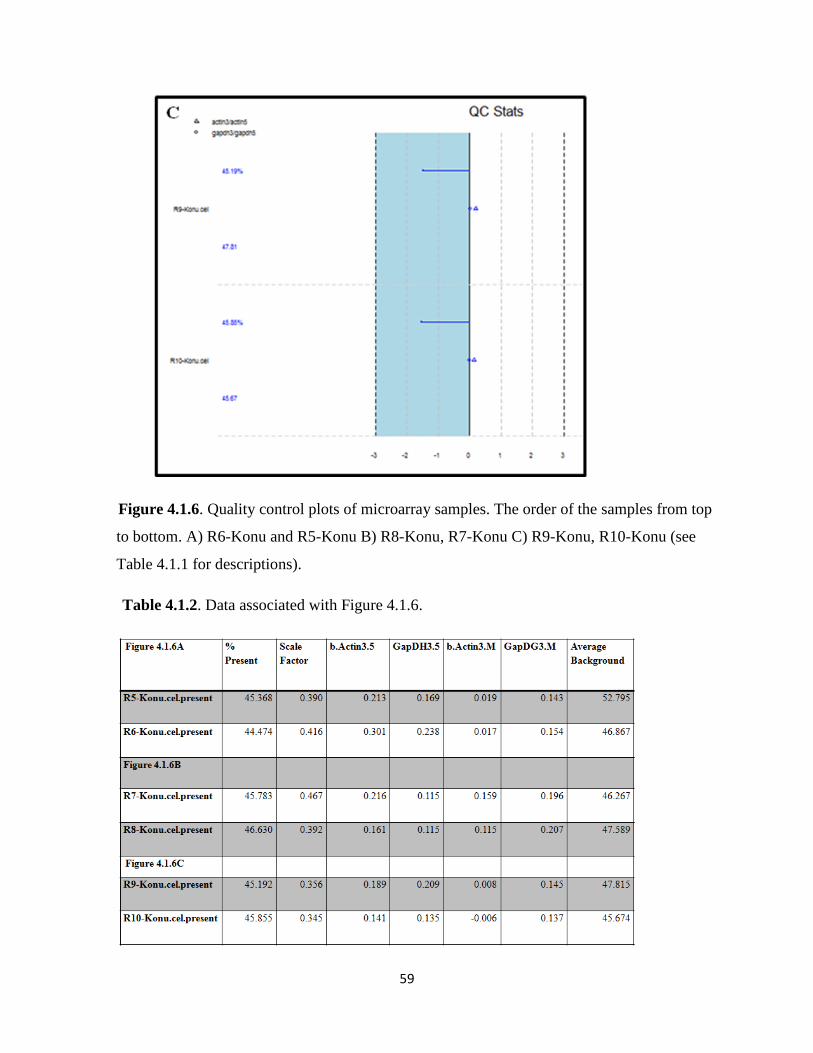
59
Figure 4.1.6. Quality control plots of microarray samples. The order of the samples from top
to bottom. A) R6-Konu and R5-Konu B) R8-Konu, R7-Konu C) R9-Konu, R10-Konu (see
Table 4.1.1 for descriptions).
Table 4.1.2. Data associated with Figure 4.1.6.

60
Figure 4.1.7. RNA degradation plots of microarray experiments. A) R5-R6 B) R7-8
C) R9-R10

61
RNA degradation graphs indicated that all samples had similar slopes (Fig. 4.1.7)
indicating they were comparable. Accordingly, all these data demonstrated that microarray
experiments were highly qualified for further data analysis.
4.1.6. Nicotine’s effect on MCF7 transcriptome under the physiological serum
conditions:
To examine the acute effects of nicotine in 10% serum treated MCF7 cells, we
performed microarray experiment with RNA samples obtained from MCF7 cells treated with
1 μM nicotine for 2 days. Before determining the differentially expressed genes, whole
genome expression was visualized using a scatter plot between control and nicotine-treated
samples (2 replicates, each) in order to visualize the expression changes at the global level
with a threshold of 2-fold change (Figure 4.1.8). Our findings indicated that there were very
few number of probesets with altered expressions greater than 2 fold suggesting that
nicotine’s effects at the given concentration is mild.

62
Figure 4.1.8. Scatter plot of probesets with or without nicotine treatment in 10% serum
conditions.
A 1.2 fold change cut-off was used to determine the differentially expressed genes since
nicotine altered gene expression to a limited degree. To associate probesets above the
threshold with significance between group means, a class comparison analysis was performed
yielding 1345 probesets. GO (Gene Ontology) analysis performed using the WebsGestalt
bioinformatics tools helped characterize the functional effect of nicotine effect on whole
genome. In Figure 4.1.9, overrepresented biological processes or molecular functions that
were shown in red color were obtained based on hypergeometric tests implicating functions
potentially altered by nicotine treatment. Accordingly, nicotine altered different biological
functions such as cell adhesion, cell growth, cell death, cell proliferation and differentiation
which are also important processes for cancer development. In addition, Figure 4.1.9B
indicated that nicotine regulated DNA binding, enzyme binding, correpressor activity and
protein dimerization activities.

63
Apart from the functional analysis, KEGG and Biocarta pathway analyses were
performed to detect nicotine’s effect on signaling pathways. Again, WebGestalt
bioinformatics tools and hypergeometric tests were used to find the significant pathways. The
significant pathways were represented in Table 4.1.3.

64
A

65

66
B
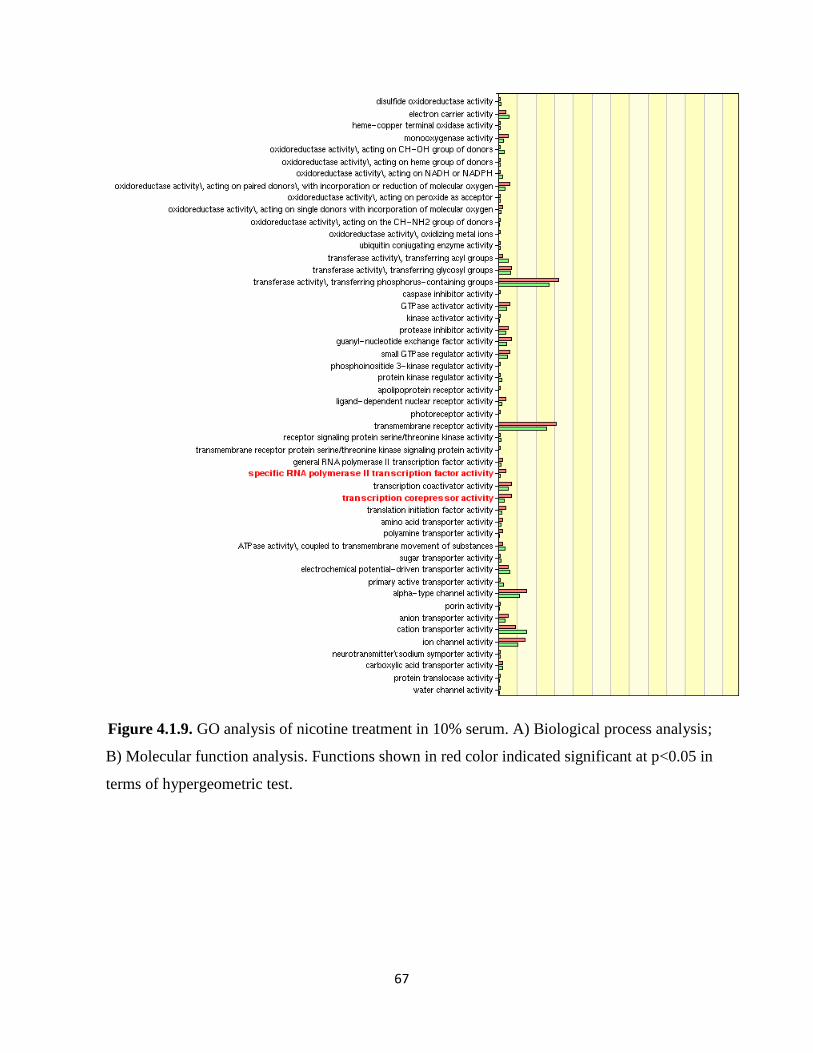
67
Figure 4.1.9. GO analysis of nicotine treatment in 10% serum. A) Biological process analysis;
B) Molecular function analysis. Functions shown in red color indicated significant at p<0.05 in
terms of hypergeometric test.

68
Table 4.1.3. Pathway analysis of nicotine treatment in 10% serum

69
.
Phosphatases in MAPKinase pathway and caspase cascade activity in apoptosis from
the Biocarta pathway analysis, and the focal adhesion and colorectal cancer pathway in the
KEGG pathway analysis were the most interesting functional groups. These pathways play
key roles in cancer, and some of which have been previously been associated with nicotine
exposure. Thus, these results demonstrated that nicotine might alter the gene expression,
although through mild changes in genes that have a role in cancer development.
4.1.7. Preliminary analyses of MCF7 transcriptome under serum starvation and
nicotine treatment:
MTT assays indicated that nicotine promoted the growth of MCF7 cells under serum-
starved conditions. Therefore, we decided to assess the acute effect of nicotine on MCF7
cells in serum-starved conditions, i.e., 0.1% FBS with or without 1 μM nicotine treated for 2
days.
Scatter plot analysis of nicotine treated samples in comparison with control samples
under 0.1% serum starvation conditions provided a generalized information on the extent of
modulation under the treatment conditions. Similar to experiments in 10% serum condition, a
small number of probesets exhibited more than 2-fold changes; yet the magnitude of
modulation was greater than the experiments performed with 10% serum (Figure 4.1.10).
Since there was only one replica for each experiment in 0.1% serum control and nicotine
groups, a 1.5 fold-change was used to find a potential set of differentially expressed
probesets in response to nicotine treatment under serum starvation. Based on this filtering
criterion, there were 630 probesets that were altered in response to 1 μM nicotine. GO
analysis via WebGestalt bioinformatics tools was performed to identify biological processes
altered in response to treatment (Figure 4.1.11).

70
Figure 4.1.10. Scatter plot of probesets with or without nicotine treatment in 0.1% serum
conditions.
Figure 4.1.11A indicated that probesets functioning in notch signaling, protein kinase
pathway, stress activated protein kinase signaling pathway, positive regulation of signal
transduction, regulation of IκB kinase/ NFκB cascade, apoptosis, regulation of program cell
death, negative regulation of progression through cell cycle and others were significantly
altered by nicotine treatment under serum starvation. These genes had different molecular
functions such as magnesium binding, tubulin binding, phosphatase binding, SH3 domain
binding, phosphotransferase activity, amino-acid polyamine transpoter activity and others
(Fig. 4.1.11B).
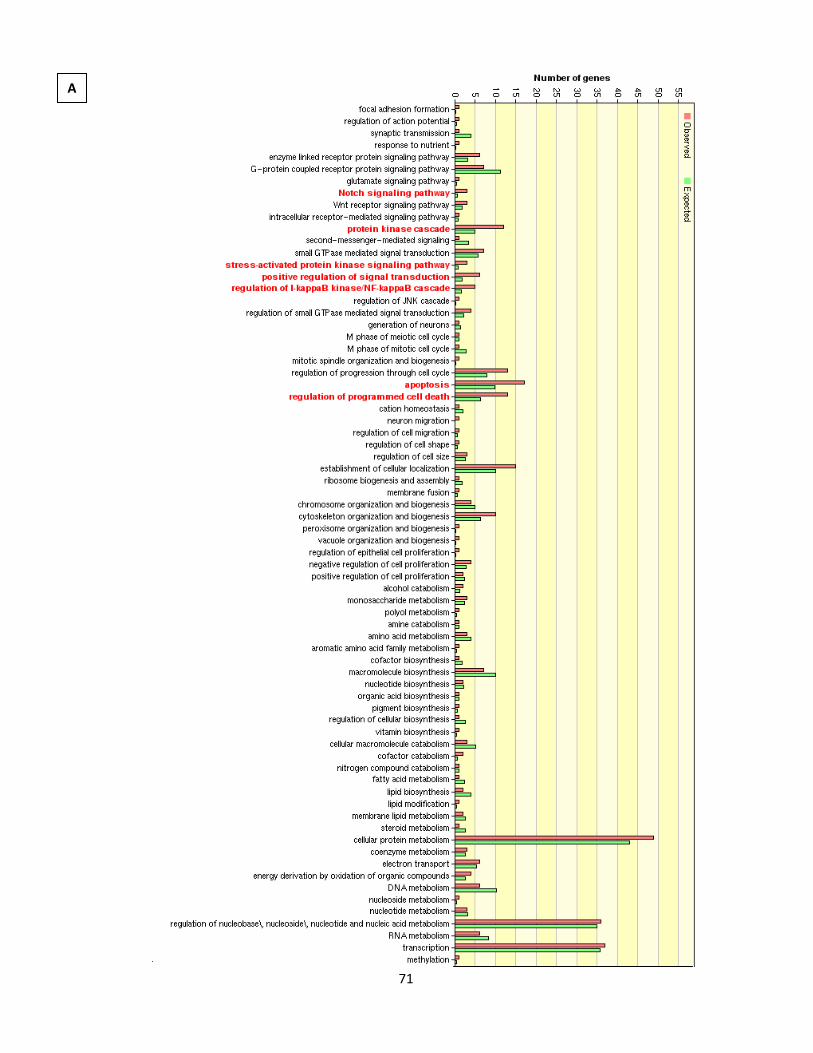
71
A

72
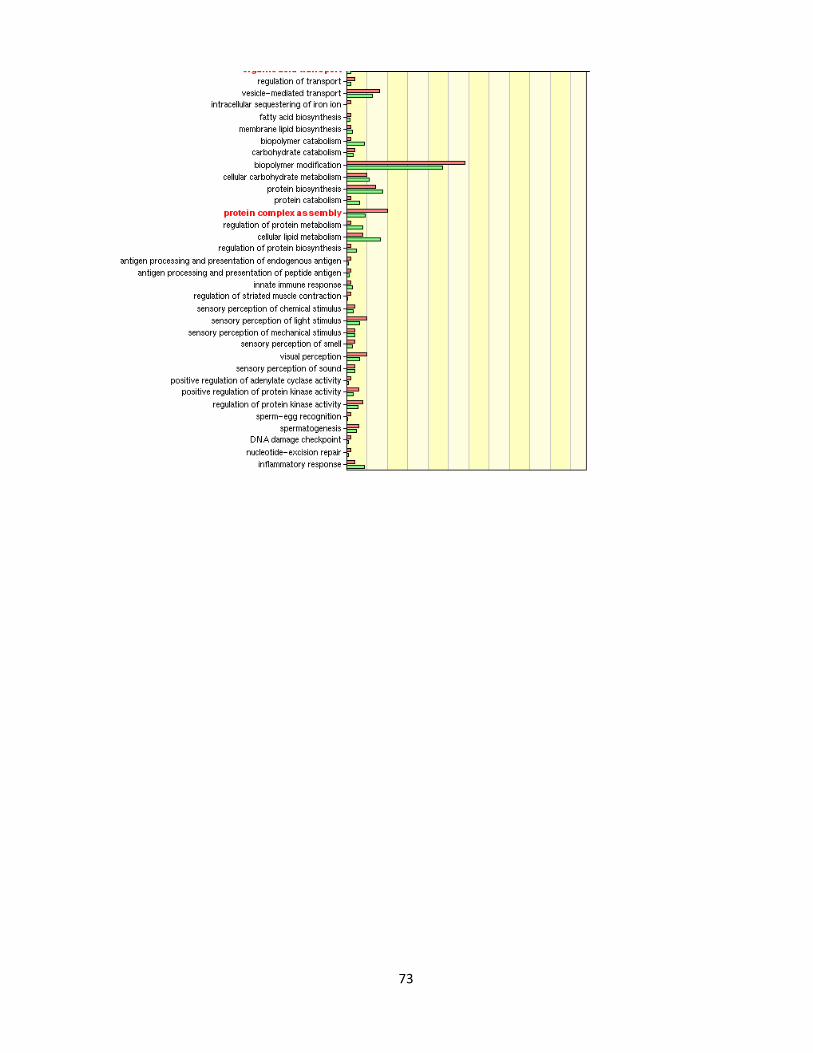
73
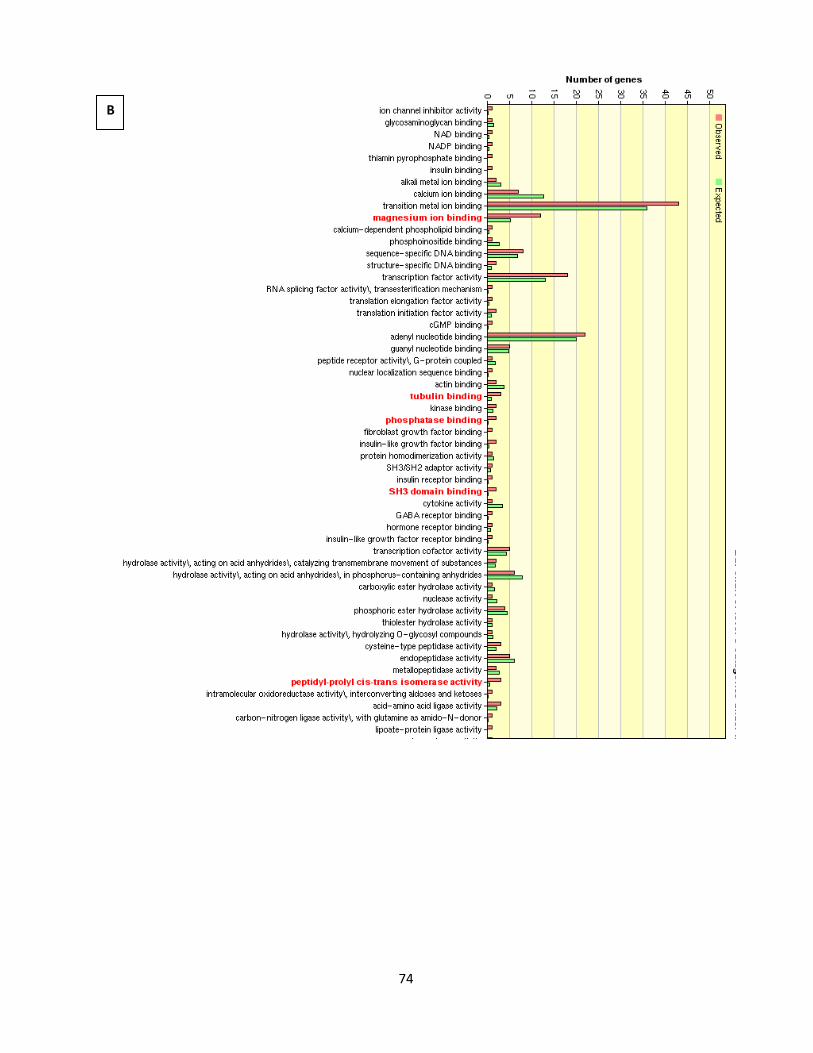
74
B
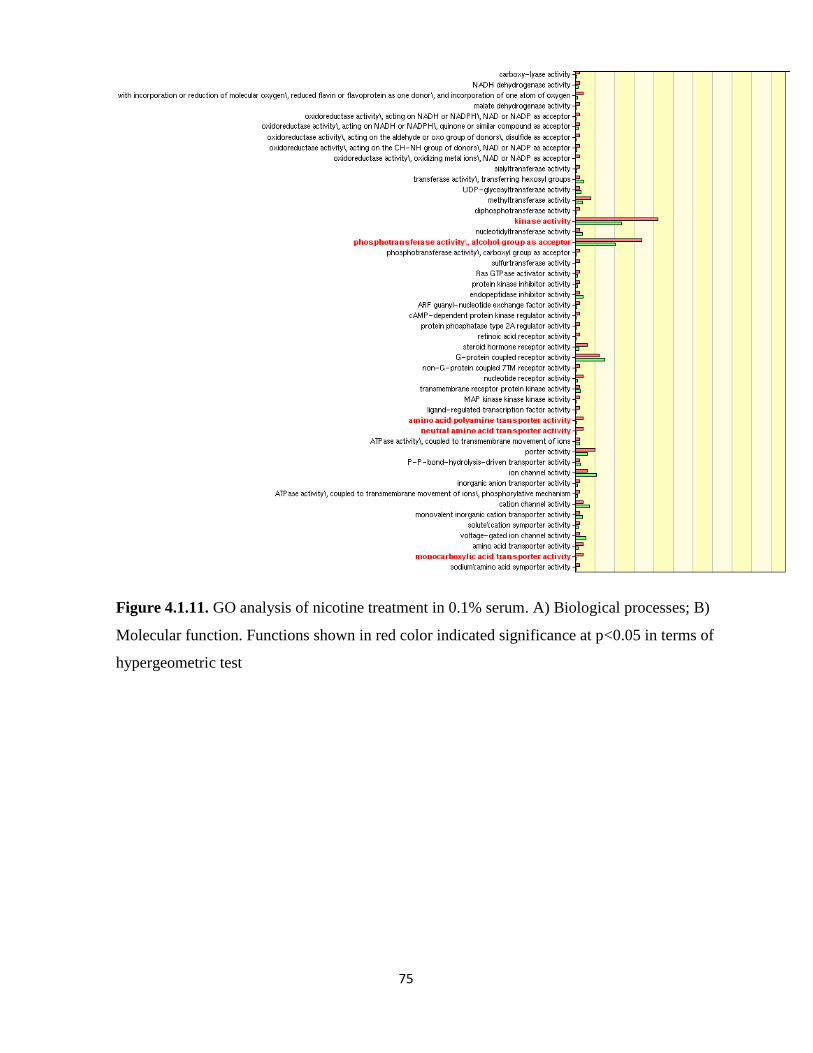
75
Figure 4.1.11. GO analysis of nicotine treatment in 0.1% serum. A) Biological processes; B)
Molecular function. Functions shown in red color indicated significance at p<0.05 in terms of
hypergeometric test
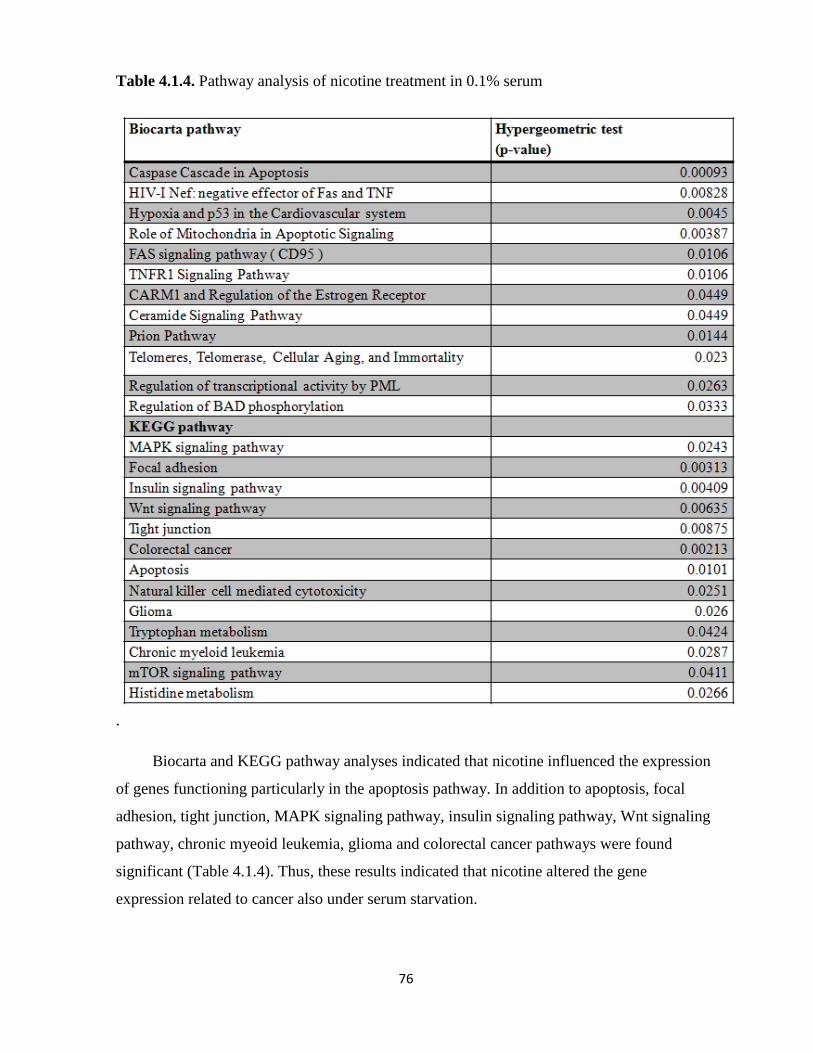
76
Table 4.1.4. Pathway analysis of nicotine treatment in 0.1% serum
.
Biocarta and KEGG pathway analyses indicated that nicotine influenced the expression
of genes functioning particularly in the apoptosis pathway. In addition to apoptosis, focal
adhesion, tight junction, MAPK signaling pathway, insulin signaling pathway, Wnt signaling
pathway, chronic myeoid leukemia, glioma and colorectal cancer pathways were found
significant (Table 4.1.4). Thus, these results indicated that nicotine altered the gene
expression related to cancer also under serum starvation.
77
4.1.7.1. Nicotine treatment under starvation might lead to recovery of cell
expression in a subset of probesets:
Many studies showed the proliferative and anti-apoptotic effect of nicotine in different
cancers (Egleton, Brown et al. 2008). Cells grown under serum starvation were known to be
under stress and might induce cell-stress mechanisms such as apoptosis. Since nicotine had
anti-apoptotic effects, we expected that nicotine treated cells grown under serum limiting
conditions might behave as cells grown in physiological serum conditions. Therefore,
nicotine treated and untreated cells grown in 0.1% serum were compared to untreated cells
grown in 10% serum.
630 probes were found in the 0.1% serum treatment data that changed 1.5 fold with
respect to control cells grown under the same conditions. These probes were divided into two
groups according to the relationships between 0.1% nicotine and 10% serum control
conditions, as it was mentioned in materials and methods. Accordingly, 404 probes were
identified as probesets behaving similar to probesets from the 10% serum. Genes functioning
in notch signaling, protein kinase pathway, stress activated protein kinase signaling pathway,
positive regulation of signal transduction, regulation of IκB kinase/ NFκB cascade, apoptosis,
regulation of program cell death, negative regulation of progression through cell cycle and
others were identified as significantly modulated (Figure 4.1.12). These genes had diverse
molecular functions such as magnesium ion binding, insulin-like growth factor binding,
kinase activity, phosphotransferase activity, nucleotide receptor activity and so on (Figure
4.1.12).
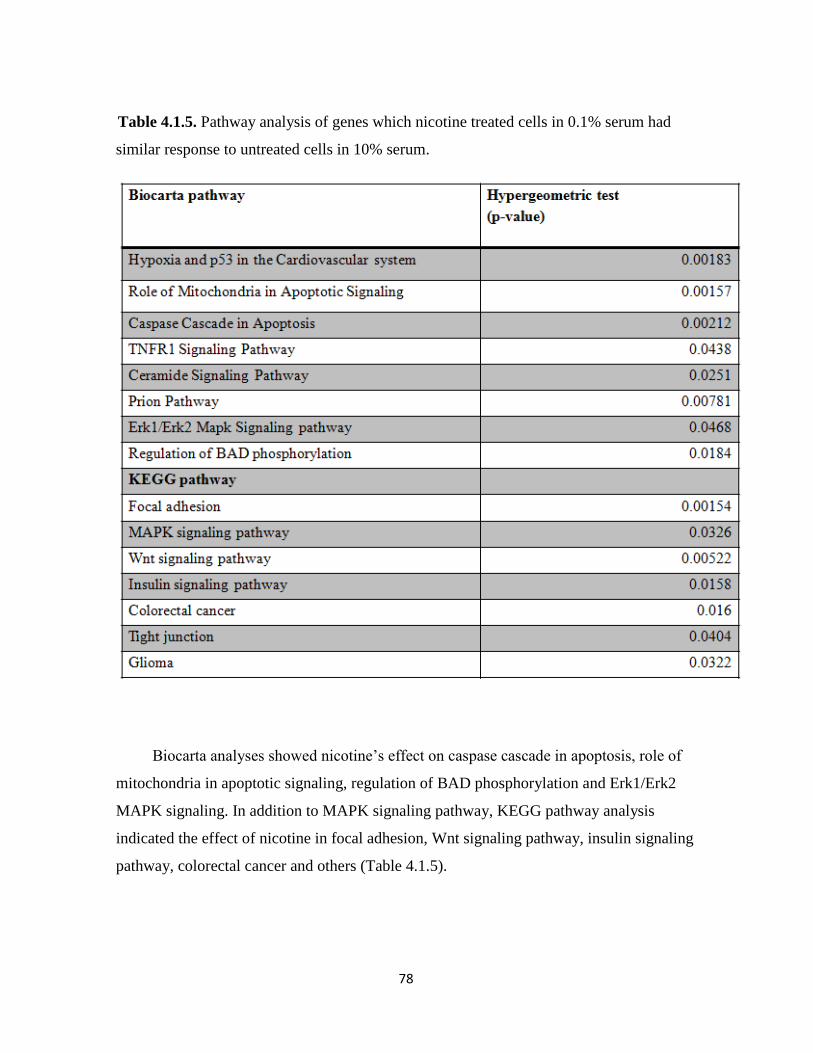
78
Table 4.1.5. Pathway analysis of genes which nicotine treated cells in 0.1% serum had
similar response to untreated cells in 10% serum.
Biocarta analyses showed nicotine’s effect on caspase cascade in apoptosis, role of
mitochondria in apoptotic signaling, regulation of BAD phosphorylation and Erk1/Erk2
MAPK signaling. In addition to MAPK signaling pathway, KEGG pathway analysis
indicated the effect of nicotine in focal adhesion, Wnt signaling pathway, insulin signaling
pathway, colorectal cancer and others (Table 4.1.5).

79
A

80

81
Figure 4.1.12. GO analysis of genes which nicotine treated cells in 0.1% serum had similar
response to untreated cells in 10% serum. A) Biological processes B) Molecular function.
Functions shown in red color indicated significance at p<0.05 in terms of hypergeometric
test.
B

82
Besides GO analysis and pathway analysis, cluster analysis was performed whether
nicotine treated cells in 0.1% serum and untreated cells in 10% serum were clustered
together. Since untreated cells in 10% serum had two replicas and others had only one, the
mean value of untreated cells in 10% serum was calculated and used for cluster analysis.
Nicotine treated cells in 0.1% serum and untreated cells in 10% serum were clustered
together (Figure 4.1.13).

83
Figure 4.1.13. Cluster analysis of genes which nicotine treated cells in 0.1% serum had
similar response to untreated cells in 10% serum A) Up-regulated genes in nicotine
treatment. B) Down-regulated genes in nicotine treatment. Partial representations.

84
All together 404 probesets behaved similarly as they were exposed to physiological
serum conditions. In conclusion, nicotine treatment regulated genes functioning in apoptosis
suggesting nicotine might help rescue the cells from serum-starvation stress. In addition,
nicotine altered genes functioning in regulation of progression through cell cycle and MAPK
signaling pathway may lead to cell cycle progression under serum starvation.
4.1.7.2. Nicotine modulates expression independent of serum starvation for a
subset of probesets:
Probesets behaving inverse to those of untreated 10% serum grown MCF7 cells were
226; when compared with 404 probesets behaving similarly this is much less. GO analysis
showed that genes with roles in carboxylic acid transport, organic acid transport and protein
complex assembly. Furthermore, these genes had translation initiation factor activity and
kinase activity as significantly altered molecular functions (Figure 4.1.14). On the other
hand, Biocarta and KEGG pathway analysis showed that regulation of transcriptional
activity, HIV-1Nef: negative factor of FAS and TNF, FAS signaling pathway, tight junction,
VEGF signaling pathway, Histine metabolism, glioma, pancreatic cancer and chronic
myeloid leukemia and others were modulated by nicotine treatment (Table 4.1.6).

85
Table 4.1.6. Pathway analysis of genes inversely correlated between 0.1% serum-nicotine
and 10% serum samples.
Cluster analysis showed that serum-starved samples were clustered together and
separated from untreated cells in 10% serum (Figure 4.1.15). Although these probesets
clustered together with 0.1% serum control treatment, the effect of nicotine was more
prominent.
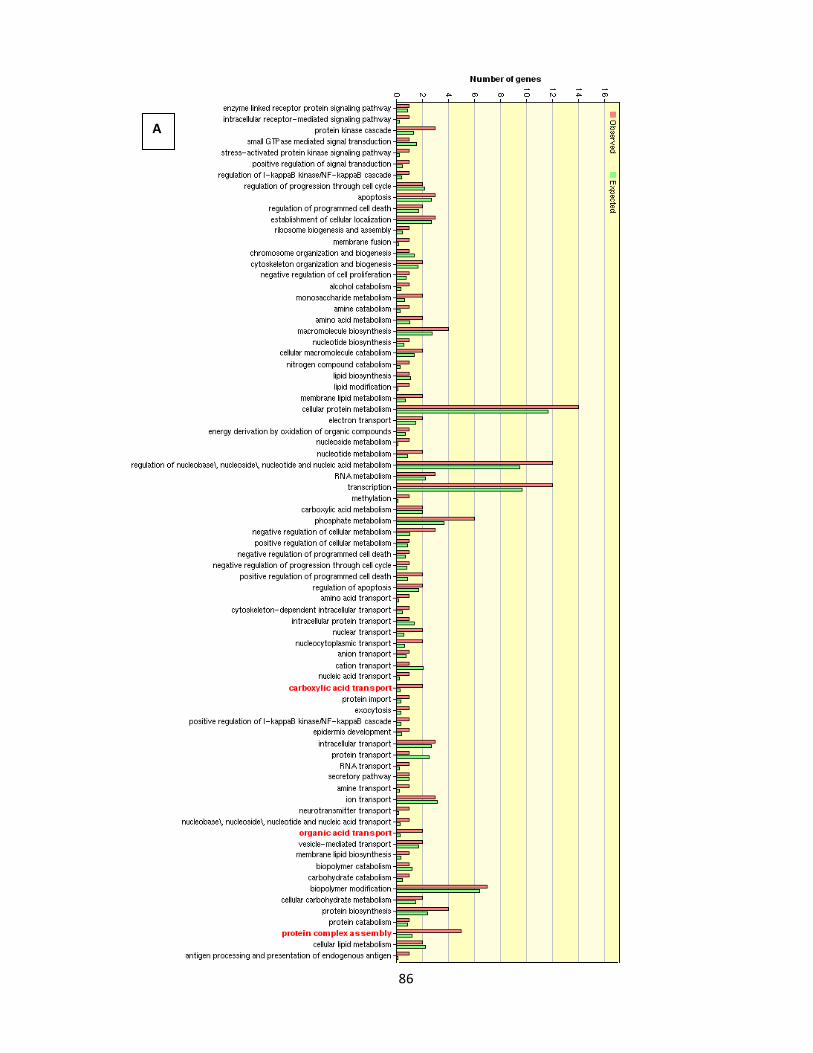
86
A
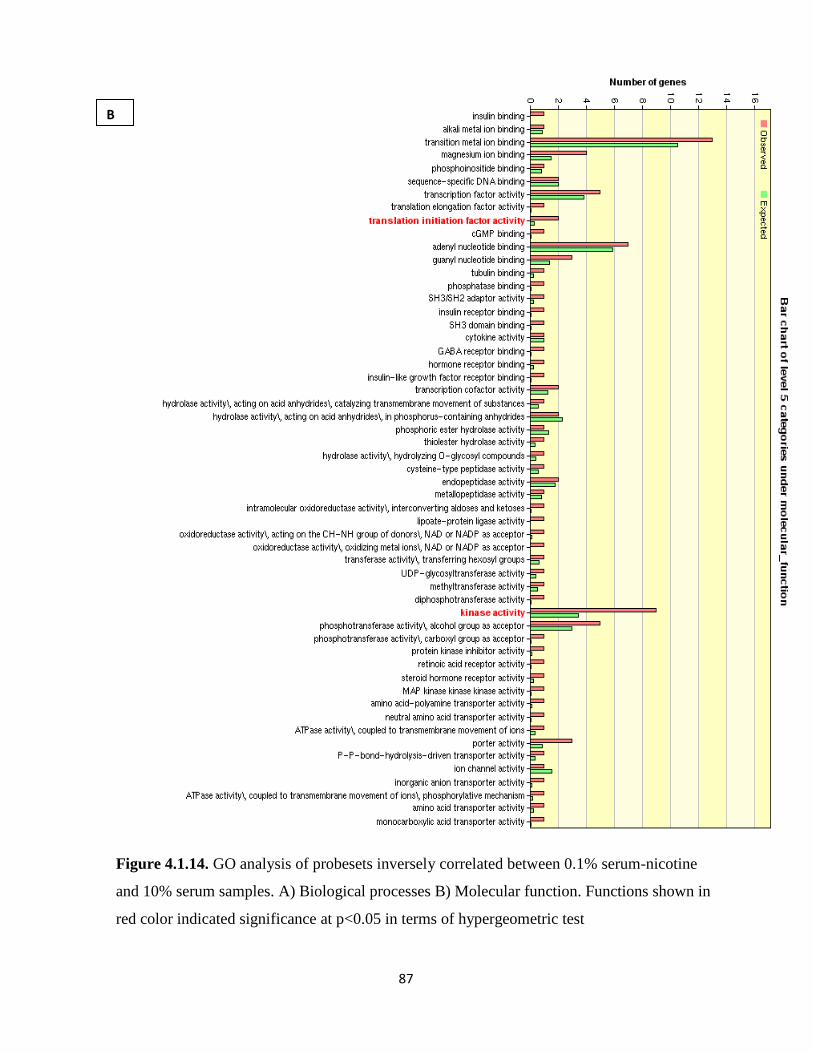
87
Figure 4.1.14. GO analysis of probesets inversely correlated between 0.1% serum-nicotine
and 10% serum samples. A) Biological processes B) Molecular function. Functions shown in
red color indicated significance at p<0.05 in terms of hypergeometric test
B
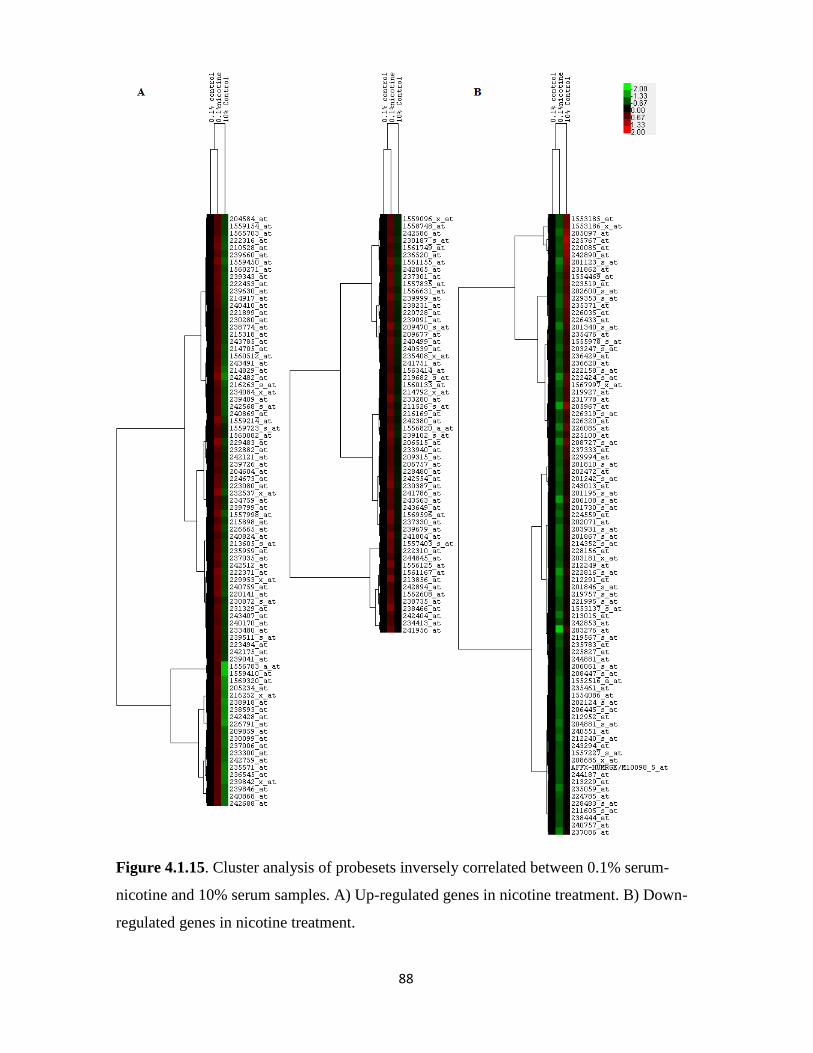
88
Figure 4.1.15. Cluster analysis of probesets inversely correlated between 0.1% serum-
nicotine and 10% serum samples. A) Up-regulated genes in nicotine treatment. B) Down-
regulated genes in nicotine treatment.

89
4.1.8. Cholinergic nAChR receptor expression analysis:
Nicotine asserts its function via binding to nicotinic acetylcholine receptors. This led us
to examine the effects of nicotine on cholinergic receptor expression. After normalization,
the cholinergic receptor expressions were extracted. Cluster analysis was performed and the
results were visualized via Java Treeview program. Nicotine did not alter the cholinergic
receptor expression at the concentrations and time-courses examined in the present study
(Figure 4.1.16).

90
Figure 4.1.16. Cluster analysis of nAChRs in respose to nicotine treatment at different
serum conditions.

91
Table 4.1.7. Results of class comparison analysis of nAChRs under 10 % serum conditions.

92
Table 4.1.8. Results of fold-change of nAChRs under serum starvation
.

93
To further understand the effects of nicotine on receptor expression, samples were
divided into two groups with respect to serum conditions and class comparison analysis was
performed for 10% serum conditions (Tables 4.1.7 and 4.1.8, for 0.1% and 10% serum,
respectively). As in the Table 4.1.7, only the expression of CHRNA4 genes was significantly
altered by nicotine and nicotine decreased the expression according to class comparison
result. However, the fold change was less than 1.2. On the other hand, expression of
CHRNA6, CHRNA3, and CHRNB1 were altered by nicotine under serum starvation but the
significance of these alterations were unknown due to presence of only one replica and very
slight changes (Table 4.1.8).
On the other hand, our findings suggested that (Figure 4.1.16) serum condition strongly
influenced the clustering of the samples although this finding should be confirmed with
analysis of additional samples. The expression of CHRNA5, CHRNA10 was lower under
serum starvation while CHRNAB1 had higher expression in terms of fold change with
respect to 10% FBS conditions (Table 4.1.9), Specifically, CHRNA5 expression was
decreased about 2 fold under serum starvation.
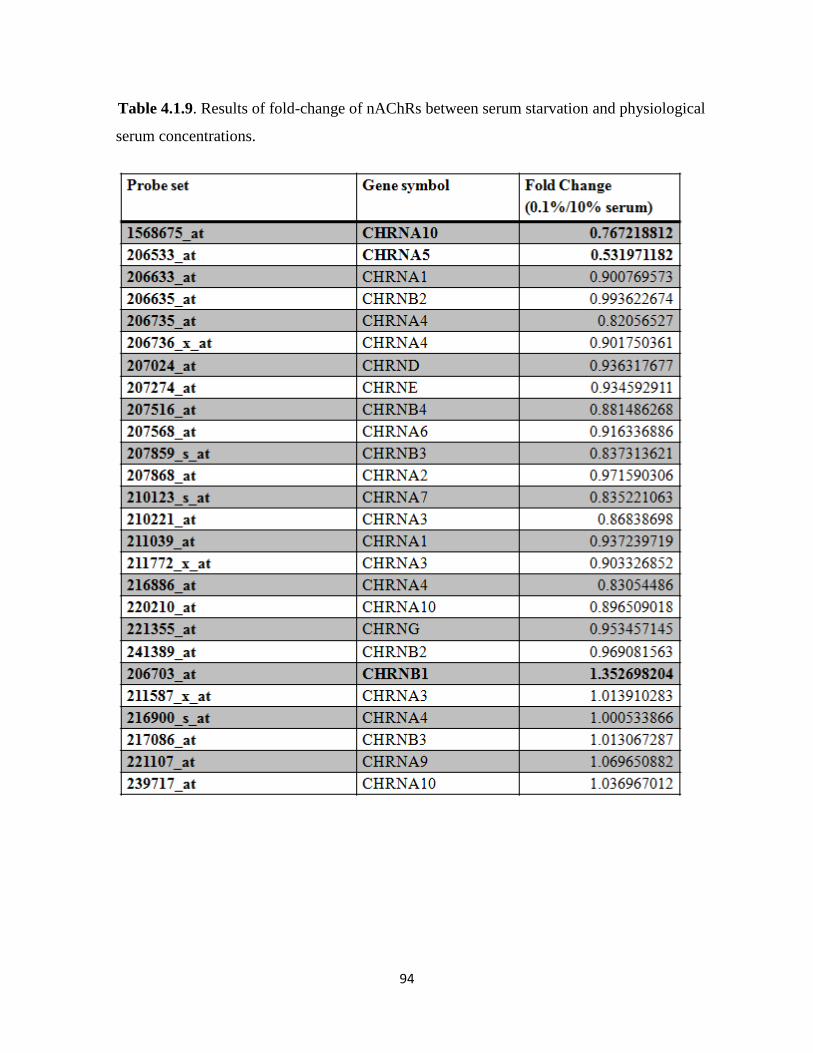
94
Table 4.1.9. Results of fold-change of nAChRs between serum starvation and physiological
serum concentrations.

95
4.2. Involvement of Estrogen in CHRNA5 Signaling:
In this section, we have performed a meta-analysis of CHRNA5 expression using
microarray datasets obtained from in vitro and and in vivo breast cancer experiments
deposited in the public expression study database GEO.
4.2.1. CHRNA5 Expression Analysis in Breast Cancer Cell Lines:
Before the detailed analysis, class comparison analysis of in vitro studies was
performed via BRB ArrayTool. The p-values and FDR values were represented in Table
4.2.1, such that CHRNA5 expression was significantly altered in each condition except
GSE11467. The reason for the insignificance of GSE11467 will be mentioned in the future
paragraphs.
Table 4.2.1. Class comparison results of in vitro studies.

96
4.2.1.1. Estrogen treatment increases CHRNA5 expression:
It is observed that MCF7 breast carcinoma cells were widely used to study estrogen
signaling pathway because MCF7 cells were characterized as ER-α positive breast cancer
cells and their growth depends on estrogen (Bourdeau, Deschenes et al. 2008). Moreover,
MCF7 cell lines have different sublines exhibiting different responses to estrogen; for
example, estrogen-independent MCF7:2A and highly-sensitive MCF7/BUS cells.
To assess the effects of estrogen treatment on CHRNA5 expression, microarray data
sets GSE3529 and GSE11791were used. In GSE3529 Rea et al. used three different ER-α
positive cell lines: MCF7, T47D, and BT-474 (Rae, Johnson et al. 2005). Biological
duplicates of each cell line were grown in the presence or absence of estrogen for 24 hours.
When the untransformed expression values were compared (Fig. 4.2.1A), we found that
CHRNA5 expression was significantly different in each cells suggesting variability across
individuals. The range of the expression was between 100 and 600 units, T47D exhibiting the
highest expression of all three cell lines. Effect of E2 treatment with respect to control was
calculated as fold change. As shown in the figure 4.2.1B, there was no significant change in
BT-474 cells whereas estrogen-induced increases in CHRNA5 expression were observable in
the T47-D and MCF7 cells although the only the change in MCF7 cells was statistically
significant (p<0.05).
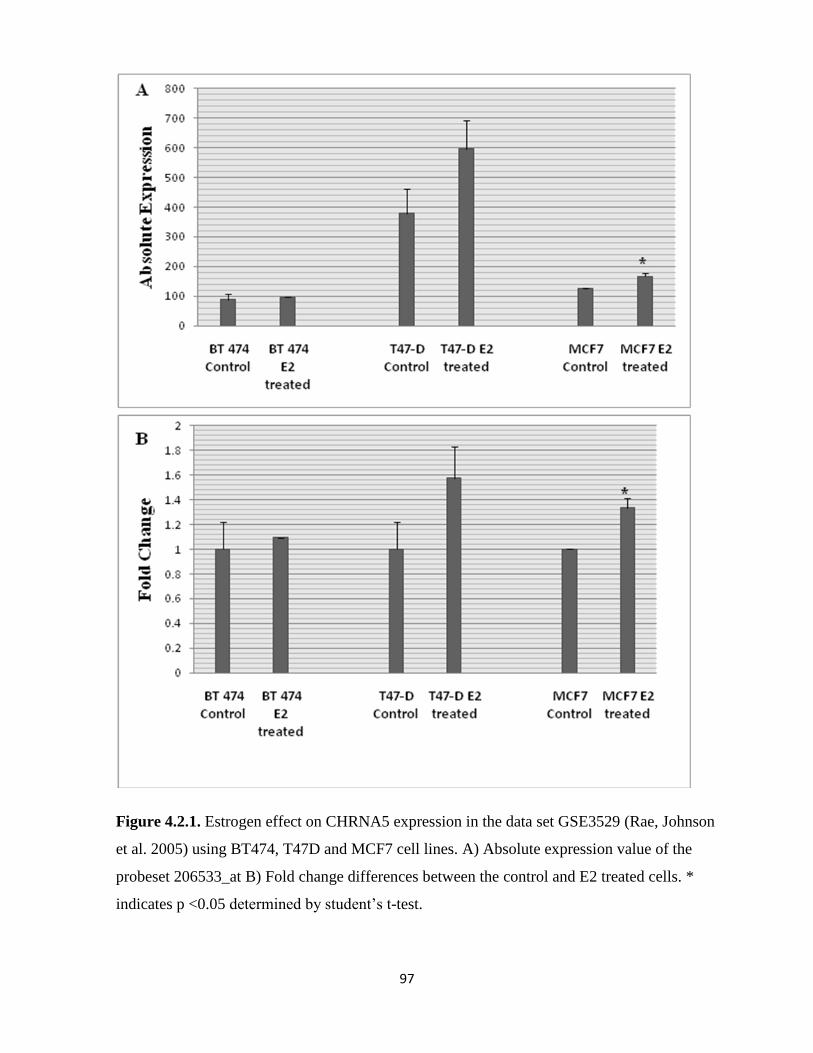
97
Figure 4.2.1. Estrogen effect on CHRNA5 expression in the data set GSE3529 (Rae, Johnson
et al. 2005) using BT474, T47D and MCF7 cell lines. A) Absolute expression value of the
probeset 206533_at B) Fold change differences between the control and E2 treated cells. *
indicates p <0.05 determined by student’s t-test.

98
To validate the estrogen effect on CHRNA5 expression, GSE11791 performed by
Musgrove et al. also was analyzed. In this study, each experimental group had three
biological replicates while MCF7 cells were treated with 100 nM estrogen for 6 hours
(Musgrove, Sergio et al. 2008). Similarly, our results indicated that estrogen had a
significantly positive effect on CHRNA5 expression, which is likely to be cell-type
dependent (Figure 4.2.2).
Figure 4.2.2. CHRNA5 expression in response to E2. In GSE11791 (Musgrove, Sergio et al.
2008), MCF7 cells were treated with 100 nM estrogen for 6 hours. * indicates the p < 0.05
determined by student’s t-test
99
4.2.1.2. Estrogen induces the expression of CHRNA5 in a dose- and time-
dependent manner:
To further examine the effects of estrogen treatment on CHRNA5 expression, we
analyzed three independent microarray datasets designed to determine dose- and time-
dependent effect of estrogen (GSE4668, GSE11324 and GSE11352). Before analyzing the
expression of CHRNA5, pS2 expression analysis performed as a positive control for estrogen
treatment (Appendix A, Figure 6.1).
GSE4668 conducted by Coser et al. was designed to assess the dose-response and time-
course hormone starvation effect using MCF7/BUS. MCF7/BUS cells showed higher
proliferative response to estradiol-17 beta then MCF7 from ATCC and responded to as low as
2 pM estrogen with a reproducible estrogen dose-dependent growth curve (Coser, Chesnes et
al. 2003). In addition, in the absence of estrogen, MCF7/BUS cells blocked proliferation and
became arrested in the G0/G1 phase of the cell cycle (Villalobos, Olea et al. 1995). Pure anti-
estrogen treatment fully blocked the estrogen growth-stimulating affect meaning that estrogen
induced the cells via estrogen receptor (Coser, Chesnes et al. 2003). Furthermore, western
blot experiments showed only the presence of ER-α but not the presence of ER-β in these
cells (Coser, Chesnes et al. 2003). Thus, the MCF7/ BUS breast cancer cells represent one of
the best models to study the estrogen signaling via estrogen -ER-α interaction.
As mentioned above, Coser et al. treated the MCF7/BUS cells with 0, 10, 30, 60, and
100 pM estrogen for 48 hours (Coser, Chesnes et al. 2003). It also was shown that beyond
100pM, these cells did not respond to estrogen. As shown in the Figure 4.2.3, CHRNA5
expression was enhanced with increasing E2 concentrations. Interestingly, the polynomial
regression analysis (Table 4.2.2) indicated that a linear increase in expression up to 30 pM
was apparent whereas greater than 30pM of E2 resulted in an asymptotical response.
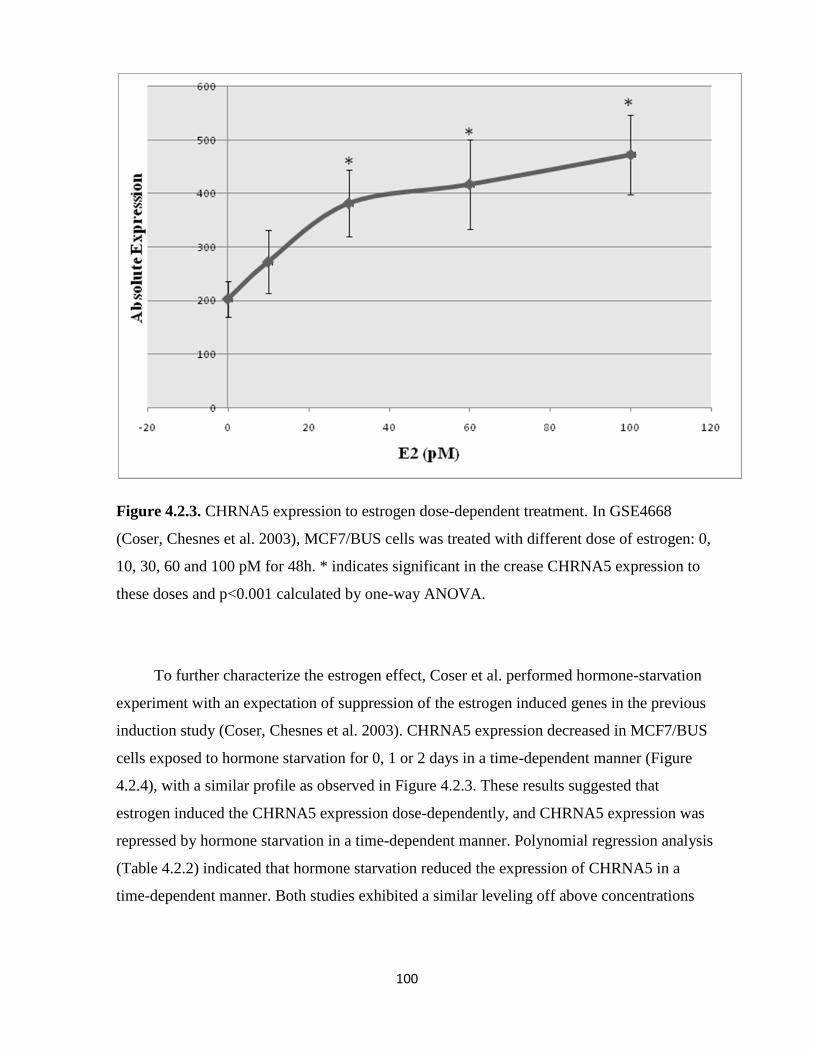
100
Figure 4.2.3. CHRNA5 expression to estrogen dose-dependent treatment. In GSE4668
(Coser, Chesnes et al. 2003), MCF7/BUS cells was treated with different dose of estrogen: 0,
10, 30, 60 and 100 pM for 48h. * indicates significant in the crease CHRNA5 expression to
these doses and p<0.001 calculated by one-way ANOVA.
To further characterize the estrogen effect, Coser et al. performed hormone-starvation
experiment with an expectation of suppression of the estrogen induced genes in the previous
induction study (Coser, Chesnes et al. 2003). CHRNA5 expression decreased in MCF7/BUS
cells exposed to hormone starvation for 0, 1 or 2 days in a time-dependent manner (Figure
4.2.4), with a similar profile as observed in Figure 4.2.3. These results suggested that
estrogen induced the CHRNA5 expression dose-dependently, and CHRNA5 expression was
repressed by hormone starvation in a time-dependent manner. Polynomial regression analysis
(Table 4.2.2) indicated that hormone starvation reduced the expression of CHRNA5 in a
time-dependent manner. Both studies exhibited a similar leveling off above concentrations

101
greater than 30pM suggesting a non-linear response, which may be related with the saturation
of receptor signaling or availability of the CHRNA5 inherent response to estrogen.
Figure 4.2.4. CHRNA5 expression in response to hormone starvation. In GSE4668 (Coser,
Chesnes et al. 2003), MCF7/BUS cells were treated with hormone starved medium for 0, 1,
and 2 days. * indicates significant the reduction of CHRNA5 expression and p<0.001
calculated by one-way ANOVA.
Similarly in another time-series study (GSE11324) (Carroll, Meyer et al. 2006) MCF7
cells were stimulated with 100 nM estrogen for 0, 3, 6, or 12 hours and all experiments were
performed in triplicate. Figure 4.2.5A indicated that CHRNA5 expression was enhanced with
increasing time in the presence of estrogen treatment. 3 hr estrogen treatment did not
significantly induce the CHRNA5 expression whereas 6 hr and 12 hr inductions were
statistically significant. Again, a similar leveling off affect was observed suggesting
saturation of the response.

102
Table 4.2.2. Regression analysis of dose-dependent and time-dependent data.
On the other hand, a third time-course studies (GSE11352; Lin, Vega et al. 2007), in
which MCF7 cells were investigated for 12, 24 and 48 hours, in the presence or absence of
E2 treatment. CHRNA5 expression increased at all the time point regardless of treatment
condition (Fig. 4.2.5B). However estrogen treated samples exhibited higher basal expression
levels than the untreated samples. Estrogen treatment induced the CHRNA5 expression
initially at around 20 hours after which leveling off took place almost to the basal levels. This
suggests that although there is an induction of CHNRA5 expression initially, this response
may not be maintained over a longer time of exposure and the extent of maintenance might
vary from experiment to experiment. The different time points and different amount of
estrogen treatment also might have caused this discrepancy. The first two studies, GSE4668
and GSE11324, suggested that CHRNA5 expression was induced by estrogen time-
dependent manner and the last study, GSE11352 implies that this induction might reach a
maximum point and increasing the exposure time may not influence the outcome. Therefore,
it can be concluded that estrogen induces the CHRNA5 expression in time- dependent
manner during the short- time exposure.

103
Figure 4.2.5. CHRNA5 expression in response to time-dependent E2 exposure. A) In
GSE11324 (Carroll, Meyer et al. 2006), MCF7 cells were treated with 100nM E2 for 0, 3, 6
and 12 h. B) In GSE11352 (Lin, Vega et al. 2007), MCF7 cells were treated with/without
10nM E2 for 12, 24 and 48 h. * indicates the significant time-dependent response to E2 and
p<0.001 determined by regression analysis (Table 4.2.2).
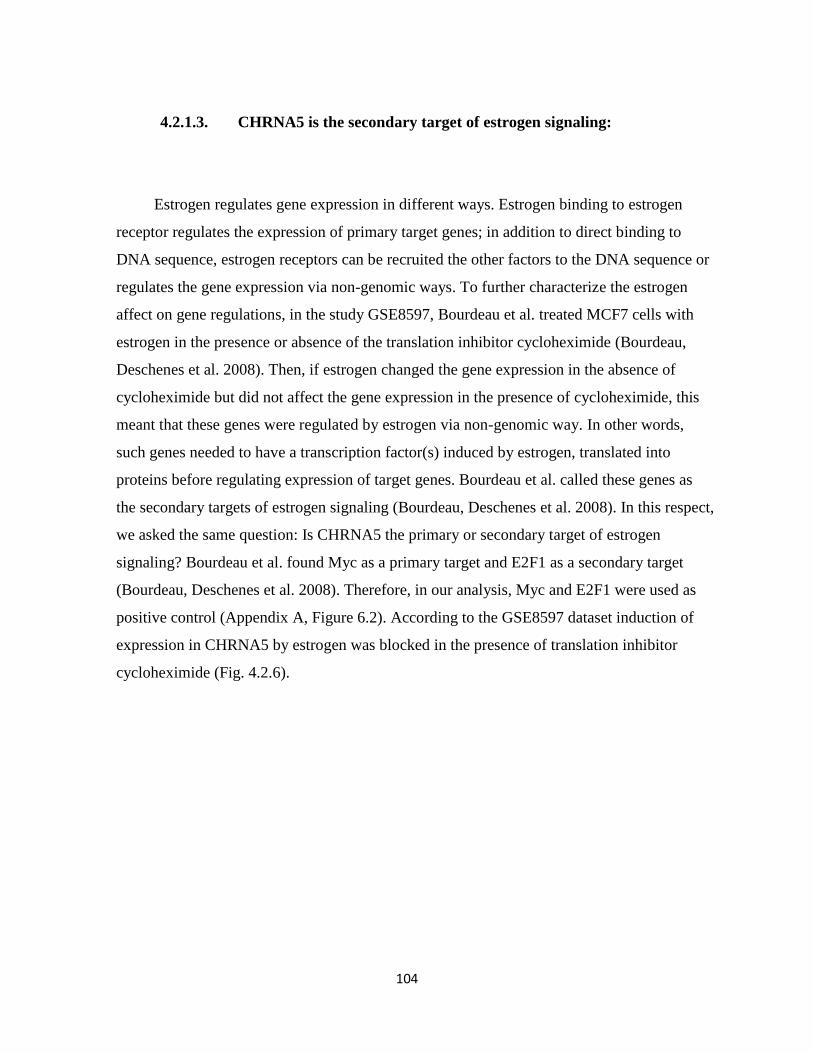
104
4.2.1.3. CHRNA5 is the secondary target of estrogen signaling:
Estrogen regulates gene expression in different ways. Estrogen binding to estrogen
receptor regulates the expression of primary target genes; in addition to direct binding to
DNA sequence, estrogen receptors can be recruited the other factors to the DNA sequence or
regulates the gene expression via non-genomic ways. To further characterize the estrogen
affect on gene regulations, in the study GSE8597, Bourdeau et al. treated MCF7 cells with
estrogen in the presence or absence of the translation inhibitor cycloheximide (Bourdeau,
Deschenes et al. 2008). Then, if estrogen changed the gene expression in the absence of
cycloheximide but did not affect the gene expression in the presence of cycloheximide, this
meant that these genes were regulated by estrogen via non-genomic way. In other words,
such genes needed to have a transcription factor(s) induced by estrogen, translated into
proteins before regulating expression of target genes. Bourdeau et al. called these genes as
the secondary targets of estrogen signaling (Bourdeau, Deschenes et al. 2008). In this respect,
we asked the same question: Is CHRNA5 the primary or secondary target of estrogen
signaling? Bourdeau et al. found Myc as a primary target and E2F1 as a secondary target
(Bourdeau, Deschenes et al. 2008). Therefore, in our analysis, Myc and E2F1 were used as
positive control (Appendix A, Figure 6.2). According to the GSE8597 dataset induction of
expression in CHRNA5 by estrogen was blocked in the presence of translation inhibitor
cycloheximide (Fig. 4.2.6).

105
Figure 4.2.6. CHRNA5 expression in response to E2 exposure in the presence or absence of
translation inhibitor cycloheximide. In GSE8597 (Bourdeau, Deschenes et al. 2008), MCF7
cells were treated with 25 nM estrogen either in the presence or absence of (25 μg/ml)
cycloheximide. * indicates p< 10-7
determined by one-way ANOVA.
As it is mentioned before, in the figure 4.2.5A, 3 hours estrogen treatment did not
significantly induce CHRNA5 expression. This supported the idea that CHRNA5 was the
secondary target of estrogen signaling. To further support this notion, we analyzed the
GSE11467 performed by Frasor (Frasor 2008; Frasor, Weaver et al. 2008). In this study, the
authors wanted to examine how E2 and TNF-α together influence gene expression in breast
cancer cells compared to either factor alone so they treated MCF7 cells with 10nM estrogen,
10nM TNF-α or both for two hours. We were only interested the estrogen effect so
eliminated the experiment with 10nM TNF-α or both 10nM TNF-α and estrogen treatment.
Here, the estrogen induction was done only for 2 hours so if the CHRNA5 were a primary
target, we expected to see estrogen-induction but otherwise the findings would have

106
supported the theory that CHRNA5 was the secondary target of estrogen signaling. Before
analysis of CHRNA5 expression, the effect of estrogen in Myc as primary target and E2F1 as
a secondary target expression was analyzed as a positive control (Appendix A, Figure 6.3)
(Bourdeau, Deschenes et al. 2008). There was no significant changes in response to estrogen
in short term E2 exposure (Fig. 4.2.7). In addition to these meta-analysis results of
microarray expression, we found no putative estrogen receptor binding site on the CHRNA5
promoter (BrownLab). Thus, all these results indicate that CHRNA5 is the secondary target
of estrogen.
Figure 4.2.7. CHRNA5 expression in response to short-time E2 exposure. In GSE11467
(Frasor 2008), MCF7 cells were treated with 10 nM E2 for 2h. Student’s t-test indicates no
significance.

107
4.2.1.4. Estrogen-independent MCF7 sublines have higher CHRNA5
expression:
Hormone therapy is a widely used approach in breast cancer patients. In particular,
anti-estrogen tamoxifen is used to control the ER activity. Unfortunately, prolonged anti-
estrogen therapy leads to drug resistance in breast cancer patients. In recent years, many
studies elucidated the anti-estrogen resistance mechanisms. GSE5840 done by Fan et al. was
the one of the microarray studies to compare the expression pattern of estrogen responsive
genes in wild-type MCF7, OHT (tamoxifen)–resistant MCF7, and ICI (Fulvestrand)-resistant
MCF7 cells. The establishment of OHT (tamoxifen) –resistant MCF7 cells and ICI
(Fulvestrand)-resistant MCF7 cells were mentioned in the material and methods parts (Fan,
Yan et al. 2006). Accordingly, the difference between anti-estrogen tamoxifen and the pure
anti-estrogen fulvestrand, is that tamoxifen competitively binds to the ER and leads to an ER
conformational change, which inhibits ER binding to co-activators and/or make favorable ER
binding to corepressors as well as it alters ER dimerization and interaction with ERE so the
genetic estrogen response is blocked (Huang, Norris et al. 2002; Shang and Brown 2002). On
the other hand, the pure anti-estrogens such as fulvestrand can destroy the ER via binding to
the newly synthesized estrogen receptor in the cytoplasm and preventing the transportation to
the nucleus so it prevents estrogen signaling (MacGregor and Jordan 1998; Fan, Yan et al.
2006).
As repeatedly shown estrogen induced the CHRNA5 expression in MCF7 cells with
treatment of 10 nM estrogen for 4 hours, whereas OHT-resistant MCF7 and ICI-resistant
MCF7 cells were both estrogen-resistant and CHRNA5 expression did not change (Fig.
4.2.8).
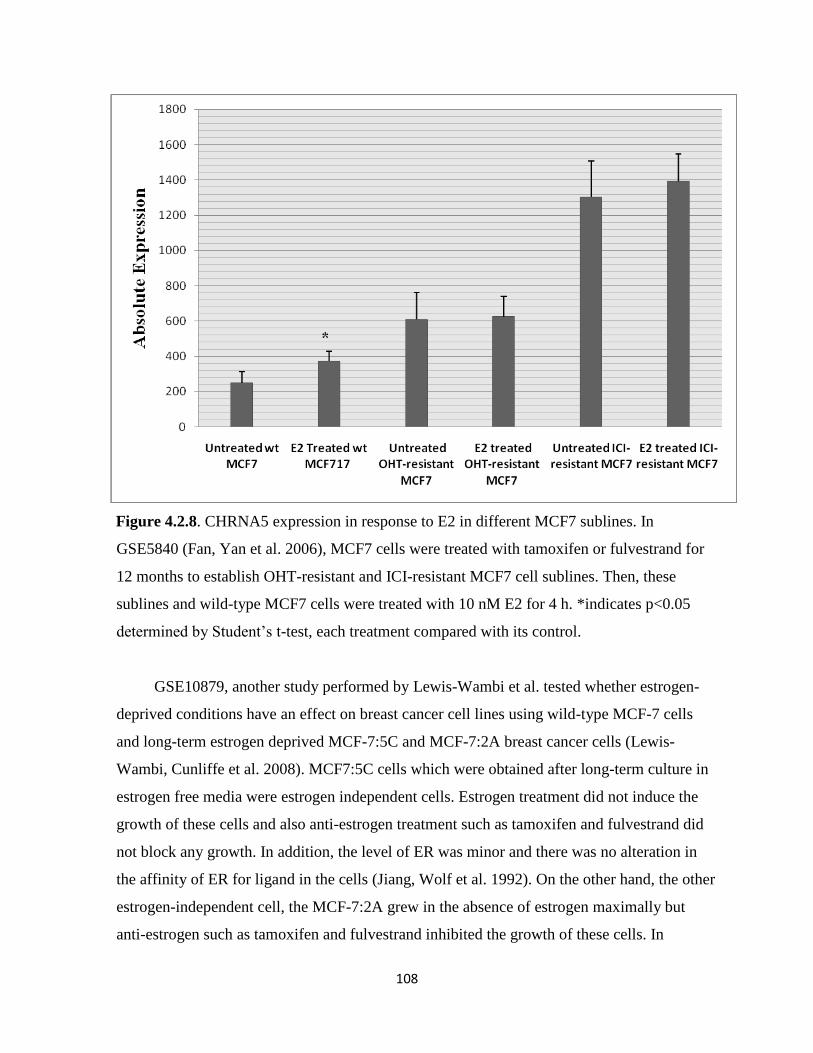
108
Figure 4.2.8. CHRNA5 expression in response to E2 in different MCF7 sublines. In
GSE5840 (Fan, Yan et al. 2006), MCF7 cells were treated with tamoxifen or fulvestrand for
12 months to establish OHT-resistant and ICI-resistant MCF7 cell sublines. Then, these
sublines and wild-type MCF7 cells were treated with 10 nM E2 for 4 h. *indicates p<0.05
determined by Student’s t-test, each treatment compared with its control.
GSE10879, another study performed by Lewis-Wambi et al. tested whether estrogen-
deprived conditions have an effect on breast cancer cell lines using wild-type MCF-7 cells
and long-term estrogen deprived MCF-7:5C and MCF-7:2A breast cancer cells (Lewis-
Wambi, Cunliffe et al. 2008). MCF7:5C cells which were obtained after long-term culture in
estrogen free media were estrogen independent cells. Estrogen treatment did not induce the
growth of these cells and also anti-estrogen treatment such as tamoxifen and fulvestrand did
not block any growth. In addition, the level of ER was minor and there was no alteration in
the affinity of ER for ligand in the cells (Jiang, Wolf et al. 1992). On the other hand, the other
estrogen-independent cell, the MCF-7:2A grew in the absence of estrogen maximally but
anti-estrogen such as tamoxifen and fulvestrand inhibited the growth of these cells. In
109
addition, MCF-7:2A cells had high levels of estrogen receptor expression and constitutively
active ER shown via ER-responsive luciferase reporter construct in the absence of any
estrogens. Furthermore, tamoxifen and fulvestrand inhibited the ER-responsive luciferase
reporter construct activation. Therefore, the MCF-7:2A cell represented a good model to use
in the study of ER action and estrogen-independent growth in human breast cancer cells
(Pink, Jiang et al. 1995). Thus, MCF7:5C and MCF7:2A cells represent good models for the
study of the estrogen-deprivation mechanisms. In GSE10879 study where wild-type MCF7,
MCF7:5C and MCF7:2A cells grown in estrogen-free media CHRNA5 expression was
compared among the cell lines. MCF7:5C and MCF7:2A exhibited statistically significantly
higher expression level than wild-type MCF7 cells (Fig. 4.2.9). Therefore, Figures 4.2.8 and
4.2.9 supported each other and indicated that estrogen-deprivation led to higher CHRNA5
expression in an estrogen-independent manner.
Figure 4.2.9. CHRNA5 expression in estrogen-independent MCF7 clones. In GSE10879
(Lewis-Wambi, Cunliffe et al. 2008), wild-type MCF7 cells are estrogen-dependent;
MCF7:5C and MCF7:2A cells are estrogen-independent. * indicates p<0.01.
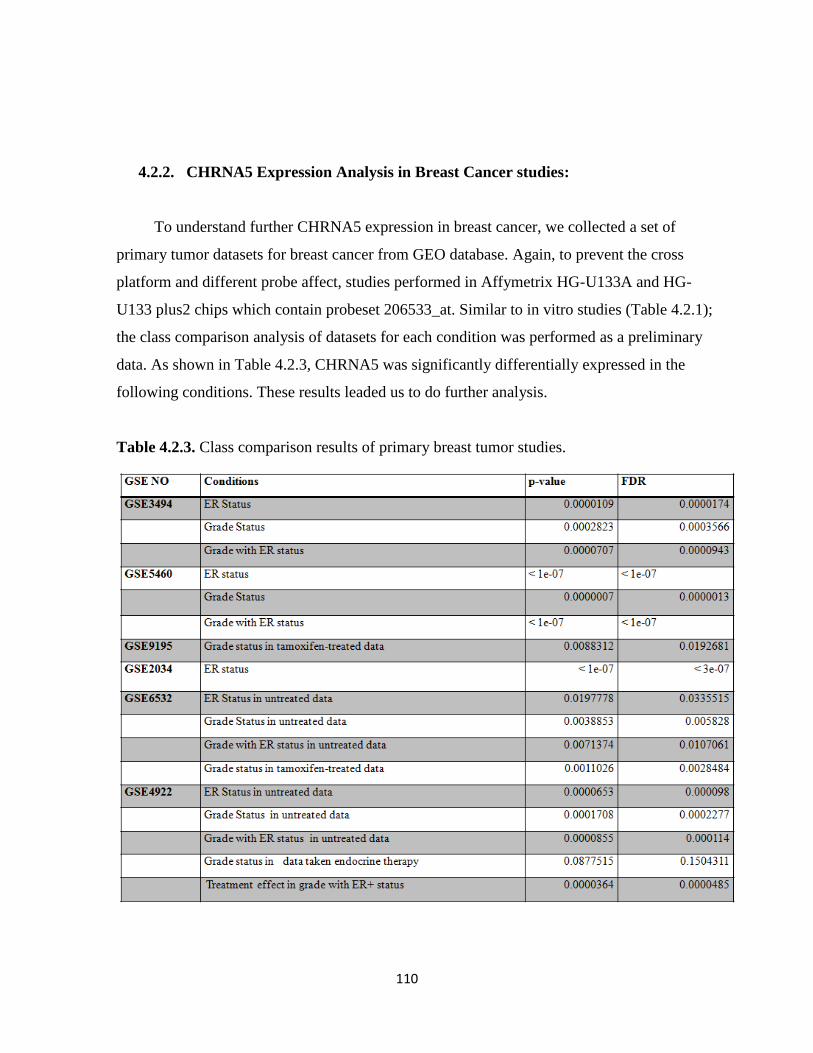
110
4.2.2. CHRNA5 Expression Analysis in Breast Cancer studies:
To understand further CHRNA5 expression in breast cancer, we collected a set of
primary tumor datasets for breast cancer from GEO database. Again, to prevent the cross
platform and different probe affect, studies performed in Affymetrix HG-U133A and HG-
U133 plus2 chips which contain probeset 206533_at. Similar to in vitro studies (Table 4.2.1);
the class comparison analysis of datasets for each condition was performed as a preliminary
data. As shown in Table 4.2.3, CHRNA5 was significantly differentially expressed in the
following conditions. These results leaded us to do further analysis.
Table 4.2.3. Class comparison results of primary breast tumor studies.

111
4.2.2.1. ER status:
Breast cancer cell line studies indicated that estrogen induced the CHRNA5 expression,
and estrogen-independent cell lines had higher expression levels than wild-type. Therefore,
we examined whether there was a differential expression between ER+ and ER- breast
cancers. Since endocrine therapy and tamoxifen targets the ER, we selected breast cancer
microarray studies from which samples were taken from untreated patients with information
about the ER status. Statistically, we compared the CHRNA5 expression between the ER+
patients and ER- patients; our results indicated that (Fig. 4.2.10) ER- patients had higher
CHRNA5 expression than ER+ patients. The fold change difference between the ER- and
ER+ samples was not very high yet was highly significant ( p<0.0005).
Figure 4.2.10. CHRNA5 expression based on ER status. ER+ samples were assumed as
control and equalized to 1. The fold change was calculated relative to ER+. ** and * indicate
p <0.0005 and p <0.05 determined by student’s t-test.

112
4.2.2.2. Histological Grade:
In breast cancer, histological grade is an essential prognostic factor and higher grade
tumors with ER- status are correlated with higher malignancies (Porter, Evans et al. 2004). In
addition to this, higher expression of CHRNA5 in ER- breast cancer cells led us to analyze
the primary breast tumor studies according to histological grade status. In this case,
microarray studies were divided in two groups such that untreated and treated breast cancer
samples were separated to prevent heterogeneity caused by therapy. Regardless of therapy,
CHRNA5 expression was higher in Grade 3 (Fig. 4.2.11). Similar to ER- conditions, the fold
change difference was not very high yet was very consistant. Grade 1 and Grade 2 tumors did
not exhibit differences between themselves however Grade 3 CHRNA5 expression was
higher than either Grade 1 or Grade 2.
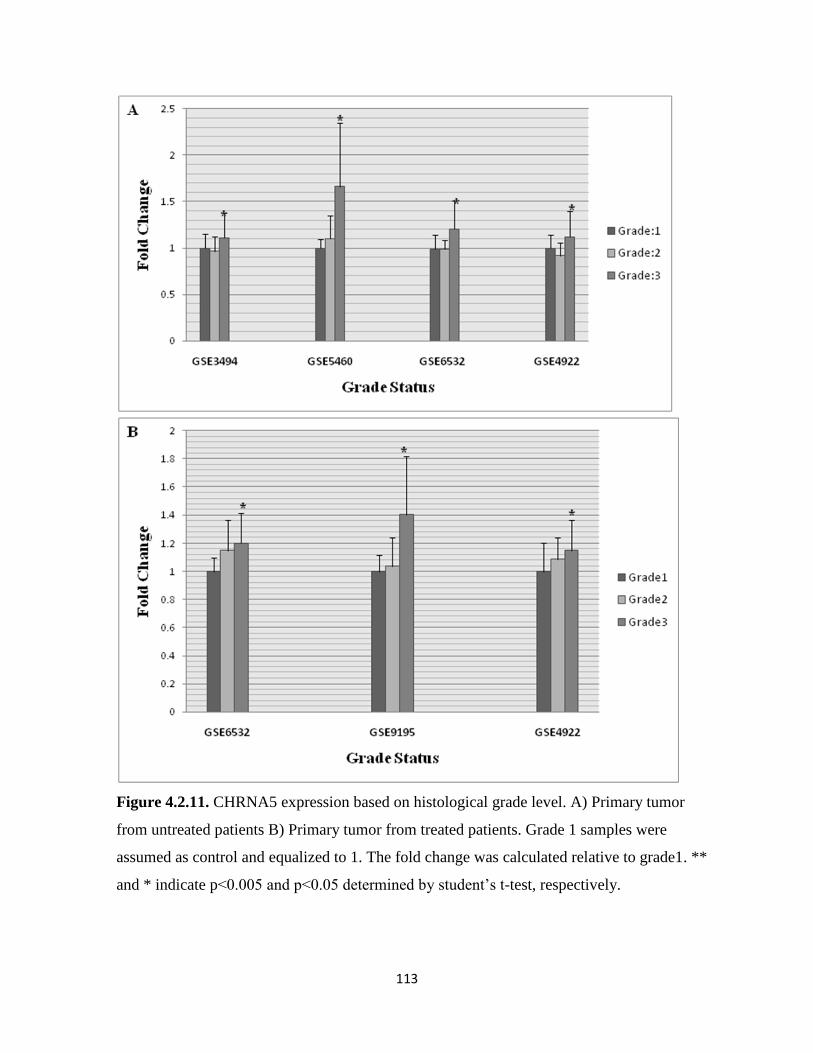
113
Figure 4.2.11. CHRNA5 expression based on histological grade level. A) Primary tumor
from untreated patients B) Primary tumor from treated patients. Grade 1 samples were
assumed as control and equalized to 1. The fold change was calculated relative to grade1. **
and * indicate p<0.005 and p<0.05 determined by student’s t-test, respectively.

114
Since there is a correlation between higher maligancies and Grade 3 with ER- patients
we analyzed the expression of CHRNA5 with regard to status combining ER and grade. In
general, ER- patients had higher expression regardless of grade whereas Grade 3 ER- patients
exhibited the highest expression value in all samples except the grade 1 ER- level due to the
insufficient number patients (Fig. 4.2.12).
Figure 4.2.12. CHRNA5 expression based on histological grade with ER status. A) GSE3494
studies B) GSE5460 studies C) GSE4922 studies with untreated samples D) GSE6532 studies
with untreated samples. Grade 1 ER+ samples were assumed as control and equalized to 1.
The fold change was calculated relative to Grade 1 ER+. * indicates p <0.0005 determined by
student’s t-test.

115
4.2.2.3. Hormone therapy:
In vitro studies show that estrogen induces the expression. In general, hormone therapy
targets the ER receptors and reduces the estrogen- induced growth. So, tamoxifen treated and
untreated samples from GSE6532 and endocrine therapy applied and not applied samples
ER+ from GSE4922 samples were analyzed to examine this effect. In the Figure 4.2.13A,
samples from GSE4922 datasets were ER+ this represents a homogenous population.
Endocrine therapy decreased the expression in Grade 1 but did not affect the Grade 2 and
Grade 3 patients (Figure 4.2.13A). In figure 4.2.13B, GSE6532 data sets were used. In
GSE6532 dataset, although the ER status of patients was not unknown, ER- Grade 1 patients
were very rare cases and the results in Figure 4.2.13B supported results in the Figure 4.2.13A
that hormone therapy leads to reduction in expression of CHRNA5 in Grade 1 patients.

116
Figure 4.2.13. CHRNA5 expression based on therapy status with grade. A) GSE4922, all
patients were ER+ and endocrine therapy was applied. B) GSE6532, the ER status of patients
was unknown + and tamoxifen treatment was applied. * indicate p<0.05.
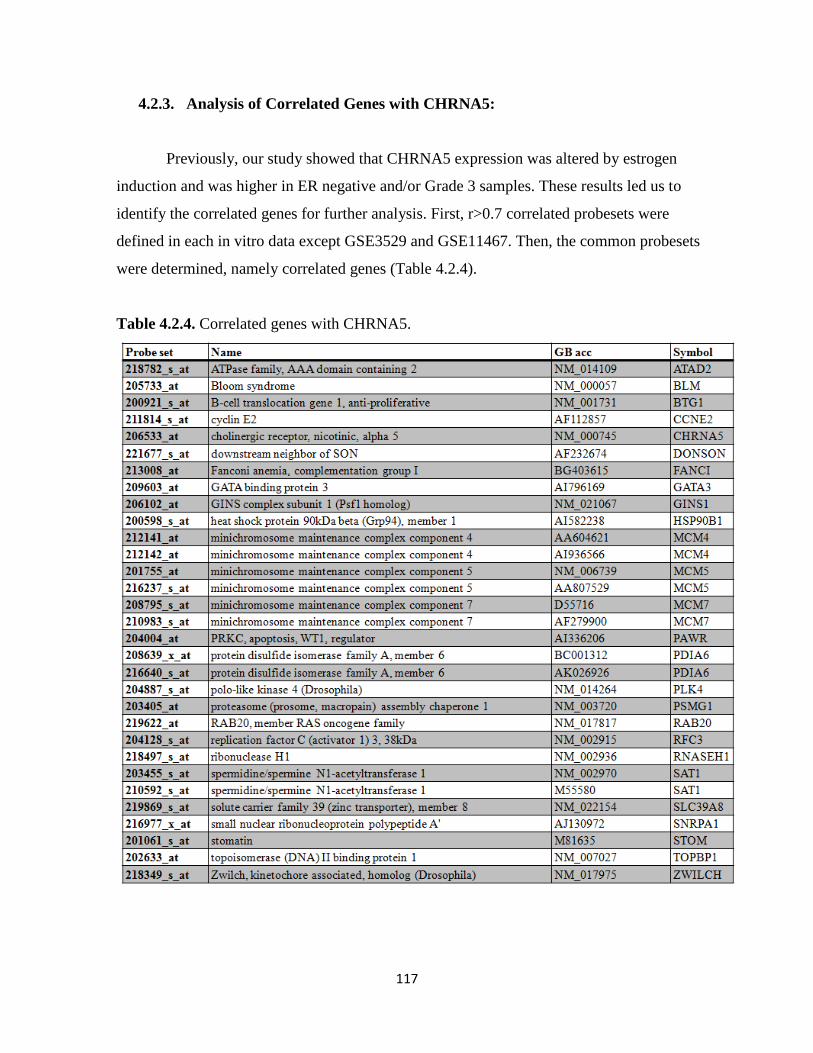
117
4.2.3. Analysis of Correlated Genes with CHRNA5:
Previously, our study showed that CHRNA5 expression was altered by estrogen
induction and was higher in ER negative and/or Grade 3 samples. These results led us to
identify the correlated genes for further analysis. First, r>0.7 correlated probesets were
defined in each in vitro data except GSE3529 and GSE11467. Then, the common probesets
were determined, namely correlated genes (Table 4.2.4).
Table 4.2.4. Correlated genes with CHRNA5.
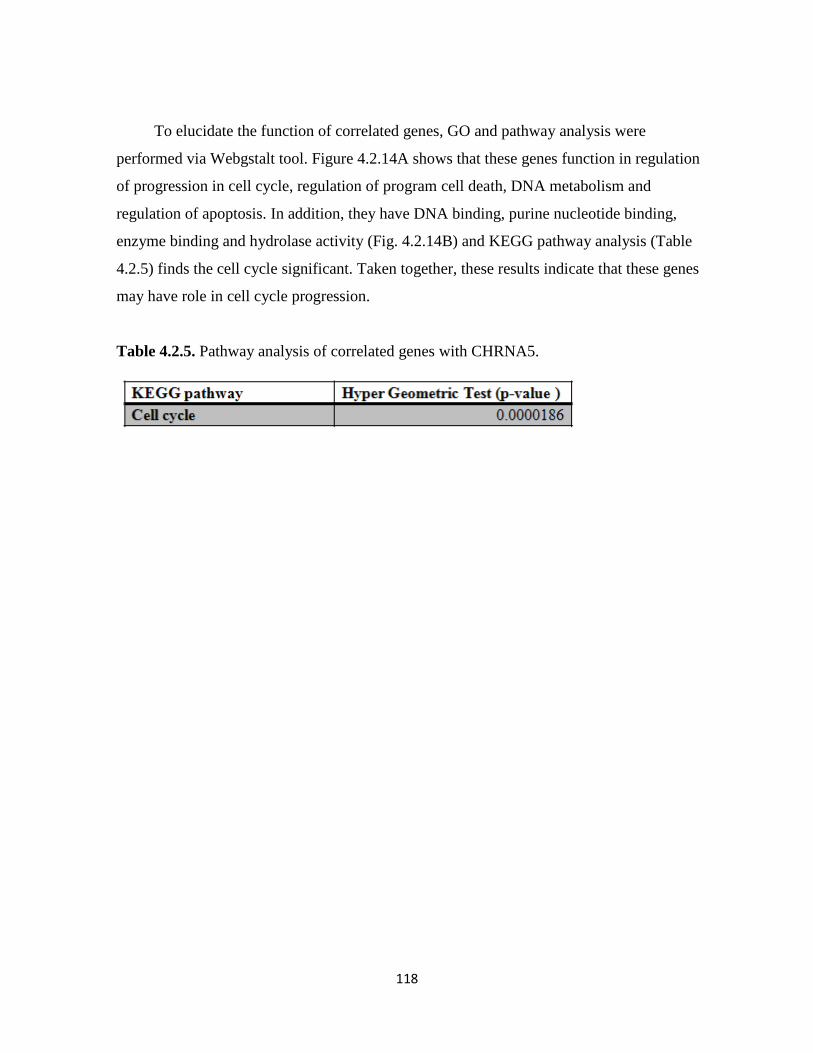
118
To elucidate the function of correlated genes, GO and pathway analysis were
performed via Webgstalt tool. Figure 4.2.14A shows that these genes function in regulation
of progression in cell cycle, regulation of program cell death, DNA metabolism and
regulation of apoptosis. In addition, they have DNA binding, purine nucleotide binding,
enzyme binding and hydrolase activity (Fig. 4.2.14B) and KEGG pathway analysis (Table
4.2.5) finds the cell cycle significant. Taken together, these results indicate that these genes
may have role in cell cycle progression.
Table 4.2.5. Pathway analysis of correlated genes with CHRNA5.

119
Figure 4.2.14. GO analysis of correlated genes. A) Biological Process level 6; B) Molecular
Function level 4 .Writings in red color indicates p<0.05 according to Hyper Geometric Test.

120
Apart from the GO analysis, binary tree class prediction analysis with these genes was
performed via BRB ArrayTool whether they can predict the different classes. Table 4.2.6
showed the results of prediction according to ER status. ER+ and ER- samples were
classified with an accuracy of about 80%. with these genes. Same analysis was performed to
classify the samples according to grade status. Table 4.2.7 demonstrated that Grade 1 and
Grade 3 samples were classified with accuracy of more than 75% with these genes but the
classification of Grade 2 samples was changed from datasets. All these results suggest that
the correlated genes may have role in cell cycle progression and have high prediction ability
to discriminate the ER+ /ER- and Grade 1/Grade 3 samples.
Table 4.2.6. Prediction analysis results for the correlated genes according to ER status.
Binary Tree Prediction via K-nearest neighbor k=3 method, p<0.05.
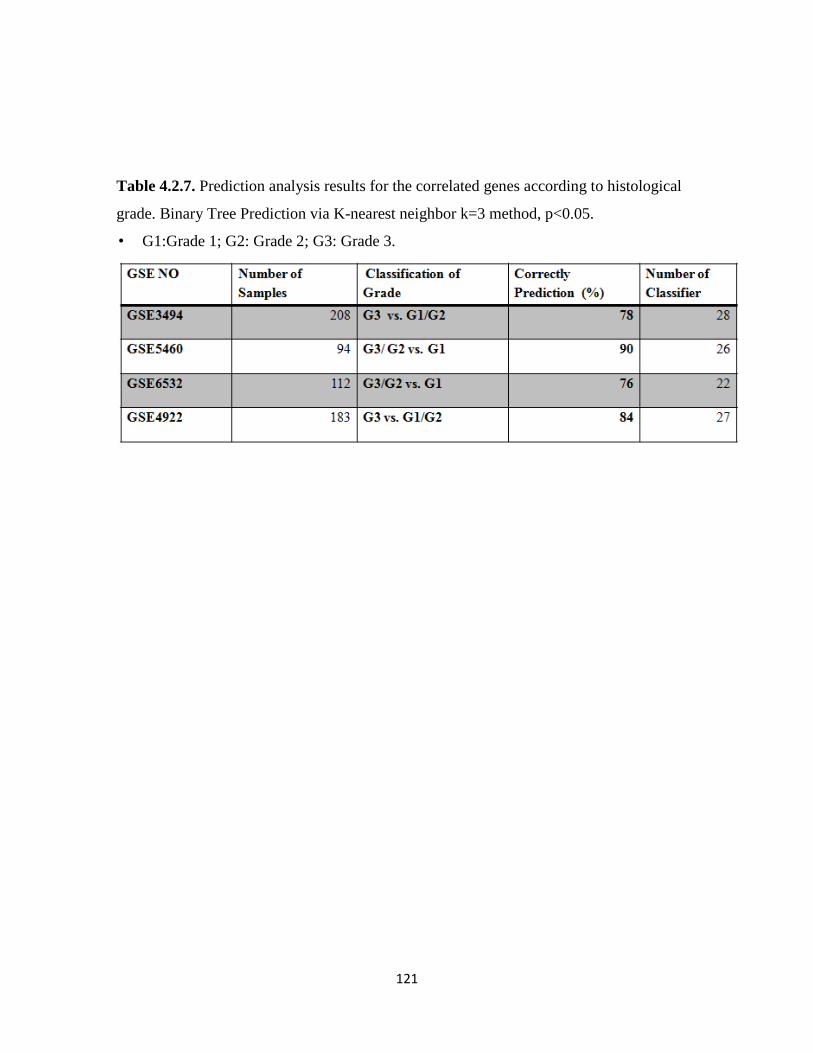
121
Table 4.2.7. Prediction analysis results for the correlated genes according to histological
grade. Binary Tree Prediction via K-nearest neighbor k=3 method, p<0.05.
• G1:Grade 1; G2: Grade 2; G3: Grade 3.
122
CHAPTER 5: CONCLUSIONGS AND DISCUSSION
5.1. Nicotine-mediated Signaling in MCF-7 Cells
Tobacco use is one of the biggest threats to human health. Cigarette smoking is
associated with close to 30% of all cancers; and for the lung, larynx and oral cancers this rate
is much higher. On the other hand, smoking is considered as a risk factor for multiple other
cancers, such as cancers of pancreas, liver, colon, and leukemia. Although nicotine is the
most potent addictive and signal modulatory component in cigarette smoke, it has not been
studied in detail in the context of breast cancers. Although it does not have carcinogenic
activity, recent studies suggest that nicotine interacts with nAChRs and causes an increase in
cell proliferation, tumor invasion and angiogenesis; in addition it has anti-apoptotic effects;
thereby functions as a tumor enhancer (Egleton, Brown et al. 2008). Smoking as a risk factor
for breast cancer is a controversial issue and only a few studies are present assessing the
effects of nicotine in breast cancer cell lines, which have led us to study the effect of nicotine
on breast cancer cells.
In this study, nicotine-modulated gene expression in MCF7 breast carcinoma cell line
was investigated. The subunits of α3, 5, 7, 9 and 10 and β1 and 4 nAChRs were found in
MCF7 cells (data not shown) (Guo, Ibaragi et al. 2008). First, the proliferative activity of
nicotine was examined under low and high serum concentrations. According to the MTT
assay results, 2 days of 1 μM nicotine treatment in the presence or absence of serum was
selected to assess the acute affect of nicotine in MCF7 cells. Second, since serum starvation
potentially leads to cell cycle arrest and/or induces apoptosis, the effect of nicotine in MCF7
cells were explored in terms of cell cycle process and apoptosis processes using molecular
markers at the protein level. Finally, to assess the effect of nicotine on transcriptome in a
genome-wide manner, microarray experiments were performed. Gene Ontology and pathway
analyses were used to identify the functions of these nicotine-modulated genes. In addition,
since nicotine exerts its biological activity via interaction with nAChRs, the effect of nicotine
on nAChR expression also was explored in the context of serum responsiveness and response

123
to nicotine. Our findings established that the effects of nicotine on MCF7 cells were
functionally extensive yet the changes in gene expression values were relatively mild. Serum
depletion in the presence or absence of nicotine, on the other hand, resulted in drastic
modulations in gene expression values, some of which could be reserved in the presence of
nicotine after 2 days.
Several studies show that nicotine accelerates the cell proliferation in normal and
cancer cells (Gotti and Clementi 2004; Dasgupta, Rastogi et al. 2006; Schuller 2007). To
explore the proliferative activity of nicotine in MCF7 cells, under physiological serum
conditions, we assessed the dose- and time-dependency of nicotine exposure; cells were
treated with different nicotine dose and for different time points; 0.1, 1 and 10 μM at 2, 3, 5
and 7 days. The MTT results showed that nicotine at the selected doses and time periods did
not induce the cell proliferation under physiological serum conditions. However, same dose
of nicotine effectively rescued the loss of cell proliferation in the absence of serum starting
from day 4 of the exposure. Guo et al. show that nicotine induces the cell proliferation in
0.5% serum after 3 days exposure, thereby supporting our findings (Guo, Ibaragi et al. 2008).
One of the outcomes of serum starvation is inhibition of the cell cycle progression.
Serum starvation is known to decrease the levels of expression of cyclin D1 and cyclin E
(Zerfass, Schulze et al. 1995; Kues, Anger et al. 2000; Cooper 2003; Demidenko and
Blagosklonny 2008). In addition, kinases associated with cyclins D and E cause the
hyperphosphorylation of RB and hyperphosphorylated RB dissociates from E2F, thereby
leading to the activation of E2F-regulated proliferative promoters and facilitating the S-phase
entry (Stevaux, Dimova et al. 2002). Therefore, the presence of cyclins D1 and E are
essential for cell cycle progression. In the present study, we found that serum starvation led
to a reduction in cyclin E levels and expectedly upon exposure to nicotine cyclin E protein
levels increased. However, nicotine reduced the cyclin E levels under physiological serum
conditions due to an unknown reason. Nevertheless, since this experiment was performed
once, it should be repeated to come to a conclusion.
Dasgupta et al. have shown that nicotine leads to resistance to chemotherapeutic drug
induced-apoptosis. In addition, they have demonstrated that nicotine inhibits apoptosis via a
reduction in p53 (Dasgupta, Kinkade et al. 2006). Herein, effects of 1 μM nicotine under 10%

124
serum or 0.1% serum conditions were studied at the level of Bcl-xl and p53. Serum starvation
induced the expression of p53 while nicotine slightly decreased the p53 under serum
starvation. No significant changes were observed under physiological serum conditions.
Besides p53, nicotine induced the Bcl-xl expression at both serum levels though the increase
in serum starvation was slightly higher than that in the untreated cell, as expectedly. These
results suggest that proliferative and anti-apoptotic effects of nicotine was condition-
dependent, such that when the cell was insulted via reduction in growth factors, or increased
stress such as lack of nutrients and/or DNA damage, nicotine-modulated pathways might
likely to participate in restoring the cell’s proliferative capacity.
In connection with the results of MTT assays and Western blots of cyclin E, Bcl-xl, and
p53, the whole genome microarray results suggested that nicotine altered gene expression in
subtle manners. Although a large number of genes became modulated within 2 days of
exposure, the magnitude of alterations was low. This has been previously shown by several
studies performed in the rat brain and PC12 cells, such that most genes with altered
expressions did not go beyond 1.5 fold changes (Konu, Kane et al. 2001; Konu, Xu et al.
2004). However, as shown previously, we have found that nicotine significantly influenced
the diverse biological process such as regulation of cell adhesion, neuron differentiation,
regulation of cell differentiation, vasculogenesis, cell death, cell growth, cell proliferation,
regulation of metabolism, circadian rhytmn, and morphogenesis. In terms of Biocarta
pathway analysis, regulation of MAP kinase pathways through dual specific phosphatases,
IGF-1, EGF, and PDGF signaling pathways, caspase cascade in apoptosis, IL-6 signaling
pathway, also were found to be significantly modulated. Focal adhesion, colorectal cancer,
mTOR signaling pathways and nitrogen metabolism were identified according to the KEGG
pathway analysis. In addition to alterations in cell growth and proliferation, alterations in
growth factor signaling and dual specific phosphotases in the regulation of MAPK pathway
suggested that nicotine may alter the cell proliferation of MCF7 cells. On the other hand,
significant alterations in biological process, such as vasculogenesis, cell death and cell
adhesion as well as caspase cascade activity, focal adhesion and colorectal cancer signaling
pathways suggested that nicotine also might modulate the process of apoptosis, migration,
and angiogenesis. Taken together, all these results support the notion that nicotine alters the
proliferative, angiogenetic, migration, and apoptotic processes of the cells (Egleton, Brown et
125
al. 2008). Future studies are needed to show which of these processes and through what
mechanisms are modulated using studies focusing on phosphorylation status of the effector
proteins.
Several studies showed that nicotine leads to resistance against apoptosis induced by
extracellular stress stimuli such as opioids, UV radiation, Ca++ ionophores, neurotoxins, oxi-
dative stress and anticancer drugs and induce survival in lung cancer, oral cancer, and head
and neck cancer cells (Dasgupta, Kinkade et al. 2006; Zeidler, Albermann et al. 2007).
Therefore, herein, we provide preliminary information that starvation-induced stress (Cooper,
Hutchison et al. 2003) increased nicotine-induced modulation of gene expression when
compared with physiological serum conditions. According to GO analysis, differentially
expressed genes were involved in different kind of biological processes: notch signaling,
protein kinase pathway, stress activated protein kinase signaling pathway, positive regulation
of signal transduction, regulation of IκB kinase/NFκB cascade, apoptosis, regulation of
program cell death and negative regulation of progression through cell cycle. Caspase
cascade in apoptosis, role of mitochondria in apoptotic signaling, regulation of BAD
phosphorylation, ceramide signaling pathway (Shirakabe, Yamaguchi et al. 1997) found by
Biocarta pathway analysis, and apoptosis identified by KEGG pathway analysis
demonstrated that serum starvation might have induced the apoptotic signaling and nicotine
significantly altered a subset of these pathways. On the other hand, findings of the regulation
of I-κ B kinase/NFκB cascade and MAPK pathway identified by KEGG pathway analysis
suggest that nicotine might play key roles in cell proliferation as well as cell death (Santen,
Song et al. 2002). Apart from these pathways, focal adhesion, tight junctions (Sawada,
Murata et al. 2003), and VEGF signaling pathways significantly altered by nicotine suggest
roles for nicotine in cell migration (Yamamura, Amano et al. 1998; Cross and Claesson-
Welsh 2001; Wozniak, Modzelewska et al. 2004). Thus, these results also support the recent
studies (Guo, Ibaragi et al. 2008; Dasgupta, Rizwani et al. 2009) implicating nicotine as an
inducer of cell migration in MCF7 cells.
Since nicotine have restored the level of cell proliferation back to normal levels at day 5
or later when treated with no serum, it was important to examine what serum depletion has
done to MCF7 cells. However our analyses have focused on effects of nicotine and serum at

126
day 2, at which cell proliferation was not seemingly affected either in the absence or presence
of nicotine. It is possible that our results showing transcriptional changes in the direction
closer to 10% serum level transcriptome might represent a small modulation towards the
protective effects of nicotine. In the light of these, GO analysis demonstrated that this gene
set functioned in protein kinase pathway, stress activated protein kinase signaling pathway,
positive regulation of signal transduction, regulation of IκB kinase/ NFκB cascade, apoptosis,
regulation of program cell death, and negative regulation of progression through cell cycle.
Similar to previous analysis, caspase cascade in apoptosis, role of mitochondria in apoptotic
signaling, ceramide pathway and regulation of BAD phosphorylation from biocarta pathway
analysis are found significant. These results suggested that nicotine might alter the apoptotic
pathway and might prepare cells for recovery from serum-starvation induced stress. A greater
number of probesets changed in the direction of 10 % serum than opposite to 10% serum
transcriptome suggesting that nicotine might induce mild changes in the opposite direction of
serum starvation. In other words, for instance, when gene expression was higher under 10%
serum conditions, serum starvation led to a decrease but nicotine treatment under serum
starvation conditions led to either an increase reversing the effect of starvation. However,
these findings depended on a single replicate and thus were represented as fold changes. The
statistical significance of these fold changes should be confirmed using multiple replicates
from the Day2 serum starvation experiments. Furthermore, there might be differences
between Day2 and Day5, at which the effects of nicotine was more pronounced, therefore
expression profiling will be extended to Day5 to better understand the magnitude of
alterations and ability of nicotine to counteract changes taking place during serum starvation.
nAChR genes are likely to act in concert because they exist in pentamer combinations.
One possibility is that these genes also have similar expression patterns because of common
transcriptional regulation, at least for subsets of receptor subunits. Our findings indicated that
indeed they behaved similarly, yet the expression levels may not be significantly altered in
the presence of nicotine, although statistical tests are needed at the point upon increasing
sample size of the experiments. Yet a few of the subunits were highly responsive to lack of
serum. This suggested that serum depletion represented a modulator for the nAChR
signaling; nicotine in a dose dependent manner may or may not change the levels of these
subunits. The time period studied here was 2 days, which may not be adequate for the effects

127
on cell proliferation and apoptosis to completely show up. In fact, we have demonstrated that
at days 5 and 7, nicotine at even low concentrations was able to lead to an increase in cell
proliferation at 0.1% serum. The change in CHRNA4 expression was the most striking
finding although the level of modulation is less than the cut-off value, it was highly
significant. Since the heteromeric α4β2nAChR has a major inhibitory activity in cancer
development and progression (Schuller 2009), this decrease suggested that nicotine may have
role in cancer development via modulating the α4nAChR expression.
Since all changes reported in cholinergic receptors at the 0.1% serum levels represent
fold changes they have to be repeated using other microarray experiments and should be
confirmed using real-time RT-PCR measurements. However, CHRNA5, CHRNA10 and
CHRNB1 genes seemed to be modulated by serum to a greater extent. In addition, the
decrease in CHRNA5 was more than 2 fold. Since estrogen is one of the ingredients of the
fetal bovine serum and have a key role in breast cancer development, it is likely that nicotine-
modulated signaling cross-talks with estrogen modulated pathways. This finding together
with accumulating information on the polymorphism studies performed on CHRNA5
recently have lead us to examine the estrogen treated breast cancer cell microarray datasets
with respect to CHRNA5 expression modulation, as presented in later in the results.
In summary, our data showed that nicotine behaved differently under different serum
conditions and nicotine altered the multiple biological process in MCF7 cells including, cell
growth, apoptosis, cell proliferation, vasculogenesis. The abnormality of these biological
processes lead to the development and progression of cancer so our results supported the idea
that nicotine might carry a tumor-enhancer activity.

128
5.2. Involvement of Estrogen in CHRNA5 mRNA expression:
According to the American Cancer Society 2009 report, breast cancer is the most
frequently diagnosed cancer in women except the skin cancer (ACS 2009). Estrogen
hormone is strongly associated with the development and progression of the breast cancer
(Anderson 2002). Therefore, several studies have been performed to elucidate the estrogen
mechanisms in breast cancer. Since understanding of histological features and molecular
alterations in breast cancer is essential to find novel therapeutic approaches with higher
success in curing the disease, ER and histological grade status are some of factors to classify
the breast cancers. On the other hand, recent studies demonstrate the association of CHRNA5
with nicotine dependence and lung cancer risk (Falvella, Galvan et al. 2009; Wang, Cruchaga
et al. 2009). In addition, our gene expression analysis of nAChRs under different serum
conditions shows that serum starvation might reduce CHRNA5 expression. Estrogen is one
of the ingredients of serum suggesting that CHRNA5 might be regulated in a growth factor
dependent manner. Evidently, all these reasons lead us to re-analyze microarray data related
to estrogen treatment and ER.
In this study, our analysis implicated that estrogen induced the expression of CHRNA5.
This induction was dose-dependent at lower doses and time-dependent in short-time
exposure. In addition, CHRNA5 has been identified as a possible secondary target of
estrogen signaling. Estrogen-independent and anti-estrogen resistant cells had higher level of
CHRNA5 expression. According to primary tumor studies, higher level of CHRNA5
expression was observed in ER- patients. Therefore, estrogen might regulate the CHRNA5
expression and its deprivation eventually may lead to higher expression. Primary tumor
studies showed that Grade 3 tumors have higher CHRNA5 expression and hormone therapy
led to reduction in expression in Grade 1. Correlated genes functioning in cell cycle with high
predictive ability indicated that a high level of CHRNA5 expression may be associated with
Grade 3 since high mitotic activity also correlated with Grade 3 (Baak, Van Dop et al. 1985).
Interestingly, estrogen did not induce the expression of CHRNA5 in BT-474 cell line
(GSE3529). Wang et al. found that BT-474 was ER positive yet tamoxifen resistant cell line

129
(Wang, Yang et al. 2006). Therefore, these supported the results of OHT-resistant MCF7
cells (GSE5840) in which CHRNA5 expression did not change in response to estrogen in
tamoxifen-resistant cells.
Nakazawa and Ohno showed that estrogen and phyto-oestrogens led to desensitization
of α4β2nAChR by unknown mechanisms (Nakazawa and Ohno 2001). Our results show the
increase in the expression of CHRNA5 in response to estrogen. Indeed, the inclusion of
CHRNA5 subunit in α4β2 may lead to desensitization (Ramirez-Latorre, Yu et al. 1996).
Thus, estrogen may lead to desensitization of α4β2nAChR via increasing the CHRNA5
expression.
Hyperactive GFR and MAPK signaling is one of the reasons for the ER loss and
hormone therapy resistance in breast cancer (Holloway, Murthy et al. 2004; Creighton,
Cordero et al. 2006; Bayliss, Hilger et al. 2007; Lopez-Tarruella and Schiff 2007). Our
analysis indicated that CHRNA5 expression was higher in ER- patients and anti-estrogen
resistant MCF7 cells. Since it is known that the inclusion of CHRNA5 subunit in α3β4 or
α3β2 receptors may lead to functional changes including increased Ca++ permeability
(Gerzanich, Wang et al. 1998) it would be likely that higher expression of CHRNA5 may
lead to increased MAPK activity thereby, leading to hormone-resistancy and ER loss.
Our microarray meta-analysis studies provided valuable information about the
association of CHRNA5 with breast cancer; further molecular and functional analyses should
be performed to elucidate the mechanisms of CHNRA5 in breast cancer.

130
5.3. Future Perspectives:
In the present study, we have demonstrated that nicotine at 1uuM concentrations affects
cell proliferation in a dose and time dependent manner using MTT assays, and molecular
markers. Future studies will focus on understanding the nature of these proliferative effects.
We will investigate the change of expression at the protein level using known proliferative
and apoptotic markers. Furthermore, apoptosis assays will be used to detect whether the
reduction in proliferation is due to growth arrest and/or apoptosis. These studies will be
performed in a dose- and time-dependent manner.
The microarray experiments analyzed herein are preliminary since they included 1-2
replicates of each group. Studies are on going to increase the number of replications as well
as to extend the expression profiling to Day 5 of serum starvation, at which the effects of
nicotine were more prominent based on the MTT assay. Pathway analysis tools, such as
Pathway Miner will also be used to identify networks, consistently modulated at Day 2 and
Day 5 of serum starvation. Futhermore, a time course study of nicotine exposure at 10%
serum levels also will be analyzed together with the serum data to understand consistent
patterns of expression changes.
It is well known that nicotine exerts its proliferative activity via Ras and its downstream
effector Raf/MAP kinase activity (Egleton, Brown et al. 2008). Chu et al. indicate that long-
term nicotine exposure in mouse epithelial cells increases the RAS activity and RAF1
translocation to the plasma membrane despite no changes could be observed in expression
(Chu, Guo et al. 2005). In another study, nicotine enhances the kinase activity associated with
cyclins D and E thereby, leading to progression of cell cycle (Dasgupta, Rastogi et al. 2006)
Taken together, nicotine accelerates the cell proliferation via activating on different kinases.
MAPK pathways, found to be significantly modulated in our study might, provide a link to
the kinase activity induced by nicotine. The genes affected by nicotine and role in MAPK
pathway will be studied upon exposure to kinase inhibitors to elucidate better the
proliferative activity of nicotine on MCF7 cells.

131
Apart from the proliferative activity, nicotine induces the PI3K/AKT pathway,
PKC/RAF/MEK/ERK1 pathway or PKA and leads to phosphorylation of anti-apoptotic
protein bcl-2, pro-apoptotic proteins bad and bax and might protect cells from going through
apoptosis. Therefore, performing the experiments with these antibodies may give better
results about the effects of nicotine on apoptosis. On the other hand, GO and pathway
analysis showed that nicotine altered the caspase cascade activity. Thus, caspase assays will
be essential to illuminate the effect of nicotine in MCF7 cells under serum starvation
conditions.
Recent studies show nicotine affects migration in MCF7 cells (Guo, Ibaragi et al. 2008;
Dasgupta, Rizwani et al. 2009). We identified candidate genes involved in vasculogenesis,
focal adhesion, tight junction, and VEGF signaling pathways that are essential for cell
migration and metastatic process. Consequently, the metastatic effect of nicotine in MCF7
might be studied in the future by modulating levels of expression of these genes through
overexpression or siRNA applications.
In both 10% serum and 0.1% serum experiments, nicotine altered the gene expression
no more than 2.0 fold. Cells were treated with nicotine only for 2 days. In addition, our study
and Guo et al. demonstrated that the proliferative effect of nicotine took place after 3 days
(Guo, Ibaragi et al. 2008). Furthermore, MCF7 cells were maintained in DMEM medium
supplemented with 10% serum, 1% non-essential and 1% penicillin/streptomycin. Before
nicotine treatment, the cells were starved for 24 hr to minimize the heterogeneity caused by
the effects of growth factors and to obtain the synchronized cells. However, MCF7 cell line is
ER+ and estrogen leads to cell proliferation in this cell line. In addition, the estrogenic
activity of phenol red medium is well-known. Therefore, using phenol red medium might
have decreased the efficiency of our experiments. To sum up, cells grown in phenol-red free
media and longer exposure times to nicotine may lead to higher expression differences and
might give better resolution with respect to effects of nicotine on MCF7 cell proliferation and
apoptosis mechanisms.
Our study identified CHRNA5 as a target of estrogen signaling based on in vitro and in
vivo microarray studies. These studies can be extended and confirmed with an independent
set of breast tumors of different molecular subtypes using RT-PCR and antibodies.

132
Furthermore, microarray studies can be extended to those with data on prognosis of the
patients.
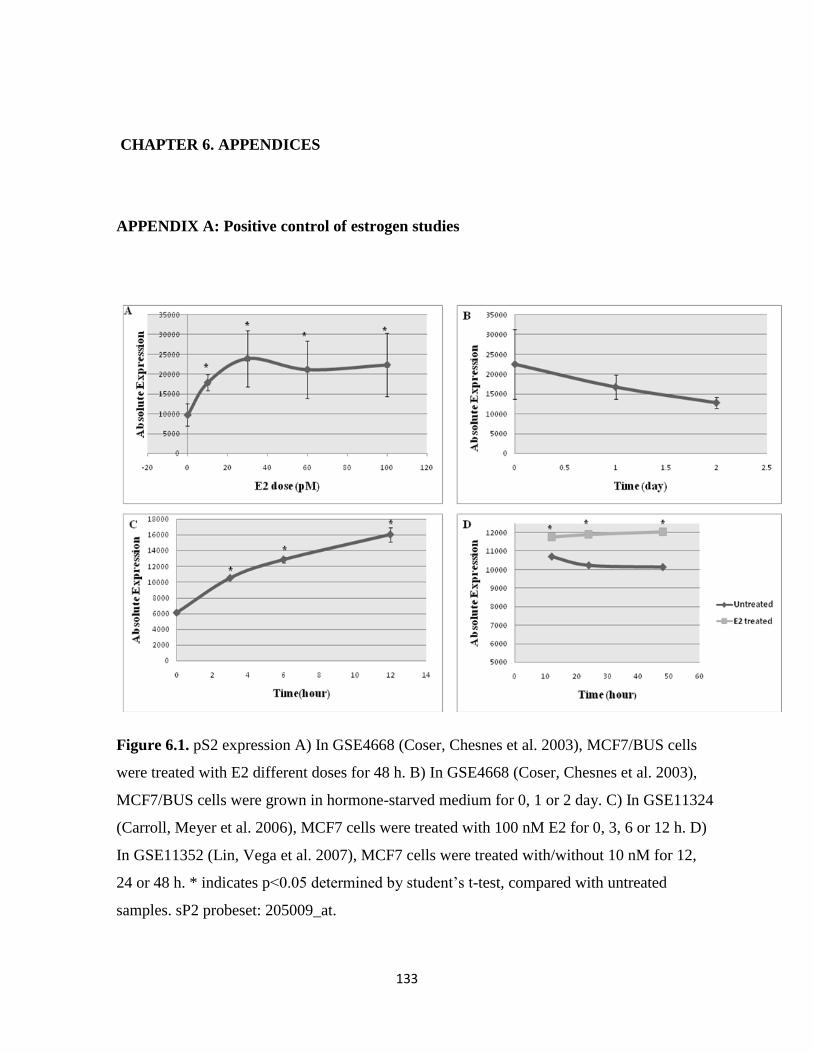
133
CHAPTER 6. APPENDICES
APPENDIX A: Positive control of estrogen studies
Figure 6.1. pS2 expression A) In GSE4668 (Coser, Chesnes et al. 2003), MCF7/BUS cells
were treated with E2 different doses for 48 h. B) In GSE4668 (Coser, Chesnes et al. 2003),
MCF7/BUS cells were grown in hormone-starved medium for 0, 1 or 2 day. C) In GSE11324
(Carroll, Meyer et al. 2006), MCF7 cells were treated with 100 nM E2 for 0, 3, 6 or 12 h. D)
In GSE11352 (Lin, Vega et al. 2007), MCF7 cells were treated with/without 10 nM for 12,
24 or 48 h. * indicates p<0.05 determined by student’s t-test, compared with untreated
samples. sP2 probeset: 205009_at.
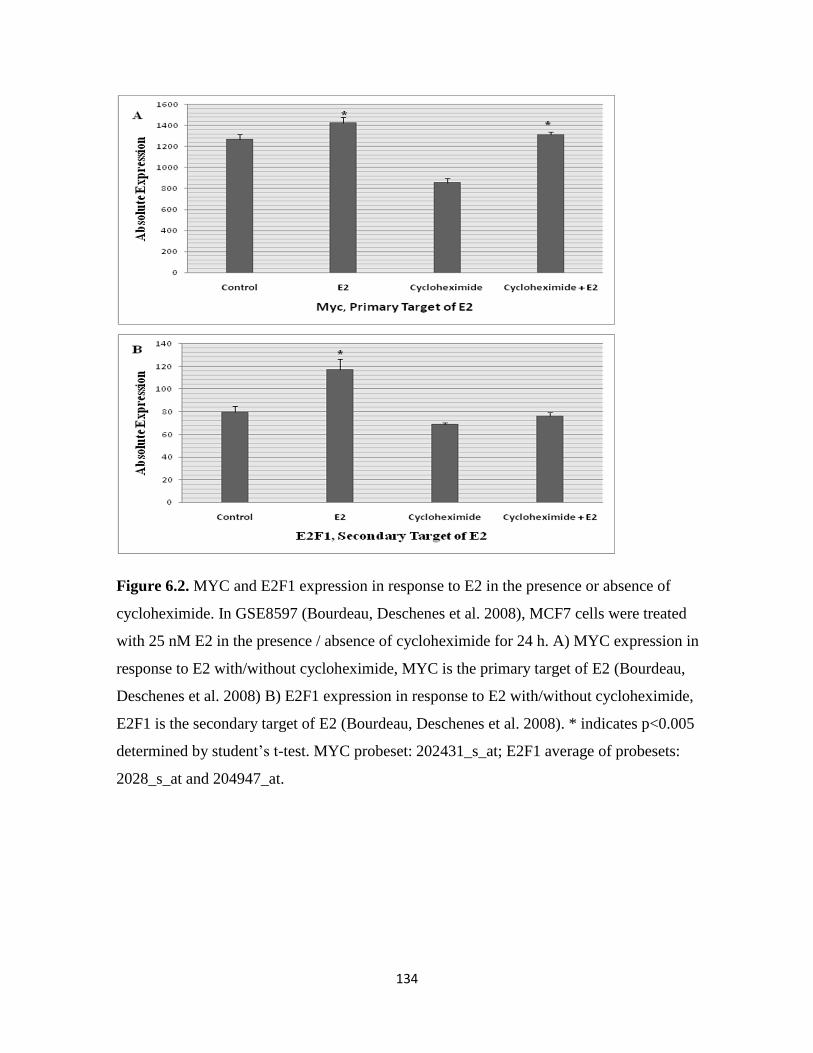
134
Figure 6.2. MYC and E2F1 expression in response to E2 in the presence or absence of
cycloheximide. In GSE8597 (Bourdeau, Deschenes et al. 2008), MCF7 cells were treated
with 25 nM E2 in the presence / absence of cycloheximide for 24 h. A) MYC expression in
response to E2 with/without cycloheximide, MYC is the primary target of E2 (Bourdeau,
Deschenes et al. 2008) B) E2F1 expression in response to E2 with/without cycloheximide,
E2F1 is the secondary target of E2 (Bourdeau, Deschenes et al. 2008). * indicates p<0.005
determined by student’s t-test. MYC probeset: 202431_s_at; E2F1 average of probesets:
2028_s_at and 204947_at.

135
Figure 6.3. MYC and E2F1 expression in response to E2 for 2 h. In GSE11467(Frasor 2008),
MCF7 cells were treated with 10 nM E2 for 2 h. A) MYC expression in response to E2. B)
E2F1 expression in response to E2. * indicates p<0.07 determined by student’s t-test. MYC
probeset: 202431_s_at; E2F1 average of probesets: 2028_s_at and 204947_at.

136
REFERENCES
ACS (2008). "Breast Cancer."
ACS (2009). "Cancer Facts and Figures."
Adams, B. D., H. Furneaux, et al. (2007). "The micro-ribonucleic acid (miRNA) miR-206 targets the
human estrogen receptor-alpha (ERalpha) and represses ERalpha messenger RNA and protein
expression in breast cancer cell lines." Mol Endocrinol 21(5): 1132-47.
Ahotupa, M., P. Hirsimaki, et al. (1994). "Alterations of drug metabolizing and antioxidant enzyme
activities during tamoxifen-induced hepatocarcinogenesis in the rat." Carcinogenesis 15(5): 863-
8.
Albrektsen, G., I. Heuch, et al. (1995). "Multiple births, sex of children and subsequent breast-cancer
risk for the mothers: a prospective study in Norway." Int J Cancer 60(3): 341-4.
Amos, C. I., X. Wu, et al. (2008). "Genome-wide association scan of tag SNPs identifies a susceptibility
locus for lung cancer at 15q25.1." Nat Genet 40(5): 616-22.
Anderson, T. J. (2002). "Breast cancer prognostication in the 21st century and the Nottingham
prognostic index." J Clin Pathol 55(2): 86-7.
Arredondo, J., A. I. Chernyavsky, et al. (2008). "Receptor-mediated tobacco toxicity: acceleration of
sequential expression of alpha5 and alpha7 nicotinic receptor subunits in oral keratinocytes
exposed to cigarette smoke." Faseb J 22(5): 1356-68.
Baak, J. P., H. Van Dop, et al. (1985). "The value of morphometry to classic prognosticators in breast
cancer." Cancer 56(2): 374-82.
Bai, Z. and R. Gust (2009). "Breast cancer, estrogen receptor and ligands." Arch Pharm (Weinheim)
342(3): 133-49.
Band, P. R., N. D. Le, et al. (2002). "Carcinogenic and endocrine disrupting effects of cigarette smoke
and risk of breast cancer." Lancet 360(9339): 1044-9.
Barakat, R. R. (1996). "Tamoxifen and endometrial neoplasia." Clin Obstet Gynecol 39(3): 629-40.
Barik, J. and S. Wonnacott (2006). "Indirect modulation by alpha7 nicotinic acetylcholine receptors of
noradrenaline release in rat hippocampal slices: interaction with glutamate and GABA systems
and effect of nicotine withdrawal." Mol Pharmacol 69(2): 618-28.
Bayliss, J., A. Hilger, et al. (2007). "Reversal of the estrogen receptor negative phenotype in breast
cancer and restoration of antiestrogen response." Clin Cancer Res 13(23): 7029-36.
Berger, F., F. H. Gage, et al. (1998). "Nicotinic receptor-induced apoptotic cell death of hippocampal
progenitor cells." J Neurosci 18(17): 6871-81.

137
Berrettini, W., X. Yuan, et al. (2008). "Alpha-5/alpha-3 nicotinic receptor subunit alleles increase risk for
heavy smoking." Mol Psychiatry 13(4): 368-73.
Beverage, J. N., T. M. Sissung, et al. (2007). "CYP2D6 polymorphisms and the impact on tamoxifen
therapy." J Pharm Sci 96(9): 2224-31.
Beyrouti, M. I., R. Beyrouti, et al. (2007). "[Breast cancer in men]." Presse Med 36(12 Pt 3): 1919-24.
Bierut, L. J., P. A. Madden, et al. (2007). "Novel genes identified in a high-density genome wide
association study for nicotine dependence." Hum Mol Genet 16(1): 24-35.
Bircan, S., N. Kapucuoglu, et al. (2006). "CD24 expression in ductal carcinoma in situ and invasive ductal
carcinoma of breast: an immunohistochemistry-based pilot study." Pathol Res Pract 202(8): 569-
76.
Boulter, J., A. O'Shea-Greenfield, et al. (1990). "Alpha 3, alpha 5, and beta 4: three members of the rat
neuronal nicotinic acetylcholine receptor-related gene family form a gene cluster." J Biol Chem
265(8): 4472-82.
Bourdeau, V., J. Deschenes, et al. (2008). "Mechanisms of primary and secondary estrogen target gene
regulation in breast cancer cells." Nucleic Acids Res 36(1): 76-93.
BrownLab "ER_MCF7_whole_human_genome ".
Caporaso, N., F. Gu, et al. (2009). "Genome-wide and candidate gene association study of cigarette
smoking behaviors." PLoS One 4(2): e4653.
Carroll, J. S., C. A. Meyer, et al. (2006). "Genome-wide analysis of estrogen receptor binding sites." Nat
Genet 38(11): 1289-97.
Castles, C. G., S. Oesterreich, et al. (1997). "Auto-regulation of the estrogen receptor promoter." J
Steroid Biochem Mol Biol 62(2-3): 155-63.
Catassi, A., D. Servent, et al. (2008). "Multiple roles of nicotine on cell proliferation and inhibition of
apoptosis: implications on lung carcinogenesis." Mutat Res 659(3): 221-31.
Chlebowski, R. T. (2005). "Bone health in women with early-stage breast cancer." Clin Breast Cancer 5
Suppl(2): S35-40.
Chu, M., J. Guo, et al. (2005). "Long-term exposure to nicotine, via ras pathway, induces cyclin D1 to
stimulate G1 cell cycle transition." J Biol Chem 280(8): 6369-79.
Chuaqui, R. F., R. F. Bonner, et al. (2002). "Post-analysis follow-up and validation of microarray
experiments." Nat Genet 32 Suppl: 509-14.
Clarke, R., M. C. Liu, et al. (2003). "Antiestrogen resistance in breast cancer and the role of estrogen
receptor signaling." Oncogene 22(47): 7316-39.
138
Colilla, S., P. W. Kantoff, et al. (2006). "The joint effect of smoking and AIB1 on breast cancer risk in
BRCA1 mutation carriers." Carcinogenesis 27(3): 599-605.
Conklin, B. S., W. Zhao, et al. (2002). "Nicotine and cotinine up-regulate vascular endothelial growth
factor expression in endothelial cells." Am J Pathol 160(2): 413-8.
Conroy, W. G., A. B. Vernallis, et al. (1992). "The alpha 5 gene product assembles with multiple
acetylcholine receptor subunits to form distinctive receptor subtypes in brain." Neuron 9(4):
679-91.
Conti-Fine, B. M., D. Navaneetham, et al. (2000). "Neuronal nicotinic receptors in non-neuronal cells:
new mediators of tobacco toxicity?" Eur J Pharmacol 393(1-3): 279-94.
Cooke, J. P. (2007). "Angiogenesis and the role of the endothelial nicotinic acetylcholine receptor." Life
Sci 80(24-25): 2347-51.
Cooper, B., D. Hutchison, et al. (2003). "Identification of rice (Oryza sativa) proteins linked to the cyclin-
mediated regulation of the cell cycle." Plant Mol Biol 53(3): 273-9.
Cooper, S. (2003). "Reappraisal of serum starvation, the restriction point, G0, and G1 phase arrest
points." Faseb J 17(3): 333-40.
Corringer, P. J., N. Le Novere, et al. (2000). "Nicotinic receptors at the amino acid level." Annu Rev
Pharmacol Toxicol 40: 431-58.
Coser, K. R., J. Chesnes, et al. (2003). "Global analysis of ligand sensitivity of estrogen inducible and
suppressible genes in MCF7/BUS breast cancer cells by DNA microarray." Proc Natl Acad Sci U S
A 100(24): 13994-9.
Coutts, A. S. and L. C. Murphy (1998). "Elevated mitogen-activated protein kinase activity in estrogen-
nonresponsive human breast cancer cells." Cancer Res 58(18): 4071-4.
Creighton, C. J., K. E. Cordero, et al. (2006). "Genes regulated by estrogen in breast tumor cells in vitro
are similarly regulated in vivo in tumor xenografts and human breast tumors." Genome Biol
7(4): R28.
Creighton, C. J., A. M. Hilger, et al. (2006). "Activation of mitogen-activated protein kinase in estrogen
receptor alpha-positive breast cancer cells in vitro induces an in vivo molecular phenotype of
estrogen receptor alpha-negative human breast tumors." Cancer Res 66(7): 3903-11.
Cross, M. J. and L. Claesson-Welsh (2001). "FGF and VEGF function in angiogenesis: signalling pathways,
biological responses and therapeutic inhibition." Trends Pharmacol Sci 22(4): 201-7.
Cucina, A., P. Sapienza, et al. (2000). "Nicotine induces platelet-derived growth factor release and
cytoskeletal alteration in aortic smooth muscle cells." Surgery 127(1): 72-8.

139
Culjkovic, B., K. Tan, et al. (2008). "The eIF4E RNA regulon promotes the Akt signaling pathway." J Cell
Biol 181(1): 51-63.
Dairkee, S. H., J. Seok, et al. (2008). "Bisphenol A induces a profile of tumor aggressiveness in high-risk
cells from breast cancer patients." Cancer Res 68(7): 2076-80.
Dasgupta, P. and S. P. Chellappan (2006). "Nicotine-mediated cell proliferation and angiogenesis: new
twists to an old story." Cell Cycle 5(20): 2324-8.
Dasgupta, P., R. Kinkade, et al. (2006). "Nicotine inhibits apoptosis induced by chemotherapeutic drugs
by up-regulating XIAP and survivin." Proc Natl Acad Sci U S A 103(16): 6332-7.
Dasgupta, P., S. Rastogi, et al. (2006). "Nicotine induces cell proliferation by beta-arrestin-mediated
activation of Src and Rb-Raf-1 pathways." J Clin Invest 116(8): 2208-2217.
Dasgupta, P., W. Rizwani, et al. (2009). "Nicotine induces cell proliferation, invasion and epithelial-
mesenchymal transition in a variety of human cancer cell lines." Int J Cancer 124(1): 36-45.
Dauvois, S., P. S. Danielian, et al. (1992). "Antiestrogen ICI 164,384 reduces cellular estrogen receptor
content by increasing its turnover." Proc Natl Acad Sci U S A 89(9): 4037-41.
Demidenko, Z. N. and M. V. Blagosklonny (2008). "Growth stimulation leads to cellular senescence
when the cell cycle is blocked." Cell Cycle 7(21): 3355-61.
Dewar, J. A., J. M. Horobin, et al. (1992). "Long term effects of tamoxifen on blood lipid values in breast
cancer." Bmj 305(6847): 225-6.
Easton, D., D. Ford, et al. (1993). "Inherited susceptibility to breast cancer." Cancer Surv 18: 95-113.
Easton, D. F., D. Ford, et al. (1995). "Breast and ovarian cancer incidence in BRCA1-mutation carriers.
Breast Cancer Linkage Consortium." Am J Hum Genet 56(1): 265-71.
Egleton, R. D., K. C. Brown, et al. (2008). "Nicotinic acetylcholine receptors in cancer: multiple roles in
proliferation and inhibition of apoptosis." Trends Pharmacol Sci 29(3): 151-8.
Elston, C. W. and I. O. Ellis (1990). "Pathology and breast screening." Histopathology 16(2): 109-18.
Eng, C. M., C. A. Kozak, et al. (1991). "Mapping of multiple subunits of the neuronal nicotinic
acetylcholine receptor to chromosome 15 in man and chromosome 9 in mouse." Genomics 9(2):
278-82.
Falvella, F. S., A. Galvan, et al. (2009). "Transcription deregulation at the 15q25 locus in association with
lung adenocarcinoma risk." Clin Cancer Res 15(5): 1837-42.
Fan, M., P. S. Yan, et al. (2006). "Diverse gene expression and DNA methylation profiles correlate with
differential adaptation of breast cancer cells to the antiestrogens tamoxifen and fulvestrant."
Cancer Res 66(24): 11954-66.

140
Fan, X., L. Shi, et al. (2009). "Investigation of reproducibility of differentially expressed genes in DNA
microarrays through statistical simulation." BMC Proc 3 Suppl 2: S4.
Fermentas.
Frasor, J. (2008). "Crosstalk between Estrogen and TNFalpha in MCF-7 Breast Cancer Cells."
Frasor, J., A. E. Weaver, et al. (2008). "Synergistic up-regulation of prostaglandin E synthase expression
in breast cancer cells by 17beta-estradiol and proinflammatory cytokines." Endocrinology
149(12): 6272-9.
Fuqua, S. A., C. Wiltschke, et al. (2000). "A hypersensitive estrogen receptor-alpha mutation in
premalignant breast lesions." Cancer Res 60(15): 4026-9.
Futreal, P. A., Q. Liu, et al. (1994). "BRCA1 mutations in primary breast and ovarian carcinomas."
Science 266(5182): 120-2.
Gal, D., S. Kopel, et al. (1991). "Oncogenic potential of tamoxifen on endometria of postmenopausal
women with breast cancer--preliminary report." Gynecol Oncol 42(2): 120-3.
Gayther, S. A., J. Mangion, et al. (1997). "Variation of risks of breast and ovarian cancer associated with
different germline mutations of the BRCA2 gene." Nat Genet 15(1): 103-5.
Gerzanich, V., F. Wang, et al. (1998). "alpha 5 Subunit alters desensitization, pharmacology, Ca++
permeability and Ca++ modulation of human neuronal alpha 3 nicotinic receptors." J Pharmacol
Exp Ther 286(1): 311-20.
Giacinti, L., P. P. Claudio, et al. (2006). "Epigenetic information and estrogen receptor alpha expression
in breast cancer." Oncologist 11(1): 1-8.
Goldhirsch, A., J. H. Glick, et al. (2005). "Meeting highlights: international expert consensus on the
primary therapy of early breast cancer 2005." Ann Oncol 16(10): 1569-83.
Goldhirsch, A., W. C. Wood, et al. (2007). "Progress and promise: highlights of the international expert
consensus on the primary therapy of early breast cancer 2007." Ann Oncol 18(7): 1133-44.
Gotti, C. and F. Clementi (2004). "Neuronal nicotinic receptors: from structure to pathology." Prog
Neurobiol 74(6): 363-96.
Greenbaum, L., K. Kanyas, et al. (2006). "Why do young women smoke? I. Direct and interactive effects
of environment, psychological characteristics and nicotinic cholinergic receptor genes." Mol
Psychiatry 11(3): 312-22, 223.
Grucza, R. A., J. C. Wang, et al. (2008). "A risk allele for nicotine dependence in CHRNA5 is a protective
allele for cocaine dependence." Biol Psychiatry 64(11): 922-9.

141
Guo, J., S. Ibaragi, et al. (2008). "Nicotine promotes mammary tumor migration via a signaling cascade
involving protein kinase C and CDC42." Cancer Res 68(20): 8473-81.
Gustafsson, J. A. (2003). "What pharmacologists can learn from recent advances in estrogen signalling."
Trends Pharmacol Sci 24(9): 479-85.
Hall, J. M., J. F. Couse, et al. (2001). "The multifaceted mechanisms of estradiol and estrogen receptor
signaling." J Biol Chem 276(40): 36869-72.
Hasan, N. M., G. E. Adams, et al. (1999). "Effect of serum starvation on expression and phosphorylation
of PKC-alpha and p53 in V79 cells: implications for cell death." Int J Cancer 80(3): 400-5.
Haviv, R., L. Lindenboim, et al. (1998). "Need for caspase-2 in apoptosis of growth-factor-deprived PC12
cells." J Neurosci Res 52(5): 491-7.
Heeschen, C., J. J. Jang, et al. (2001). "Nicotine stimulates angiogenesis and promotes tumor growth
and atherosclerosis." Nat Med 7(7): 833-9.
Heeschen, C., M. Weis, et al. (2002). "A novel angiogenic pathway mediated by non-neuronal nicotinic
acetylcholine receptors." J Clin Invest 110(4): 527-36.
Heeschen, C., M. Weis, et al. (2003). "Nicotine promotes arteriogenesis." J Am Coll Cardiol 41(3): 489-
96.
Heitjan, D. F., M. Guo, et al. (2008). "Identification of pharmacogenetic markers in smoking cessation
therapy." Am J Med Genet B Neuropsychiatr Genet 147B(6): 712-9.
Heldring, N., A. Pike, et al. (2007). "Estrogen receptors: how do they signal and what are their targets."
Physiol Rev 87(3): 905-31.
Herynk, M. H. and S. A. Fuqua (2004). "Estrogen receptor mutations in human disease." Endocr Rev
25(6): 869-98.
Hogg, R. C., B. Buisson, et al. (2005). "Allosteric modulation of ligand-gated ion channels." Biochem
Pharmacol 70(9): 1267-76.
Holloway, J. N., S. Murthy, et al. (2004). "A cytoplasmic substrate of mitogen-activated protein kinase is
responsible for estrogen receptor-alpha down-regulation in breast cancer cells: the role of
nuclear factor-kappaB." Mol Endocrinol 18(6): 1396-410.
Holst, F., P. R. Stahl, et al. (2007). "Estrogen receptor alpha (ESR1) gene amplification is frequent in
breast cancer." Nat Genet 39(5): 655-60.
Huang, H. J., J. D. Norris, et al. (2002). "Identification of a negative regulatory surface within estrogen
receptor alpha provides evidence in support of a role for corepressors in regulating cellular
responses to agonists and antagonists." Mol Endocrinol 16(8): 1778-92.

142
Hughes, T. R., C. J. Roberts, et al. (2000). "Widespread aneuploidy revealed by DNA microarray
expression profiling." Nat Genet 25(3): 333-7.
Hukkanen, J., P. Jacob, 3rd, et al. (2005). "Metabolism and disposition kinetics of nicotine." Pharmacol
Rev 57(1): 79-115.
Hung, R. J., J. D. McKay, et al. (2008). "A susceptibility locus for lung cancer maps to nicotinic
acetylcholine receptor subunit genes on 15q25." Nature 452(7187): 633-7.
Hurvitz, S. A. and R. J. Pietras (2008). "Rational management of endocrine resistance in breast cancer: a
comprehensive review of estrogen receptor biology, treatment options, and future directions."
Cancer 113(9): 2385-97.
IARC (2004). "International Agency for Research on Cancer, Tobacco smoking. IARC Mono-
graphs on the Evaluation of the Carcinogenic Risk of Chemicals to Humans." IARC vol. 83.
Ignatiadis, M. and C. Sotiriou (2008). "Understanding the molecular basis of histologic grade."
Pathobiology 75(2): 104-11.
imaginis.com "Histologic Grades of Breast Cancer: Helping Determine a Patient's Outcome."
Ivshina, A. V., J. George, et al. (2006). "Genetic reclassification of histologic grade delineates new
clinical subtypes of breast cancer." Cancer Res 66(21): 10292-301.
Iwase, H., J. M. Greenman, et al. (1995). "Loss of heterozygosity of the oestrogen receptor gene in
breast cancer." Br J Cancer 71(3): 448-50.
Jani, N. and M. D. Regueiro (2002). "Medical therapy for ulcerative colitis." Gastroenterol Clin North
Am 31(1): 147-66.
Jiang, S. Y., D. M. Wolf, et al. (1992). "An estrogen receptor positive MCF-7 clone that is resistant to
antiestrogens and estradiol." Mol Cell Endocrinol 90(1): 77-86.
Jin, Z., F. Gao, et al. (2004). "Nicotine induces multi-site phosphorylation of Bad in association with
suppression of apoptosis." J Biol Chem 279(22): 23837-44.
Jull, B. A., H. K. Plummer, 3rd, et al. (2001). "Nicotinic receptor-mediated activation by the tobacco-
specific nitrosamine NNK of a Raf-1/MAP kinase pathway, resulting in phosphorylation of c-myc
in human small cell lung carcinoma cells and pulmonary neuroendocrine cells." J Cancer Res Clin
Oncol 127(12): 707-17.
Kane, J. K., O. Konu, et al. (2004). "Nicotine coregulates multiple pathways involved in protein
modification/degradation in rat brain." Brain Res Mol Brain Res 132(2): 181-91.
Kato, S., H. Endoh, et al. (1995). "Activation of the estrogen receptor through phosphorylation by
mitogen-activated protein kinase." Science 270(5241): 1491-4.

143
Kawai, H. and D. K. Berg (2001). "Nicotinic acetylcholine receptors containing alpha 7 subunits on rat
cortical neurons do not undergo long-lasting inactivation even when up-regulated by chronic
nicotine exposure." J Neurochem 78(6): 1367-78.
Key, T. J., P. K. Verkasalo, et al. (2001). "Epidemiology of breast cancer." Lancet Oncol 2(3): 133-40.
Khuder, S. A., A. B. Mutgi, et al. (2001). "Smoking and breast cancer: a meta-analysis." Rev Environ
Health 16(4): 253-61.
Kim, M. J., Y. A. Yoo, et al. (2005). "Mitochondrial ribosomal protein L41 mediates serum starvation-
induced cell-cycle arrest through an increase of p21(WAF1/CIP1)." Biochem Biophys Res
Commun 338(2): 1179-84.
Konu, O., J. K. Kane, et al. (2001). "Region-specific transcriptional response to chronic nicotine in rat
brain." Brain Res 909(1-2): 194-203.
Konu, O., X. Xu, et al. (2004). "Application of a customized pathway-focused microarray for gene
expression profiling of cellular homeostasis upon exposure to nicotine in PC12 cells." Brain Res
Mol Brain Res 121(1-2): 102-13.
Kues, W. A., M. Anger, et al. (2000). "Cell cycle synchronization of porcine fetal fibroblasts: effects of
serum deprivation and reversible cell cycle inhibitors." Biol Reprod 62(2): 412-9.
Kunzelmann, K. (2005). "Ion channels and cancer." J Membr Biol 205(3): 159-73.
Kunzelmann, K., J. Sun, et al. (2005). "Control of ion transport in mammalian airways by protease
activated receptors type 2 (PAR-2)." Faseb J 19(8): 969-70.
Kushner, P. J., D. Agard, et al. (2000). "Oestrogen receptor function at classical and alternative response
elements." Novartis Found Symp 230: 20-6; discussion 27-40.
Kvale, G. (1992). "Reproductive factors in breast cancer epidemiology." Acta Oncol 31(2): 187-94.
Lambe, M., C. Hsieh, et al. (1996). "Maternal risk of breast cancer following multiple births: a
nationwide study in Sweden." Cancer Causes Control 7(5): 533-8.
Lang, K., T. L. t. Drell, et al. (2004). "Induction of a metastatogenic tumor cell type by neurotransmitters
and its pharmacological inhibition by established drugs." Int J Cancer 112(2): 231-8.
Le Marchand, L., K. S. Derby, et al. (2008). "Smokers with the CHRNA lung cancer-associated variants
are exposed to higher levels of nicotine equivalents and a carcinogenic tobacco-specific
nitrosamine." Cancer Res 68(22): 9137-40.
Lewis-Wambi, J. S., H. E. Cunliffe, et al. (2008). "Overexpression of CEACAM6 promotes migration and
invasion of oestrogen-deprived breast cancer cells." Eur J Cancer 44(12): 1770-9.

144
Li, M. D., O. Konu, et al. (2002). "Microarray technology and its application on nicotine research." Mol
Neurobiol 25(3): 265-85.
Lin, C. Y., V. B. Vega, et al. (2007). "Whole-genome cartography of estrogen receptor alpha binding
sites." PLoS Genet 3(6): e87.
Lindstrom, J., R. Anand, et al. (1996). "Structure and function of neuronal nicotinic acetylcholine
receptors." Prog Brain Res 109: 125-37.
Lock, C., G. Hermans, et al. (2002). "Gene-microarray analysis of multiple sclerosis lesions yields new
targets validated in autoimmune encephalomyelitis." Nat Med 8(5): 500-8.
Loi, S., B. Haibe-Kains, et al. (2007). "Definition of clinically distinct molecular subtypes in estrogen
receptor-positive breast carcinomas through genomic grade." J Clin Oncol 25(10): 1239-46.
Loi, S., B. Haibe-Kains, et al. (2008). "Predicting prognosis using molecular profiling in estrogen
receptor-positive breast cancer treated with tamoxifen." BMC Genomics 9: 239.
Lopez-Tarruella, S. and R. Schiff (2007). "The dynamics of estrogen receptor status in breast cancer: re-
shaping the paradigm." Clin Cancer Res 13(23): 6921-5.
Lu, C., Y. Shi, et al. (2008). "Serum starvation induces H2AX phosphorylation to regulate apoptosis via
p38 MAPK pathway." FEBS Lett 582(18): 2703-8.
Lukas, R. J., J. P. Changeux, et al. (1999). "International Union of Pharmacology. XX. Current status of
the nomenclature for nicotinic acetylcholine receptors and their subunits." Pharmacol Rev
51(2): 397-401.
MacGregor, J. I. and V. C. Jordan (1998). "Basic guide to the mechanisms of antiestrogen action."
Pharmacol Rev 50(2): 151-96.
Mai, H., W. S. May, et al. (2003). "A functional role for nicotine in Bcl2 phosphorylation and suppression
of apoptosis." J Biol Chem 278(3): 1886-91.
Massarweh, S. and R. Schiff (2006). "Resistance to endocrine therapy in breast cancer: exploiting
estrogen receptor/growth factor signaling crosstalk." Endocr Relat Cancer 13 Suppl 1: S15-24.
McDonald, C. C. and H. J. Stewart (1991). "Fatal myocardial infarction in the Scottish adjuvant
tamoxifen trial. The Scottish Breast Cancer Committee." Bmj 303(6800): 435-7.
McMillian, M., A. Y. Nie, et al. (2004). "A gene expression signature for oxidant stress/reactive
metabolites in rat liver." Biochem Pharmacol 68(11): 2249-61.
McPherson, K., C. M. Steel, et al. (2000). "ABC of breast diseases. Breast cancer-epidemiology, risk
factors, and genetics." Bmj 321(7261): 624-8.

145
Michiels, S., S. Koscielny, et al. (2005). "Prediction of cancer outcome with microarrays: a multiple
random validation strategy." Lancet 365(9458): 488-92.
Miklos, G. L. and R. Maleszka (2004). "Microarray reality checks in the context of a complex disease."
Nat Biotechnol 22(5): 615-21.
Mikula, M., M. Schreiber, et al. (2001). "Embryonic lethality and fetal liver apoptosis in mice lacking the
c-raf-1 gene." Embo J 20(8): 1952-62.
Ming, L., T. Sakaida, et al. (2008). "Sp1 and p73 activate PUMA following serum starvation."
Carcinogenesis 29(10): 1878-84.
Morimoto, N., S. Takemoto, et al. (2008). "Nicotine at a low concentration promotes wound healing." J
Surg Res 145(2): 199-204.
Murin, S. and J. Inciardi (2001). "Cigarette smoking and the risk of pulmonary metastasis from breast
cancer." Chest 119(6): 1635-40.
Murin, S., K. E. Pinkerton, et al. (2004). "The effect of cigarette smoke exposure on pulmonary
metastatic disease in a murine model of metastatic breast cancer." Chest 125(4): 1467-71.
Musgrove, E. A., C. M. Sergio, et al. (2008). "Identification of downstream targets of estrogen and c-
myc in breast cancer cells." Adv Exp Med Biol 617: 445-51.
Nakazawa, K. and Y. Ohno (2001). "Modulation by estrogens and xenoestrogens of recombinant human
neuronal nicotinic receptors." Eur J Pharmacol 430(2-3): 175-83.
Newhouse, P., A. Singh, et al. (2004). "Nicotine and nicotinic receptor involvement in neuropsychiatric
disorders." Curr Top Med Chem 4(3): 267-82.
Normanno, N., M. Di Maio, et al. (2005). "Mechanisms of endocrine resistance and novel therapeutic
strategies in breast cancer." Endocr Relat Cancer 12(4): 721-47.
Ntzani, E. E. and J. P. Ioannidis (2003). "Predictive ability of DNA microarrays for cancer outcomes and
correlates: an empirical assessment." Lancet 362(9394): 1439-44.
Nuttall, M. E., G. B. Stroup, et al. (2000). "Distinct mechanisms of action of selective estrogen receptor
modulators in breast and osteoblastic cells." Am J Physiol Cell Physiol 279(5): C1550-7.
Orr-Urtreger, A., M. Kedmi, et al. (2005). "Increased severity of experimental colitis in alpha 5 nicotinic
acetylcholine receptor subunit-deficient mice." Neuroreport 16(10): 1123-7.
Pawitan, Y., J. Bjohle, et al. (2004). "Gene expression profiling for prognosis using Cox regression." Stat
Med 23(11): 1767-80.
Pease, A. C., D. Solas, et al. (1994). "Light-generated oligonucleotide arrays for rapid DNA sequence
analysis." Proc Natl Acad Sci U S A 91(11): 5022-6.

146
Peto, R. and R. Doll (1992). "Smoking accepted on death certificates." Bmj 305(6857): 829-30.
Pink, J. J., S. Y. Jiang, et al. (1995). "An estrogen-independent MCF-7 breast cancer cell line which
contains a novel 80-kilodalton estrogen receptor-related protein." Cancer Res 55(12): 2583-90.
Porter, G. J., A. J. Evans, et al. (2004). "Patterns of metastatic breast carcinoma: influence of tumour
histological grade." Clin Radiol 59(12): 1094-8.
Prochazka, M., P. Hall, et al. (2005). "Ionizing radiation and tobacco use increases the risk of a
subsequent lung carcinoma in women with breast cancer: case-only design." J Clin Oncol 23(30):
7467-74.
Quik, M. and J. M. Kulak (2002). "Nicotine and nicotinic receptors; relevance to Parkinson's disease."
Neurotoxicology 23(4-5): 581-94.
Rae, J. M., M. D. Johnson, et al. (2005). "GREB 1 is a critical regulator of hormone dependent breast
cancer growth." Breast Cancer Res Treat 92(2): 141-9.
Ramirez-Latorre, J., C. R. Yu, et al. (1996). "Functional contributions of alpha5 subunit to neuronal
acetylcholine receptor channels." Nature 380(6572): 347-51.
Reid, G., S. Denger, et al. (2002). "Human estrogen receptor-alpha: regulation by synthesis,
modification and degradation." Cell Mol Life Sci 59(5): 821-31.
Rigbi, A., K. Kanyas, et al. (2008). "Why do young women smoke? V. Role of direct and interactive
effects of nicotinic cholinergic receptor gene variation on neurocognitive function." Genes Brain
Behav 7(2): 164-72.
Roderick, H. L. and S. J. Cook (2008). "Ca2+ signalling checkpoints in cancer: remodelling Ca2+ for
cancer cell proliferation and survival." Nat Rev Cancer 8(5): 361-75.
Roy, T. S., J. E. Andrews, et al. (1998). "Nicotine evokes cell death in embryonic rat brain during
neurulation." J Pharmacol Exp Ther 287(3): 1136-44.
Russo, P., A. Catassi, et al. (2006). "Development of novel therapeutic strategies for lung cancer:
targeting the cholinergic system." Curr Med Chem 13(29): 3493-512.
Rutqvist, L. E. and A. Mattsson (1993). "Cardiac and thromboembolic morbidity among
postmenopausal women with early-stage breast cancer in a randomized trial of adjuvant
tamoxifen. The Stockholm Breast Cancer Study Group." J Natl Cancer Inst 85(17): 1398-406.
Sabbagh, M. N., R. J. Lukas, et al. (2002). "The nicotinic acetylcholine receptor, smoking, and
Alzheimer's disease." J Alzheimers Dis 4(4): 317-25.

147
Saccone, N. L., S. F. Saccone, et al. (2009). "Multiple distinct risk loci for nicotine dependence identified
by dense coverage of the complete family of nicotinic receptor subunit (CHRN) genes." Am J
Med Genet B Neuropsychiatr Genet 150B(4): 453-66.
Saccone, S. F., A. L. Hinrichs, et al. (2007). "Cholinergic nicotinic receptor genes implicated in a nicotine
dependence association study targeting 348 candidate genes with 3713 SNPs." Hum Mol Genet
16(1): 36-49.
Saito, M., D. O'Brien, et al. (2005). "Nicotine-induced sensitization in mice: changes in locomotor
activity and mesencephalic gene expression." Neurochem Res 30(8): 1027-35.
Salas, R., A. Orr-Urtreger, et al. (2003). "The nicotinic acetylcholine receptor subunit alpha 5 mediates
short-term effects of nicotine in vivo." Mol Pharmacol 63(5): 1059-66.
Saldanha, A. J. (2004). "Java Treeview--extensible visualization of microarray data." Bioinformatics
20(17): 3246-8.
Santen, R. J., R. X. Song, et al. (2002). "The role of mitogen-activated protein (MAP) kinase in breast
cancer." J Steroid Biochem Mol Biol 80(2): 239-56.
Sasco, A. J., M. B. Secretan, et al. (2004). "Tobacco smoking and cancer: a brief review of recent
epidemiological evidence." Lung Cancer 45 Suppl 2: S3-9.
Saville, B., M. Wormke, et al. (2000). "Ligand-, cell-, and estrogen receptor subtype (alpha/beta)-
dependent activation at GC-rich (Sp1) promoter elements." J Biol Chem 275(8): 5379-87.
Sawada, N., M. Murata, et al. (2003). "Tight junctions and human diseases." Med Electron Microsc
36(3): 147-56.
Schamberger, C. J., C. Gerner, et al. (2004). "bFGF rescues 423-cells from serum starvation-induced
apoptosis downstream of activated caspase-3." FEBS Lett 573(1-3): 19-25.
Schena, M., D. Shalon, et al. (1995). "Quantitative monitoring of gene expression patterns with a
complementary DNA microarray." Science 270(5235): 467-70.
Schevelbein, H., R. Eberhardt, et al. (1973). "Absorption of
nicotine through the oralmucosa-measurement of nicotine concentration in the
blood after application of nicotine and total particulate matter." Agents Actions 3.
Schiff, R., S. Massarweh, et al. (2003). "Breast cancer endocrine resistance: how growth factor signaling
and estrogen receptor coregulators modulate response." Clin Cancer Res 9(1 Pt 2): 447S-54S.
Schiff, R., S. A. Massarweh, et al. (2004). "Cross-talk between estrogen receptor and growth factor
pathways as a molecular target for overcoming endocrine resistance." Clin Cancer Res 10(1 Pt
2): 331S-6S.

148
Schlaepfer, I. R., N. R. Hoft, et al. (2008). "The genetic components of alcohol and nicotine co-addiction:
from genes to behavior." Curr Drug Abuse Rev 1(2): 124-34.
Schroth, W., L. Antoniadou, et al. (2007). "Breast cancer treatment outcome with adjuvant tamoxifen
relative to patient CYP2D6 and CYP2C19 genotypes." J Clin Oncol 25(33): 5187-93.
Schuller, H. M. (2007). "Neurotransmitter receptor-mediated signaling pathways as modulators of
carcinogenesis." Prog Exp Tumor Res 39: 45-63.
Schuller, H. M. (2009). "Is cancer triggered by altered signalling of nicotinic acetylcholine receptors?"
Nat Rev Cancer 9(3): 195-205.
Schuller, H. M., H. A. Al-Wadei, et al. (2008). "Gamma-aminobutyric acid, a potential tumor suppressor
for small airway-derived lung adenocarcinoma." Carcinogenesis 29(10): 1979-85.
Schuller, H. M., P. K. Tithof, et al. (1999). "The tobacco-specific carcinogen 4-(methylnitrosamino)-1-(3-
pyridyl)-1-butanone is a beta-adrenergic agonist and stimulates DNA synthesis in lung
adenocarcinoma via beta-adrenergic receptor-mediated release of arachidonic acid." Cancer Res
59(18): 4510-5.
Shang, Y. and M. Brown (2002). "Molecular determinants for the tissue specificity of SERMs." Science
295(5564): 2465-8.
Sharma, B. K., C. C. Smith, et al. (2006). "Aberrant DNA methylation silences the novel heat shock
protein H11 in melanoma but not benign melanocytic lesions." Dermatology 213(3): 192-9.
Sharma, G. and S. Vijayaraghavan (2002). "Nicotinic receptor signaling in nonexcitable cells." J
Neurobiol 53(4): 524-34.
Sheikh, M. S., M. Garcia, et al. (1994). "Why are estrogen-receptor-negative breast cancers more
aggressive than the estrogen-receptor-positive breast cancers?" Invasion Metastasis 14(1-6):
329-36.
Shin, J. S., S. W. Hong, et al. (2008). "Serum starvation induces G1 arrest through suppression of Skp2-
CDK2 and CDK4 in SK-OV-3 cells." Int J Oncol 32(2): 435-9.
Shin, V. Y. and C. H. Cho (2005). "Nicotine and gastric cancer." Alcohol 35(3): 259-64.
Shin, V. Y., W. K. Wu, et al. (2007). "Functional role of beta-adrenergic receptors in the mitogenic action
of nicotine on gastric cancer cells." Toxicol Sci 96(1): 21-9.
Shin, V. Y., W. K. Wu, et al. (2005). "Nicotine induces cyclooxygenase-2 and vascular endothelial growth
factor receptor-2 in association with tumor-associated invasion and angiogenesis in gastric
cancer." Mol Cancer Res 3(11): 607-15.
149
Shirakabe, K., K. Yamaguchi, et al. (1997). "TAK1 mediates the ceramide signaling to stress-activated
protein kinase/c-Jun N-terminal kinase." J Biol Chem 272(13): 8141-4.
Shtutman, M., T. Hershko, et al. (2003). "PKCeta associates with cyclin E/Cdk2 complex in serum-
starved MCF-7 and NIH-3T3 cells." Exp Cell Res 286(1): 22-9.
Simon, R., A. Lam, et al. (2007). "Analysis of Gene Expression Data Using BRB-Array Tools." Cancer
Inform 3: 11-7.
Simoncini, T., P. Mannella, et al. (2004). "Genomic and non-genomic effects of estrogens on endothelial
cells." Steroids 69(8-9): 537-42.
Sims, A. H., A. Howell, et al. (2007). "Origins of breast cancer subtypes and therapeutic implications."
Nat Clin Pract Oncol 4(9): 516-25.
Singh, A., A. Potter, et al. (2004). "Nicotinic acetylcholine receptor system and neuropsychiatric
disorders." IDrugs 7(12): 1096-103.
Sobel, A. and J. P. Changeux (1977). "Purification and characterization of the cholinergic receptor
protein in its membrane-bound and detergent-soluble forms from the electric organ of Torpedo
marmorata." Biochem Soc Trans 5(2): 511-4.
Solda, G., S. Boi, et al. (2005). "In vivo RNA-RNA duplexes from human alpha3 and alpha5 nicotinic
receptor subunit mRNAs." Gene 345(2): 155-64.
Song, P., H. S. Sekhon, et al. (2008). "Activated cholinergic signaling provides a target in squamous cell
lung carcinoma." Cancer Res 68(12): 4693-700.
Song, R. X., P. Fan, et al. (2006). "Role of receptor complexes in the extranuclear actions of estrogen
receptor alpha in breast cancer." Endocr Relat Cancer 13 Suppl 1: S3-13.
Song, R. X. and R. J. Santen (2006). "Membrane initiated estrogen signaling in breast cancer." Biol
Reprod 75(1): 9-16.
Sotiriou, C., P. Wirapati, et al. (2006). "Gene expression profiling in breast cancer: understanding the
molecular basis of histologic grade to improve prognosis." J Natl Cancer Inst 98(4): 262-72.
Spitz, M. R., C. I. Amos, et al. (2008). "The CHRNA5-A3 region on chromosome 15q24-25.1 is a risk
factor both for nicotine dependence and for lung cancer." J Natl Cancer Inst 100(21): 1552-6.
Starink, T. M., J. P. van der Veen, et al. (1986). "The Cowden syndrome: a clinical and genetic study in
21 patients." Clin Genet 29(3): 222-33.
Stevaux, O., D. Dimova, et al. (2002). "Distinct mechanisms of E2F regulation by Drosophila RBF1 and
RBF2." Embo J 21(18): 4927-37.

150
Stevens, V. L., L. J. Bierut, et al. (2008). "Nicotinic receptor gene variants influence susceptibility to
heavy smoking." Cancer Epidemiol Biomarkers Prev 17(12): 3517-25.
Stewart, B. and P. Kleihues (2003). "World Cancer Report." IARCPress.
Stoner, M., B. Saville, et al. (2002). "Hypoxia induces proteasome-dependent degradation of estrogen
receptor alpha in ZR-75 breast cancer cells." Mol Endocrinol 16(10): 2231-42.
Stoughton, R. B. (2005). "Applications of DNA microarrays in biology." Annu Rev Biochem 74: 53-82.
Swaby, R. F., C. G. Sharma, et al. (2007). "SERMs for the treatment and prevention of breast cancer."
Rev Endocr Metab Disord 8(3): 229-39.
Swift, M., D. Morrell, et al. (1991). "Incidence of cancer in 161 families affected by ataxia-
telangiectasia." N Engl J Med 325(26): 1831-6.
Swift, M., P. J. Reitnauer, et al. (1987). "Breast and other cancers in families with ataxia-telangiectasia."
N Engl J Med 316(21): 1289-94.
Thiel, G., M. Ekici, et al. (2009). "Regulation of cellular proliferation, differentiation and cell death by
activated Raf." Cell Commun Signal 7: 8.
Thorgeirsson, T. E., F. Geller, et al. (2008). "A variant associated with nicotine dependence, lung cancer
and peripheral arterial disease." Nature 452(7187): 638-42.
Trombino, S., A. Cesario, et al. (2004). "Alpha7-nicotinic acetylcholine receptors affect growth
regulation of human mesothelioma cells: role of mitogen-activated protein kinase pathway."
Cancer Res 64(1): 135-45.
Tsai, J. R., I. W. Chong, et al. (2006). "Mitogen-activated protein kinase pathway was significantly
activated in human bronchial epithelial cells by nicotine." DNA Cell Biol 25(5): 312-22.
Tsuda, H. (2008). "Individualization of breast cancer based on histopathological features and molecular
alterations." Breast Cancer 15(2): 121-32.
Tsuda, H., C. Sakamaki, et al. (1998). "Prognostic significance of accumulation of gene and chromosome
alterations and histological grade in node-negative breast carcinoma." Jpn J Clin Oncol 28(1): 5-
11.
Valenca, S. S., A. de Souza da Fonseca, et al. (2004). "Lung morphometry and MMP-12 expression in
rats treated with intraperitoneal nicotine." Exp Toxicol Pathol 55(5): 393-400.
Villalobos, M., N. Olea, et al. (1995). "The E-screen assay: a comparison of different MCF7 cell stocks."
Environ Health Perspect 103(9): 844-50.
Wang, J. C., C. Cruchaga, et al. (2009). "Risk for nicotine dependence and lung cancer is conferred by
mRNA expression levels and amino acid change in CHRNA5." Hum Mol Genet 18(16): 3125-35.
151
Wang, L. H., X. Y. Yang, et al. (2006). "Disruption of estrogen receptor DNA-binding domain and related
intramolecular communication restores tamoxifen sensitivity in resistant breast cancer." Cancer
Cell 10(6): 487-99.
Wang, N., A. Orr-Urtreger, et al. (2002). "Autonomic function in mice lacking alpha5 neuronal nicotinic
acetylcholine receptor subunit." J Physiol 542(Pt 2): 347-54.
Waring, J. F., R. Ciurlionis, et al. (2001). "Microarray analysis of hepatotoxins in vitro reveals a
correlation between gene expression profiles and mechanisms of toxicity." Toxicol Lett 120(1-3):
359-68.
Weiss, R. B., T. B. Baker, et al. (2008). "A candidate gene approach identifies the CHRNA5-A3-B4 region
as a risk factor for age-dependent nicotine addiction." PLoS Genet 4(7): e1000125.
Wessler, I. and C. J. Kirkpatrick (2008). "Acetylcholine beyond neurons: the non-neuronal cholinergic
system in humans." Br J Pharmacol 154(8): 1558-71.
West, M., C. Blanchette, et al. (2001). "Predicting the clinical status of human breast cancer by using
gene expression profiles." Proc Natl Acad Sci U S A 98(20): 11462-7.
Williams, R. S., R. V. Shohet, et al. (1997). "A human protein related to yeast Cdc6p." Proc Natl Acad Sci
U S A 94(1): 142-7.
Wozniak, M. A., K. Modzelewska, et al. (2004). "Focal adhesion regulation of cell behavior." Biochim
Biophys Acta 1692(2-3): 103-19.
Xin, M. and X. Deng (2005). "Nicotine inactivation of the proapoptotic function of Bax through
phosphorylation." J Biol Chem 280(11): 10781-9.
Xin, M., F. Gao, et al. (2007). "Protein kinase Czeta abrogates the proapoptotic function of Bax through
phosphorylation." J Biol Chem 282(29): 21268-77.
Yamamura, M., Y. Amano, et al. (1998). "Calcium mobilization during nicotine-induced cell death in
human glioma and glioblastoma cell lines." Anticancer Res 18(4A): 2499-502.
Yang, X., D. L. Phillips, et al. (2001). "Synergistic activation of functional estrogen receptor (ER)-alpha by
DNA methyltransferase and histone deacetylase inhibition in human ER-alpha-negative breast
cancer cells." Cancer Res 61(19): 7025-9.
Ye, Y. N., E. S. Liu, et al. (2004). "Nicotine promoted colon cancer growth via epidermal growth factor
receptor, c-Src, and 5-lipoxygenase-mediated signal pathway." J Pharmacol Exp Ther 308(1): 66-
72.
Zeidler, R., K. Albermann, et al. (2007). "Nicotine and apoptosis." Apoptosis 12(11): 1927-43.

152
Zerfass, K., A. Schulze, et al. (1995). "Sequential activation of cyclin E and cyclin A gene expression by
human papillomavirus type 16 E7 through sequences necessary for transformation." J Virol
69(10): 6389-99.
Zhang, B., S. Kirov, et al. (2005). "WebGestalt: an integrated system for exploring gene sets in various
biological contexts." Nucleic Acids Res 33(Web Server issue): W741-8.
Zhu, W., A. Cowie, et al. (1996). "Bcl-2 mutants with restricted subcellular location reveal spatially
distinct pathways for apoptosis in different cell types." Embo J 15(16): 4130-41.