nielsen australian multi-screen report q2 2015 - oztam multi screen report q… · vimeo, facebook...
TRANSCRIPT

AUSTRALIAN MULTI-SCREENREPORT
Q U A R T E R 0 2 2 0 1 5
AUSTRALIAN MULTI-SCREEN REPORT QUARTER 2 2015 // c 2015 REGIONAL TAM, OZTAM, NIELSEN. ALL RIGHTS RESERVED. 02
Australian viewing trends across multiple screens
T he Q2 2015 edition of the Australian Multi-Screen Report provides the latest
estimates of technologies present in Australian homes and how people view broadcast television and other video. The report illustrates evolving audience behaviour amid the unprecedented choice Australians have in both the range of available content and means of accessing it.
It also provides the first by-age group look at time-shifted TV viewing that occurs between 8 and 28 days from original broadcast.
Trends evident in earlier editions of the report continue and include:
BROADCAST TELEVISION ACCOUNTS FOR THE MAJORITY OF VIEWING
• In Q2 2015 most of Australians’ viewing time went to broadcast television – free-to-air and subscription channels – watched on in-home TV sets:
• Each month 22.193 million Australians watched broadcast television.
• Each week broadcast television reached 88 per cent of Australians.
• Each day Australians on average watched just under 3 hours of broadcast television.
• Across all devices and screen
types 88 per cent of all video viewing is to broadcast television watched on in-home TV sets.
OVERALL, AUSTRALIANS CONTINUE TO SPEND THE BULK OF THEIR SCREEN TIME WITH THEIR TV SETS
• Similar to levels seen in earlier quarters, during Q2 2015, on average and across the whole day, 16.5 per cent of Australians were using their TV sets.
This translates to:
• an average 3.8 million Australians using their TV set for any purpose at any one minute across the day (2am-2am);
• an average 2.9 million Australians (12.6 per cent) using the TV at any minute across the day to view broadcast television;
• an average 7.9 million Australians (34.3 per cent) using their TV set for any purpose at any one minute during evenings (6pm-midnight), when TV use peaks.
• Other TV screen use is occurring
as Australians increasingly use their TV sets for purposes other than viewing live or playback television broadcasts as they adopt technologies and services including:
• internet-capable TVs;
• devices attached to the TV set such as PVRs/DVRs and games consoles; and
• over-the-top streaming video
and other content services.
AUSTRALIAN MULTI-SCREEN REPORT QUARTER 2 2015 // c 2015 REGIONAL TAM, OZTAM, NIELSEN. ALL RIGHTS RESERVED. 03
THE WAY PEOPLE USE THEIR TVS TO WATCH BROADCAST TELEVISION CONTINUES TO CHANGE
• In each of the past five years the proportion of time Australians spend watching live-to-air television (that is, at the time of original broadcast) has dropped gradually.
• People have been watching more time-shifted TV – that is, broadcast TV played back through the television at a later time.
• Live TV dominates, with 91 per cent of all broadcast TV viewed on television sets in Q2 2015 watched live-to-air.
AUSTRALIANS’ VIEWING OF VIDEO ON CONNECTED MOBILE DEVICES IS GROWING
• Across the population 12 per cent of all video viewing takes place on screens other than the TV. People under age 35 in particular are using internet-connected mobile devices to watch any video.
• This video viewing includes
television content viewed on broadcasters’ catch-up and streaming sites and apps as well as non-broadcast content.
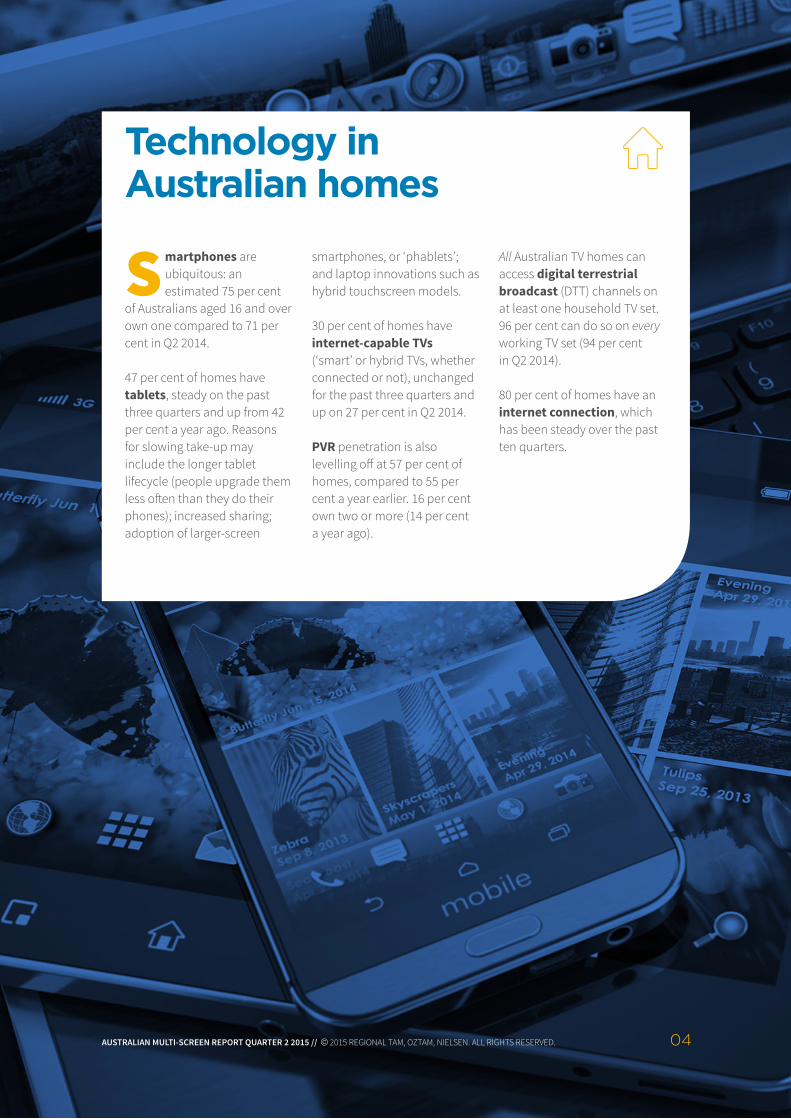
Technology in Australian homes
Smartphones are ubiquitous: an estimated 75 per cent
of Australians aged 16 and over own one compared to 71 per cent in Q2 2014.
47 per cent of homes have tablets, steady on the past three quarters and up from 42 per cent a year ago. Reasons for slowing take-up may include the longer tablet lifecycle (people upgrade them less often than they do their phones); increased sharing; adoption of larger-screen
smartphones, or ‘phablets’; and laptop innovations such as hybrid touchscreen models.
30 per cent of homes have internet-capable TVs (‘smart’ or hybrid TVs, whether connected or not), unchanged for the past three quarters and up on 27 per cent in Q2 2014.
PVR penetration is also levelling off at 57 per cent of homes, compared to 55 per cent a year earlier. 16 per cent own two or more (14 per cent a year ago).
All Australian TV homes can access digital terrestrial broadcast (DTT) channels on at least one household TV set. 96 per cent can do so on every working TV set (94 per cent in Q2 2014).
80 per cent of homes have an internet connection, which has been steady over the past ten quarters.
04AUSTRALIAN MULTI-SCREEN REPORT QUARTER 2 2015 // c 2015 REGIONAL TAM, OZTAM, NIELSEN. ALL RIGHTS RESERVED.
AUSTRALIAN MULTI-SCREEN REPORT QUARTER 2 2015 // c 2015 REGIONAL TAM, OZTAM, NIELSEN. ALL RIGHTS RESERVED. 05
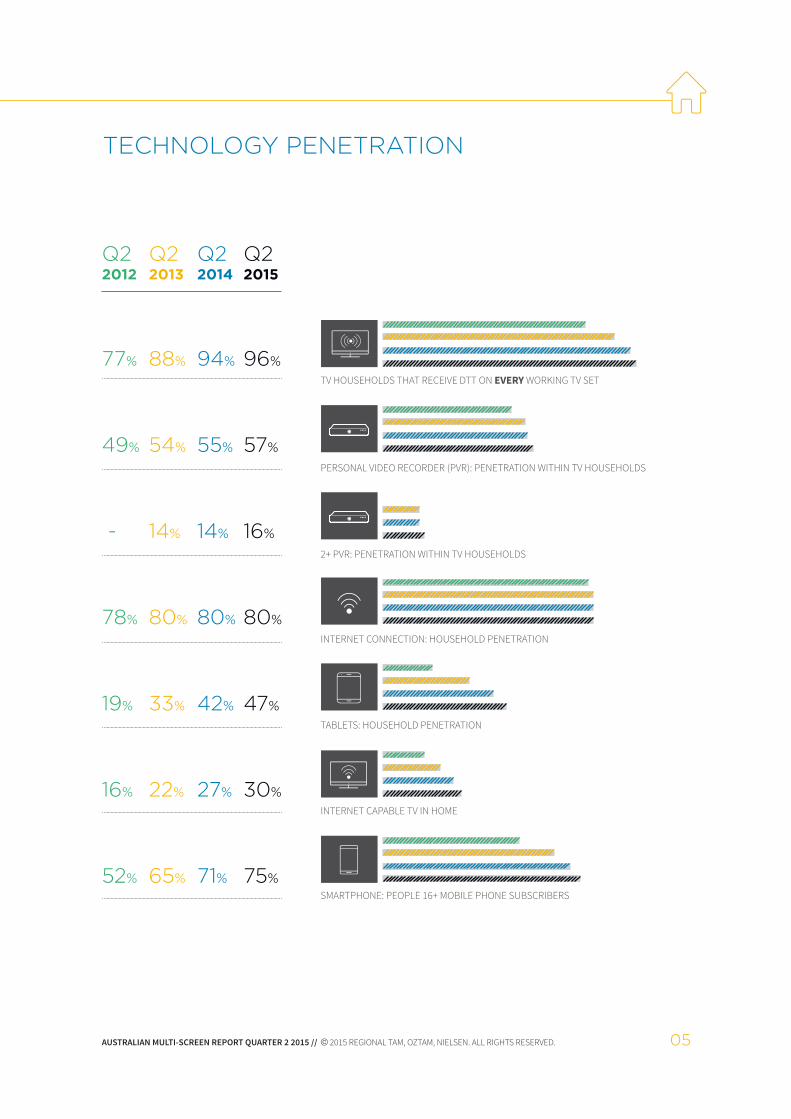
TECHNOLOGY PENETRATION
Q22012
77%
49%
-
78%
19%
16%
52%
Q22013
88%
54%
14%
80%
33%
22%
65%
Q22014
94%
55%
14%
80%
42%
27%
71%
Q22015
96%
57%
16%
80%
47%
30%
75%
TV HOUSEHOLDS THAT RECEIVE DTT ON EVERY WORKING TV SET
PERSONAL VIDEO RECORDER (PVR): PENETRATION WITHIN TV HOUSEHOLDS
2+ PVR: PENETRATION WITHIN TV HOUSEHOLDS
INTERNET CONNECTION: HOUSEHOLD PENETRATION
TABLETS: HOUSEHOLD PENETRATION
INTERNET CAPABLE TV IN HOME
SMARTPHONE: PEOPLE 16+ MOBILE PHONE SUBSCRIBERS

AUSTRALIAN MULTI-SCREEN REPORT QUARTER 2 2015 // c 2015 REGIONAL TAM, OZTAM, NIELSEN. ALL RIGHTS RESERVED. 06
Time spent viewing on televisions and other devices
T he take-up of mobile connected screens, internet-capable TVs and
technologies attached to the TV set have greatly expanded the options Australians have for viewing TV and other video.
As devices once novel are now commonplace, the time people apportion to them has shifted over the past few years.
In Q2 2015 Australians watched an average of 90 hours and 53 minutes (90:53) of broadcast television – free-to-air and subscription channels – on TV sets each month. This compares to 97:03 per month in Q2 2014 (down 6:10 year-on-year.)
82:42 (or 91 per cent) of that 90:53 was viewed live (at the time of broadcast.)
Broadcast TV played back through the TV set within seven days of original broadcast (‘playback’) grew by 13 minutes per month year-on-year to 8:11.
12 per cent of all video viewing (including broadcast and non-broadcast content) takes place on screens other than the TV.

AUSTRALIAN MULTI-SCREEN REPORT QUARTER 2 2015 // c 2015 REGIONAL TAM, OZTAM, NIELSEN. ALL RIGHTS RESERVED. 07
82:42WATCHING LIVE TV
8:11WATCHING PLAYBACK TV ON THE TV SET
VIDEO VIEWING, AVERAGE TIME SPENT PER MONTHTV // PC // SMARTPHONE // TABLET
Australians aged 2 and above spent 7 hours and 32 minutes (7:32) per month in Q2 2015 watching any online video on a PC or laptop, down from 8:08 a year earlier.
Such material includes streamed video, e.g., internet-delivered catch-up TV, and other content such as YouTube, Vimeo, Facebook and ABC iView.
Each month in the quarter Australians 2+ spent an average of 37:31 online on home and work computers (39:27 in Q2 2014).
Across the Australian online population aged 16 and above people claim to spend 2:47 per month watching any online video on a smartphone (Q4 2014).
Online Australians aged 16+ say they spend 2:03 watching any online video on a tablet each month (Q4 2014).
People of all age groups spend the majority of their video viewing time watching broadcast TV on in-home TV sets.
90:5388%
7:327.3%PC/ LAPTOP*ppl 2+
2:472.7%SMARTPHONE*ppl 16+Q4 2014
2:032.0%TABLET*ppl 16+Q4 2014

AUSTRALIAN MULTI-SCREEN REPORT QUARTER 2 2015 // c 2015 REGIONAL TAM, OZTAM, NIELSEN. ALL RIGHTS RESERVED. 08
WATCHING ANY ONLINE VIDEO ON PC/LAPTOP(P2+)
MONTH IN A LIFE TV // PC // LAPTOP // SMARTPHONE // TABLET
01
64:25 7:54 n.a. n.a.
38:31 3:39 14:08 7:28
41:34 14:58 8:30 3:13
65:52 7:37 4:36 4:10
92:54 7:34 1:53 1:50
126:13 7:06 0:23 0:46
152:363:350:050:30
90:53 7:32 2:47 2:03
KIDS
TEENS
P18-24
P25-34
P35-49
P50-64
P65+
ALLPEOPLE
WATCHING ANY ONLINE VIDEO ONA SMARTPHONE(P16+)Q4 2014
WATCHING ANY ONLINE VIDEO ONA TABLET(P16+)Q4 2014
WATCHING TV IN THE HOME
AUSTRALIAN MULTI-SCREEN REPORT QUARTER 2 2015 // c 2015 REGIONAL TAM, OZTAM, NIELSEN. ALL RIGHTS RESERVED. 09
2.90.7
12.5
3.5
0.9
12.1
3.8
1.0
11.7
4.0
1.0
11.7
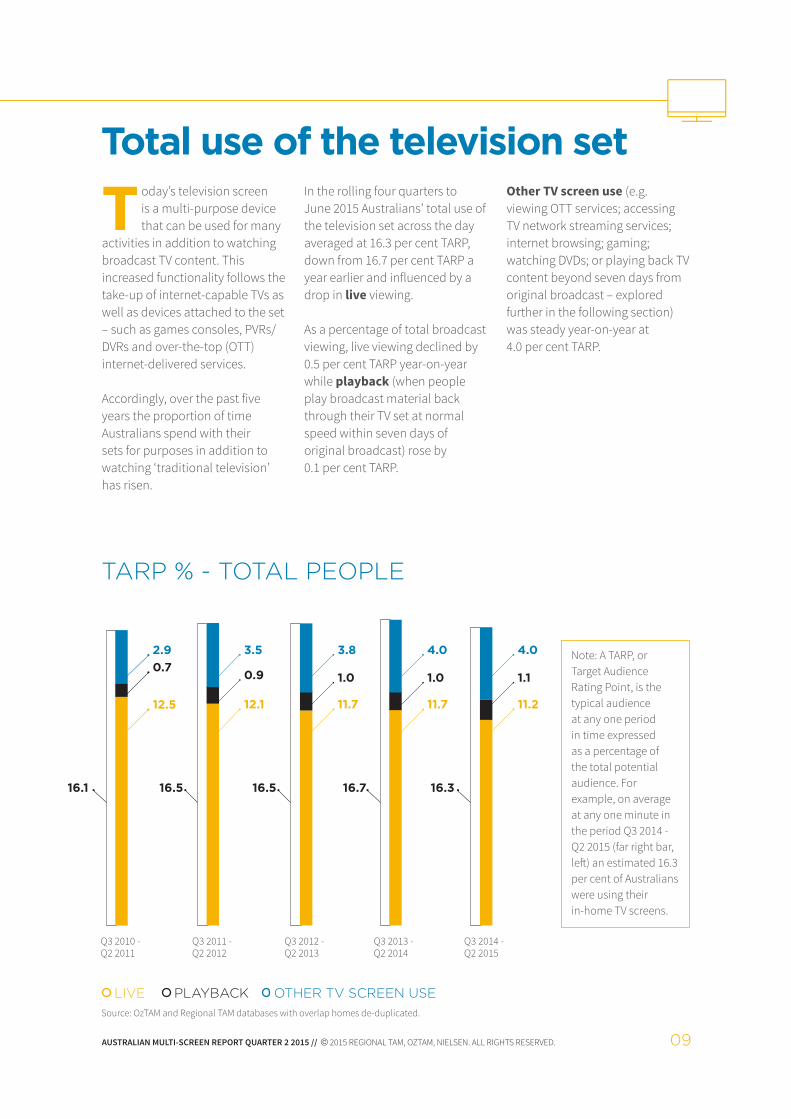
T oday’s television screen is a multi-purpose device that can be used for many
activities in addition to watching broadcast TV content. This increased functionality follows the take-up of internet-capable TVs as well as devices attached to the set – such as games consoles, PVRs/DVRs and over-the-top (OTT) internet-delivered services.
Accordingly, over the past five years the proportion of time Australians spend with their sets for purposes in addition to watching ‘traditional television’ has risen.
In the rolling four quarters to June 2015 Australians’ total use of the television set across the day averaged at 16.3 per cent TARP, down from 16.7 per cent TARP a year earlier and influenced by a drop in live viewing.
As a percentage of total broadcast viewing, live viewing declined by 0.5 per cent TARP year-on-year while playback (when people play broadcast material back through their TV set at normal speed within seven days of original broadcast) rose by 0.1 per cent TARP.
Other TV screen use (e.g. viewing OTT services; accessing TV network streaming services; internet browsing; gaming; watching DVDs; or playing back TV content beyond seven days from original broadcast – explored further in the following section) was steady year-on-year at 4.0 per cent TARP.
Total use of the television set
Note: A TARP, or Target Audience Rating Point, is the typical audience at any one period in time expressed as a percentage of the total potential audience. For example, on average at any one minute in the period Q3 2014 - Q2 2015 (far right bar, left) an estimated 16.3 per cent of Australians were using their in-home TV screens.
Source: OzTAM and Regional TAM databases with overlap homes de-duplicated.
TARP % - TOTAL PEOPLE
16.1
Q3 2010 -Q2 2011
Q3 2011 -Q2 2012
Q3 2012 -Q2 2013
Q3 2013 -Q2 2014
LIVE PLAYBACK OTHER TV SCREEN USE
4.0
1.1
11.2
Q3 2014 -Q2 2015
16.5 16.5 16.7 16.3

AUSTRALIAN MULTI-SCREEN REPORT QUARTER 2 2015 // c 2015 REGIONAL TAM, OZTAM, NIELSEN. ALL RIGHTS RESERVED. 10
While across the population other screen use was unchanged in the latest 12-month period, people under age 12 and 18-39s devoted a slightly higher percentage of their total time with the TV for such activity compared to the previous year (an additional 0.1 to 0.2 per cent TARP).
Other screen use among 13-17s and people 55+ dipped by 0.1 per cent TARP.
All major age groups spend most of their time with the TV screen watching broadcast television – either live or played back within seven days.
TARP % BY DEMOGRAPHIC
4.0
1.1
TOTALPEOPLE
P0-4 P5-12 P13-17 P18-39 P40-54 P55+
LIVE PLAYBACK OTHER TV SCREEN USE
Q3 2013-Q2 2014
4.0
1.0
4.4
0.8
4.3
0.7 4.1
0.6
3.9
0.54.0
0.6
4.1
0.7
4.6
0.9
4.5
0.9
4.1
1.3
4.1
1.2
3.2
1.5
3.3
1.4
11.211.7 9.610.1 7.07.3 4.95.7 7.78.4 12.713.6 17.617.7
LIVE PLAYBACK OTHER TV SCREEN USE
Q3 2014-Q2 2015

AUSTRALIAN MULTI-SCREEN REPORT QUARTER 2 2015 // c 2015 REGIONAL TAM, OZTAM, NIELSEN. ALL RIGHTS RESERVED. 11
Other screen use in Q2 2015
A cross the population other TV screen use rose by an average 2 hours
and 24 minutes (2:24) in Q2 2015 compared to the same quarter of 2014.
The drop in live viewing mentioned in the previous section in the rolling four quarters
through Q2 2015 was also evident in in the latest quarter. This saw total TV screen use fall by 3:26 year-on-year.
Q22014
Q22015
WATCHING TV IN THE HOME 97:03 90:53
Watching live TV 89:05 82:42
Watching playback* TV 7:58 8:11
Q22014
Q22015
TOTAL TV SCREEN USE 123:41 120:15
Watching live TV 89:05 82:42
Watching playback^ TV 8:18 8:51
Other screen use 26:18 28:42
* Playback ‘what watched’ TV || ^ Playback ‘when watched’ TV
EXPLAINING WHAT WATCHED AND WHEN WATCHED‘Total TV Screen Use’ – as detailed in the monthly time spent table above – does not equal the sum of ‘Watching TV in the home’ and ‘Other screen use’ because the playback base is different. ‘Total TV screen use’ = live + playback when watched (i.e., playback within seven days at the time it is actually viewed) + ‘Other screen use’. Watching TV in the home = live + playback of what is watched [i.e., viewing of broadcast content within seven days is attributed back to the time at which the program actually went to air (‘Consolidated’ viewing).] For example: Program X airs on Sundays at 20.30. A viewer watches this program at midday on Tuesday. In when watched, the playback activity would be at midday on Tuesday. In what watched, the playback viewing would be attributed back to 20.30 on Sunday.

AUSTRALIAN MULTI-SCREEN REPORT QUARTER 2 2015 // c 2015 REGIONAL TAM, OZTAM, NIELSEN. ALL RIGHTS RESERVED. 12
Playback viewing beyond seven days
A s shown earlier, other TV screen use has been increasing over the past
several years. During Q2 2015, Australians spent 28 hours and 42 minutes (28:42) per month using their TV sets for activities other than watching live or playing back TV broadcast within seven days.
One activity within this other use ‘bucket’ is viewing TV content between 8 and 28 days after the original broadcast (note: playback figures within OzTAM
and Regional TAM Consolidated data include only playback within 7 days).
The Q1 2015 edition of the Multi-Screen Report highlighted the steady increase over the past four years in the amount of time Australians spend engaging in this activity.
In the latest quarter Australians across the population spent an average 1:17 in each 28-day period viewing 8-28 day playback
content, accounting for a 1.52 per cent share of all viewing time across the day. This was slightly higher than the 1:10/1.38 per cent share seen in each 28-day period in Q1 2015.
Looking at major age groups, people aged 35 and over viewed the most 8-28 day content in the latest quarter **.
Average time spent viewing 8-28 day playback, 0200-2600 (HH:MM)
ALLPEOPLE KIDS TEENS P18-24 P25-34 P35-49 P50-64 P65+
**Q2 2015 1:17 1:06 0:40 0:39 1:03 1:33 1:36 1:38
**Q2 2015 = Periods 4 to 6 2015 (22 March - 13 June)

AUSTRALIAN MULTI-SCREEN REPORT QUARTER 2 2015 // c 2015 REGIONAL TAM, OZTAM, NIELSEN. ALL RIGHTS RESERVED. 13
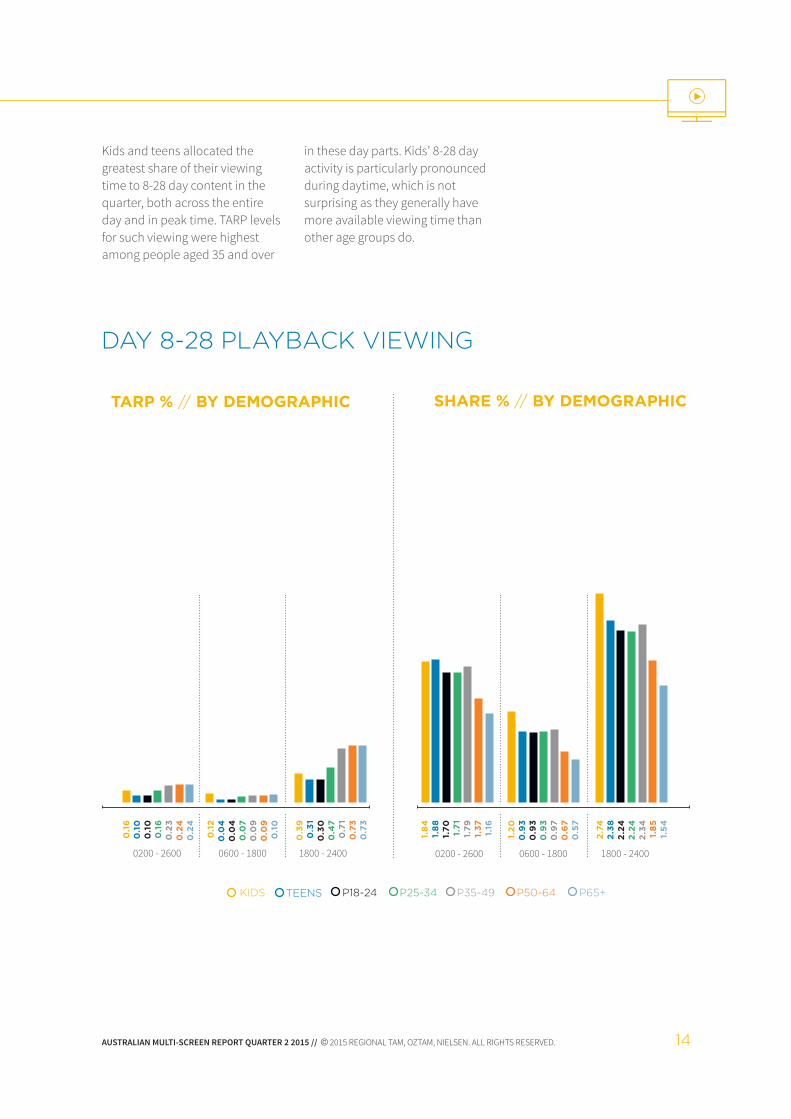
8-28 day playback activity is heaviest in prime time, similar to live and 7 day playback viewing patterns.
DAY 8-28 PLAYBACK VIEWING
TARP % // TOTAL PEOPLE
0200 - 2600 0600 - 1800 1800 - 2400 0200 - 2600 0600 - 1800 1800 - 2400
0.17 | 0.19 0.08 | 0.08 0.50 | 0.56 1.38 | 1.52 0.78 | 0.83 1.86 | 2.03
Q1 2015 Q2 2015
SHARE % // TOTAL PEOPLE
AUSTRALIAN MULTI-SCREEN REPORT QUARTER 2 2015 // c 2015 REGIONAL TAM, OZTAM, NIELSEN. ALL RIGHTS RESERVED. 14
Kids and teens allocated the greatest share of their viewing time to 8-28 day content in the quarter, both across the entire day and in peak time. TARP levels for such viewing were highest among people aged 35 and over
in these day parts. Kids’ 8-28 day activity is particularly pronounced during daytime, which is not surprising as they generally have more available viewing time than other age groups do.
0200 - 2600 0600 - 1800 1800 - 2400 0200 - 2600 0600 - 1800 1800 - 2400
0.1
60
.10
0.1
00
.16
0.2
30
.24
0.2
4
0.1
20
.04
0.0
40
.07
0.0
90
.09
0.1
0
0.3
90
.31
0.3
00
.47
0.7
10
.73
0.7
3
1.8
41.
88
1.70 1.7
11.
791.
37 1.16
1.20
0.9
30
.93
0.9
30
.97
0.6
70
.57
2.74
2.38
2.24
2.24
2.34
1.8
51.
54
KIDS TEENS P18-24 P25-34 P35-49 P50-64 P65+
DAY 8-28 PLAYBACK VIEWING
TARP % // BY DEMOGRAPHIC SHARE % // BY DEMOGRAPHIC
AUSTRALIAN MULTI-SCREEN REPORT QUARTER 2 2015 // c 2015 REGIONAL TAM, OZTAM, NIELSEN. ALL RIGHTS RESERVED. 15
KEY OBSERVATIONS
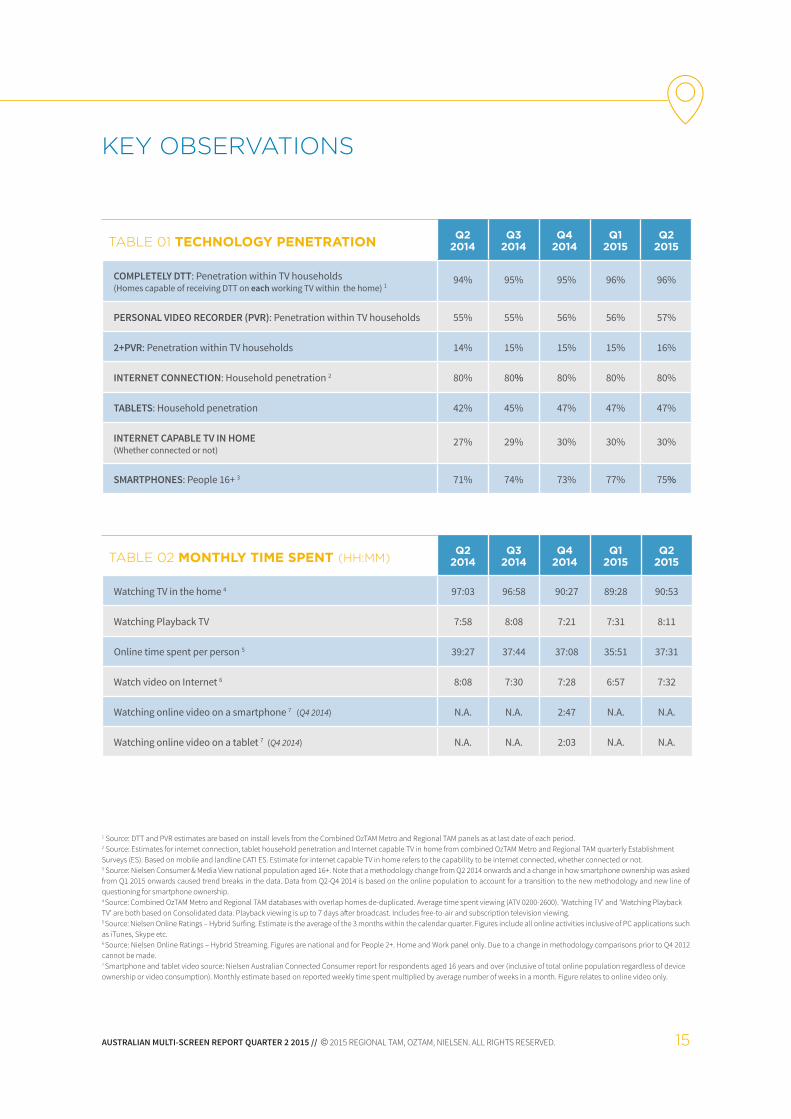
TABLE 01 TECHNOLOGY PENETRATION Q22014
Q32014
Q42014
Q12015
Q22015
COMPLETELY DTT: Penetration within TV households(Homes capable of receiving DTT on each working TV within the home) 1
94% 95% 95% 96% 96%
PERSONAL VIDEO RECORDER (PVR): Penetration within TV households 55% 55% 56% 56% 57%
2+PVR: Penetration within TV households 14% 15% 15% 15% 16%
INTERNET CONNECTION: Household penetration 2 80% 80% 80% 80% 80%
TABLETS: Household penetration 42% 45% 47% 47% 47%
INTERNET CAPABLE TV IN HOME(Whether connected or not)
27% 29% 30% 30% 30%
SMARTPHONES: People 16+ 3 71% 74% 73% 77% 75%
TABLE 02 MONTHLY TIME SPENT (HH:MM)Q2
2014Q3
2014Q4
2014Q1
2015Q2
2015
Watching TV in the home 4 97:03 96:58 90:27 89:28 90:53
Watching Playback TV 7:58 8:08 7:21 7:31 8:11
Online time spent per person 5 39:27 37:44 37:08 35:51 37:31
Watch video on Internet 6 8:08 7:30 7:28 6:57 7:32
Watching online video on a smartphone 7 (Q4 2014) N.A. N.A. 2:47 N.A. N.A.
Watching online video on a tablet 7 (Q4 2014) N.A. N.A. 2:03 N.A. N.A.
1 Source: DTT and PVR estimates are based on install levels from the Combined OzTAM Metro and Regional TAM panels as at last date of each period.2 Source: Estimates for internet connection, tablet household penetration and Internet capable TV in home from combined OzTAM Metro and Regional TAM quarterly EstablishmentSurveys (ES). Based on mobile and landline CATI ES. Estimate for internet capable TV in home refers to the capability to be internet connected, whether connected or not.3 Source: Nielsen Consumer & Media View national population aged 16+. Note that a methodology change from Q2 2014 onwards and a change in how smartphone ownership was asked from Q1 2015 onwards caused trend breaks in the data. Data from Q2-Q4 2014 is based on the online population to account for a transition to the new methodology and new line of questioning for smartphone ownership.4 Source: Combined OzTAM Metro and Regional TAM databases with overlap homes de-duplicated. Average time spent viewing (ATV 0200-2600). ‘Watching TV’ and ‘Watching PlaybackTV’ are both based on Consolidated data. Playback viewing is up to 7 days after broadcast. Includes free-to-air and subscription television viewing. 5 Source: Nielsen Online Ratings – Hybrid Surfing. Estimate is the average of the 3 months within the calendar quarter. Figures include all online activities inclusive of PC applications such as iTunes, Skype etc.6 Source: Nielsen Online Ratings – Hybrid Streaming. Figures are national and for People 2+. Home and Work panel only. Due to a change in methodology comparisons prior to Q4 2012 cannot be made.7 Smartphone and tablet video source: Nielsen Australian Connected Consumer report for respondents aged 16 years and over (inclusive of total online population regardless of deviceownership or video consumption). Monthly estimate based on reported weekly time spent multiplied by average number of weeks in a month. Figure relates to online video only.

AUSTRALIAN MULTI-SCREEN REPORT QUARTER 2 2015 // c 2015 REGIONAL TAM, OZTAM, NIELSEN. ALL RIGHTS RESERVED. 16
OVERALL USAGE (000S), MONTHLY REACH Q22014
Q32014
Q42014
Q12015
Q22015
Watching TV in the home 8 21,920 21,789 21,813 22,158 22,193
Watching Playback TV 11,210 11,352 11,469 11,769 12,226
Online unique audience 9 17,394 17,585 17,704 18,001 18,117
Watch video on Internet 10 13,516 13,377 13,288 13,343 13,711
Owning/using a smartphone 11 12,005 12,062 12,132 14,629 14,295
Watching online video on smartphone 12 (Q4 2014) N.A. N.A. 3,470 N.A. N.A.
Watching online video on tablet 12 (Q4 2014) N.A. N.A. 2,479 N.A. N.A.
TABLE 03
A MONTH IN THE LIFE – Q2 2015 KIDS13 TEENS14 P18-24 P25-34 P35-49 P50-64 P65+ ALLPEOPLE
Watching TV in the home 8
Q2 2014 64:2569:49
38:3146:44
41:3445:50
65:5277:56
92:54103:05
126:13130:21
152:36152:20
90:5397:03
Watching Playback TV Q2 2014
4:584:27
3:514:40
4:524:55
6:437:17
9:429:06
10:4910:59
11:5310:42
8:117:58
Online time spent per person 9 5:42 7:57 35:08 39:30 41:37 46:59 28:43 37:31
Watch video on Internet 10 7:54 3:39 14:58 7:37 7:34 7:06 3:35 7:32
Watching online video on a smartphone 15 (Q4 2014) N.A. 14:08 8:30 4:36 1:53 0:23 0:05 2:47
Watching online video on tablet 15 (Q4 2014) N.A. 7:28 3:13 4:10 1:50 0:46 0:30 2:03
TABLE 04
8 Source: Combined OzTAM Metro and Regional TAM databases with overlap homes de-duplicated. ‘Watching TV’ and ‘Watching Playback TV’ are both based on consolidated data (0200-2600). Playback viewing is up to 7 days after broadcast.9 Source: Nielsen Online Ratings – Hybrid Surfing. Estimate is the average of the 3 months within the calendar quarter. Figure includes all online activities inclusive of PC applications such as iTunes, Skype etc.10 Source: Nielsen Online Ratings – Hybrid Streaming. Figures are national and for People 2+. Home and Work panel only. Due to a change in methodology comparisons prior to Q4 2012 cannot be made.11 Source: Nielsen Consumer & Media View national population aged 16+. Note that a methodology change from Q2 2014 onwards and a change in how smartphone ownership was asked from Q1 2015 onwards caused trend breaks in the data. Data from Q2-Q4 2014 is based on the online population to account for a transition to the new methodology and new line of questioning for smartphone ownership.12 Nielsen Australian Connected Consumers report - national figures produced annually citing 21% of the online population aged 16+ for smartphone video and 15% for tablet video in 2014. Audience figure calculated using national online active audience of 16,524,000 from Nielsen Online Ratings (December 2014).13 Combined Metro OzTAM and Regional TAM data defines ‘Kids’ aged 0-12 and Nielsen Netview aged 2-11.14 Combined Metro OzTAM and Regional TAM data defines ‘Teens’ aged 13-17, Nielsen Netview aged 12-17 and Nielsen ACC aged 16-17.15 Smartphone and tablet video source: Nielsen Australian Connected Consumers report for respondents aged 16 years and over (inclusive of total online population regardless of deviceownership or video consumption). Monthly estimate based on reported weekly time spent multiplied by average number of weeks in a month. Figure relates to online video only.

AUSTRALIAN MULTI-SCREEN REPORT QUARTER 2 2015 // c 2015 REGIONAL TAM, OZTAM, NIELSEN. ALL RIGHTS RESERVED. 17
KIDS13 Q22014
Q32014
Q42014
Q12015
Q22015
Watching TV in the home 8 69:49 69:11 63:58 62:58 64:25
Watching Playback TV 4:27 4:48 4:34 4:38 4:58
Online time spent per person 9 7:27 4:56 4:52 4:40 5:42
Watch video on Internet 10 7:20 4:44 5:47 8:08 7:54
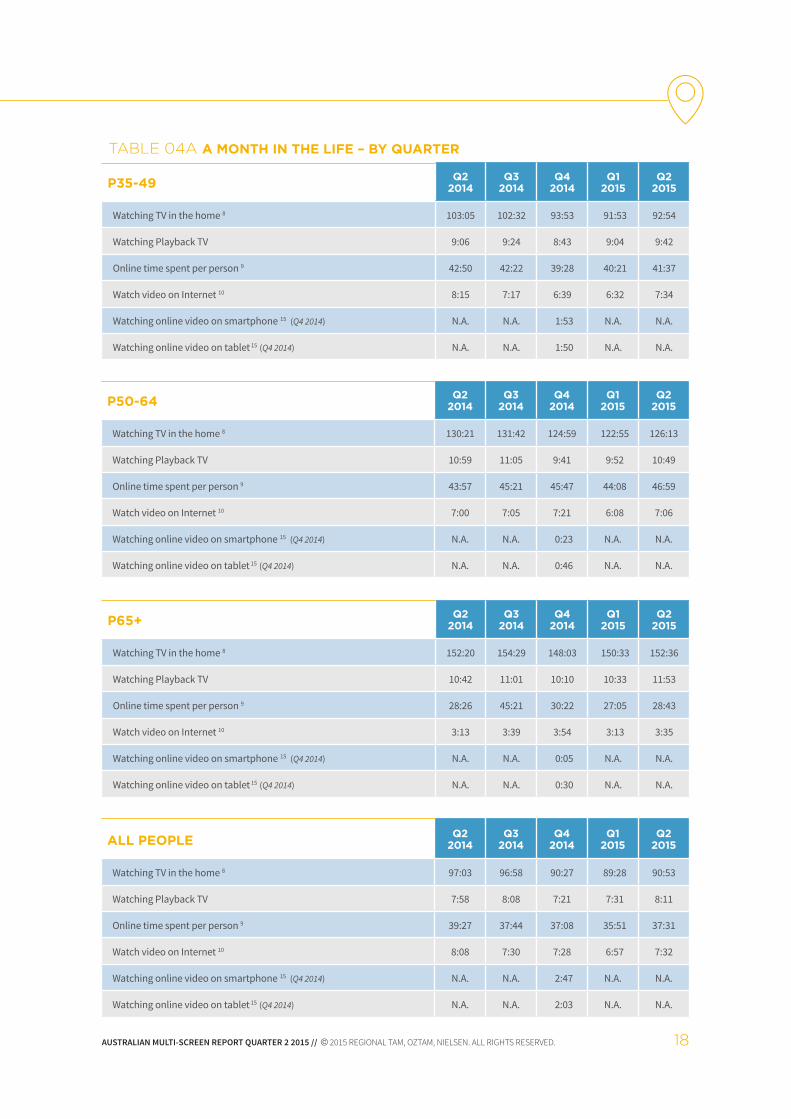
TABLE 04A A MONTH IN THE LIFE – BY QUARTER
TEENS14 Q22014
Q32014
Q42014
Q12015
Q22015
Watching TV in the home 8 46:44 47:20 43:07 37:55 38:31
Watching Playback TV 4:40 4:40 4:34 3:57 3:51
Online time spent per person 9 11:27 9:58 12:51 10:39 7:57
Watch video on Internet 10 6:33 5:28 7:02 6:07 3:39
Watching online video on smartphone 15 (Q4 2014) N.A. N.A. 14:08 N.A. N.A.
Watching online video on tablet 15 (Q4 2014) N.A. N.A. 7:28 N.A. N.A.
P18-24 Q22014
Q32014
Q42014
Q12015
Q22015
Watching TV in the home 8 45:50 44:23 40:02 40:03 41:34
Watching Playback TV 4:55 4:44 4:12 4:37 4:52
Online time spent per person 9 40:00 36:23 34:14 30:26 35:08
Watch video on Internet 10 13:02 9:09 10:56 11:11 14:58
Watching online video on smartphone 15 (Q4 2014) N.A. N.A. 8:30 N.A. N.A.
Watching online video on tablet 15 (Q4 2014) N.A. N.A. 3:13 N.A. N.A.
P25-34 Q22014
Q32014
Q42014
Q12015
Q22015
Watching TV in the home 8 77:56 75:45 68:21 66:36 65:52
Watching Playback TV 7:17 7:14 6:08 5:59 6:43
Online time spent per person 9 44:18 41:09 41:07 39:22 39:30
Watch video on Internet 10 9:49 7:17 9:41 9:00 7:37
Watching online video on smartphone 15 (Q4 2014) N.A. N.A. 4:36 N.A. N.A.
Watching online video on tablet 15 (Q4 2014) N.A. N.A. 4:10 N.A. N.A.
AUSTRALIAN MULTI-SCREEN REPORT QUARTER 2 2015 // c 2015 REGIONAL TAM, OZTAM, NIELSEN. ALL RIGHTS RESERVED.
P35-49 Q22014
Q32014
Q42014
Q12015
Q22015
Watching TV in the home 8 103:05 102:32 93:53 91:53 92:54
Watching Playback TV 9:06 9:24 8:43 9:04 9:42
Online time spent per person 9 42:50 42:22 39:28 40:21 41:37
Watch video on Internet 10 8:15 7:17 6:39 6:32 7:34
Watching online video on smartphone 15 (Q4 2014) N.A. N.A. 1:53 N.A. N.A.
Watching online video on tablet 15 (Q4 2014) N.A. N.A. 1:50 N.A. N.A.
18
TABLE 04A A MONTH IN THE LIFE – BY QUARTER
P50-64 Q22014
Q32014
Q42014
Q12015
Q22015
Watching TV in the home 8 130:21 131:42 124:59 122:55 126:13
Watching Playback TV 10:59 11:05 9:41 9:52 10:49
Online time spent per person 9 43:57 45:21 45:47 44:08 46:59
Watch video on Internet 10 7:00 7:05 7:21 6:08 7:06
Watching online video on smartphone 15 (Q4 2014) N.A. N.A. 0:23 N.A. N.A.
Watching online video on tablet 15 (Q4 2014) N.A. N.A. 0:46 N.A. N.A.
P65+ Q22014
Q32014
Q42014
Q12015
Q22015
Watching TV in the home 8 152:20 154:29 148:03 150:33 152:36
Watching Playback TV 10:42 11:01 10:10 10:33 11:53
Online time spent per person 9 28:26 45:21 30:22 27:05 28:43
Watch video on Internet 10 3:13 3:39 3:54 3:13 3:35
Watching online video on smartphone 15 (Q4 2014) N.A. N.A. 0:05 N.A. N.A.
Watching online video on tablet 15 (Q4 2014) N.A. N.A. 0:30 N.A. N.A.
ALL PEOPLE Q22014
Q32014
Q42014
Q12015
Q22015
Watching TV in the home 8 97:03 96:58 90:27 89:28 90:53
Watching Playback TV 7:58 8:08 7:21 7:31 8:11
Online time spent per person 9 39:27 37:44 37:08 35:51 37:31
Watch video on Internet 10 8:08 7:30 7:28 6:57 7:32
Watching online video on smartphone 15 (Q4 2014) N.A. N.A. 2:47 N.A. N.A.
Watching online video on tablet 15 (Q4 2014) N.A. N.A. 2:03 N.A. N.A.

AUSTRALIAN MULTI-SCREEN REPORT QUARTER 2 2015 // c 2015 REGIONAL TAM, OZTAM, NIELSEN. ALL RIGHTS RESERVED. 19
Q2 2015 KIDS TEENS P18-24 P25-34 P35-49 P50-64 P65+ FEMALES MALES
On Traditional TV 8
Q2 2014 12%12%
3%3%
4%5%
11%12%
21%22%
25%24%
25%23%
53%53%
47%47%
On Internet 10
Q2 20144%2%
5%3%
10%11%
18%19%
30%30%
23%24%
11%11%
50%49%
50%51%
TABLE 05 VIDEO AUDIENCE COMPOSITION (BY AGE AND GENDER)
AUSTRALIAN MULTI-SCREEN REPORT QUARTER 2 2015 // c 2015 REGIONAL TAM, OZTAM, NIELSEN. ALL RIGHTS RESERVED. 20
Explanatory Notes
• DTT and PVR penetration within TV households in Table 1 is based on panel install incidence rates from the combined OzTAM Metro and Regional TAM panels as at the last date of each period (Q1=end of P4, Q2=end of P7, Q3=end of P10, Q4=end of P13).
• Quarterly Establishment Survey waves are conducted within standard calendar quarters.
• National Establishment Survey (ES) estimates are based on combined OzTAM Metro and Regional TAM quarterly waves. Quarterly ES waves are conducted within standard calendar quarters.
• Playback mode is defined as television broadcast content recorded and viewed (played back) within seven days of the original broadcast time.
• Other Screen Use is TV screen use that excludes live and playback viewing of broadcast television within seven days of the original broadcast time. It can include non-broadcast activities such as gaming, online activity on the TV screen and playing back recorded TV content outside of the seven-day consolidation window.
• Please note ‘Total TV screen use’ does not equal the sum of ‘Watching TV in the home’ and ‘Other screen use’ because the playback base is different. ‘Total TV screen use’ = live + playback when watched (i.e., playback within seven days at the time it is actually viewed) +
‘Other screen use’. Watching TV in the home = live + playback of what is watched (viewing of broadcast content within seven days is attributed back to the time at which the program actually went to air: in other words Consolidated viewing).
• Average time spent viewing (ATV) is calculated as the daily average time (0200-2600) within the universe across all days in the calendar quarter multiplied by the factor of numbers of days in the quarter divided by three (3).
• Monthly reach for TV is based on the average of the calendar month cumulative reach audience (0200-2600) within the quarter.
• Video content is defined as a stream where both audio and video are detected. Video viewership excludes adult and advertising content, as well as downloaded content.
• Wherever possible, geographic and demographic data have been matched for like comparisons.
• Nielsen Australian Connected Consumers report 2015 (ACC) based on online national population aged 16+.
• Smartphone ownership and usage sourced from Nielsen Consumer & Media View (people 16+).
• TAM data defines ‘Kids’ as panel members aged 0-12, ‘Teens’ aged 13-17 and ‘Male’ / ‘Female’ as total individuals aged 0+.
• Nielsen Netview defines ‘Kids’
as panel members aged 2-11, ‘Teens’ aged 12-17 and ‘Male’ / ‘Female’ as individuals aged 2+.
• Nielsen Australian Connected Consumers report defines ‘Teens’ as respondents aged 16-17 and ‘Male’ / ‘Female’ respondents aged 16+.
• Nielsen has implemented page crediting improvements in the measurement of web pages and time spent across all online activities, driving a trend break for May 2013 data onwards for time spent online. As part of these improvements, the previous metric of ‘PC time spent’ has been retired and replaced with the new metric of ‘online time spent’. Online time spent is inclusive of all online activities including PC applications (e.g. iTunes, Skype, etc)
• March 2014 constituted a trend break for all key audience metrics from Nielsen Online Ratings - Hybrid. Nielsen, guided by its collaboration with IAB Australia’s Measurement Council, transitioned to a new data processing platform and implemented a tightening of panel rules for online audience measurement. These new rules resulted in the removal of ‘inactive’ panelists and this has reset and stabilised the online universe metric which is so critical to how we ensure accurate measurement of Australian internet consumption.

AUSTRALIAN MULTI-SCREEN REPORT QUARTER 2 2015 // c 2015 REGIONAL TAM, OZTAM, NIELSEN. ALL RIGHTS RESERVED. 21
For more information
DOUG PEIFFERChief Executive Officer, [email protected]
MARGARET FEARNPrincipal, Fearnace [email protected]
This report and all data within it is Copyright © Regional TAM, OzTAM, Nielsen, 2015. All rights reserved. The document as-a-whole may be shared and redistributed freely, and users are welcome to quote from it with appropriate sourcing: Australian Multi-Screen Report Q2, 2015. Please contact one of the people listed above for permission to re-use contents of the report in any other manner, including reproduction of tables, graphics or sections within it.
OZTAM
CRAIG JOHNSONHead of Reach SolutionsSEANAP, [email protected]
DEBORAH WRIGHTChairperson, Regional [email protected]
NIELSEN
REGIONAL TAM