nielsen investor overview -...
TRANSCRIPT

This artwork was created using Nielsen data.
Copyright © 2018 The Nielsen Company (US), LLC. Confidential and proprietary. Do not distribute.
1Q 2018
NIELSEN INVESTOR OVERVIEW

2Cop
yri
gh
t ©
20
18
Th
e N
iels
en
Com
pa
ny (
US
), L
LC
. C
on
fid
en
tia
l a
nd
pro
pri
eta
ry. D
o n
ot d
istr
ibu
te.
FORWARD LOOKING STATEMENTSThe following discussion contains forward-looking statements, including those about Nielsen’s outlook and prospects, within
the meaning of the Private Securities Litigation Reform Act of 1995. Forward-looking statements are those which are not
historical facts and may be identified by words such as “will”, “intend” “expect”, “estimates,” “anticipates”, “should”, “could”,
“shall” and similar expressions. These and other statements that relate to future results and events are based on Nielsen’s
current expectations as of April 26, 2018.
These statements are subject to risks and uncertainties, and actual results and events could differ materially from what
presently is expected. Factors leading thereto may include, without limitation, general economic conditions, conditions in
the markets Nielsen is engaged in, behavior of customers, suppliers and competitors, technological developments, as well
as legal and regulatory rules affecting Nielsen’s business and specific risk factors discussed in press releases and public
filings made by Nielsen (including those described in the forward-looking statements can be found under the section
entitled “Part I—Item 1A. Risk Factors” of the company’s Annual Report on Form 10-K for the fiscal year ended December
31, 2017 and our other filings with the Securities and Exchange Commission). This list of factors is not intended to be
exhaustive. Such forward-looking statements only speak as of the date of these materials, and we assume no obligation to
update any written or oral forward-looking statement made by us or on our behalf as a result of new information, future
events or other factors, except as required by law.
Our outlook is provided for the purpose of providing information about current expectations for 2018 and our long term
framework.
NON-GAAP INFORMATION
The following discussion contains certain non-GAAP financial measures. See the Appendix for additional information
regarding the definition and use of these measures, including a reconciliation of these measures to financial information
presented in accordance with GAAP.

3Cop
yri
gh
t ©
20
18
Th
e N
iels
en
Com
pa
ny (
US
), L
LC
. C
on
fid
en
tia
l a
nd
pro
pri
eta
ry. D
o n
ot d
istr
ibu
te.
NIELSEN AT A GLANCE
Market Cap and Dividend Yield are reported as of 4/26/18
Adjusted EBITDA presented on a constant currency basis
Market Cap $11.4B
Cash Returned to Shareholders (2012-2017) $4.3B
2017 Total Company Revenue $6.6B
2017 Free Cash Flow $863M
2017 Adj. EBITDA Margin Growth 15bps
Dividend Yield 4.2%
Revenue Recurring in Nature ~70%
2017 Total Revenues
Measurement and analytics
for content, advertising and
activity for television, digital,
social and audio
Watch
2017 Revenue:
~$3.3B
Adj. EBITDA Margin: 44%
Watch
51%
Buy
49%
Market share
measurement and
analytics for fast moving
consumer goods,
manufacturers and
retailers
2017 Revenue:
~$3.2B
Adj. EBITDA Margin: 18%
Buy
FOCUS: DRIVE SHAREHOLDER VALUE THROUGH GROWTH, PROFITABILITY, AND FREE CASH FLOW

4Cop
yri
gh
t ©
20
18
Th
e N
iels
en
Com
pa
ny (
US
), L
LC
. C
on
fid
en
tia
l a
nd
pro
pri
eta
ry. D
o n
ot d
istr
ibu
te.
NIELSEN’S BUSINESS STRATEGY &
OBJECTIVES
QUALITY
INTEGRITY
NEUTRALITY
OUR VALUES
OPEN
CONNECTED
USEFUL
PERSONAL
OUR BRAND
Expand coverage of consumer purchase
behavior globally
Capture Total Audience across all screens and
platforms
Help clients understand how individuals’ viewing behavior impacts purchase behavior
BUY
WATCH
MARKETING EFFECTIVENESS
EXECUTION OF OUR STRATEGY DRIVES SHAREHOLDER VALUE
THROUGH THE CYCLES

5Cop
yri
gh
t ©
20
18
Th
e N
iels
en
Com
pa
ny (
US
), L
LC
. C
on
fid
en
tia
l a
nd
pro
pri
eta
ry. D
o n
ot d
istr
ibu
te.
WHY INVEST IN NIELSEN?
Unmatched global footprint of 100+ countries
“Mission critical” measurement and analytics embedded in client workflows
Syndicated, scalable products and services
Strategic investments to drive continued and future growth opportunities
Proven track record of growth and economic resilience
Strong free cash flow generation and compelling capital allocation strategy
WE ARE A GLOBAL, INDEPENDENT MEASUREMENT AND DATA
COMPANY FOR FAST MOVING CONSUMER GOODS AND MEDIA

6Cop
yri
gh
t ©
20
18
Th
e N
iels
en
Com
pa
ny (
US
), L
LC
. C
on
fid
en
tia
l a
nd
pro
pri
eta
ry. D
o n
ot d
istr
ibu
te.
OUR GLOBAL FOOTPRINT
Our focus is relentless on our pursuit to provide clients with the most complete understanding
of what consumers buy and watch in 100+ countries…
~20% of revenues in
emerging markets
Buy Coverage Only Watch & Buy Coverage
…UNDERSCORED BY A GLOBAL EMPLOYEE BASE OF TALENTED ASSOCIATES WE
WORK HARD TO ATTRACT, DEVELOP, AND RETAIN
7Cop
yri
gh
t ©
20
18
Th
e N
iels
en
Com
pa
ny (
US
), L
LC
. C
on
fid
en
tia
l a
nd
pro
pri
eta
ry. D
o n
ot d
istr
ibu
te.
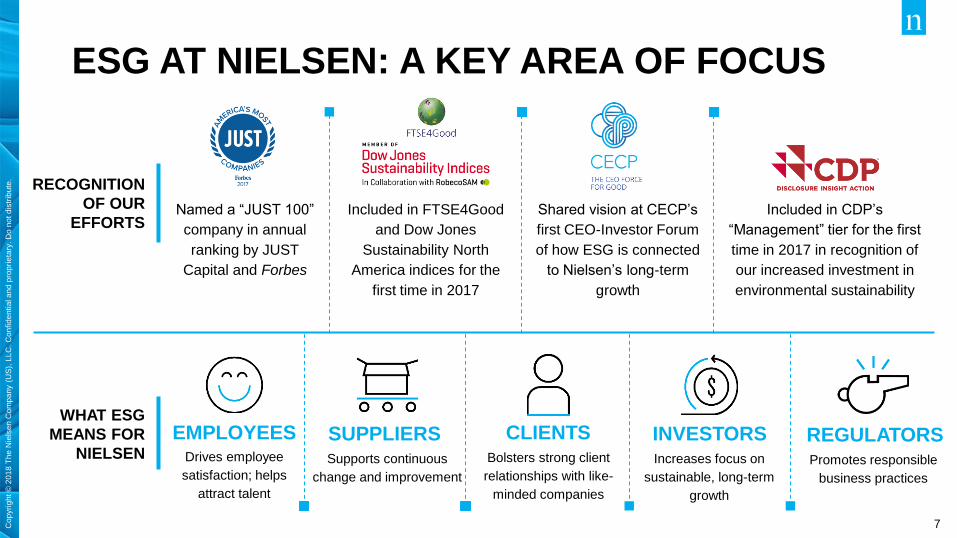
ESG AT NIELSEN: A KEY AREA OF FOCUS
EMPLOYEESDrives employee
satisfaction; helps
attract talent
INVESTORSIncreases focus on
sustainable, long-term
growth
REGULATORSPromotes responsible
business practices
SUPPLIERS Supports continuous
change and improvement
Named a “JUST 100”
company in annual
ranking by JUST
Capital and Forbes
Shared vision at CECP’s
first CEO-Investor Forum
of how ESG is connected
to Nielsen’s long-term
growth
Included in CDP’s
“Management” tier for the first
time in 2017 in recognition of
our increased investment in
environmental sustainability
WHAT ESG
MEANS FOR
NIELSEN
RECOGNITION
OF OUR
EFFORTSIncluded in FTSE4Good
and Dow Jones
Sustainability North
America indices for the
first time in 2017
Bolsters strong client
relationships with like-
minded companies
CLIENTS

8Cop
yri
gh
t ©
20
18
Th
e N
iels
en
Com
pa
ny (
US
), L
LC
. C
on
fid
en
tia
l a
nd
pro
pri
eta
ry. D
o n
ot d
istr
ibu
te.
LONG-TERM, BEST-IN-CLASS CLIENT BASE
BUY WATCH
• 20,000+ clients
• Relationships with top 5 clients
for over 30 years
• Long-term contracts provide
stable, recurring revenues –
average length of 3-7 years
• No client represents more than
4% of 2017 revenues.
HIGHLIGHTS
PARTNERSHIPS
FOR MORE THAN 90 YEARS, WE HAVE BEEN AT THE FOREFRONT OF MEASURING
CONSUMERS AROUND THE WORLD, HELPING CLIENTS DRIVE BETTER BUSINESS
DECISIONS AND PROFITABLE GROWTH OVER TIME

9Cop
yri
gh
t ©
20
18
Th
e N
iels
en
Com
pa
ny (
US
), L
LC
. C
on
fid
en
tia
l a
nd
pro
pri
eta
ry. D
o n
ot d
istr
ibu
te.
CREATING OPPORTUNITIES Driving growth and efficiency as our markets evolve
MARKET DYNAMICS
• Media fragmentation
• Ad spend shifting to digital
• Audience-based buying
• Growth in emerging markets
• Cost focus in developed markets
• Shift toward “always on” analytics
WATCH: Total Audience
BUY: Connected System
OPERATIONS: Automation
KEY STRATEGIC INITIATIVES
BUY
WATCH
LEVERAGING CHANGE AS A MEANS FOR PROGRESS
10Cop
yri
gh
t ©
20
18
Th
e N
iels
en
Com
pa
ny (
US
), L
LC
. C
on
fid
en
tia
l a
nd
pro
pri
eta
ry. D
o n
ot d
istr
ibu
te.
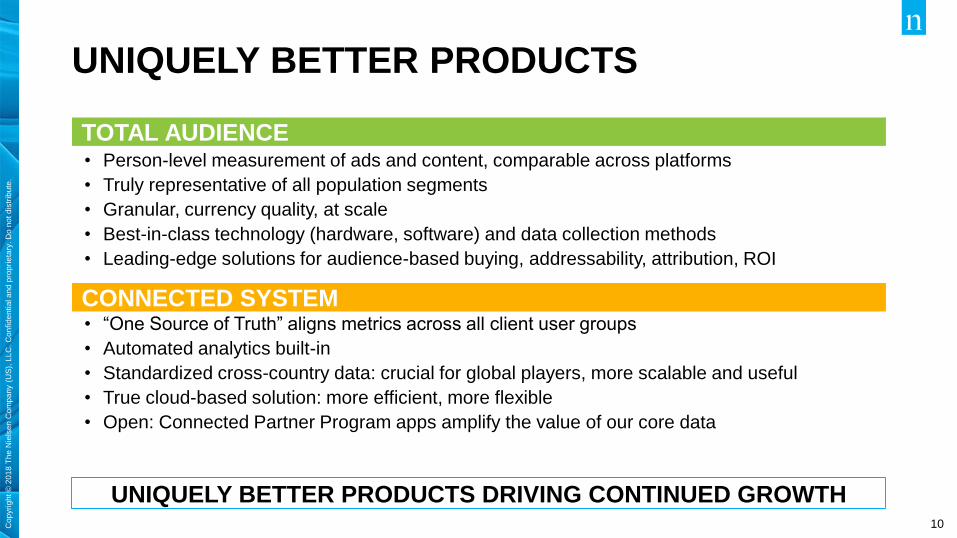
UNIQUELY BETTER PRODUCTS DRIVING CONTINUED GROWTH
UNIQUELY BETTER PRODUCTS
• Person-level measurement of ads and content, comparable across platforms
• Truly representative of all population segments
• Granular, currency quality, at scale
• Best-in-class technology (hardware, software) and data collection methods
• Leading-edge solutions for audience-based buying, addressability, attribution, ROI
• “One Source of Truth” aligns metrics across all client user groups
• Automated analytics built-in
• Standardized cross-country data: crucial for global players, more scalable and useful
• True cloud-based solution: more efficient, more flexible
• Open: Connected Partner Program apps amplify the value of our core data
CONNECTED SYSTEM
TOTAL AUDIENCE

11Cop
yri
gh
t ©
20
18
Th
e N
iels
en
Com
pa
ny (
US
), L
LC
. C
on
fid
en
tia
l a
nd
pro
pri
eta
ry. D
o n
ot d
istr
ibu
te.
DEPLOYING MARKET-TESTED, PROVEN CAPABILITIES
Automate data collection
Increased efficiency, speed, quality
EFFICIENCY: A GOLD MINE OF OPPORTUNITY
What are we doing? How are we doing it?
Automate data operations
Nano Meter, remote monitoring
Consolidate operations & platforms
Greater use of machine learning
$400M in annualized operations
& technology cost savings
by 2020
Automate Buy Data Collection
Super Hubs & Platforms
Connected System
Client Service Transformation
Centers of ExcellenceSG&A Efficiencies
Automate Watch Operations
$100Min annualized SG&A
cost savings by 2020

12Cop
yri
gh
t ©
20
18
Th
e N
iels
en
Com
pa
ny (
US
), L
LC
. C
on
fid
en
tia
l a
nd
pro
pri
eta
ry. D
o n
ot d
istr
ibu
te.
THE PATH TO 2020
GROWTH AND MARGIN EXPANSION FOR NIELSEN
DELIVERING INCREMENTAL VALUE FOR CLIENTS AND SHAREHOLDERS
Fundamental StrengthsUniquely Better
ProductsIncreased Efficiency
• Total Audience
• Connected System
• Integrated Analytics
• Gracenote
• Continuous innovation
• Automation
• Machine learning
• Super hubs
• Headcount productivity
• More scalable growth
• Global
• Complete coverage
• Wealth of metadata
• Unmatched client base
• Open approach

13Cop
yri
gh
t ©
20
18
Th
e N
iels
en
Com
pa
ny (
US
), L
LC
. C
on
fid
en
tia
l a
nd
pro
pri
eta
ry. D
o n
ot d
istr
ibu
te.
WATCH: MEASURING THE TOTAL
AUDIENCETotal 2017 Revenue: ~$3.3B… Over 80% recurring in nature
• Watch measurement capabilities in 59 countries
• Digital measurement, audience analytics and consumer research
• Grossed and de-duplicated total reporting across all devices,
access points and business models
• Separate measurement for content and ads
• Strategic relationships (Adobe, Experian, Facebook, Twitter, Roku,
DISH, Charter, Comcast, OpenAP)
• Gold standard, MRC accredited panel
• Marketing Effectiveness, fastest growing segment in 2017
69%
15%
11%
5%
Audience Measurement (Video & Text)
Audio
Marketing Effectiveness
Corporate/Other Watch
2017 Total Watch Revenue Breakdown
Video
Ratings
Audio
Ratings
Text
RatingsCross Platform Measurement
websitesprinted press

14Cop
yri
gh
t ©
20
18
Th
e N
iels
en
Com
pa
ny (
US
), L
LC
. C
on
fid
en
tia
l a
nd
pro
pri
eta
ry. D
o n
ot d
istr
ibu
te.
WATCH: MEASURING FRAGMENTING AUDIENCES
Total Audience Measurement: Only Nielsen
Digital in TV Ratings: Amazon Prime Video Channels, Verizon Fios, Philo
Digital Ad Ratings: Adopted by top 7 global agency holding companies
Expanding the currency: C3/C7 + DAR to cover linear & dynamic ads
Audience analytics: Leveraging Gracenote Smart TV data

15Cop
yri
gh
t ©
20
18
Th
e N
iels
en
Com
pa
ny (
US
), L
LC
. C
on
fid
en
tia
l a
nd
pro
pri
eta
ry. D
o n
ot d
istr
ibu
te.
TOTAL AUDIENCE FRAMEWORKFlexible Measurement Solutions for Content Ads
Consistent and
comparable metrics for
content and
ads provides
transparency for the
media ecosystem
CONTENT
MEASUREMENT
AD
MEASUREMENT
COMMERCIALS IN
CONTENT
MEASUREMENT
16Cop
yri
gh
t ©
20
18
Th
e N
iels
en
Com
pa
ny (
US
), L
LC
. C
on
fid
en
tia
l a
nd
pro
pri
eta
ry. D
o n
ot d
istr
ibu
te.
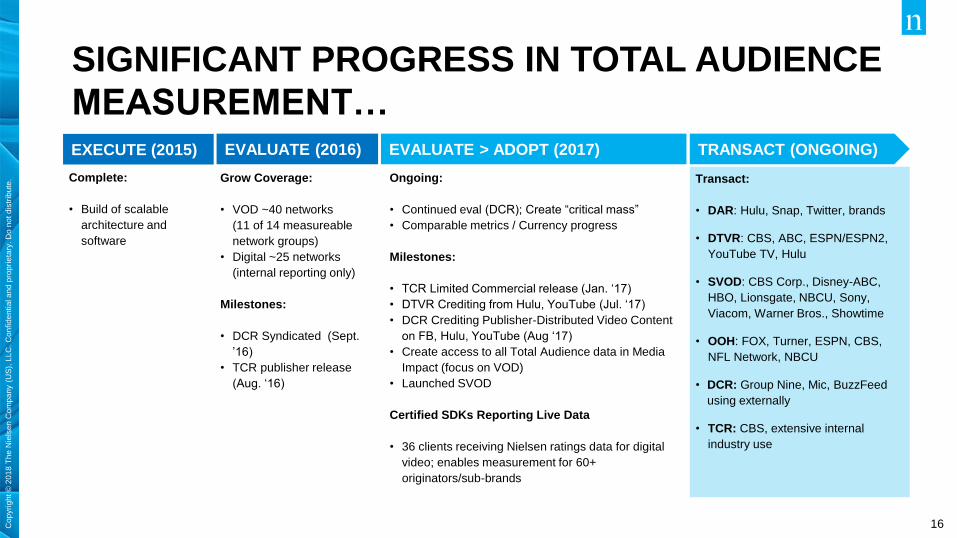
SIGNIFICANT PROGRESS IN TOTAL AUDIENCE
MEASUREMENT…
Complete:
• Build of scalable
architecture and
software
Grow Coverage:
• VOD ~40 networks
(11 of 14 measureable
network groups)
• Digital ~25 networks
(internal reporting only)
Milestones:
• DCR Syndicated (Sept.
’16)
• TCR publisher release
(Aug. ‘16)
Ongoing:
• Continued eval (DCR); Create “critical mass”
• Comparable metrics / Currency progress
Milestones:
• TCR Limited Commercial release (Jan. ‘17)
• DTVR Crediting from Hulu, YouTube (Jul. ‘17)
• DCR Crediting Publisher-Distributed Video Content
on FB, Hulu, YouTube (Aug ‘17)
• Create access to all Total Audience data in Media
Impact (focus on VOD)
• Launched SVOD
Certified SDKs Reporting Live Data
• 36 clients receiving Nielsen ratings data for digital
video; enables measurement for 60+
originators/sub-brands
Transact:
• DAR: Hulu, Snap, Twitter, brands
• DTVR: CBS, ABC, ESPN/ESPN2,
YouTube TV, Hulu
• SVOD: CBS Corp., Disney-ABC,
HBO, Lionsgate, NBCU, Sony,
Viacom, Warner Bros., Showtime
• OOH: FOX, Turner, ESPN, CBS,
NFL Network, NBCU
• DCR: Group Nine, Mic, BuzzFeed
using externally
• TCR: CBS, extensive internal
industry use
EXECUTE (2015) EVALUATE (2016) EVALUATE > ADOPT (2017) TRANSACT (ONGOING)

17Cop
yri
gh
t ©
20
18
Th
e N
iels
en
Com
pa
ny (
US
), L
LC
. C
on
fid
en
tia
l a
nd
pro
pri
eta
ry. D
o n
ot d
istr
ibu
te.
NIELSEN HAS ALIGNED TO SERVE
THE MODERN MEDIA ECOSYSTEM
TRADITIONAL/REACH
ADVERTISING
(LINEAR BUYS)
COMPARABLE CROSS PLATFORM REACH (POPULATION)
EFFECTIVENESS & ROI
AUDIENCE VALIDATION
TARGETED ADVERTISING
(AUDIENCE BUYS)
MEDIA OWNER AGENCY ADVERTISER
NO ADVERTISING
(SUBSCRIPTIONS)
Subscriber
DISTRIBUTOR
AD
BRANDED INTEGRATIONS
(PRODUCT PLACEMENT)
CONTENT (AD)CONTENT
Pet-Lover
AD
Beer Drinker
AD
Avid Hiker
AD
Car Buyer
[
AD+ + +

18Cop
yri
gh
t ©
20
18
Th
e N
iels
en
Com
pa
ny (
US
), L
LC
. C
on
fid
en
tia
l a
nd
pro
pri
eta
ry. D
o n
ot d
istr
ibu
te.
AUDIENCE BUYING IN LINEAR TV DEPENDS ON
NIELSEN DATA…
AUDIENCE
SEGMENTS
AUDIENCE
MEASUREMENT
TV INVENTORY
Other 3rd Parties

19Cop
yri
gh
t ©
20
18
Th
e N
iels
en
Com
pa
ny (
US
), L
LC
. C
on
fid
en
tia
l a
nd
pro
pri
eta
ry. D
o n
ot d
istr
ibu
te.
INVESTING TO SUPPORT AUDIENCE
BUYING IN DIGITAL
REACH VALIDATION ROI MEASUREMENTPLANNING & ACTIVATION
DIGITAL AD
RATINGS
MARKETING CLOUD

20Cop
yri
gh
t ©
20
18
Th
e N
iels
en
Com
pa
ny (
US
), L
LC
. C
on
fid
en
tia
l a
nd
pro
pri
eta
ry. D
o n
ot d
istr
ibu
te.
MARKETING EFFECTIVENESS FRAMEWORKNielsen Marketing Effectiveness framework leverages best in class data, technology and analytics to
provide our clients the resources they need to answer their business questions.
ACTIVATE MEASURE PERFORMANCE MEASURE OUTCOME
Brand Effect:
Creative, Competitive and
media impact
Digital & Total Ad
Ratings:
Reach, Frequency and
Audience Verification
PLAN
Ad Intel:
Competitive Intelligence for
Cross-Media Advertising
Consumer Neuroscience:
Copy quality and creative
drivers
NCS Sales Effect:
Campaign level sales
performance and drivers
Multi-Touch Attribution:
Media measurement across
Paid and Owned digital
touch-points
Marketing Mix:
Holistic Marketing Plan
evaluation across all
channels
Nielsen Catalina
Solutions: Audience
Segments for Targeted
Advertising
Nielsen Marketing
Cloud: DMP
Manage aggregated first
and third party data
SUPPORTING EVERY STEP OF CAMPAIGN MEASUREMENT

21Cop
yri
gh
t ©
20
18
Th
e N
iels
en
Com
pa
ny (
US
), L
LC
. C
on
fid
en
tia
l a
nd
pro
pri
eta
ry. D
o n
ot d
istr
ibu
te.
KEY MESSAGES
ONLY NIELSEN CAN
Nielsen will be the digital currency
Nielsen will further expand the definition of TV currency in 2018
Nielsen has invested in key areas to drive future high-margin growth

22Cop
yri
gh
t ©
20
18
Th
e N
iels
en
Com
pa
ny (
US
), L
LC
. C
on
fid
en
tia
l a
nd
pro
pri
eta
ry. D
o n
ot d
istr
ibu
te.
BUY: MEASURING THE TOTAL CONSUMERTotal 2017 Revenue: ~$3.2B… Approximately 60% recurring in nature
Retail sales measurement, market share information
and advanced analytical capabilities
• Presence in 100+ countries
• Measure billions of monthly point-of-sale transactions
• Store level data from nearly 2 million stores,
supplemented from proprietary household level data
from 240K households
• Demand for Everyday Analytics: Pricing, Promotion and
Assortment
Developed
Corporate
62%
36%2%
2017 Total Buy Revenue
Emerging
GROWTH THROUGH DIFFERENTIATION, STICKINESS, & SCALE

23Cop
yri
gh
t ©
20
18
Th
e N
iels
en
Com
pa
ny (
US
), L
LC
. C
on
fid
en
tia
l a
nd
pro
pri
eta
ry. D
o n
ot d
istr
ibu
te.
BUY: TRANSFORMATION PROGRESSING
Connected System
• On track to engage with 100 clients by the end of 2018
• Connected Partner Program…45 partners, usage growing
• 219 clients using at least one component of the Connected System
Key wins with retailers
• “Walmart One Version of Truth” launched February 1st
o 50+ manufacturers signed up…global and regional brands
• Expanded Sam’s Club relationship
Total Consumer Measurement
• Total Food offering provides view of total store
• E-commerce…aligning offline and online sales for total consumer view
Key Growth Initiatives
• Balanced client portfolio, global footprint…key competitive advantages
• Ongoing investments in measurement coverage and penetration
Emerging Markets
24Cop
yri
gh
t ©
20
18
Th
e N
iels
en
Com
pa
ny (
US
), L
LC
. C
on
fid
en
tia
l a
nd
pro
pri
eta
ry. D
o n
ot d
istr
ibu
te.
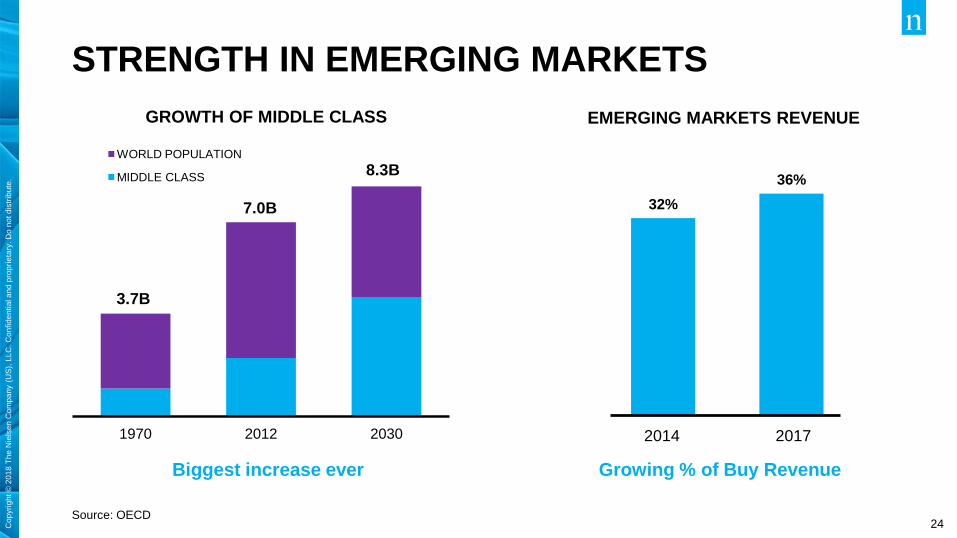
STRENGTH IN EMERGING MARKETS
Source: OECD
Growing % of Buy Revenue
1970 2012 2030
WORLD POPULATION
MIDDLE CLASS
~36%
LOCALS
~64%
GLOBAL
MNCs
Biggest increase ever
3.7B
7.0B
8.3B
GROWTH OF MIDDLE CLASS EMERGING MARKETS REVENUE
32%
36%
20172014

25Cop
yri
gh
t ©
20
18
Th
e N
iels
en
Com
pa
ny (
US
), L
LC
. C
on
fid
en
tia
l a
nd
pro
pri
eta
ry. D
o n
ot d
istr
ibu
te.
INNOVATING TO CAPITALIZE ON MARKET
TRANSFORMATION
KEY MARKET TRENDS
1. Long-tail and store brands growth
2. Shift to green/organic
3. Retail disruption: e-commerce,
omni-channel, discounters
4. Personalization driving analytics
& data integration
5. Zero-based budgeting
THE CONNECTED SYSTEM
WHAT’S HAPPENING?
WHY?WHAT NEXT?
DATA EXCHANGE

26Cop
yri
gh
t ©
20
18
Th
e N
iels
en
Com
pa
ny (
US
), L
LC
. C
on
fid
en
tia
l a
nd
pro
pri
eta
ry. D
o n
ot d
istr
ibu
te.
CONNECTED SYSTEM
BUSINESS INTELLIGENCE & VISUALIZATION APPS
DATA ENRICHMENT & INTEGRATION APPS
API
DATA
NIELSEN
CONNECTED
PARTNER DATA
TOTAL
CONSUMER
TOTAL
AUDIENCE
CLIENT
DATA
PUBLIC
DATA
ECOSYSTEM
What’s
Next? PLANNING, SIMULATION & ACTIVATION APPS
What’s
Happening
& Why
What’s
Happening
Data
Exchange
PERFECTLY ALIGNED WITH CLIENT NEEDS

27Cop
yri
gh
t ©
20
18
Th
e N
iels
en
Com
pa
ny (
US
), L
LC
. C
on
fid
en
tia
l a
nd
pro
pri
eta
ry. D
o n
ot d
istr
ibu
te.
CONNECTED SYSTEM: ONGOING, AGILE
DEVELOPMENT AND ROLLOUT
Build the foundations with
charter clientsEngaged with 25 clients Expand to engage with
~100 clients
2016 2017 2018
28Cop
yri
gh
t ©
20
18
Th
e N
iels
en
Com
pa
ny (
US
), L
LC
. C
on
fid
en
tia
l a
nd
pro
pri
eta
ry. D
o n
ot d
istr
ibu
te.
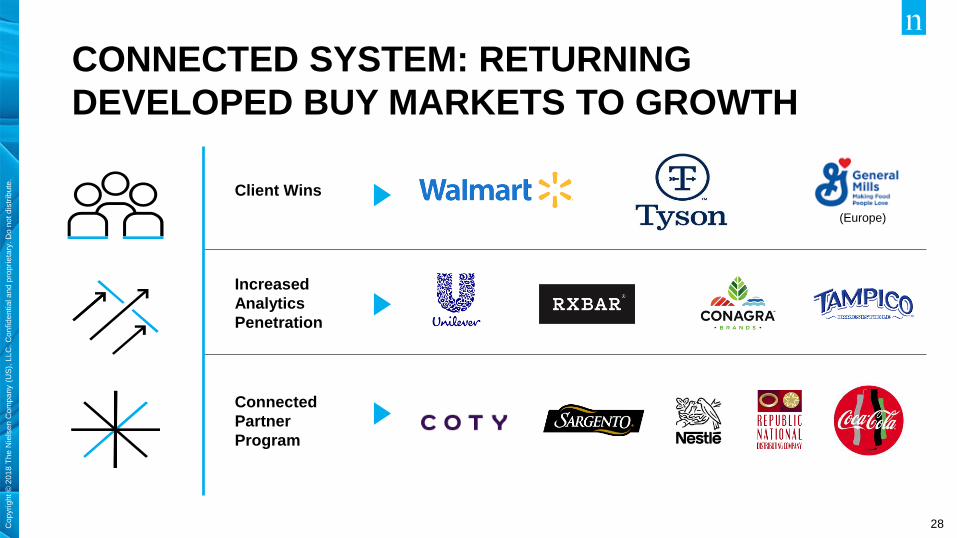
CONNECTED SYSTEM: RETURNING
DEVELOPED BUY MARKETS TO GROWTH
Client Wins
Connected
Partner
Program
Increased
Analytics
Penetration
(Europe)
29Cop
yri
gh
t ©
20
18
Th
e N
iels
en
Com
pa
ny (
US
), L
LC
. C
on
fid
en
tia
l a
nd
pro
pri
eta
ry. D
o n
ot d
istr
ibu
te.
CONNECTED SYSTEM: DRIVING EFFICIENCY
GO TO MARKET
• Streamlined client
delivery and support
PRODUCT MIX
• Greater mix of higher margin
syndicated products
• High margin Connected Partner
revenue
TECHNOLOGY & OPERATIONS
• Aligning costs with value
to client
• Shutdown legacy platforms
over time
• Product convergence post-2020
STRONGER, HIGHER MARGIN BUSINESS

30Cop
yri
gh
t ©
20
18
Th
e N
iels
en
Com
pa
ny (
US
), L
LC
. C
on
fid
en
tia
l a
nd
pro
pri
eta
ry. D
o n
ot d
istr
ibu
te.
TOTAL CONSUMER
Source: Nielsen e-commerce measurement, 52 weeks ending July 1, 2017. Projected from ~1MM e-commerce FMCG consumers and cooperating ePOS
retailers based on reported commodity groups that may not match prior custom or syndicated category definitions.
27%
26%
13%
11%
9%
3%
2%
2%
1%
1%
1%
1%
Beauty Care
Pet Care
Health Care
Personal Care
Household Care
Packaged Grocery
Produce
Meat
Dairy
Beer and Wine
Bakery
Frozen Foods
NON-FOOD
FOOD & BEVERAGE
2017 ACCOMPLISHMENTS
E-commerce launched in the US
E-commerce measurement
available in 17 countries
Expanded traditional trade
coverage
Measuring discount channel
with consumer-sourced data
E-COMMERCE SHARE OF SALES

31Cop
yri
gh
t ©
20
18
Th
e N
iels
en
Com
pa
ny (
US
), L
LC
. C
on
fid
en
tia
l a
nd
pro
pri
eta
ry. D
o n
ot d
istr
ibu
te.
KEY MESSAGES
Strength in Emerging Markets
Connected System positioned to drive growth and efficiency
Expanding coverage through Total Consumer initiatives
Transformative wins enhancing value for retailers/manufacturers
THIS IS NIELSEN BUY 2020

32
This artwork was created using Nielsen data.
Copyright © 2018 The Nielsen Company (US), LLC. Confidential and proprietary. Do not distribute.
FINANCIALS

33Cop
yri
gh
t ©
20
18
Th
e N
iels
en
Com
pa
ny (
US
), L
LC
. C
on
fid
en
tia
l a
nd
pro
pri
eta
ry. D
o n
ot d
istr
ibu
te.
COMPELLING FINANCIAL PERFORMANCE: 2012-2017
Note: revenue CAGR represented in constant currency
REVENUE GROWTH
• 6% CAGR
• 47 quarters of consecutive growth
• Investing in growth platforms
FREE CASH FLOW
• 15% CAGR
• $4.3B generated 2012-2017
CAPITAL ALLOCATION
• ~$3.6B returned to shareholders
• Tremendous flexibility to invest in growth
• Tuck-in M&A
• New product launches
MARGIN EXPANSION
• ~3.1 pts of EBITDA margin expansion
• Disciplined pricing
• Efficiency and cost out
FREE CASH FLOW CAPITAL ALLOCATION
REVENUE GROWTH MARGIN EXPANSION
DELIVERING STRONG RETURNS
34Cop
yri
gh
t ©
20
18
Th
e N
iels
en
Com
pa
ny (
US
), L
LC
. C
on
fid
en
tia
l a
nd
pro
pri
eta
ry. D
o n
ot d
istr
ibu
te.
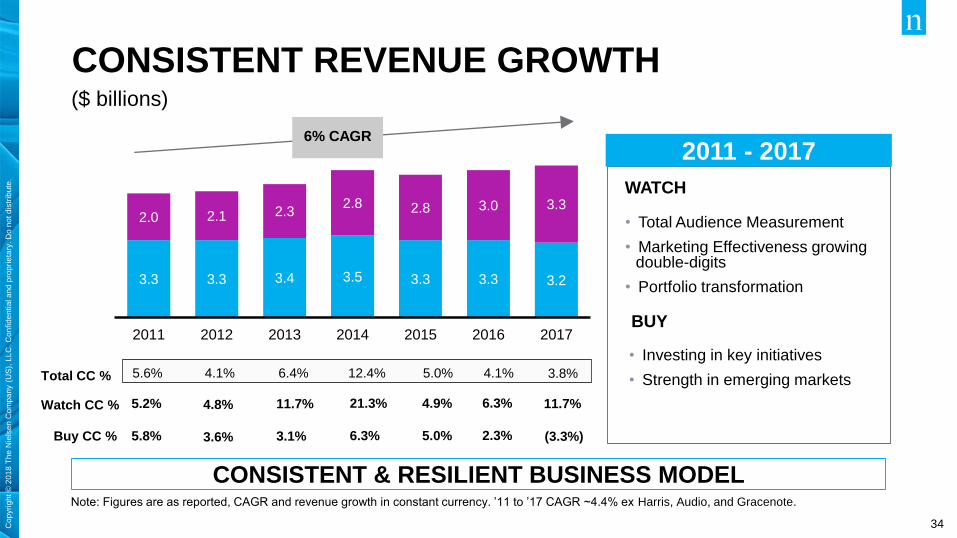
CONSISTENT REVENUE GROWTH($ billions)
Note: Figures are as reported, CAGR and revenue growth in constant currency. ’11 to ’17 CAGR ~4.4% ex Harris, Audio, and Gracenote.
6% CAGR
Total CC % 5.6% 4.1% 6.4% 12.4% 5.0% 4.1%
Watch CC % 5.2% 4.8% 11.7% 21.3% 4.9% 6.3%
Buy CC % 5.8% 3.6% 3.1% 6.3% 5.0% 2.3%
3.3 3.3 3.4 3.5 3.3 3.3 3.2
2.0 2.1 2.32.8 2.8 3.0 3.3
2011 2012 2013 2014 2015 2016 2017BUY
WATCH
• Investing in key initiatives
• Strength in emerging markets
• Total Audience Measurement
• Marketing Effectiveness growing double-digits
• Portfolio transformation
2011 - 2017
3.8%
11.7%
(3.3%)
CONSISTENT & RESILIENT BUSINESS MODEL

35Cop
yri
gh
t ©
20
18
Th
e N
iels
en
Com
pa
ny (
US
), L
LC
. C
on
fid
en
tia
l a
nd
pro
pri
eta
ry. D
o n
ot d
istr
ibu
te.
2018 BUY REVENUE FRAMEWORK(Percentages reflected as constant currency)
Emerging Markets: 8-10%
+ Coverage and penetration
+ Strong market demographic and income trends
+ Local and multinationals are investing
Developed Markets: (2)% to (4)%
- Low growth environment for large manufacturers
- Competitive environment pressuring clients
• Hard discounters
• Smaller brands gaining share
+ More investment in retail data and analytics
Corporate: ~(50)%
- Carryover from 2017 pruning activities
KEY DYNAMICS
(1)% to 1%
2017
$3.2B
2018E: TOTAL BUY (1)% TO 1%
36Cop
yri
gh
t ©
20
18
Th
e N
iels
en
Com
pa
ny (
US
), L
LC
. C
on
fid
en
tia
l a
nd
pro
pri
eta
ry. D
o n
ot d
istr
ibu
te.
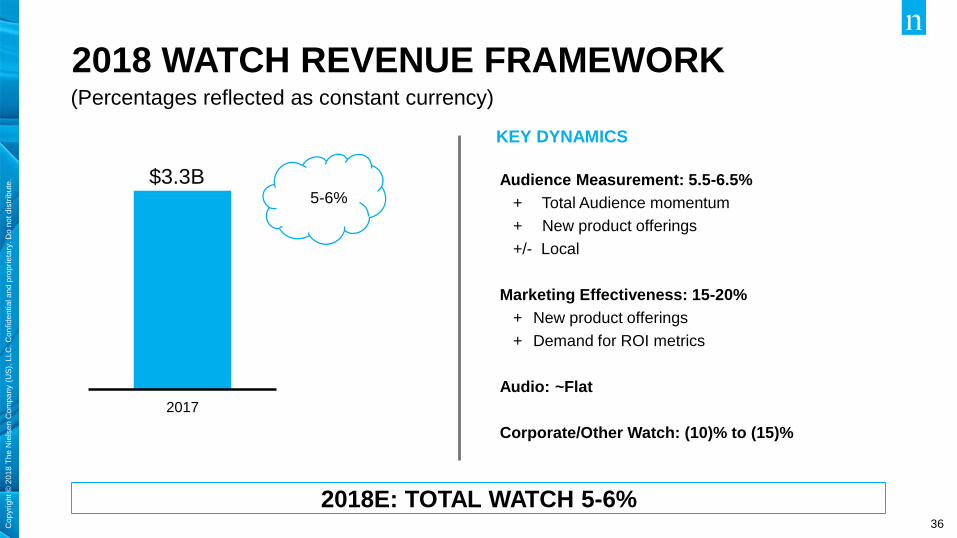
2018 WATCH REVENUE FRAMEWORK(Percentages reflected as constant currency)
KEY DYNAMICS
2017
$3.3B Audience Measurement: 5.5-6.5%
+ Total Audience momentum
+ New product offerings
+/- Local
Marketing Effectiveness: 15-20%
+ New product offerings
+ Demand for ROI metrics
Audio: ~Flat
Corporate/Other Watch: (10)% to (15)%
5-6%
2018E: TOTAL WATCH 5-6%

37Cop
yri
gh
t ©
20
18
Th
e N
iels
en
Com
pa
ny (
US
), L
LC
. C
on
fid
en
tia
l a
nd
pro
pri
eta
ry. D
o n
ot d
istr
ibu
te.
2018 MARGIN DRIVERS
2017
Adj. EBITDA
Margin
2018E
Adj. EBITDA
Margin
RETAILER
INVESTMENTS
(140) bps
Walmart
E-Commerce
PRODUCT
INVESTMENTS
(30) bps
Total Audience
Connected
System
110 bps
Automation
Super Hubs
Digitizing data
collection
NET EFFICIENCY GROWTH INITIATIVES
31%
~(60) bps
Constant
currency
INVESTING FOR EFFICIENCY AND GROWTH
38Cop
yri
gh
t ©
20
18
Th
e N
iels
en
Com
pa
ny (
US
), L
LC
. C
on
fid
en
tia
l a
nd
pro
pri
eta
ry. D
o n
ot d
istr
ibu
te.
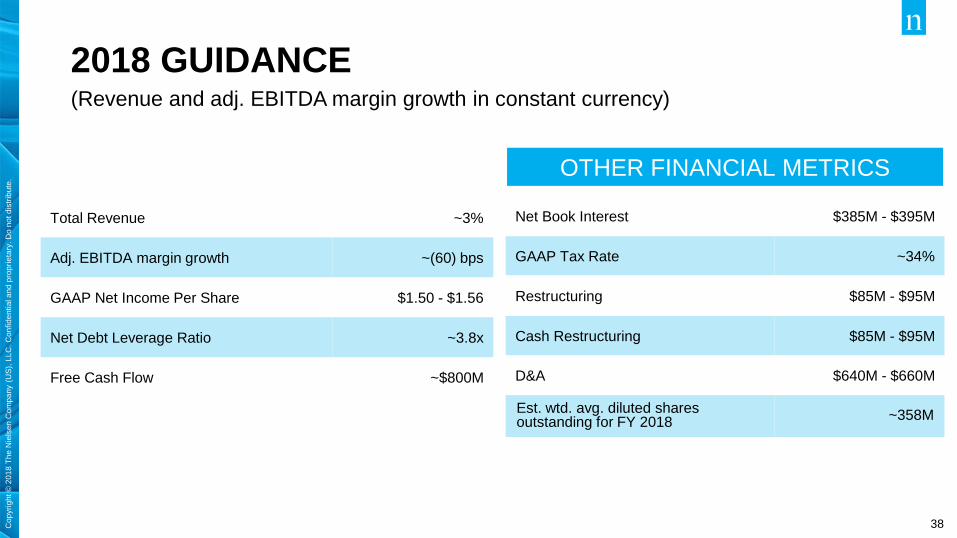
2018 GUIDANCE(Revenue and adj. EBITDA margin growth in constant currency)
Net Book Interest $385M - $395M
GAAP Tax Rate ~34%
Restructuring $85M - $95M
Cash Restructuring $85M - $95M
D&A $640M - $660M
Est. wtd. avg. diluted shares outstanding for FY 2018
~358M
Total Revenue ~3%
Adj. EBITDA margin growth ~(60) bps
GAAP Net Income Per Share $1.50 - $1.56
Net Debt Leverage Ratio ~3.8x
Free Cash Flow ~$800M
OTHER FINANCIAL METRICS

39Cop
yri
gh
t ©
20
18
Th
e N
iels
en
Com
pa
ny (
US
), L
LC
. C
on
fid
en
tia
l a
nd
pro
pri
eta
ry. D
o n
ot d
istr
ibu
te.
310
180
4060
140140
80
-20
3050
1Q18 2Q18E 3Q18E 4Q18E FY18E
Rev (bps) EBITDA (bps)
FOREIGN CURRENCY IMPACT
(a) Projected impact assumes rates in effect at 04/25/18 remain in effect for the balance of 2018.
Note: We report on a constant currency basis to reflect operating performance
57%
11%
3%3%3%
23%
USD EUR CNY CAD GBP Other
CURRENCY PROFILE - REVENUEPROJECTED FX IMPACT(a):
REPORTED VS CONSTANT CURRENCY

40Cop
yri
gh
t ©
20
18
Th
e N
iels
en
Com
pa
ny (
US
), L
LC
. C
on
fid
en
tia
l a
nd
pro
pri
eta
ry. D
o n
ot d
istr
ibu
te.
~$2
2017 2020E
31%
~35%
2017 2020E
~$3B
2018E - 2020E
2017 2020E
THE PATH TO 2020
$1.20
Grow revenue
• Drive mid-single digit growth
• Execute on growth initiatives
Expand margins… Efficiency
• ~+4pts by 2020
• Consolidate operations centers
• Automation and innovation
• Reduce SG&A
Deploy capital to create value
• Bolster growth via tuck-in M&A & capex
• Grow dividend in line with earnings
• Deploy excess capital to share repurchase
THREE PILLARSREVENUE
CUMULATIVE FREE CASH FLOW GAAP EPSDouble-digit
CAGR
EBITDA MARGINS~4%
CAGR
~+4
points
$6.6B
~$7.4B I.
II.
III.
Note: CAGR represented in constant currency
*Excluding impact of Tax Cuts and Jobs Act (“TCJA”), FY 2017 NI per share was $1.49
41Cop
yri
gh
t ©
20
18
Th
e N
iels
en
Com
pa
ny (
US
), L
LC
. C
on
fid
en
tia
l a
nd
pro
pri
eta
ry. D
o n
ot d
istr
ibu
te.
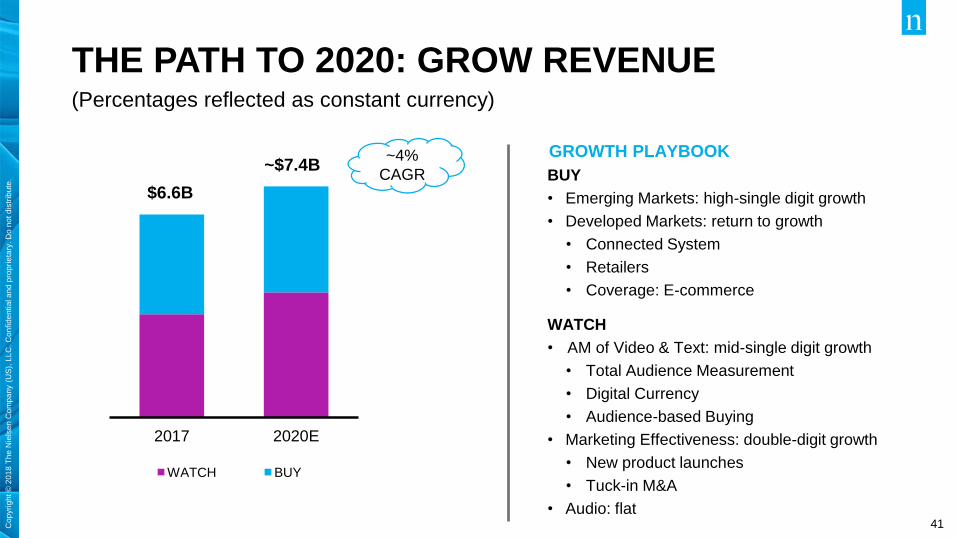
THE PATH TO 2020: GROW REVENUE
BUY
• Emerging Markets: high-single digit growth
• Developed Markets: return to growth
• Connected System
• Retailers
• Coverage: E-commerce
WATCH
• AM of Video & Text: mid-single digit growth
• Total Audience Measurement
• Digital Currency
• Audience-based Buying
• Marketing Effectiveness: double-digit growth
• New product launches
• Tuck-in M&A
• Audio: flat
GROWTH PLAYBOOK
2017 2020E
WATCH BUY
$6.6B
~$7.4B~4%
CAGR
(Percentages reflected as constant currency)

42Cop
yri
gh
t ©
20
18
Th
e N
iels
en
Com
pa
ny (
US
), L
LC
. C
on
fid
en
tia
l a
nd
pro
pri
eta
ry. D
o n
ot d
istr
ibu
te.
THE PATH TO 2020: EXPAND MARGINS
2017 2020E
~35%
Adjusted EBITDA Margin
• ~$500M in annualized cost savings by 2020E
• ~$280M cumulative restructuring from 2018E-2020E
OPERATIONS & TECHNOLOGY:
~$400M in cost out
• Automation/innovation
• Platforms and Super Hubs
SG&A: ~$100M in cost out
• Connected System + Client Service transformation
• Reduce corporate costs
• Leverage shared centers of excellence
SEGMENT DYNAMICS
• Watch: ~+2-2.5 points by 2020
• Buy: ~+4 points by 2020
PERMANENTLY REDUCING OPERATING COSTS
31%
~+4
points
DRIVING EFFICIENCY…WELL-DEFINED PROJECTS… FULL MANAGEMENT COMMITTMENT

43Cop
yri
gh
t ©
20
18
Th
e N
iels
en
Com
pa
ny (
US
), L
LC
. C
on
fid
en
tia
l a
nd
pro
pri
eta
ry. D
o n
ot d
istr
ibu
te.
DEPLOY CAPITAL TO CREATE VALUE
• Fund growth initiatives
• Total Audience
• Marketing Effectiveness
• Emerging Markets
• Connected System
• Coverage / Total Consumer
• Tuck-in M&A
• Grow dividend in line with earnings
• Deploy excess capital to share
repurchase
PRIORITIESLONG TERM
FCF DEPLOYMENT
Repurchase/
Tuck-in M&A
~40%
Dividend
~45%
Mandatory
Debt
~15%
CUMULATIVE FCF
~$3B
2018E - 2020E
DELIVERING SHAREHOLDER VALUE
44Cop
yri
gh
t ©
20
18
Th
e N
iels
en
Com
pa
ny (
US
), L
LC
. C
on
fid
en
tia
l a
nd
pro
pri
eta
ry. D
o n
ot d
istr
ibu
te.
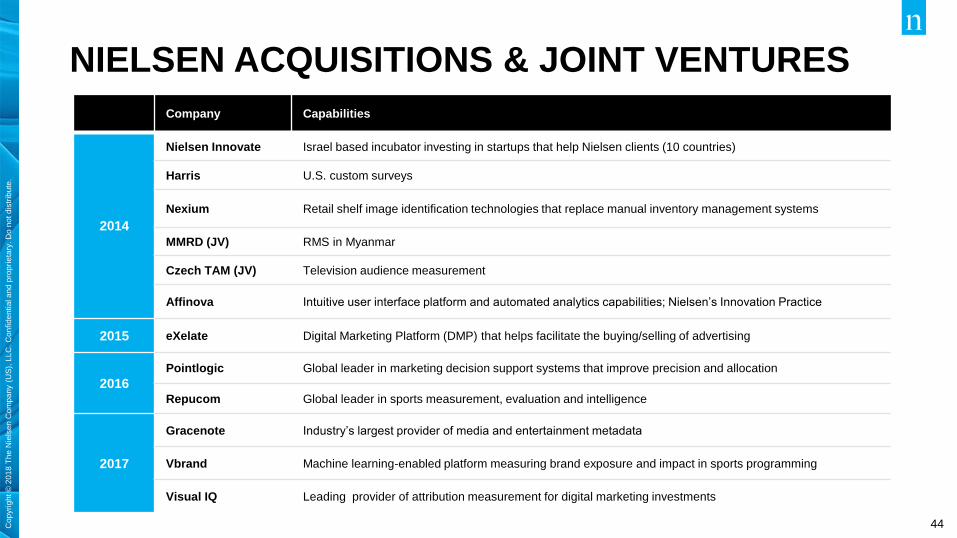
NIELSEN ACQUISITIONS & JOINT VENTURES
Company Capabilities
2014
Nielsen Innovate Israel based incubator investing in startups that help Nielsen clients (10 countries)
Harris U.S. custom surveys
Nexium Retail shelf image identification technologies that replace manual inventory management systems
MMRD (JV) RMS in Myanmar
Czech TAM (JV) Television audience measurement
Affinova Intuitive user interface platform and automated analytics capabilities; Nielsen’s Innovation Practice
2015 eXelate Digital Marketing Platform (DMP) that helps facilitate the buying/selling of advertising
2016
Pointlogic Global leader in marketing decision support systems that improve precision and allocation
Repucom Global leader in sports measurement, evaluation and intelligence
2017
Gracenote Industry’s largest provider of media and entertainment metadata
Vbrand Machine learning-enabled platform measuring brand exposure and impact in sports programming
Visual IQ Leading provider of attribution measurement for digital marketing investments

45Cop
yri
gh
t ©
20
18
Th
e N
iels
en
Com
pa
ny (
US
), L
LC
. C
on
fid
en
tia
l a
nd
pro
pri
eta
ry. D
o n
ot d
istr
ibu
te.
LONG TERM OUTLOOK
Note: All growth measures represented on constant currency basis.
CAPITAL ALLOCATION
FREE CASH FLOW CONVERSION
ADJ. EBITDA MARGIN
REVENUE
GAAP EPS
Grow dividend in line with earnings
Flex between M&A and share repurchase
Drive mid-single digit growth
Double digit growth
45-50% Adj. EBITDA
~50 bps
THIS IS NIELSEN

46
This artwork was created using Nielsen data.
Copyright © 2018 The Nielsen Company (US), LLC. Confidential and proprietary. Do not distribute.
APPENDIX

47Cop
yri
gh
t ©
20
18
Th
e N
iels
en
Com
pa
ny (
US
), L
LC
. C
on
fid
en
tia
l a
nd
pro
pri
eta
ry. D
o n
ot d
istr
ibu
te.
CERTAIN NON-GAAP MEASURESOverview of Non-GAAP Presentations
We use the non-GAAP financial measures discussed below to evaluate our results of operations, financial condition, liquidity and
indebtedness. We believe that the presentation of these non-GAAP measures provides useful information to investors regarding financial and
business trends related to our results of operations, cash flows and indebtedness and that when this non-GAAP financial information is viewed
with our GAAP financial information, investors are provided with valuable supplemental information regarding our results of operations, thereby
facilitating period-to-period comparisons of our business performance. These non-GAAP measures are also consistent with how management
evaluates the company’s operating performance and liquidity. In addition, these non-GAAP measures address questions the Company
routinely receives from analysts and investors and, in order to assure that all investors have access to similar data, the Company has
determined that it is appropriate to make this data available to all investors. None of the non-GAAP measures presented should be considered
as an alternative to net income or loss, operating income or loss, cash flows from operating activities, total indebtedness or any other
measures of operating performance and financial condition, liquidity or indebtedness derived in accordance with GAAP. These non-GAAP
measures have important limitations as analytical tools and should not be considered in isolation or as substitutes for an analysis of our results
as reported under GAAP. Our use of these terms may vary from the use of similarly-titled measures by others in our industry due to the
potential inconsistencies in the method of calculation and differences due to items subject to interpretation.
Constant Currency Presentation
We evaluate our results of operations on both an as reported and a constant currency basis. The constant currency presentation, which is a
non-GAAP measure, excludes the impact of fluctuations in foreign currency exchange rates. We believe providing constant currency
information provides valuable supplemental information regarding our results of operations, thereby facilitating period-to-period comparisons of
our business performance and is consistent with how management evaluates the company’s performance. We calculate constant currency
percentages by converting our prior-period local currency financial results using the current period exchange rates and comparing these
adjusted amounts to our current period reported results. No adjustment has been made to foreign currency exchange transaction gains or
losses in the calculation of constant currency net income.
Net Debt and Net Debt Leverage Ratio
The net debt leverage ratio is defined as net debt (gross debt less cash and cash equivalents) as of the balance sheet date divided by
Adjusted EBITDA for the twelve months then ended. Net debt and the net debt leverage ratio are commonly used metrics to evaluate and
compare leverage between companies and are not presentations made in accordance with GAAP.

48Cop
yri
gh
t ©
20
18
Th
e N
iels
en
Com
pa
ny (
US
), L
LC
. C
on
fid
en
tia
l a
nd
pro
pri
eta
ry. D
o n
ot d
istr
ibu
te.
CERTAIN NON-GAAP MEASURES
Adjusted EBITDA
We define Adjusted EBITDA as net income or loss from our consolidated statements of operations before interest income and
expense, income taxes, depreciation and amortization, restructuring charges, stock-based compensation expense and other non-
operating items from our consolidated statements of operations as well as certain other items that arise outside the ordinary
course of our continuing operations. We use Adjusted EBITDA to measure our performance from period to period both at the
consolidated level as well as within our operating segments, to evaluate and fund incentive compensation programs and to
compare our results to those of our competitors.
Free Cash Flow
We define free cash flow as net cash provided by operating activities, less capital expenditures, net. We believe providing free
cash flow information provides valuable supplemental liquidity information regarding the cash flow that may be available for
discretionary use by us in areas such as the distributions of dividends, repurchase of common stock, voluntary repayment of debt
obligations or to fund our strategic initiatives, including acquisitions, if any. However, free cash flow does not represent residual
cash flows entirely available for discretionary purposes; for example, the repayment of principal amounts borrowed is not
deducted from free cash flow. Key limitations of the free cash flow measure include the assumptions that we will be able to
refinance our existing debt when it matures and meet other cash flow obligations from financing activities, such as principal
payments on debt. Free cash flow is not a presentation made in accordance with GAAP.
(continued)

49Cop
yri
gh
t ©
20
18
Th
e N
iels
en
Com
pa
ny (
US
), L
LC
. C
on
fid
en
tia
l a
nd
pro
pri
eta
ry. D
o n
ot d
istr
ibu
te.
2018 GUIDANCE NON-GAAP RECONCILIATIONS($ in millions)
2018 Guidance % V Constant
Currency
2017 Constant
Currency
Total Revenue ~$6,860 ~3% $6,663
REVENUE RECONCILIATION

50Cop
yri
gh
t ©
20
18
Th
e N
iels
en
Com
pa
ny (
US
), L
LC
. C
on
fid
en
tia
l a
nd
pro
pri
eta
ry. D
o n
ot d
istr
ibu
te.
2018 GUIDANCE NON-GAAP RECONCILIATIONS($ in millions)
ADJUSTED EBITDA RECONCILIATION
2018 Guidance Range
Revised(a) Original
Net income $535 - $560 $500 - $525
Interest expense, net $385 - $395 $385 - $395
Provision for income taxes $275 - $295 $310 - $330
Depreciation and amortization $640 - $660 $640 - $660
Restructuring charges $85 - $95 $85 - $95
Stock-based compensation and other(b) $80 - $100 $100 - $120
Adjusted EBITDA $2,040 - $2,070 $2,060 - $2,090
FREE CASH FLOW
Net cash provided by operating activities ~$1,300
Less: Capital expenditures, net ~(500)
Free cash flow ~$800
NET DEBT LEVERAGE RATIO
Gross Debt ~$ 8,440
Cash ~$ 600
Net Debt ~$ 7,840
Adjusted EBITDA $2,040 - $2,070
Net Debt Leverage Ratio ~3.8x
(a) The change in Adjusted EBITDA reflects an update for ASU 2017-07, which impacted Adjusted EBITDA but not Net Income, and for the updated impact of foreign exchange if rates were held
constant as of April 25th, 2018.
(b) Other represents certain expenses that arise outside the ordinary course of our continuing operations. Such costs primarily include legal settlements, acquisition related expenses, business
optimization costs and other transaction costs.

51Cop
yri
gh
t ©
20
18
Th
e N
iels
en
Com
pa
ny (
US
), L
LC
. C
on
fid
en
tia
l a
nd
pro
pri
eta
ry. D
o n
ot d
istr
ibu
te.
ADJUSTED EBITDA RECONCILIATION – PRE-IMPACT OF ASU 2017-07
($ in millions)
2017 2016 2015 2014 2013 2012
Net income 429 502 570 384 740 273
(Income)/ loss from discontinued operations, net of tax - - - - (305) (30)
Interest expense, net 370 329 307 297 307 386
Provision / (benefit) for income taxes 388 309 383 236 91 122
Depreciation and amortization 640 603 574 573 510 493
EBITDA 1827 1,743 1,834 1,490 1,343 1,244
Equity in net (income)/ loss of affiliates - - 3 4 (2) (5)
Other non-operating loss/(income), net 38 3 (170) 168 30 134
Restructuring charges 80 105 51 89 119 85
Stock-based compensation expense 45 51 48 47 47 34
Other items (a) 45 36 92 39 80 12
Adjusted EBITDA $ 2,035 $ 1,938 $ 1,858 $ 1,837 $ 1,617 $ 1,504
(a) For the twelve months ended December 31, 2017, 2016, and 2015 other items primarily consists of transaction related costs and business optimization costs.

52Cop
yri
gh
t ©
20
18
Th
e N
iels
en
Com
pa
ny (
US
), L
LC
. C
on
fid
en
tia
l a
nd
pro
pri
eta
ry. D
o n
ot d
istr
ibu
te.
ADJUSTED EBITDA RECONCILIATION – REFLECTS IMPACT OF ASU 2017-07
($ in millions)
2017 2016 2015 2014 2013 2012
Net income 429 502 570 384 740 273
(Income)/ loss from discontinued operations, net of tax - - - - (305) (30)
Interest expense, net 370 329 307 297 307 386
Provision / (benefit) for income taxes 388 309 383 236 91 122
Depreciation and amortization 640 603 574 573 510 493
EBITDA 1827 1,743 1,834 1,490 1,343 1,244
Equity in net (income)/ loss of affiliates - - 3 4 (2) (5)
Other non-operating loss/(income), net(a) 27 (10) (165) 163 26 130
Restructuring charges 80 105 51 89 119 85
Stock-based compensation expense 45 51 48 47 47 34
Other items (b) 45 36 78 34 80 12
Adjusted EBITDA $ 2,024 $ 1,925 $ 1,849 $ 1,827 $ 1,613 $ 1,500
(a) 2017 - 2012 Adjusted EBITDA numbers are revised to reflect the adoption of ASU 2017-07 - Presentation of Net Periodic Pension Costs.
(b) For the twelve months ended December 31, 2017, 2016, and 2015 other items primarily consists of transaction related costs and business optimization costs.

53Cop
yri
gh
t ©
20
18
Th
e N
iels
en
Com
pa
ny (
US
), L
LC
. C
on
fid
en
tia
l a
nd
pro
pri
eta
ry. D
o n
ot d
istr
ibu
te.
FREE CASH FLOW RECONCILIATION($ in millions. Year ended December 31 for all years.)
2017 2016 2015 2014 2013 2012
Net cash provided by operating activities $1,310 $1,296 $1,209 $1,093 $901 $784
Nielsen foundation contribution - 36 – – – –
One-time Arbitron costs - – – – 46 –
Capital expenditures, net (447) (391) (401) (412) (374) (358)
Free Cash Flow $863 $941 $808 $681 $573 $426

54Cop
yri
gh
t ©
20
18
Th
e N
iels
en
Com
pa
ny (
US
), L
LC
. C
on
fid
en
tia
l a
nd
pro
pri
eta
ry. D
o n
ot d
istr
ibu
te.
FREE CASH FLOW RECONCILIATION (CONTINUED)($ in millions. Year ended December 31 for all years.)
2018E
Net cash provided by operating activities ~ $1,300
Capital expenditures, net ~(500)
Free Cash Flow ~$800

55Cop
yri
gh
t ©
20
18
Th
e N
iels
en
Com
pa
ny (
US
), L
LC
. C
on
fid
en
tia
l a
nd
pro
pri
eta
ry. D
o n
ot d
istr
ibu
te.
GUIDANCE NET DEBT AND NET DEBT
LEVERAGE RATIO RECONCILIATION (CONTINUED)
($ in millions. Year ended December 31 for all years.)
2018E
Gross debt ~$8,440
Less: cash and cash equivalents ~600
Net debt ~$7,840
Adjusted EBITDA $2,040-$2,070
Net debt leverage ratio ~3.8X
56Cop
yri
gh
t ©
20
18
Th
e N
iels
en
Com
pa
ny (
US
), L
LC
. C
on
fid
en
tia
l a
nd
pro
pri
eta
ry. D
o n
ot d
istr
ibu
te.
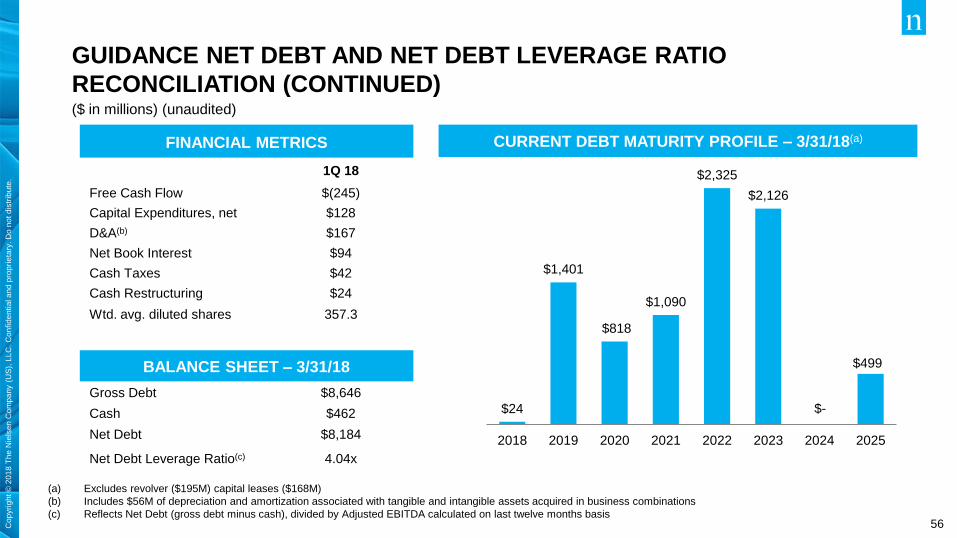
GUIDANCE NET DEBT AND NET DEBT LEVERAGE RATIO
RECONCILIATION (CONTINUED)($ in millions) (unaudited)
FINANCIAL METRICS
1Q 18
Free Cash Flow $(245)
Capital Expenditures, net $128
D&A(b) $167
Net Book Interest $94
Cash Taxes $42
Cash Restructuring $24
Wtd. avg. diluted shares 357.3
BALANCE SHEET – 3/31/18
Gross Debt $8,646
Cash $462
Net Debt $8,184
Net Debt Leverage Ratio(c) 4.04x
CURRENT DEBT MATURITY PROFILE – 3/31/18(a)
$24
$1,401
$818
$1,090
$2,325
$2,126
$-
2018 2019 2020 2021 2022 2023 2024 2025
$499
(a) Excludes revolver ($195M) capital leases ($168M)
(b) Includes $56M of depreciation and amortization associated with tangible and intangible assets acquired in business combinations
(c) Reflects Net Debt (gross debt minus cash), divided by Adjusted EBITDA calculated on last twelve months basis

57Cop
yri
gh
t ©
20
18
Th
e N
iels
en
Com
pa
ny (
US
), L
LC
. C
on
fid
en
tia
l a
nd
pro
pri
eta
ry. D
o n
ot d
istr
ibu
te.
DEBT CAPITAL TABLE($ in millions)
(a) Adjusted EBITDA calculated based on last twelve months basis
(b) Reflects Net Debt (gross debt minus cash), divided by Adjusted EBITDA calculated on last twelve months basis
(c) Excludes capital leases
58Cop
yri
gh
t ©
20
18
Th
e N
iels
en
Com
pa
ny (
US
), L
LC
. C
on
fid
en
tia
l a
nd
pro
pri
eta
ry. D
o n
ot d
istr
ibu
te.
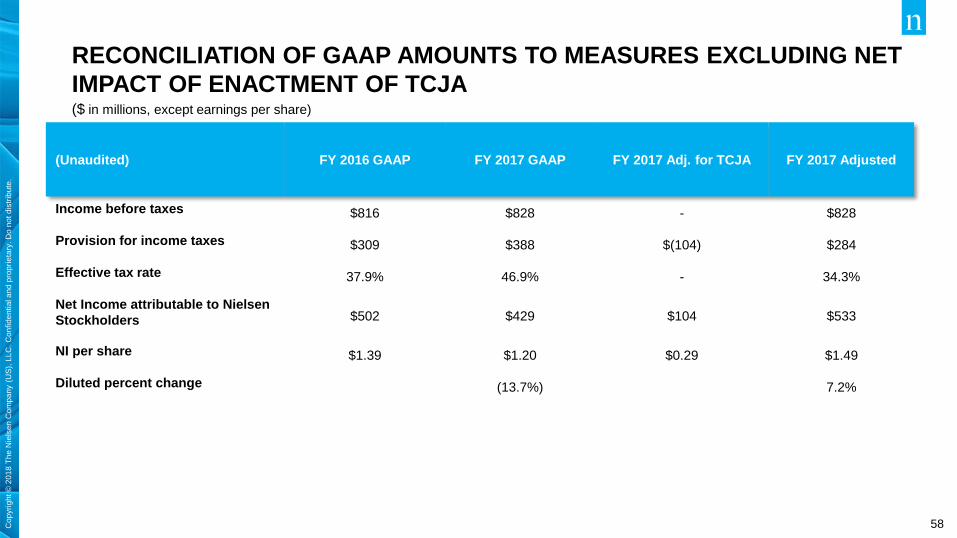
(Unaudited) FY 2016 GAAP FY 2017 GAAP FY 2017 Adj. for TCJA FY 2017 Adjusted
Income before taxes $816 $828 - $828
Provision for income taxes $309 $388 $(104) $284
Effective tax rate 37.9% 46.9% - 34.3%
Net Income attributable to Nielsen
Stockholders $502 $429 $104 $533
NI per share $1.39 $1.20 $0.29 $1.49
Diluted percent change (13.7%) 7.2%
RECONCILIATION OF GAAP AMOUNTS TO MEASURES EXCLUDING NET
IMPACT OF ENACTMENT OF TCJA($ in millions, except earnings per share)

59Cop
yri
gh
t ©
20
18
Th
e N
iels
en
Com
pa
ny (
US
), L
LC
. C
on
fid
en
tia
l a
nd
pro
pri
eta
ry. D
o n
ot d
istr
ibu
te.
NIELSEN INVESTOR RELATIONS
+1.646.654.4602
http://ir.nielsen.com
Follow @Nielsen

This artwork was created using Nielsen data.
Copyright © 2018 The Nielsen Company (US), LLC. Confidential and proprietary. Do not distribute.
THE SCIENCE BEHIND WHAT’S NEXT TM