nifb f16 final paper
TRANSCRIPT

Northern Illinois Food Bank Phase II Opportunity Analysis
Sponsored by
Partnering with
Northern Illinois University College of Business
Experiential Learning Center
Providing more meals for our children and families in need by Expanding access to federal programs
December 2, 2016
Together, we can bring more nutritious meals to children and families in need.


Executive Summary
Hunger is one of the fastest growing challenges facing children, individuals, and families. Northern Illinois Food Bank partnered with Northern Illinois University College of Business Experiential Learning Center (ELC) to help achieve the goal of providing more people in need with nutritious meals. The Northern Illinois Food Bank hopes to reach their #75MillionMealGoal per year by 2020. The ELC team conducted research that focused on federal Child Nutrition Programs (CNP) and Supplemental Nutrition Assistance Program (SNAP).
The ELC team collected research through online databases, other academic sources and the data provided by Northern Illinois Food Bank. The team’s intent was to help Northern Illinois Food Bank reach out and increase the number of meals served to those in need by locating partners and agencies that may be eligible to provide Child and Adult Care Food Program (CACFP) and Summer Food Service Program (SFSP) programs in underserved areas, and prioritizing locations with households eligible for the SNAP program. It developed dynamic tools for the Northern Illinois Food Bank to use, including cross-functional spreadsheets and a dashboard. It also developed communications materials to support this effort, including toolkits and companion video.
Child Nutrition Program
Deliverables
The CNP team’s deliverables include identifying geographic areas where new afterschool or summer sites may be added, developing a Northern Illinois Food Bank outreach materials “Outreach Toolkits” (and companion video), and identifying additional potential partnerships/agencies/”champions”
Conclusions x Existing program, if interested, by the USDA meals programs:
o CACFP 2016 � 29 potential sites � 250,560 potential meals � 1,392 estimated increase in the number of children
o SFSP 2016 � 22 potential Sites � 61,380 potential meals � 1,364 estimated increase in the number of children
x Organizations that may provide new programs where meals were identified in all counties except Grundy and Stephenson.

x Locations where children may gather and meals could be served were identified. The number of identified eligible area sites, but not presently active, ranged from 12 in Grundy County to 134 in Kane County.
x Potential sites who may be interested in what Northern Illinois Food Bank should offer with being an afterschool or summer site location with the Children’s Programs Outreach Toolkits
x Additional potential partnerships/agencies/”champions” exist and could be approached to build network\
x Results of both Phase I and II will provide more background information for Kaia Keefe-Oates, Feeding America Child Hunger Corp Member, to support the Community Needs Assessment she is developing for the Food Bank’s Children’s Programs.
Recommendations The recommendations for implementation include:
x Use the database spreadsheets to identify potential existing programs with meal
opportunities. x Review and incorporate results into Community Needs Assessment Study. x Contact other potential programs who may be able to partner to serve meals. x Continue communications with 4-C and other child care reference and referral
agencies to broaden reach to child care providers. x Join service and nonprofit networks to build awareness that may lead to more
site partners or program champions. x Review Child Nutrition Programs Outreach Toolkits, contact the ELC if additional
design services are desired, and utilize the toolkits beginning in spring 2017. Supplemental Nutrition Program Deliverables The SNAP team’s deliverables include creating an optimized SNAP Needs Assessment Profile, refining served/underserved meals assumptions and computations, and providing a direct mail zip code list and map for all census tracts in the 13-county Northern Illinois Food Bank service area for a planned 2017 release.
Conclusions
The Phase II Snap team concludes that Northern Illinois Food Bank should utilize the deliverables presented to come closer to reaching the #75MillionMealGoal. The deliverables included an optimized Needs Assessment Profile, research on the data disparity (regarding both the meals calculator and senior data), and the zip code mailing list database.

Recommendations The following are recommendations to the Northern Illinois Food Bank to ensure utilization of the deliverables.
x Needs Assessment Profile Optimization (Database Improvement) and Manager Reports
o Use Pivot Tables, Pivot Charts, and Slicers to summarize data o Static Operating Report for use by those who may not need full access to
the data provided by the Profile o Dashboard as a one-sheet, visual representation of the data within the
Profile, and o Heat maps to easily identify areas of need and prioritize actions needed.
x Data Disparity - Reconcile and improve the accuracy of household reporting:
o Apply a conversion factor to American Census Survey (ACS) data and use for SNAP-based meals calculator
o After determining the conversion factor that will allow Northern Illinois Food Bank to efficiently convert between the SNAP Needs Assessment Profile and SNAP-based meals calculator, it must be applied to the ACS data
o Once the conversion factor has been applied, input the updated data into the Feeding America SNAP-based meals calculator to determine served and underserved meal consumption.
x Seniors o As shown in the heat maps, the areas of need have changed from the
Phase I to Phase II reports o Outreach activities for regional managers should focus on areas of highest
need, whether that be more efficient by using tracts with highest percentages of households that lack enrollment, or tracts with highest number of households that lack enrollment
x Direct Mailing List o When census tracts are updated in 2020, add the extended tract number
format of census tract in addition to the shorthand numbers so the SNAP team will be able to use the Excel V-LOOKUP function instead of the MATCH function
o For the census tracts with a score of zero in the heat maps, additional sites that are outside of American Census Survey and Food and Nutrition Service (FNS) data need to be used to get an accurate representation of need at the census tract level for those areas (for now, assume need in those areas is similar to surrounding census tract)


P a g e | 1
Table of Contents
INTRODUCTION ............................................................................................................... 4 EXPERIENTIAL LEARNING CENTER PROJECT PHASE II TEAM MEMBERS............................... 6 PROJECT OVERVIEW..................................................................................................... 12 CONCLUSIONS: CHILD NUTRITION PROGRAM .................................................................. 16 CONCLUSIONS: SNAP PROGRAM .................................................................................. 18
SECTION A: CHILD NUTRITION PROGRAMS ........................................................... 21
PROJECT GOALS .......................................................................................................... 22 BACKGROUND .............................................................................................................. 22 COUNTY REVIEWS ........................................................................................................ 25 KEY RESOURCES ......................................................................................................... 25 METHODOLOGY ............................................................................................................ 26 FINDINGS BY COUNTY................................................................................................... 35 OVERALL FINDINGS ...................................................................................................... 44 OPPORTUNITY ANALYSIS ............................................................................................... 46 CHILD NUTRITION PROGRAMS PARTNER AGENCIES ......................................................... 49 CHILD NUTRITION PROGRAMS OUTREACH TOOLKITS ....................................................... 52 CONCLUSION ............................................................................................................... 56 RECOMMENDATIONS ..................................................................................................... 57 APPENDIX A1: OUTREACH TOOLKITS ................................................................... 59 CNP BIBLIOGRAPHY ..................................................................................................... 85
SECTION B: SUPPLEMENTAL NUTRITION ASSISTANCE PROGRAM ................... 87
PROJECT GOALS .......................................................................................................... 88 BACKGROUND .............................................................................................................. 89 NEEDS ASSESSMENT PROFILE OPTIMIZATION ................................................................. 91 DATA DISPARITY .......................................................................................................... 99 SENIORS .................................................................................................................... 107 DIRECT MAILING LIST .................................................................................................. 120 APPENDIX B1: DATA DISPARITY ........................................................................... 129 APPENDIX B2: SENIORS ........................................................................................ 141 APPENDIX B3: DATA DISPARITY ANOMOLY ........................................................ 163 SNAP BIBLIOGRAPHY ................................................................................................. 166
APPENDIX C: BUSINESS CASE ............................................................................. 167

P a g e | 2

P a g e | 3
RESEARCH ANALYSIS

P a g e | 4
Introduction
This research project was conducted by the Experiential Learning Center (ELC) Team of the College of Business, Northern Illinois University. It explored opportunities for the Child Nutrition Program (CNP) and Supplemental Nutrition Assistance Program (SNAP) expansion in Northern Illinois Food Bank’s 13-county service area. Areas and specific programs where individuals, children, families, and communities are eligible for afterschool, summer meals and SNAP benefits were identified. Phase I Standard Operating Procedures for both CNP and SNAP were utilized and adapted as necessary facilitate research. This project was the second phase of a two-part study. Phase I took place during Spring 2016, and the tools and research materials created during that time were used as a foundation for the continuation of the project during Phase II. Research for the study was conducted using various other sources including the ELC Phase I report, government agencies, organization analysis, and industry information. See CNP and SNAP report sections for details. Experiential Learning Center The NIU College of Business Experiential Learning Center (ELC) connects teams of the very best students with organizations to work on real-world business issues. Over the course of a 16-week collaboration, NIU students apply their energies and talents to help solve cross-functional business issues.

P a g e | 5
Recognitions Northern Illinois Food Bank The members of the Northern Illinois Food Bank Sponsor Team are:
x Jennifer Lamplough – Director of Nutrition Programs, Executive Chief x Jessica Willis – Child Nutrition Program Manager x Hollie Baker-Lutz – Manager of Healthy Community Programs
The NIU ELC team would like to thank the Sponsor Team for their time, resources, professional expertise, and relentless support to help facilitate project research. The complexities of their roles as they relate to meeting program eligibility requirements and seeking growth opportunities for the Food Bank is much appreciated. The leadership and teamwork provided by the Sponsor Team was critical to the project. Additional members of the Northern Illinois Food Bank who provided us with their valuable expertise are listed below. The members of Child Nutrition Team are:
x Kaia Keefe-Oates - Feeding America Child Hunger Corp Member x Dawn Yarbrough - Child Nutrition Program Specialist
The members of the Child Nutrition Program Communications Department are:
x Elizabeth Gartman - Communications Manager x Jennifer Nau - Director of Communications
A special “thank you” to:
x Julie Yurko – President and CEO, Northern Illinois Food Bank x Mike Korkosz – ELC Project Sponsor, Jewel-Osco.
Outside Consultants
x Brad Blackwell - Food Nutrition & Services Program Supervisor, Feeding America (SNAP)
x Jules Burke - Owner and Director, SMART Productions, Inc. (CNP) Northern Illinois University The members of NIU who volunteered their time to help the cause of this project include:
x Ryan Adamovic - Student Volunteer, Outreach Video for Toolkit (CNP) x Sue Anderson - IT Coordinator, College of Business Advancement Office (CNP) x Wayne Finley - Business Librarian and Associate Professor (SNAP) x Jared Jones - ELC Subject Matter Consultant (CNP) x Marisa Mertes - Student Volunteer, Outreach Video for Toolkit (CNP) x Kenzie Niestron - ELC Communications Consultant (CNP and SNAP)

P a g e | 6
Experiential Learning Center Project Phase II Team Members
Left to right, top row: Carson Schwaller, Amanda Mapes, Ian LIvingston, Collin Plumb Left to right, bottom row: Danna Zabratanski, Nilema Patel, Emma Ray, Rebecca Wiebenga
Junior Consultants, CNP Team Nilema Patel B.S. Management, December 2017 Nilema moved to DeKalb during the third grade and graduated from DeKalb High School. She has become very involved in various campus organizations including joining Alpha Delta Pi sorority where she was appointed Director of Standards and Ethics, followed by Finance Vice President, and she currently holds the position of Panhellenic Delegate. She has also served an internship with Illinois Public Interest Research Group (PIRG), and the Odyssey. Her personal interests include volunteering in the community, and taking long walks with her dog. One of her biggest strengths is being straightforward with people and team members; she tries to be direct when it comes to completing tasks, especially when other people are relying on her. Other strengths she brings to the team are organizational skills, the ability to meet deadlines, and effective communication. Joining the ELC project has brought many opportunities for her. She has learned how to work on a real world situation, work in a team under pressure, and lead a team meeting. She is hoping that her work from this semester will provide more meals for those children. She is very happy that she joined Northern Illinois Food Bank team and hopes to carry on her experiences and lessons learned to the real world.

P a g e | 7
Collin Plumb B.S. Corporate Communications, December 2017 Collin is a junior. He routinely volunteers his time and has served many nonprofits including Feed My Starving Children, Special Olympics, Lazarus House homeless shelter, and he has led youth groups for his church, etc. Because of this experience he can provide perspective on operations that were similar to the ones where he has volunteered. He played several sports while growing up including about eight years of football. This experience helped him learn how important it is to work together as a team. His work experience includes employment at Office Depot as a Customer Service Specialist for three years and his work in the Technology Department will help him bring innovative ideas to the project. The strengths he brings to the ELC include teamwork, leadership, and teaching others how to communicate and work cohesively in a team. He brought his past team experiences to this Northern Illinois Food Bank project. In this project, he was satisfied impacting the community and providing access to food to people who need it. He deeply admires what Northern Illinois Food Bank is doing and was honored to play a part in helping it impact more and more people. Collin’s involvement from the Northern Illinois Food Bank project has taught him many valuable life skills. He has learned the tools and expertise to accomplish effective leadership and group communication to coordinate tasks. ELC has sharpened his ability to give public presentations. ELC has been a tremendous learning experience and has provided him with additional tools and knowledge on how to be successful. Rebecca Wiebenga B.S. Finance, May 2017 Certificate, Information Systems Rebecca will be graduating in May of 2017 with a Bachelor of Science Degree in Finance and a Certificate in Information Systems. Rebecca pursued working on this particular project because of its focus on programs and issues that she has personally experienced. She is a mother of a five-year-old boy and has endured the stressful experience of being in need of public assistance programs in order to manage the cost of raising a child. She is currently working while attending NIU, but has also relied on SNAP, food pantries, etc., so she may feed her family and pursue a college degree that will help her achieve a more secure future. The skills she brought to the ELC team include leadership, time management, and personal life experiences to help bring a more real world understanding of challenges persons in need face. She hopes to help Northern Illinois Food Bank expand on the subjects the team worked on, identify more available opportunities, and be able to help more families like hers.

P a g e | 8
Junior Consultants, SNAP Team Ian Livingston B.S. Accountancy, May 2017 Ian is in the Honors program and is also seeking a minor in Civil Leadership and Civic Engagement. He presently works for NIU Housing and Dining as a Community Advisor at New Residence Hall. While in school, he has also worked with nonprofits including Feed My Starving Children, Goodwill, and Heartland Blood Centers. Ian has performed tax work for Allied Partners in Accounting and the VITA program sponsored by Goodwill to blend his major emphasis and volunteer efforts. He also has experience in operations management, sales, and customer engagements/satisfaction due to his service as a Branch Manager for College Works Painting. The skills he brought to the ELC team include his strong work ethic, strategy development, and teamwork skills. In his free time he likes strategy games, baseball, and golf. Ian served an outreach and engagement internship with Northern Illinois Food Bank during the summer of 2016. He became familiar with its outreach model and brought this experience to the team. His goal upon graduation is to work in the nonprofit sector as an accountant. The ELC experience has provided valuable exposure to the inner workings of what goes on behind the scenes of a nonprofit, and how exactly they impact the lives of so many people. It has been a great opportunity for him to aid in the needs assessment for the SNAP team so they can properly allocate resources to where they are needed most. He really hopes that the research done will prove valuable in achieving Northern Illinois Food Bank’s #75MillionMealGoal by 2020. He would also like to thank the Northern Illinois Food Bank team for all their support this semester, and for the work they continue to do throughout Northern Illinois. Emma Ray B.S. Finance, December 2017 Emma is from Madison, Wisconsin and graduated from Verona Area High School in June, 2014. She chose NIU because she was offered a scholarship to play collegiate softball. She is currently a pitcher and the skills she has learned during her student career will benefit her in whatever profession she chooses to pursue. The strengths she brought to the ELC team included her significant amount of team experience, effective time management skills, and the ability to lead a large group. She has volunteered over 60 hours while attending NIU by helping organizations such as Feed My Starving Children, DeKalb Corn Fest, and DeKalb Rehab and Nursing Center. Her strong worth ethic and dedication to this ELC project helped lead the team to successfully achieve its goal. She gained valuable work experience and was able to use the skills and knowledge developed in the classroom setting to the Northern Illinois Food Bank project. She is honored that she was able to use her analytical skills and

P a g e | 9
intellect to help Northern Illinois Food Bank. And, that the hard work of the ELC team will positively impact the lives of many individuals in the Northern Illinois Food Bank 13-county service area. Daniel Zabratanski B.S. Finance, May 2017 Danny grew up in Lindenhurst, Illinois, a small village outside of Gurnee. Coming into college, he knew he wanted to pursue a career in the business world. He loved the excitement and competitive nature that came with it and it was really the only thing that caught his attention after high school. He chose to major in Finance because he is skilled in math and really enjoys working with numbers. He felt those skills would be a solid foundation for a Finance major, and four years later he believes he made the right choice. Over the past 18 months, he has become more involved in the College of Business. Currently, he is Executive Board Chair of the Financial Management Association, and is also a member of the Finance Department Student Advising Board. He is also enrolled in the Finance Department Student Managed Portfolio program and during this past summer, he was one of only a few students selected to manage a portfolio of close to $350,000. He applied to serve on the Dean’s Student Advising Board, and joined the Investment Association this semester. He is presently pursuing many types of experience so he can build his resume and differentiate himself from other students. After college, he hopes to work in either corporate treasury or financial analysis. The strengths Danny brought to the team included his intellect, strong work ethic, ambition, professionalism, and dedication. He fully dedicates himself to every task he pursues. His goal is always to be the best that he can be and do whatever it takes to “get the job done”. He also tries to motivate others to do their best also. Whether it be a part-time job, school, extracurricular organizations, or an Experiential Learning Center project, he commits to do the best job he possibly can. He gained valuable experience during this project. He is excited to know he worked towards the goal of bringing more meals to hungry individuals, and that his contribution will improve so many lives. Amanda Mapes B.S. Accountancy, December 2017 M.A.S., May 2018 Amanda was raised by a single mother in Montrose, Iowa. As a young girl, she lived in poverty and she started her first summer job at the age thirteen after convincing the owner of a local game farm to hire her. With the money earned from her dedication to hard work she bought the necessary school supplies and sports uniforms so she could participate in school activities, and was also able to save enough to buy a modest vehicle and make the necessary down payments to become a first-generation college student. Once in college, however, it was not an easy road due in large part to her minimal income and inability to secure regular meals. As a member of the low-income

P a g e | 10
population for most her adult years, she brings a unique understanding of the importance of healthy meals to the community and believes having a full stomach should not be a privilege. Amanda is an active student at NIU and an active volunteer in the community. She serves as President-Elect of Beta Alpha Psi, Ambassador for International Business Seminars, and a member of Accountancy Leadership Advisory Council. Through the semester, Amanda contributed to the team by utilizing her strong organizational skills and attention to detail. She strengthened her teamwork skills and also served as a floater between the SNAP and CNP teams by providing extra help as needed.

P a g e | 11
Leadership Team
Carson Schwaller B.S. Operations Management and Information Systems, December 2016 Carson is in his final semester as an OMIS student. He was an intern with Sears Holding Corporation over the summer. Carson was on Northern Illinois Food Bank Phase I ELC project, and really enjoyed working on the challenges it presented. He thought serving as an ELC Assistant Coach would be a good differentiator compared to the opportunities most students have. And, by continuing the work from last semester, he was able to share the experience and knowledge he gained to help the Phase II team. Working on a real world problem, gaining project management experience, learning time management, and honing leadership skills is something a lot of students do not get the opportunity to do. Carson has a full time job set up after graduation working as a Supply Chain Analyst with Kerry Group. He is excited to get into the workforce and be able to continue to learn and grow. Barbara Fox, CPA, MAS Faculty Coach B.S. Accountancy, Illinois State University M.A.S. Northern Illinois University Faculty Coach, Northern Illinois Food Bank-ELC Spring 2016 Barb joined the NIU College of Business faculty in 2000 after serving over 20 years in industry. Her primary teaching responsibility is in the interdisciplinary business core, which is a team-based experiential principles course for undergraduates. With this role, and as an ELC Faculty Coach, she has extensive experience working with student teams and business professionals. She is also a Faculty Advisor for the Business Careers House, a Living-Learning Community, and has served as instructor for the Department of Accountancy and NIU CPA Review. Prior to joining NIU, Barb held roles of manager, director, and chief tax officer at a publicly-held, multinational company in the agricultural genetics and seed biotechnology industry. Her volunteer service includes Board membership for several nonprofit organizations in DeKalb County.

P a g e | 12
Project Overview
Northern Illinois Food Bank – NIU Experiential Learning Center Project Our goal is to provide more meals for children and families in need by expanding access to federal programs. Northern Illinois Food Bank – NIU Experiential Learning Center Project Goals The ELC team’s goal is to help Northern Illinois Food Bank:
● Increase the number of children receiving nutritious meals ● Expand the SNAP program to help provide food resources for families
Northern Illinois Food Bank Overview Northern Illinois Food Bank is a nonprofit, Section 501(c)(3) organization within the food banking industry. Its mission is to lead the Northern Illinois community in helping solve hunger by providing nutritious meals to those in need through innovative programs and partnerships. Although significant improvements in the economy have occurred since The Great Recession (2007-2009), many neighborhood communities are still at risk of hunger. Hungry neighbors with unmet needs drive efforts to be proactive. As a result, Northern Illinois Food Bank has set an ambitious goal to provide every meal, every day, for every hungry neighbor by the year 2020. The #75MillionMealGoal commitment was made to expand efforts to reach out to persons in need.
Exhibit 1.1 Summarizes Strategic Goals for Meals Served

P a g e | 13
Northern Illinois Food Bank is a partner in the 200-member network of Feeding America, the nation’s largest hunger-relief charity. This strategic relationship supports the Food Bank’s operations. The total food bank member network provides food assistance to an estimated 46.5 million Americans in need each year, including 12 million children and 7 million seniors. The Feeding America national office supports members by providing food bank programs, securing food inventory and funding, etc., with the goal of improving food security nationwide. The supply chain for the food banking industry as illustrated in the Feeding America “Hunger in America 2014” study is provided below in Exhibit 1.2.
Exhibit 1.2 Hunger in America Study: Sources of Food and Channels of Food Distribution

P a g e | 14
Northern Illinois Food Bank partners with a network of 800 agencies who operate food programs such as food pantries, soup kitchens, and shelters to distribute food to individuals and families in need. Northern Illinois Food Bank also relies on food manufacturers, retailers, companies, foundations, and individuals who share a vision for no one to be hungry. It also provides other support services including:
● Child Nutrition Programs ● Nutrition Education ● SNAP Outreach
Northern Illinois University students participate in the shared goal of identifying areas where Northern Illinois Food Bank can reach more children and families who may benefit from food assistance. In 2015, Northern Illinois Food Bank served nearly 600,000 unique people with more than 71,000 meals each week. About 57 million meals were served to hungry people in need. During 2016, the number of meals increase by 5.5 million to 62.5 million. Northern Illinois Food Bank covers a 13-county service area. The counties served are: Boone, DeKalb, DuPage, Grundy, Kane, Kankakee, Kendall, Lake, McHenry, Ogle, Stephenson, Will, and Winnebago.
Exhibit 1.3 Northern Illinois Food Bank 13-County Service Area

P a g e | 15
Northern Illinois Food Bank receives several types of funding. There is support through federal hunger-relief funding in the form of grants, meal reimbursements, and commodities as well as state and local resources. The Northern Illinois Food Bank Child Nutrition Program (CNP) supports meal and milk service programs for children in schools, day care facilities, family and group day care homes, and summer camps. CNP is responsible for afterschool, summer and backpack programs. This research project focused on the federally funded programs for Child and Adult Care Food Program (CACFP) and Summer Food Service Program (SFSP). The federally funded Supplemental Nutrition Program (SNAP) supports millions of eligible, low income individuals, families and communities through the provision of nutritional assistance and economic benefits. The research focused on identifying need and outreach efforts. Deliverables Child Nutrition Program:
● Identify geographic areas where new afterschool or summer sites may be added ● Develop Northern Illinois Food Bank outreach materials “Outreach Toolkits” ● Identify additional potential partnerships/agencies/”champions”
Supplemental Nutrition Assistance Program:
● SNAP Needs Assessment Profile ● Refine served/underserved meals assumptions and computations ● Provide a direct mail zip code list and map for all census tracts in the 13-county
Northern Illinois Food Bank service area for a planned 2017 release NIU ELC Team: Learning About Poverty in America An essential part of the team’s research included viewing the video A Place at the Table, directed and produced by Kristi Jacobson and Lori Silverbush (2012). This source demonstrated “how hunger poses serious economic, social, and cultural implications for the United States and it could be solved once and for all, if the American public decides that making healthy food available and affordable is in the best interest of all”. Members of the team also visited a children’s afterschool program, a Northern Illinois Food Bank pantry location, and volunteered at Northern Illinois Food Bank. The team members were humbled by their experiences learning about hunger. Each member dedicated themselves to the project and brought their unique skills together to complete the project deliverables.
Together, we can bring more nutritious meals to children and families in need

P a g e | 16
Conclusions: Child Nutrition Program
Over the course of this project, the CNP Team has identified:
● Existing programs, if interested, by the USDA meals programs: ■ CACFP 2016
● 29 potential sites ● 250,560 potential meals ● 1,392 estimated increase in the number of children
■ SFSP 2016 ● 22 potential Sites ● 61,380 potential meals
● 1,364 estimated increase in the number of children ● Organizations that may provide new programs where meals were identified in all
counties except Grundy and Stephenson.
● Locations where children may gather and meals could be served were identified. The number of identified eligible area sites, but not presently active, ranged from 12 in Grundy County to 134 in Kane County.
● Potential sites who may be interested in what Northern Illinois Food Bank should
offer with being an afterschool or summer site location with the Children’s Programs Outreach Toolkits
● Additional potential partnerships/agencies/”champions” exist and could be
approached to build network
● Results of both Phase I and II will provide more background information for Kaia Keefe-Oates, Feeding America Child Hunger Corp Member, to support the Community Needs Assessment she is developing for the Food Bank’s Children’s Programs.

P a g e | 17
Recommendations
● Use the database spreadsheets to identify potential existing programs with meal opportunities.
● Review and incorporate results into Community Needs Assessment Study. ● Contact other potential programs who may be able to partner to serve meals. ● Continue communications with 4-C and other child care reference and referral
agencies to broaden reach to child care providers. ● Join service and nonprofit networks to build awareness that may lead to more
site partners or program champions. ● Review Child Nutrition Programs Outreach Toolkits, contact the ELC if additional
design services are desired, and utilize the toolkits beginning in spring 2017.

P a g e | 18
Conclusions: SNAP Program
The Phase II Snap team concludes that Northern Illinois Food Bank should utilize the deliverables presented to come closer to reaching the #75MillionMealGoal. The deliverables included an optimized Needs Assessment Profile, research on the data disparity (regarding both the meals calculator and senior data), and the zip code mailing list database. Recommendations These recommendations are for the Northern Illinois Food Bank to utilize the deliverable items that are presented in Exhibit 23. Needs Assessment Profile Optimization (Database Improvement) and Manager Reports Enhance the utility of the Needs Assessment Profile by including following:
● Pivot Tables, Pivot Charts, and Slicers to summarize data ● Static Operating Report for use by those who may not need full access to the
data provided by the Profile ● Dashboard as a one-sheet, visual representation of the data within the Profile, and ● Heat maps to easily identify areas of need and prioritize actions needed.
Data Disparity Reconcile and improve the accuracy of household reporting:
● Apply a conversion factor to American Census Survey (ACS) data and use for SNAP-based meals calculator
● After determining the conversion factor that will allow Northern Illinois Food Bank to efficiently convert between the SNAP Needs Assessment Profile and SNAP-based meals calculator, it must be applied to the ACS data
● Once the conversion factor has been applied, input the updated data into the Feeding America SNAP-based meals calculator to determine served and underserved meal consumption.
Seniors
● As shown in the heat maps, the areas of need have changed from the Phase I to Phase II report
● Outreach activities for regional managers should focus on areas of highest need, whether that be tracts with highest percentages of households that lack enrollment, or tracts with highest number of households that lack enrollment (whichever proves to be more efficient)

P a g e | 19
Direct Mailing List When census tracts are updated in 2020, add the extended tract number format of census tract in addition to the shorthand numbers so the SNAP team will be able to use the Excel V-LOOKUP function instead of the MATCH function. For the census tracts with a score of zero in the heat maps, additional sites – outside of American Census Survey and Food and Nutrition Service (FNS) data – need to be used to get an accurate representation of need at the census tract level for those areas. For now, assume need in those areas is similar to surrounding census tracts

P a g e | 20

P a g e | 21
SECTION A: CHILD NUTRITION PROGRAMS
P a g e | 22
Project Goals
The NIU-ELC project team will help Northern Illinois Food Bank increase the number of nutritious meals served to children in afterschool and summer programs by:
● Identify geographic areas where new afterschool or summer sites may be added ● Develop Northern Illinois Food Bank outreach materials “Outreach Toolkits” ● Identify additional potential partnerships/agencies/”champions”
Background
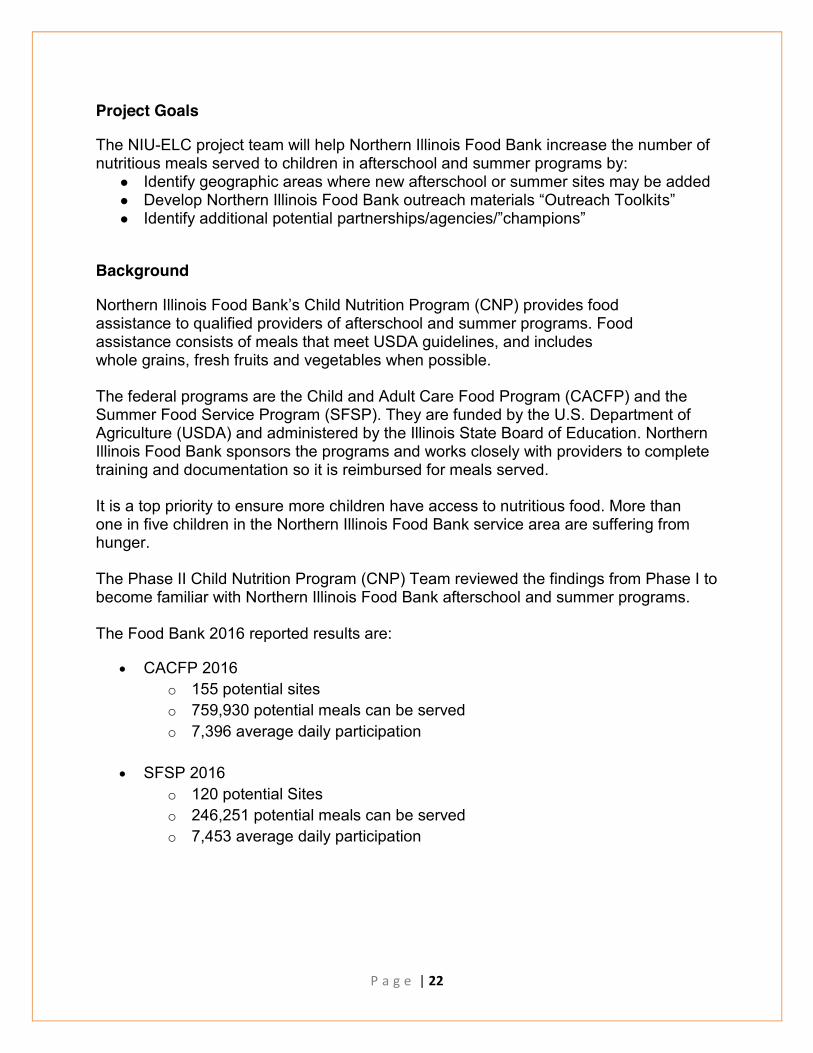
Northern Illinois Food Bank’s Child Nutrition Program (CNP) provides food assistance to qualified providers of afterschool and summer programs. Food assistance consists of meals that meet USDA guidelines, and includes whole grains, fresh fruits and vegetables when possible. The federal programs are the Child and Adult Care Food Program (CACFP) and the Summer Food Service Program (SFSP). They are funded by the U.S. Department of Agriculture (USDA) and administered by the Illinois State Board of Education. Northern Illinois Food Bank sponsors the programs and works closely with providers to complete training and documentation so it is reimbursed for meals served. It is a top priority to ensure more children have access to nutritious food. More than one in five children in the Northern Illinois Food Bank service area are suffering from hunger. The Phase II Child Nutrition Program (CNP) Team reviewed the findings from Phase I to become familiar with Northern Illinois Food Bank afterschool and summer programs. The Food Bank 2016 reported results are:
x CACFP 2016 o 155 potential sites o 759,930 potential meals can be served o 7,396 average daily participation
x SFSP 2016
o 120 potential Sites o 246,251 potential meals can be served o 7,453 average daily participation
P a g e | 23
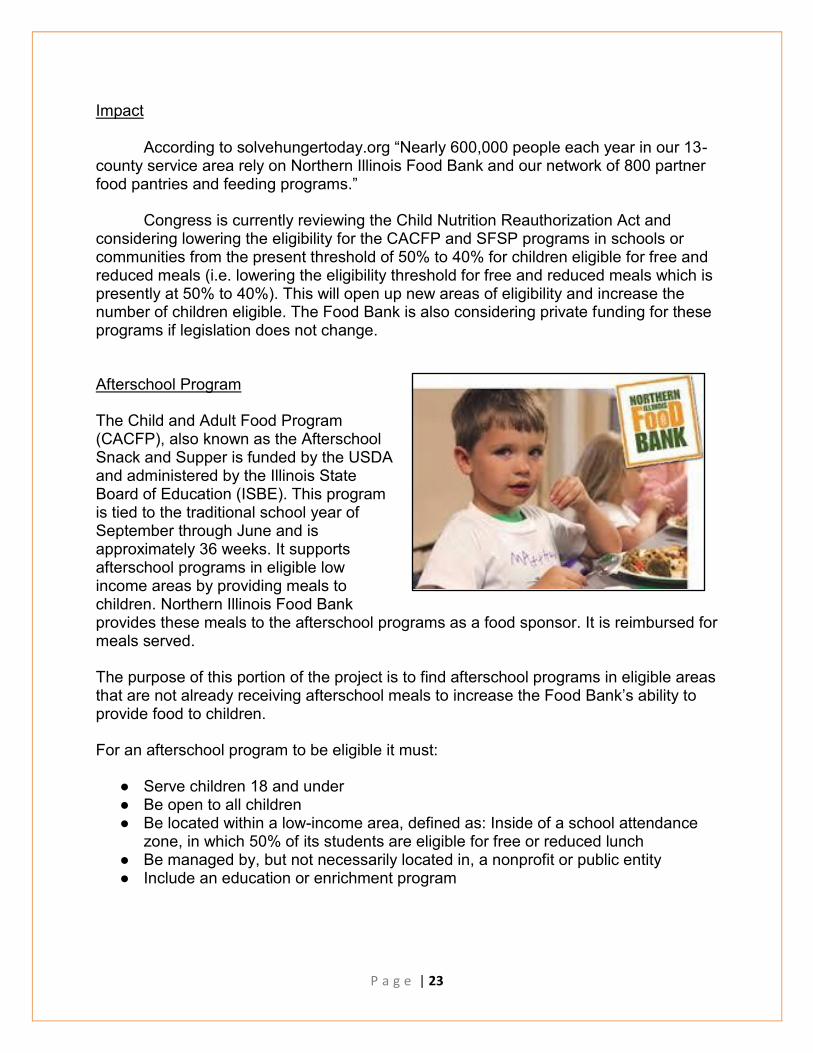
Impact
According to solvehungertoday.org “Nearly 600,000 people each year in our 13-county service area rely on Northern Illinois Food Bank and our network of 800 partner food pantries and feeding programs.”
Congress is currently reviewing the Child Nutrition Reauthorization Act and
considering lowering the eligibility for the CACFP and SFSP programs in schools or communities from the present threshold of 50% to 40% for children eligible for free and reduced meals (i.e. lowering the eligibility threshold for free and reduced meals which is presently at 50% to 40%). This will open up new areas of eligibility and increase the number of children eligible. The Food Bank is also considering private funding for these programs if legislation does not change. Afterschool Program The Child and Adult Food Program (CACFP), also known as the Afterschool Snack and Supper is funded by the USDA and administered by the Illinois State Board of Education (ISBE). This program is tied to the traditional school year of September through June and is approximately 36 weeks. It supports afterschool programs in eligible low income areas by providing meals to children. Northern Illinois Food Bank provides these meals to the afterschool programs as a food sponsor. It is reimbursed for meals served. The purpose of this portion of the project is to find afterschool programs in eligible areas that are not already receiving afterschool meals to increase the Food Bank’s ability to provide food to children. For an afterschool program to be eligible it must:
● Serve children 18 and under ● Be open to all children ● Be located within a low-income area, defined as: Inside of a school attendance
zone, in which 50% of its students are eligible for free or reduced lunch ● Be managed by, but not necessarily located in, a nonprofit or public entity ● Include an education or enrichment program
P a g e | 24
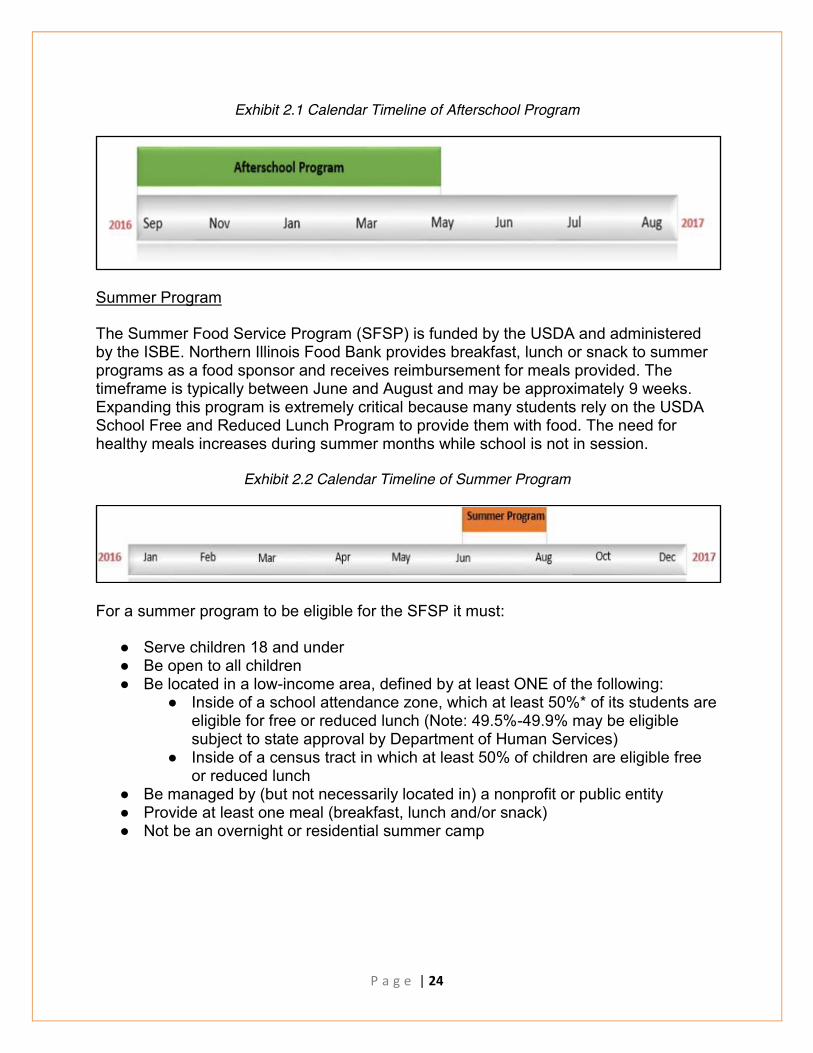
Exhibit 2.1 Calendar Timeline of Afterschool Program
Summer Program The Summer Food Service Program (SFSP) is funded by the USDA and administered by the ISBE. Northern Illinois Food Bank provides breakfast, lunch or snack to summer programs as a food sponsor and receives reimbursement for meals provided. The timeframe is typically between June and August and may be approximately 9 weeks. Expanding this program is extremely critical because many students rely on the USDA School Free and Reduced Lunch Program to provide them with food. The need for healthy meals increases during summer months while school is not in session.
Exhibit 2.2 Calendar Timeline of Summer Program
For a summer program to be eligible for the SFSP it must:
● Serve children 18 and under ● Be open to all children ● Be located in a low-income area, defined by at least ONE of the following:
● Inside of a school attendance zone, which at least 50%* of its students are eligible for free or reduced lunch (Note: 49.5%-49.9% may be eligible subject to state approval by Department of Human Services)
● Inside of a census tract in which at least 50% of children are eligible free or reduced lunch
● Be managed by (but not necessarily located in) a nonprofit or public entity ● Provide at least one meal (breakfast, lunch and/or snack) ● Not be an overnight or residential summer camp

P a g e | 25
County Reviews
Additional afterschool and summer programs were identified for the remaining areas not previously reviewed in Phase I. These include Boone, DeKalb, Grundy, Kane, Kankakee, Kendall, Ogle, and Stephenson counties.
Exhibit 3 Summary of Counties Completed By Project Phase
Key Resources
The following contacts and sources were utilized to complete the county reviews. Contacts
● Jennifer Lamplough – Director of Nutrition Programs, Executive Chief ● Jessica Willis – Child Nutrition Program Manager ● Kaia Keefe-Oates - Feeding America Child Hunger Corp Member ● Jared Jones - ELC Subject Matter Consultant (CNP)
Key Information Sources Afterschool sources include:
● ISBE FY16 CACFP Eligibility Listing. This documents school eligibility ratings for the National Free and Reduced Lunch Program; a qualifier for CACFP. Source for 50% or more.
● Northern Illinois Food Bank: County Fact Sheets 2016
● Northern Illinois Food Bank Compliance Listing
● Northern Illinois Food Bank: CNP 2016-2017 CACFP Monitor List.
● Northern Illinois Food Bank Libraries Listing
● ISBE At-Risk (CACFP) Sponsor to show who services what afterschool
programs.

P a g e | 26
Summer sources Include:
● ISBE 2016 Summer Sites Listing
● ISEBE Summer List of School Districts Participating in SFSP and SSO Programs
● Northern Illinois Food Bank Libraries Listing
● USDA Capacity Builder 2016 Summer Meal Sites
Methodology
Potential programs are existing programs with meal opportunities. These programs may provide meals, snacks or require the child to bring a sack lunch. Additional eligible sites are public or nonprofit organizations that could house a meal program. These sites include parks, schools, congregations, YMCAs, etc., in qualified low-income zones as defined by the CACFP and SFSP eligibility requirements.
The steps applied by Phase II were:
1) Reviewed Phase I report
2) Reviewed and applied Standard Operating Procedures, which included the following sources to generate information:
a) Fiscal Year (FY) 16 ISBE report information for Afterschool (CACFP) and
Summer programs (SFSP)
b) Food Bank internal reports: i) FY15 and FY16 Food Bank County Fact Sheets ii) Afterschool Monitoring Sites Listing Report iii) Libraries Listing
c) Additional Internet resources for finding existing and potential sites
d) USDA Capacity Builder to find potential programs and check are eligibility
e) FRAC Summer Food Mapper to double check results
3) Tabulated program results by county and program
4) Reconciled database spreadsheet program counts to full year reported program results

P a g e | 27
Phase I flowcharts below were applied to determine eligibility.
Exhibit 4.1 Phase I Flowchart to Determine Eligibility
Exhibit 4.2 Phase I Afterschool Eligibility Flow Chart
P a g e | 28
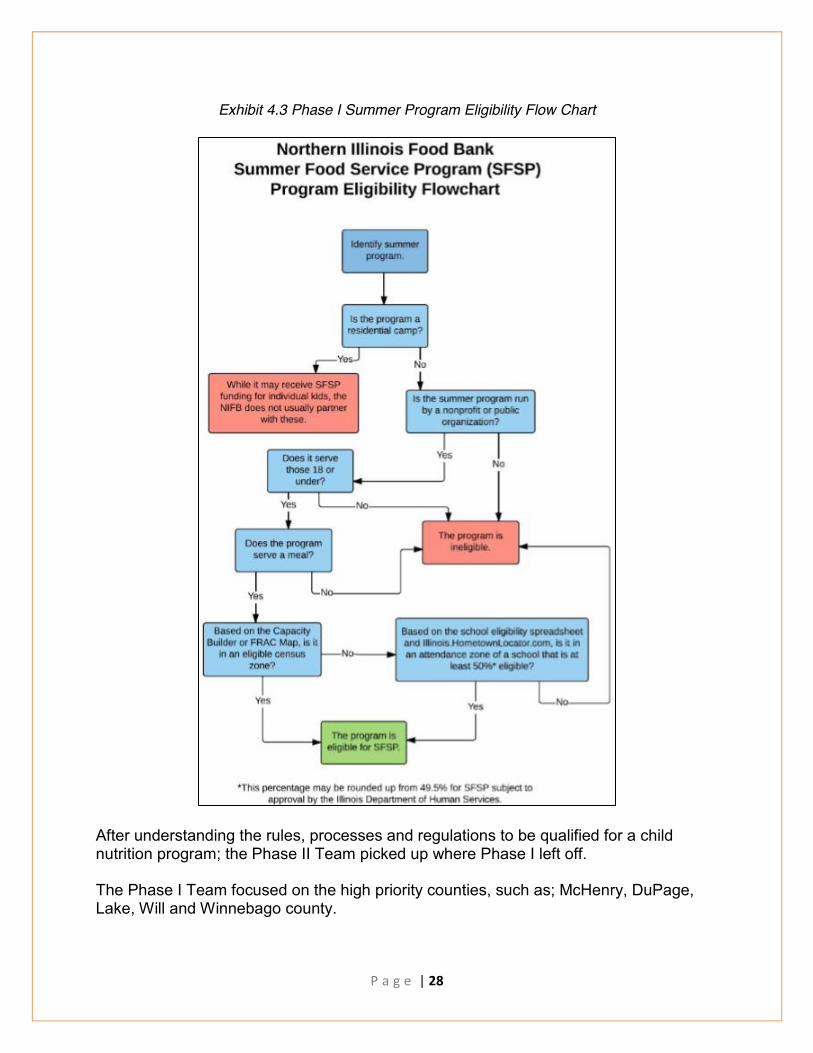
Exhibit 4.3 Phase I Summer Program Eligibility Flow Chart
After understanding the rules, processes and regulations to be qualified for a child nutrition program; the Phase II Team picked up where Phase I left off. The Phase I Team focused on the high priority counties, such as; McHenry, DuPage, Lake, Will and Winnebago county.

P a g e | 29
The Phase II Team used McHenry County as a starting point. Since McHenry County had been completed by Phase I, the Phase II Team applied the rules from the eligibility flow chart to mapping tools such as FRAC Summer Food Mapper and Capacity Builder. These two programs helped the Phase II Team identify potential and current existing programs. The review of McHenry County served as a tutorial for the Phase II Team and paved a path to complete the remaining counties in the Food Bank’s service area. Bolded items indicate existing programs with meal opportunities.
Exhibit 5 Fiscal 2016
Using the identified resources the Phase II Team checked area eligibility of the existing programs and found many additional programs and locations that could qualify for afterschool and summer programs. The two main tools the Phase II Team used to find additional programs and report area eligibility were the USDA Capacity Builder and FRAC Summer Food Mapper. Capacity Builder was designed to help find additional afterschool and summer programs. This program has made improvements since Phase I by adding additional layers and features. Capacity Builder provides area eligibility for free and reduced lunch for both afterschool and summer programs. Capacity Builder has many layers to find potential site. The most important layer is “FY17_FNS_CACFP_SFSP_Eligibility”. This layer provides the qualifying eligibility areas a pink color and the ineligible areas blue. The other layers are used to find locations that can be potential or existing afterschool or summer programs .Examples of layers we used included congregations, public schools, libraries, museums, HUD housing, private schools, Summer Meal Sites 2016, school districts and YMCAs.

P a g e | 30
Exhibit 6.1 Capacity Builder Layers
P a g e | 31
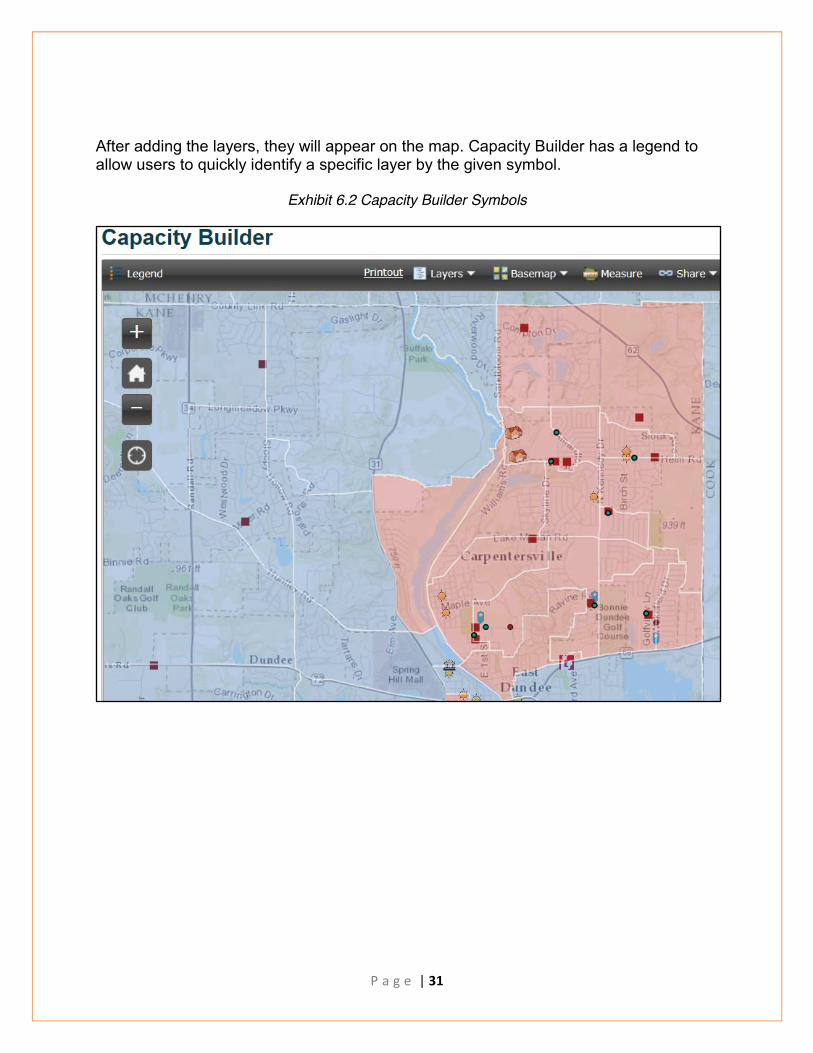
After adding the layers, they will appear on the map. Capacity Builder has a legend to allow users to quickly identify a specific layer by the given symbol.
Exhibit 6.2 Capacity Builder Symbols

P a g e | 32
A benefit of Capacity Builder is that the address and name of the organization can be shown by clicking on a symbol. And, clicking on 2016 Summer Meal Sites will provide what meals it serves and at what times.
Exhibit 6.3 Capacity Builder Meal Information

P a g e | 33
FRAC Summer Food Mapper The Food Action and Research Center (FRAC), a leading nonprofit organization based in Washington D.C., provides the FRAC Summer Food Mapper. Its mission is to coordinate many different types of partners and information sources to eliminate hunger in the U.S. FRAC Summer Food Mappers would become a way the Phase II Team would double check its findings from Capacity Builder and pick up additional sites that may have not been picked up from Capacity Builder. FRAC Summer Food Mapper identifies area eligibility different than Capacity builder. The figure below indicates that Pink areas are ineligible zones, Green areas are eligible and a light blue will result in a “maybe” eligible zone. FRAC Summer Food Mapper does provide potential sites such as churches, parks and schools in area eligibility zones; as demonstrated in the image below. The FRAC Summer Food Mapper proved to be cumbersome to navigate times, and the technology is becoming outdated as Capacity Builder continues to evolve.
Exhibit 7 FRAC Map

P a g e | 34
Assumptions
● Capacity Builder has frequent periods of down time ● Phase II assumed the down time is due to server maintenance and updating ● An afterschool or summer program held in a school building is only eligible if the
school is eligible, regardless of being in another eligible school’s attendance zone (See Exhibit 5.1)
Exhibit 8 School Zone

P a g e | 35
Findings By County
Boone County
● Northern Illinois Food Bank predicted 0% growth in CACFP and 1% growth in SFSP for FY17
● The potential sites that could be utilized is the Regional Learning Academy Star, Capron Elementary School, and Boone County Conservation Center
● A large provider in Boone County is the YMCA
● A challenge in Boone county was that many schools that were in smaller towns and townships
Exhibit 9.1 Boone County Count Summary
Exhibit 9.2 Potential Afterschool Sites Exhibit 9.3 Potential Summer Sites

P a g e | 36
DeKalb County
● Northern Illinois Food Bank predicted 0% growth
in CACFP and 0% growth in SFSP for FY17 ● The potential sites that could be utilized are
DeKalb Parks: Sports and Recreation Center, Huntley Middle School, and Cornerstone Christian School
● Large providers of DeKalb County are the Northern Illinois Food Bank, YMCA, Sycamore School District 427/OSCAR, and Voluntary Action Center
Exhibit 10.1 DeKalb County Summary
Exhibit 10.2 Potential Afterschool Sites Exhibit 10.3 Potential Summer Sites

P a g e | 37
Grundy County
● Northern Illinois Food Bank predicted 0%
growth in CACFP and 1% growth in SFSP for FY17
● The potential sites that could be utilized are Braceville Elementary School and Grundy County Special Education Cooperative
● A large provider of Grundy county is private day care centers or YMCA
● The eligibility mappers such as FRAC Summer Food Mapper tool and Capacity Builder show very little eligibility within Grundy County
Exhibit 11.1 Grundy County Summary
Exhibit 11.2 Potential Afterschool Sites Exhibit 11.3 Potential Summer Sites

P a g e | 38
Kane County
● Northern Illinois Food Bank predicted 0% growth in CACFP and 0% growth in SFSP for FY17
● The potential sites that can be utilized include Greenman Elementary School, Collier Community Center, Hall Elementary School, Jefferson Middle School, Lords Park Elementary School, Taylor Family Elgin YMCA, Wesley United Methodist Church, and Elgin Community College
● Large providers in Kane County include, Aurora Township, CUSD 300, Boys and Girls Club of Elgin, Northern Illinois Food Bank, Aurora East USD 131, and Aurora West USD 129 sites
Exhibit 12.1 Kane County Summary
Exhibit 12.2 Potential Afterschool Sites Exhibit 12.3 Potential Summer Sites
P a g e | 39
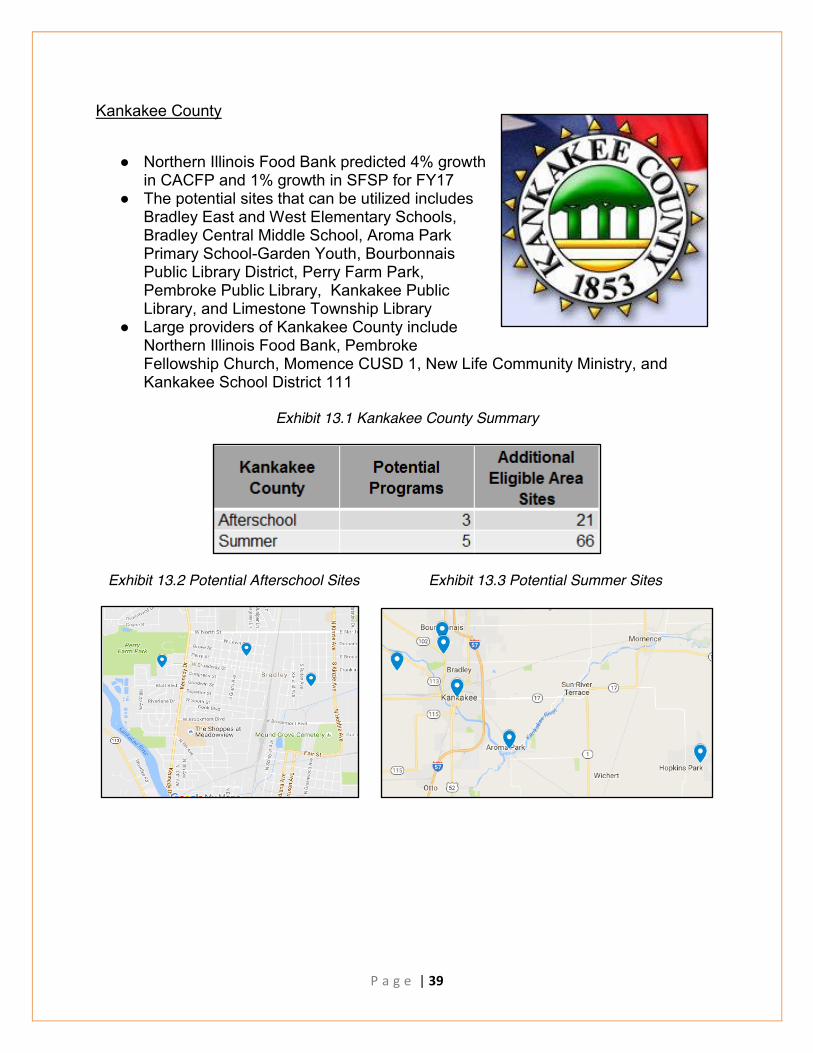
Kankakee County
● Northern Illinois Food Bank predicted 4% growth
in CACFP and 1% growth in SFSP for FY17 ● The potential sites that can be utilized includes
Bradley East and West Elementary Schools, Bradley Central Middle School, Aroma Park Primary School-Garden Youth, Bourbonnais Public Library District, Perry Farm Park, Pembroke Public Library, Kankakee Public Library, and Limestone Township Library
● Large providers of Kankakee County include Northern Illinois Food Bank, Pembroke Fellowship Church, Momence CUSD 1, New Life Community Ministry, and Kankakee School District 111
Exhibit 13.1 Kankakee County Summary
Exhibit 13.2 Potential Afterschool Sites Exhibit 13.3 Potential Summer Sites

P a g e | 40
Kendall County
● Northern Illinois Food Bank predicted 0% growth in CACFP and 0% growth in SFSP for FY17.
● The potential site that can be utilized is Nicholson Elementary School in Plano
● Large providers of Kendall County are Northern Illinois Food Bank, Plano CUSD 88, and Fox Valley YMCA
Exhibit 14.1 Kendall County Summary
Exhibit 14.2 Potential Afterschool Sites Exhibit 14.3 Potential Summer Sites

P a g e | 41
Ogle County
● Northern Illinois Food Bank predicted 0% growth in CACFP and 0% growth in SFSP for FY 17
● The possible sites that can be utilized include Oregon Park District, Evangelical Free Church of Mt. Morris, Chana Education Center/Rock River, Ogle County Education Cooperative, and Mount Morris Public Library
● Large providers of Ogle County include Northern Illinois Food Bank and the Rochelle United Methodist Church
Exhibit 15.1 Ogle County Summary
Exhibit 15.2 Potential Afterschool Sites Exhibit 15.3 Potential Summer Sites

P a g e | 42
Stephenson County
● Northern Illinois Food Bank predicted 0% growth in CACFP and 1% growth in SFSP for FY17
● There are zero potential locations for utilization ● A large provider of Stephenson County is Northern Illinois Food Bank and
Freeport YMCA
Exhibit 16.1 Stephenson County Summary
Exhibit 16.2 Potential Afterschool and Summer Sites

P a g e | 43
Will County (Follow Up on Summer Program)
● Northern Illinois Food Bank predicted
4% growth in SFSP for FY17 ● New potential identified sites to be
utilized include Bolingbrook Recreation and Aquatic Center, Crete Park, First Congregational Church of Lockport, Lockport Area Special Education Cooperative, and Romeoville Park District.
● Phase II Team reviewed Phase I findings and new information to determine if there were any new or missed programs. The primary focus of review was identifying eligible area sites that could house new meal sites---179 sites were located.
Exhibit 17.1 Will County Summary
Exhibit 17.2 Potential Summer Sites

P a g e | 44
Overall Findings
The primary purpose of the CNP project was to find programs where Northern Illinois Food Bank could expand its afterschool and summer programs. This section will provide the number of programs identified, and how many programs Northern Illinois Food Bank is already partnering with in each of the 13 counties for afterschool and summer programs. Afterschool Program Analysis Existing afterschool programs meet the eligibility criteria within the reviewed county areas. The assumption was also made that any eligible program that requires a participant to bring a sack lunch is an opportunity for a Northern Illinois Food Bank partnership. The eligibility criteria are:
● Serve children 18 and under ● Be open to all children ● Be located within a low-income area defined as: Inside of a school attendance
zone, in which 50% of its students are eligible for free or reduced lunch ● Be managed by (but not necessarily located in) a nonprofit or public entity ● Include an education or enrichment program
Exhibit 18 Afterschool Findings

P a g e | 45
Northern Illinois Food Bank anticipated zero growth for the eight counties for Fiscal Year 17. As noted in the table above, the range of estimated growth from the research was approximately 52% The actual program increase may be much less, but it may be greater than projections. This growth percentage is lower than the percentage Phase I had estimated of 75%. The fewest number of programs were found in Grundy County and the largest number of programs were found in Kane County. Summer Program Analysis The potential programs are existing summer programs found within the eight county areas that meet the following criteria:
● Serve children 18 years old and under ● Be open to all children ● Be located in a low-income area defined as ONE of the following:
● Inside of a school attendance one, with at least 50% of their students eligible for free or reduced lunch
● Inside of a census tract in which at least 50% of students are eligible for free or reduced lunch
● Be managed by (but not necessarily located in) a nonprofit or public entity ● Provide at least one meal ● Overnight or residential summer camp not eligible
Exhibit 19 Summer Findings
P a g e | 46
As noted in the table above (Exhibit 19), the estimated potential growth from the research is approximately 50%. There were many more summer programs identified than afterschool programs. Grundy County still remains to have the least programs for the summer months. Many more sites were found for potential summer programs than afterschool programs. Opportunity Analysis
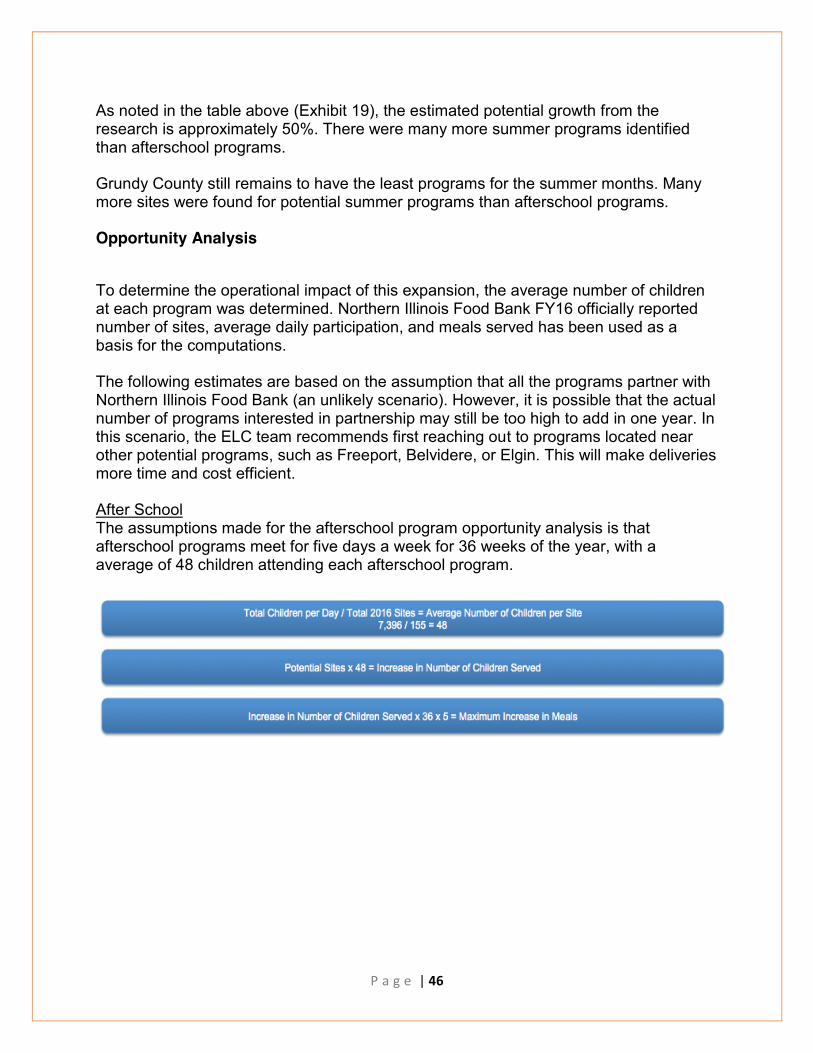
To determine the operational impact of this expansion, the average number of children at each program was determined. Northern Illinois Food Bank FY16 officially reported number of sites, average daily participation, and meals served has been used as a basis for the computations. The following estimates are based on the assumption that all the programs partner with Northern Illinois Food Bank (an unlikely scenario). However, it is possible that the actual number of programs interested in partnership may still be too high to add in one year. In this scenario, the ELC team recommends first reaching out to programs located near other potential programs, such as Freeport, Belvidere, or Elgin. This will make deliveries more time and cost efficient. After School The assumptions made for the afterschool program opportunity analysis is that afterschool programs meet for five days a week for 36 weeks of the year, with a average of 48 children attending each afterschool program.

P a g e | 47
Exhibit 20.1 Afterschool Opportunity Analysis
Summer The assumptions that were made for the summer program opportunity analysis is that summer programs meet five days a week for 9 weeks a year (during summer vacation), with an average of 62 children attending each summer program. These assumptions include one meal provided a day.

P a g e | 48
Exhibit 20.2 Summer Opportunity Analysis
Tables 20.1 and 20.2 indicate the estimated maximum increase in meals that may be achieved in each county, if all potential programs are interested in partnering with the Food Bank. Additional Eligible Area Sites The Phase II Team identified additional potential eligible area sites. These sites are potential sites that Northern Illinois Food Bank could partner up with bringing more meals to children in the surrounding area of the site. The sites identified still meet the criteria outline. Exhibit 20.3 (below) shows the number of potential eligible area sites found in each county.

P a g e | 49
Exhibit 20.3 Addition Eligible Area Sites
Child Nutrition Programs Partner Agencies
Partner Letter Phase I Team developed and distributed a letter to Ms. Pam Wicking, 4-C CCR&R Program Director, 4C: Community Coordinated Child Care, who in turn, contacted existing child care providers in McHenry County. This represented one partnering opportunity for Northern Illinois Food Bank. This letter was also recommended for use in similar outreach efforts to other members of the child care reference and referral network (noted below) as a means to reach other existing programs that could utilize the Food Bank services and feed more children under the USDA CACFP and SFSP programs. The Phase II Team would like to make this letter a lasting item for Northern Illinois Food Bank to use as a potential marketing item to send out to new potential sites and champions to create new relationships. This letter can be used interchangeably and can create a transfer of knowledge from one partnership to another. This information is included in the Phase I report on pages 50-54. Northern Illinois Food Bank can update the letter with information related to the remaining eight counties. The letter should be edited to remove references to the ELC and McHenry County to the existing counties in need.

P a g e | 50
Illinois Network of Child Care Resource and Referral Agencies (INCCRRA) INCCRRA is a statewide organization which has a partnership with 16 local Child Care Resources and Referral agencies. INCCRRA is a leader in resources for making high quality affordable early child care and education available for families and their children in Illinois. 4-C DeKalb County is a member of this organization and has an established network to help facilitate Food Bank communications with these other agencies. Partnering via networking To identify more potential programs or “champions”, Northern Illinois Food Bank may benefit from its role as stakeholder in key service organizations whose websites include listings of agencies with a like-minded mission. This may lead to more network development. Some examples are: Statewide Service Agencies: Coalition Partners for Afterschool Programs
ACT Now Illinois is an organization whose members actively seek to ensure youth in Illinois have access to quality affordable afterschool programs. Current members include INCCRRA.
Illinois Afterschool Network
A membership organization that connects afterschool and youth development professionals through leadership and networking opportunities.
Local Service Agencies: Examples include: DeKalb County Non Profit-Benefits (DNCP)
The DCNP is a members-based program offering training, access to resources and professional development opportunities. Its purpose is to build nonprofit partnerships amongst members..

P a g e | 51
DeKalb County Community Foundation The Mission of the DeKalb County Community Foundation is to enhance the quality of DeKalb County by actively addressing community needs and expanding, managing, and distributing philanthropic resources.
Communities in Schools - Aurora Northern Illinois Food Bank already provides food program services to Communities in Schools – Aurora at many of the schools it supports with afterschool services. The organization website has a page listing its community partners.
United Way: Lake County Funding Initiatives:
Support for schools and various “connected” agencies that have relationships with Northern Illinois Food Bank.
Rock River
For families who don't have easy access to resources, or the time between jobs to fully manage their kids' summer learning experience, several United Way partners offer learning programs and activities that keep young children active throughout the summer.

P a g e | 52
Child Nutrition Programs Outreach Toolkits
The primary focus of the toolkit deliverable was to develop an information guide to serve as a marketing communication intended to attract new site partners. It will offer information about why more meal sites are needed and site eligibility requirements. The digital, emailed outreach toolkit will also feature a companion “call-to-action” video link to help potential partners understand how their participation with Northern Illinois Food Bank can help feed more hungry neighbors.
The Child Nutrition Programs Overview Toolkit will serve as a summary document and has been developed using a common theme approach with consistent look and language to align with the supporting detailed toolkits for summer and afterschool programs. If adopted, the Child Nutrition Program outreach materials will now include three component toolkits:
● Overview: ○ Marketing outreach to attract new site partners ○ Flexible design that may be used as a one page flyer or full brochure.
● Summer:
○ Existing material for community outreach guidance ○ Potential Addition: Specific summer site information, site application and
meal app instructions
● Afterschool: ○ Specific afterschool requirement information, site application, and meals
app information ○ New look by compiling and editing individual communications into a single
document

P a g e | 53
The Program Overview Toolkit was designed to be adaptable to your outreach intentions. For a broad circulation probe of general interest you may wish to use a standalone one page communication (cover only as a flyer), or for a more targeted reach you could use the complete information guide. Northern Illinois Food Bank brand guidelines were followed to create this toolkit. Materials and assistance were received from Northern Illinois Food Bank employees and outside contractors:
● Elizabeth Gartman - Communications Manager ● Jennifer Nau - Director of Communications ● Jennifer Lamplough - Director of Nutrition Programs, Executive Chef ● Jessica Willis - Child Nutrition Manager ● Dawn Yarbrough - Child Nutrition Program Specialist ● Jules Burke - Owner and Director, SMART Productions, Inc.
Northern Illinois University – Volunteers:
● Ryan Adamovic - Management Major, Outreach Video for Toolkit ● Sue Anderson - IT Coordinator, College of Business Advancement Office ● Marisa Mertes - Marketing Major, Outreach Video for Toolkit
Sue Anderson edited the cover design provided in Microsoft Word software by improving the look and design through use of the higher quality publishing software InDesign. Only the cover of the Northern Illinois Food Bank Program Overview Outreach Toolkit has been prepared in this software tool pending the Sponsor Team’s feedback. Sue is available and happy to volunteer her time to complete the Program Overview Toolkit if the Food Bank is interested in these additional services. Northern Illinois Food Bank Brand Guidelines 2016 were followed to create digital materials and video. Primary sources included the Food Bank website: quotes were sourced from the Northern Illinois Food Bank Full Plate Newsletter and Full Plate Blog. Photos were sourced from the Food Bank and Feeding America. Afterschool program action videos courtesy of Jules Burke, SMART Productions, Inc. For more information about the Child Nutrition Outreach Toolkits, please see Child Nutrition Programs Outreach Toolkit in Appendix A1.

P a g e | 54
Exhibit 21 Child Nutrition Program Outreach Toolkit Brochure

P a g e | 55
Companion “Call to Action” Video Two NIU students, Ryan Adamovic, and Marisa Mertes volunteered their time to create a compelling two-minute video for Northern Illinois Food Bank to use as a supplement to the Program Overview Outreach Toolkit. Ryan and Marisa are talented students who strongly desired to put their talents, IT and Marketing, respectively, to work to help make a difference for our youngest hungry neighbors.
Food Bank resources were provided by Elizabeth Gartman, Communications Manager Jennifer Nau, Director of Communications. They also connected the students with Ms. Jules Burke, Owner and Director, SMART Productions, Inc. The video was designed with an emotional “call to action” message as a way to engage potential site partners with the Food Bank. The goal is to build awareness amongst those who may become champions and supporters to help feed more children in their communities. The “Call to Action” video can also be shared on social media, the Food Bank website, and its YouTube channel to spread awareness of child hunger.
Exhibit 22 Companion “Call to Action” Video Image

P a g e | 56
Conclusion
Over the course of this project, the CNP Team has identified:
● Existing programs, if interested, by the USDA meals programs: ■ CACFP 2016
● 29 potential sites ● 250,560 potential meals ● 1,392 estimated increase in the number of children
■ SFSP 2016 ● 22 potential Sites ● 61,380 potential meals
● 1,364 estimated increase in the number of children
● Organizations that may provide new programs where meals were identified in all counties except Grundy and Stephenson.
● Locations where children may gather and meals could be served were identified.
The number of identified eligible area sites, but not presently active, ranged from 12 in Grundy County to 134 in Kane County.
● Potential sites who may be interested in what Northern Illinois Food Bank should
offer with being an afterschool or summer site location with the Children’s Programs Outreach Toolkits
● Additional potential partnerships/agencies/”champions” exist and could be
approached to build network
● Results of both Phase I and II will provide more background information for Kaia Keefe-Oates, Feeding America Child Hunger Corp Member, to support the Community Needs Assessment she is developing for the Food Bank’s Children’s Programs.

P a g e | 57
Recommendations
The recommendations for implementation are:
● Use the database spreadsheets to identify potential existing programs with meal opportunities.
● Review and incorporate results into Community Needs Assessment Study. ● Contact other potential programs who may be able to partner to serve meals. ● Continue communications with 4-C and other child care reference and referral
agencies to broaden reach to child care providers. ● Join service and nonprofit networks to build awareness that may lead to more
site partners or program champions. ● Review Child Nutrition Programs Outreach Toolkits, contact the ELC if additional
design services are desired, and utilize the toolkits beginning in spring 2017.

P a g e | 58

P a g e | 59
APPENDIX A1: OUTREACH TOOLKITS

P a g e | 84

P a g e | 85
CNP Bibliography
“Capacity Builder.” United States Department of Agriculture, http://www.fns.usda.gov/capacitybuilder. Accessed 27 Nov. 2016.
“Child and Adult Care Food Program (CACFP): Afterschool Programs.” United States Department of Agriculture, 8 Aug. 2016, http://www.fns.usda.gov/cacfp/afterschool-programs. Accessed 27 Nov. 2016.
“Child Nutrition Programs.” Hungernet, Feeding America, Hungernet.org, May 2014. www.hungernet.org. Accessed 27 Nov. 2016.
“How To Participate In The At-Risk Afterschool Meals Component of CACFP.” United States Department of Agriculture, http://www.fns.usda.gov/sites/default/files/cacfp/CACFPfactsheet_atrisk.pdf. Accessed 27 Nov. 2016.
Jacobson, Kristi & L. Silverbush (Directors and Producers). (2012). A Place at the Table [DVD]. United States: Magnolia Home Entertainment.
Northern Illinois University. (2016). Northern Illinois Food Bank Opportunity Analysis. DeKalb, IL: Agnew, Rob, et al. Smith, Katlyn. “How Carol Stream kids and receive free and healthy lunches this summer.” The Daily Herald, 16 Jun. 2016, http://www.dailyherald.com/article/20160616/news/160619119/. Accessed 27 Nov. 2016.
“Summer Food Service Program (SFSP): Frequently Asked Questions.” United States Department of Agriculture, 16 Jun. 2016, http://www.fns.usda.gov/sfsp/frequently-asked-questions. Accessed 27 Nov. 2016. “Summer Food Service Program (SFSP): How To Participate in the Summer Program.” United States Department of Agriculture, http://www.fns.usda.gov/sites/default/files/sfsp/SFSP-Fact-Sheet.pdf. Accessed 27 Nov. 2016.
“Summer Food Service Program (SFSP): Summer Meals Toolkit.” United States Department of Agriculture, 22 Jun. 2016, http://fns.usda.gov/sfsp/summer-meals-toolkit. Accessed 27 Nov. 2016.

P a g e | 86
“Your Support Puts Smiles On Students’ Faces.” Northern Illinois Food Bank: The Full Plate Blog: Storytelling, 16 Jul. 2016, http://solvehungertoday.org/full-plate-blog/support-puts-smiles-students-faces/. Accessed 27 November 2016.
Yurko, Julie. “Fighting back-to-school hunger.” Northern Illinois Food Bank: The Full Plate Newsletter, Fall 2016, http://solvehungertoday.org/wp-content/uploads/2014/09/FULL-PLATE-FALL- 2016.pdf. Accessed 27 Nov. 2016.

P a g e | 87
SECTION B: SUPPLEMENTAL NUTRITION ASSISTANCE PROGRAM

P a g e | 88
Project Goals
The Phase II SNAP Team was engaged to perform “continuous improvement” in specific areas of the SNAP Needs Assessment Profile database previously developed by the Phase I Team. The direct focus as requested by the SNAP Outreach Manager was known as the “Big 3”, which is defined as:
● Seniors, ● Spanish speakers, and ● Unemployed individuals.
The deliverables are listed in the following section. SNAP Needs Assessment Profile
● Database content – additional research ○ Seniors – compute additional estimates for populations
■ Ages 60 (SNAP) vs. 65 (US Census) ■ At Federal Poverty Level (FPL) up to 200% threshold
○ Correlations review, etc. ● Database content and utility improvements
○ Review correlations ○ Improve/streamline the complex database by understanding how the
Northern Illinois Food Bank SNAP Outreach Manager plans to use the data for analysis, reporting and prioritizing locations in need
○ Build in utility columns for documentation/comments by user ● Operational reports
○ Develop user-friendly report for region SNAP field personnel to use and provide staff with information to direct their visit efforts without having to use the entire database
○ Provide a mapping tool to facilitate efficient location identification and travel plans (tracts/city/county)
○ Conduct pilot testing with primary users to get feedback and include recommendations
● Finish heat maps

P a g e | 89
Refine Served/Under-served Meals Assumptions and Computations
● Review data disparity research and meals computations from Phase I ● Review disparity categories and determine if specific items can be identified and
quantified to include meaningful assumptions and adjustments to the calculation ● Determine if there is an appropriate rationale that may be developed and applied
to provide reliable assumptions to efficiently convert between the SNAP Needs Assessment Profile and SNAP-based meals calculator to determine served and underserved meals
● Conduct additional research as needed to update data and research from Phase Zip Code List Provide a direct mail zip code list and map for all census tracts in the 13-county Northern Illinois Food Bank territory for a planned 2017 release
Exhibit 23 Sequence of SNAP Phase I and II Workflow
Background
Eligibility
Effective January 1, 2016, the eligibility level to qualify for SNAP benefits in Illinois increased from 130% to 165% of the federal poverty level. This will allow more people to apply for the SNAP program and potentially receive benefits. Households with at least one senior or one person on disability continue to qualify at 200% of the federal poverty level.

P a g e | 90
Exhibit 24.1 SNAP Eligibility
The federal poverty level is defined by the U.S. government. The specific qualifications for the SNAP program based on household size are as shown below in Exhibit 24.2.
Exhibit 24.2 SNAP Eligibility

P a g e | 91
Needs Assessment Profile Optimization
Background The Needs Assessment Profile (Profile) was a tool developed by the Northern Illinois Food Bank Phase I ELC team. The Profile is an Excel spreadsheet that provides in-depth information on important items such as demographics, SNAP program enrollment rates, eligible household numbers, and a weighting system created by Phase I, which is used to rate all included county tracts by their level of need from the SNAP program. Every county serviced by the Food Bank is included in this profile and each is broken down by its different county, census tracts and zip codes to give the most accurate view of the different parts of all 13 counties, and which of these tracts should be focused on by the Food Bank SNAP team. There are five different demographics used in the Profile that help to put together a picture of each individual tract. These demographics are:
● female head of household ● male head of household ● household below the federal poverty line that have seniors ● households of Hispanic or Latin origin, and households that have had no
worker within the past 12 months
Every tract of every county is broken down individually, and both the number and percentage of houses within each individual tract that falls under these demographics is given. The end goal of this is being able to see which counties and county tracts have the highest number of households that fall under these demographics that may correlate with hunger. The Profile also contains a correlation matrix, which cross references every demographic with the other listed demographics, along with different factors such as enrollment rate and percent of households under the 165% poverty line. The main goal of this correlation matrix is to find trends and patterns between the demographics and poverty, giving a better idea as to which demographics should be more highly focused upon. This data is all provided under the assumption that the American Census Survey (ACS) data obtained from government census is accurate.

P a g e | 92
The demographic data is one of the main parts of the Needs Assessment Profile, but it also contains other information that could prove useful to the Food Bank. The Profile has household data collected for every county and tract, showing number of households per tract, the number of households per tract that qualify for SNAP benefits, and the enrollment rate per tract of these houses that do qualify. Additionally, the profile also shows the average number of persons per household for every tract within the 13 different counties.
Exhibit 25 Examples of Assessment Profile Data
This information can be critical to helping narrow down the counties and tracts that should be focused on by displaying which have the most households currently not taking advantage of SNAP benefits, and which areas have the most households that qualify for SNAP. When paired with the demographic area, this information can help to focus the Food Banks efforts to increase SNAP enrollment on areas that are not taking advantage of the program. It can also show a correlation between the different demographics and enrollment rates, which could lead to an idea of what type of people are not taking advantage of SNAP, and pose the question of why they are not doing so. This data is also provided under the assumption that the ACS data used is accurate. Methodology
● Use tools provided by excel to optimize the Needs Assessment Profile ● Make data more manageable and accessible ● Provide operational reports for different types of users

P a g e | 93
Assumptions
● Data provided by Phase I is accurate ● User of Needs Assessment Profile has a basic understanding of Microsoft Excel
Deliverables One of the objectives of the Phase II team was the improvement of the SNAP needs assessment profile. As listed in the deliverables for the Phase II Team:
Improve/Streamline the complex data base by understanding how SNAP Outreach Manager plans to use data for analysis, reporting and prioritizing locations in need (to operationalize the data).
This deliverable was met in a variety of different ways. Pivot Tables
Exhibit 26.1 Working Pivot Table

P a g e | 94
A pivot table has been added to the needs assessment profile in order to help make data more accessible to users, and to reduce the time it takes for users to find specific data within the Profile. A pivot table is a tool offered through excel that allows users to rearrange data in a table format using easily manipulated filters. A pivot table does not actually change the data within the spreadsheet in any way, it just makes finding data a faster and more efficient process. Pivot tables are very user friendly and do not require in-depth knowledge of Excel. Shown below is a short series of images displaying the basics of pivot tables. Pivot Chart A pivot chart is a visual representation of data that is being shown by the above-mentioned pivot table. The chart works in congruence with the pivot table, meaning that all the data that is filtered in and out of the pivot table will be automatically filtered in and out of the chart as well. The chart offers a way to visualize the data, and can make spotting trends and correlations within different counties easier by displaying it in the form of various types of graphs. Because the pivot chart is based on the the pivot table, it takes no extra work to set up or manipulate, it simply offers another option for the viewing of data.
Exhibit 26.2 Pivot Chart
Slicers The inclusion of slicers into the Needs Assessment Profile is just one more way to make information more easily accessible in an efficient manner. A slicer is just a just a list of options that is stationed next to the pivot table. The slicer included within the Profile allows for the user to more easily filter which counties they want displayed within the pivot table and pivot chart. Instead of having to work the actual drop down menu built

P a g e | 95
into the pivot table, this function allows you to just pick a county, or multiple counties, out of a large list and will automatically filter the table based on the counties chosen.
Exhibit 26.3 Pivot Table with Slicer
Operation Reports Another deliverable given to the SNAP team was to develop user a friendly report for region SNAP field personnel to use and provide the staff with information to direct their visit efforts without having to use the entire database. This is being accomplished in a few different ways, which are as follows. Static Report View The static report view is an Excel spreadsheet that offers a snapshot glimpse into the entire Profile without having to dig through data. The report view captures the leading 25 tracts within four of the key demographics. These tracts are then color coded by which county they are a part of, and listed from highest ranking to lowest ranking on a bar graph. This report view is completely static, meaning that unlike the pivot table and pivot chart, none of the data can be manipulated. It is a series of lists with graphs connected to them. This report view can offer a sense of which counties need to be focused on the most, without having to delve into the Profile itself.

P a g e | 96
Exhibit 27 Static Report
Dashboard The Dashboard is a tool used for visualization of important aspects of data from the Profile. The dashboard was made using Tableau. The dashboard is a spreadsheet within the profile that will take all the data from four key demographics of the Profile, and present it in a visual manner on one page. The goal of the dashboard is to be able to look at only that one sheet and be able to determine which counties and county tracts may require more attention based on the demographics shown. The Dashboard is able to be manipulated to filter counties in or out based upon what the user wishes to see, or can show all of the counties data at the same time. This will allow users to be able to gain a general idea of the data being displayed, without having to take the time to evaluate all aspects of the Needs Assessment Profile.
Exhibit 28 Assessment Profile Dashboard

P a g e | 97
Heat Mapping The Phase II Team was tasked with developing a mapping tool to facilitate efficient location identification and travel plans (tracts/cities/counties) and with Finishing Heat Mapping.
This deliverable has been accomplished using the Heat Mapping tool within Tableau. This tool allowed for data from the needs assessment profile to be copied into a map of the 13 counties that the Food Bank services. The data was then filtered; a map was created for four of the top demographics chosen. Each map is colored coordinated based on the county tracts and the chosen demographic for that map. Tableau uses the demographic information from the Needs Assessment Profile and aligns the information with the tracts of each county, and then color codes the tracts based on the demographics. The areas that rank higher in that demographic will be a darker red than areas that are ranked lower. This allows for a map of all thirteen counties that will be color coded, showing which areas are more affected by a certain demographic than others. The areas shown in black are counties that are not focused on because they are outside of Northern Illinois Food Bank’s 13-county service area.
Exhibit 29 Weighted Score Heat Map

P a g e | 98
Recommendations The ELC recommends the following for the Northern Illinois Food Bank:
● The inclusion and use of Pivot Tables, Pivot Charts, and Slicers in the Needs Assessment Profile
● The Inclusion of a static Operating Report for use by those who may not need full access to the data provided by the Profile
● The use of a Dashboard as a one-sheet, visual representation of the data within the Profile
● The use of Heat Maps to easily identify areas of need that the Food Bank could focus on

P a g e | 99
Data Disparity
Background
During the Phase I research, disparities between ACS Census data and USDA Food and Nutrition Service (FNS) SNAP Application became problematic. With the major differences between data sets, it led to an inaccurate meals calculation because the SNAP Needs Assessment database is sourced from Census data and the meals computations should be based on SNAP Application data.
The task of the Phase II Team was to review the Phase I research, as well as conducting its own, to determine meaningful assumptions and adjustments to the meals calculation. This included the analysis of the “Big 3” non-income characteristics of seniors, Spanish speakers, and unemployed individuals.
This will be used to determine an appropriate rationale that could be developed and applied to provide reliable assumptions to convert between the SNAP Needs Assessment profile and Feeding America SNAP impact meals calculator to determine the served and underserved meals.
Methodology
The following outlines the methods and steps to develop a conversion factor that may be applied to determine a more appropriate number the American Census Survey (ACS) data compared to USDA FNS SNAP Application data. Rationale is provided in the body of this report.
1) Determine the number of Households receiving SNAP benefits
2) Calculate percentage changes of households receiving SNAP benefits
3) Compute the difference between FNS and ACS data across 10 years (Factor #1)
4) Use formula and incorporate “Big 3” data (Factor #2)

P a g e | 100
5) Underreporting factor (Factor #3)
According to the article, Errors in Survey Reporting and Imputation and Their Effects on Estimates of Food Stamp Program Participation by Bruce D. Meyer and Robert M. George, 32% of individuals do not report that they are receiving SNAP benefits to the ACS survey. This research and methodology was used specifically in the state of Illinois, as well as Maryland, and the study was done in 2011. A 2016 study focusing on Texas and New York applied this same method.
6) Combine all factors and apply to Census data
● Once all factors have been computed for the years 2005-2015, sum all values and take the average
● After this conversion factor is computed, multiply it by each Illinois household receiving SNAP benefits data value determined by the ACS data set for the years 2005-2015
Exhibit 30 Final Conversion Factor
Assumptions
The following assumptions were applied to develop our methodology. These assumptions will help enable Northern Illinois Food Bank to have a better understanding of both the methodology and the data used.
Primary differences between Census data (ACS) and SNAP Administrative data (FNS) were identified by the Phase I SNAP Team and are due to:
1. Underreporting of benefits - the issue of underreporting of benefits is well documented and has been a problem for many years.
2. Inconsistent different methods for reporting income eligibility a. How information is collected b. The components of the data
Factor 1 Factor 2 Factor 3 1.63

P a g e | 101
3. Reporting periods a. ACS - Annual 12-month income (averages the 12-month period) b. FNS - Current monthly income c. Consumer Price Index (CPI) adjustments (ACS data)
4. Changing economic conditions
a. ACS uses 12-month reporting but adjusts for differences between the calendar year reporting and the month of interviews using the CPI
b. ACS is determined to be less responsible than FNS, which uses current monthly reporting.
c. In periods when economic conditions are... i. Deteriorating: ACS estimates will likely understate eligibility ii. In recovery: ACS estimates will likely overstate eligibility iii. More pronounced for the three-year and five-year ACS estimates
than for the one-year ACS estimates iv. 2008-2009 major economic downturn pattern shows a faster pace
of increase in reported FNS data than in ACS data used to estimate 2014 using 2010 census data
d. Different “household” definitions i. ACS tends to have lower results than FNS ii. ACS inclusive (includes all living in the same residence) iii. FNS may consider multiple economic units within the same
residence e. Errors made in the process
i. Survey sampling errors exist in ACS census data while application procedures errors exist in FNS data
ii. Minor parts of the ACS data are incomplete or inaccurate and there are mistakes in the certification/application entry

P a g e | 102
Exhibit 31 Differences between FNS and ACS data
Underreporting Benefits
Reporting Income
Household Definitions
Economic Conditions
Errors
FNS -- - Monthly Income - Data collected by application
- Multiple economic units in one residence
- Increase in reporting during 2008/2009 economic crisis
- Application procedures - Incomplete/ inaccurate information
ACS 32% - Annual 12 month income - Adjusts for CPI - Data collected by survey
- Includes all individuals in one residence - Tends to have lower results than FNS
- Deteriorating conditions: ACS understate eligibility - Recovery: ACS overstates eligibility
- Survey sampling - Incomplete/ inaccurate information
Deliverables
Compute 10-year trends between FNS and ACS data
Exhibit 32 FNS vs. ACS data

P a g e | 103
Determine Non-income Characteristics That Affect Disparity Between ACS vs. FNS
The major “Big 3” non-income characteristics in the conversion factor calculation were seniors, Spanish speakers, and unemployed. It was determined that these three characteristics were ultimately major factors that caused ACS data to be reportedly lower than FNS data with individuals receiving SNAP benefits.
Another significant factor in the data disparity between US Census data and SNAP applications data is the underreporting of benefits.
Findings
Throughout the research, the ultimate goal was to find an appropriate rationale that may be developed and applied to provide reliable assumptions to efficiently convert between the SNAP Needs Assessment Profile and SNAP-based meals calculator to determine served and underserved meals.
Starting with the unadjusted unenrollment rate and using the new conversion factor, a new adjusted unenrollment rate was determined. The ACS data is multiplied by the new conversion factor to get a new adjusted number that is close to the FNS data. With this new number, the meals calculation will be more accurate in determining the served and underserved meals consumption.
Exhibit 33 Adjusted by Conversion Factor

P a g e | 104
By using the conversion factor of 1.63 and multiplying it by the total number of Illinois households receiving SNAP benefits, according to the ACS, it generated a new value. Although this new value isn’t perfectly the value of the total number of Illinois households receiving SNAP, as reported by the FNS, it is closer than if it was kept at the original value. With this new number for Illinois households receiving SNAP benefits, it will help Northern Illinois Food Bank determine served and underserved meals.
Exhibit 34 Post-Conversion Disparity
Table 35 Estimate of Households With Conversion Factor
Using the 13-county level data from the 2014 data spreadsheet and Hollie’s data analysis from the Phase I report, the 1.63 conversion factor was applied in order to determine new values of total eligible households, participating households, and unenrolled households. These new values will then be placed in the Feeding America SNAP impact meals calculator to determine the served and underserved meals consumption.

P a g e | 105
Exhibit 36 Adjusted Meals Calculation
For the new updated enrolled/unenrolled input calculations, the percentages were changed to compliment the 1.63 conversion factor. The conversion factor was applied to the original percentages of enrolled and unenrolled because the new conversion factor is the adjustment to correct for underreported households.
Exhibit 37 Adjusted Meals Calculation

P a g e | 106
By using the new percentages of enrolled and unenrolled households, we were able to adjust the numbers to create a new meals calculator computation.
One main driver that was found in developing this new meals calculation was determining that the 57,000,000 meals that Northern Illinois Food Bank provides is a fixed number. With this value being “fixed”, the total number of meals served in the 13-county region increases from 150,146,341 to 410,400,000. As the total number of meals served increases, the percentage of Northern Illinois Food Bank’s meal share in the 13-county region decreases from 38% to 14%.
After determining the new percentage of Northern Illinois Food Bank’s share of meals in the 13-county region, we determined the actual number of meals.The Phase I Team determined 51,250,049 meals were needed to serve, but after using the conversion factor, as well as our new calculations, 13,294,207 meals were determined.
Recommendations
● Apply conversion factor that was determined by the methodology conducted by the Phase II team, to ACS data, and use for Feeding America SNAP Impact meals calculator.
● Convert between the SNAP Needs Assessment Profile and Feeding America
SNAP Impact meals calculator.
● Input the updated data into the Feeding America SNAP Impact meals calculator. Placing the adjusted ACS data in the meals calculator will allow Northern Illinois Food Bank to determine the served and underserved meal consumption based on the results.
● Apply the updated conversion factor and meals calculation to each individual census tract in the 13-county region.

P a g e | 107
Seniors
Background The Supplemental Nutritional Assistance Program allows citizens 60-years and older to be defined as seniors, and they are eligible to receive SNAP benefits if they are under 200% of the poverty level. The Phase I Team could not find accurate data for the previously mentioned criteria, and consequently 65 years and older at 100% poverty level criteria was used to do the needs assessment. One deliverable of the Phase II ELC team was to provide more accurate data for eligible senior households for the needs assessment profile of Northern Illinois Food Bank. Assumptions Exponential Growth Assumption Phase I data listed senior households at 100% poverty level for households with individuals 65-years or older. However, SNAP eligibility allows senior homes at 200% poverty level with individuals 60-years or above to receive benefits. Instead of simply multiplying the number of households computed in Phase I by 2 (as a straight-line growth) to compute this new number, we would expect the number to rise exponentially due to the income getting closer to the mean, median, and mode income level of the population.

P a g e | 108
Exhibit 38 Exponential Growth
Uniform Distribution For any given age level, it is assumed that, for near poverty level incomes, there is an equal distribution of individuals, as defined by age. This can be assumed since while there are drastically less seniors compared to the majority of the population, their average income is also lower. Conversely, people ages 18-59 outnumber seniors, but their average income is also higher. This distribution becomes less accurate for the smaller population sample size.
Exhibit 39 Uniform Distribution

P a g e | 109
Methodology Based on the information available through American Census Surveys (ACS), the following formula was used to compute households at the 200% poverty level with at least one occupant who was 60 years or older: The percentage of seniors of a census tract multiplied by the percentage of population at 200 poverty level at that census tract multiplied by the total households at that census tract.
A number of assumptions and estimates were made to determine the final number of senior households that qualify for SNAP benefits. These are both outlined in either the Assumptions or Standard Operating Procedure sections above and below, respectively. Standard Operating Procedure A Standard Operating Procedure (SOP) document was developed for Phase II to outline the methods and steps to determine the conversion formula to compute seniors 60 years and older at 200% poverty level using seniors 65 years and older at 100% poverty level data. Computing Percentage of Seniors The first step in computing the number of seniors who is 60 years and older at the 200% poverty level was to first determine the number of seniors at the census tract level. The Phase I Team had already completed this step, but the Phase II Team also imported five-year estimates for not just 65 years and older, but 60 years and older as well. The purpose of this adjustment was to first refine the total need of senior households in 2014 – the most recent year for which ACS had the required information – and secondly to analyze the trend of senior population growth in the census tracts. With proper growth models, the Phase II Team could project future senior households with reasonable accuracy through 2020 when the census tracts are updated again. 60-65 Household Ratio It was determined necessary to have a conversion factor from 65 years and older households to 60 years and older households. This was computed in years 2010-2014 by taking the number of senior households that are 60 years and older in each census tract and dividing them by the number of senior households that are 65 years and older in the same census tract, then subtracting 1. This would give the percentage increase from 65 to 60 year households.

P a g e | 110
Computing Total Households Total households for a census tract between years 2015-2020 could not be computed in the same way as senior households. While it was assumed that typically households with at least one senior was consistently increasing over a measurable rate, the same could not be said for total households. The main, attributable factor in this is the assumption that the rate of new seniors per year is outpacing the rate of new households being constructed. In other words, the senior population is growing, while total households are not. This can be attributed to advancements in healthcare, people moving back in with their families due to financial hardships instead of getting their own house, and the collapse of the housing market in 2008 which is only now starting to recover. Taking all of this into account, three different estimations of total households per census tract were used to determine total households for years 2015-2020. All estimates were done at the county level to be able to use the numbers received from the regression analysis, and then allocate the number of households to individual census tracts afterwards. Number of Households with Seniors who are 60 years and older to Total Households For years 2010-2014, the percentage of seniors to total households was calculated, then based on a growth formula, applied to years 2015-2020. Then, the number of total households was calculated by taking the number of senior households (taken from the regression analysis) divided by the percentage of senior households to total households.
Number of Households with Seniors 65 years and older to Total Households The same method that was applied to number of households with seniors 60 years and older was applied was applied to number of households with seniors 65 years and older, in computing total households. Average Change in Total Households The third method was to take the average change over years 2010 to 2014 of total households, and gradually increase or decrease the number of total households from there. Averaging the Three Methods Since no preference could be given to one method over another, the three methods were all given the same weight. The average number of households from the three methods was then calculated, to give us the total number of households per county for years 2015-2020.
P a g e | 111
A method similar to the distribution of senior households at the census tract level, was used for distributing total households at the census tract level. Income Levels One of the main issues the Phase I Team encountered was limited information: the only income level data available for households with at least one senior who are 65 years or older at the 100% poverty level. SNAP benefits; however, allows eligibility for households with seniors who are 60 years and older at the 200% poverty level. The issue then was finding a formula to go from Phase I eligibility numbers to desired SNAP benefit eligibility numbers. The assumption was made that as income levels per household approach the mean and median household income, the number of total households at each income level begins to increase at an exponential rate. This is evident in statistics by observing a standard distribution curve. Therefore, simply multiplying the number of eligible households by 2 to go from 100% to 200% poverty level would give a significantly lower value than the true number, without even factoring in the additional households added by decreasing the age limit from 65 to 60. The data available for poverty level statistics were not in households but by individuals. However, the data did provide poverty statistics for the general population of the thirteen counties at a census tract level for the following poverty line: 50%, 100%, 125%, 150%, 185%, and 200%. From this data set, an exponential growth curve could have been calculated to show the increase in eligible population by increasing the poverty line from 100% to 200%. The only problem being that the only poverty statistic related to seniors was the 100% poverty line, and that was for seniors age 65 and older.

P a g e | 112
Exhibit 40 Population Poverty Levels
There are two ways to approach this problem:
1. Calculate the exponential growth formula for each census tract and then apply it to the seniors at 100% poverty level. The error is: as the poverty level increases the general population changes at different rates than at the senior population. This is in part due to how income is distributed to seniors against the general population since many seniors receive a type of retirement plan or Social Security.
2. Compute the percentage of seniors at the 100% poverty level against the general
population, and apply it to the 200% poverty level. Similar errors in estimation occur in the second option as with the first. However, since there is less time and error in calculating percentages compared to exponential growth (see regression analysis note above), the percentage method was chosen.
For both methods, the assumption was adopted that at any given poverty level, a uniform distribution of age could be applied. This was adopted because since seniors typically have a lower mean and median income than the general population, due to many of them being retired. Therefore, there are a greater percentage of seniors at the poverty level range than the general population, even though the general population is a greater in number than seniors overall. This makes up for there being less seniors than the general population at poverty levels. This assumption becomes less accurate the further one goes above the poverty level, but for this estimation, 200% is within the margin. This also ties in with the assumption that senior income is more uniformly distributed than the general population, meaning there are a similar amount of seniors at any given income level, as opposed to the general population where there are few at the bottom and top, and most in the middle. To calculate the percentage of seniors at 200% poverty level, first divide the number of people at the 200% poverty level by the number of people in that population. This will give the percentage of the population at 200% poverty level.

P a g e | 113
Next, calculate the percentage of seniors at 100% poverty level by dividing seniors at poverty level by total people at poverty level. This will produce the relative ratio of seniors in poverty compared to the population. Finally, multiply the two percentages together to produce the percentage of seniors at 200% poverty level.
This method was adopted since the ACS data provided number of seniors to population and population at 200% poverty level at the individual level, not the household level. As a percentage, the demographic can now be applied to households instead of individuals. This is done by multiplying the total households in a census tract by the percentage of seniors at 200% poverty level. Computing Seniors 60 Years and Older at 200% Poverty Level After all the assumption and calculations were made, the ending equation was the percentage of seniors (65) at the tract level multiplied by the percentage of people at 200% poverty level at the tract level multiplied by the total households at the tract level. This is then adjusted from 60 to 65 years in age through a conversion ratio.

P a g e | 114
Deliverables Finally, the estimated number of households with at least one senior who is 60 years or older at the 200% poverty level was compared against the actual number of households of the same category (200%, 60 years and older). Strangely enough, ACS provides this data so no calculations were needed to determine how many households were receiving SNAP benefits. To calculate the final enrollment rate by tract or county, simply divide the number of households receiving SNAP benefits, by the number of households that are eligible to. This was done for the year 2014 to compare to the Phase I results, as well as years 2015-2020 so the Northern Illinois Food Bank staff could gauge where the senior population was likely to need the most help moving forward. For 2014, there were just over 53,000 eligible, senior homes.
Exhibit 41 Eligible Seniors Pivot Table
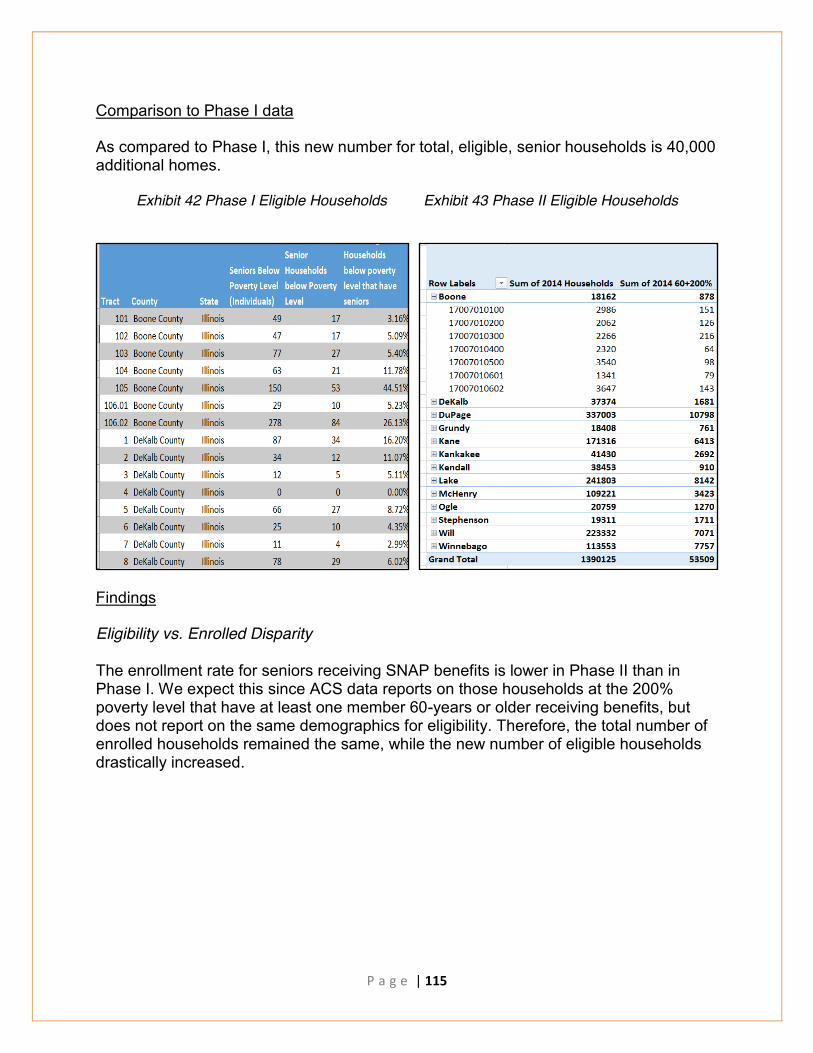
P a g e | 115
Comparison to Phase I data As compared to Phase I, this new number for total, eligible, senior households is 40,000 additional homes.
Exhibit 42 Phase I Eligible Households Exhibit 43 Phase II Eligible Households
Findings Eligibility vs. Enrolled Disparity The enrollment rate for seniors receiving SNAP benefits is lower in Phase II than in Phase I. We expect this since ACS data reports on those households at the 200% poverty level that have at least one member 60-years or older receiving benefits, but does not report on the same demographics for eligibility. Therefore, the total number of enrolled households remained the same, while the new number of eligible households drastically increased.
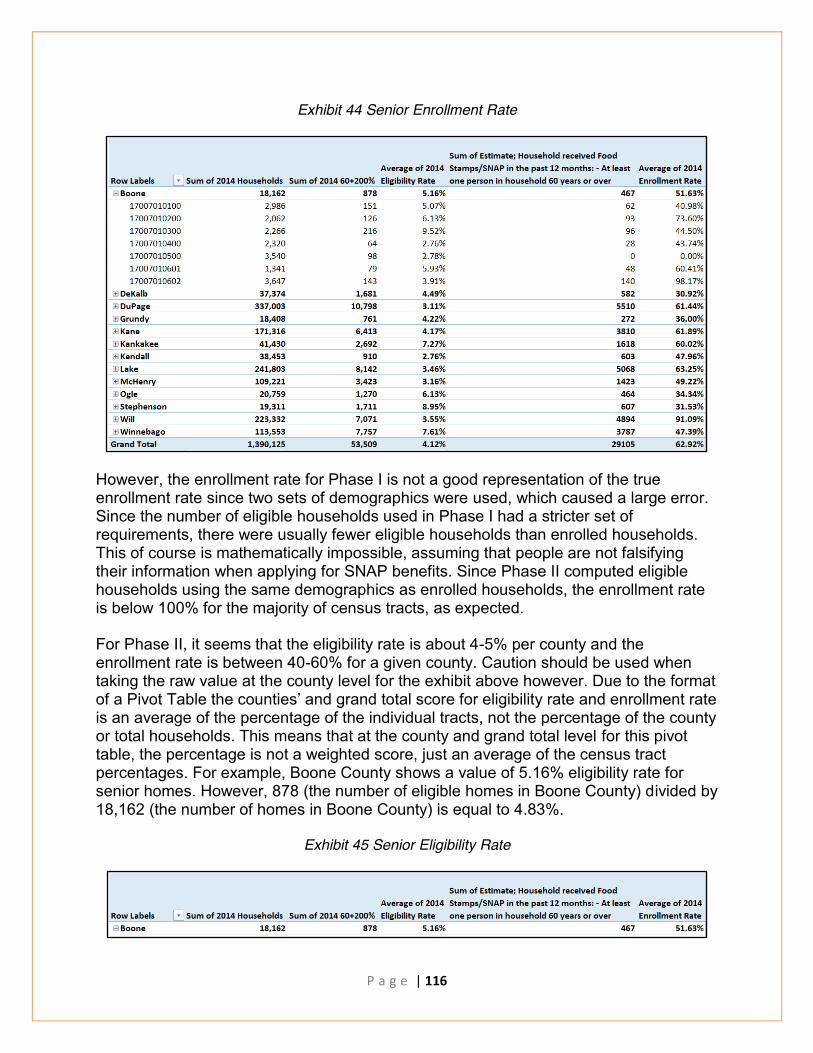
P a g e | 116
Exhibit 44 Senior Enrollment Rate
However, the enrollment rate for Phase I is not a good representation of the true enrollment rate since two sets of demographics were used, which caused a large error. Since the number of eligible households used in Phase I had a stricter set of requirements, there were usually fewer eligible households than enrolled households. This of course is mathematically impossible, assuming that people are not falsifying their information when applying for SNAP benefits. Since Phase II computed eligible households using the same demographics as enrolled households, the enrollment rate is below 100% for the majority of census tracts, as expected. For Phase II, it seems that the eligibility rate is about 4-5% per county and the enrollment rate is between 40-60% for a given county. Caution should be used when taking the raw value at the county level for the exhibit above however. Due to the format of a Pivot Table the counties’ and grand total score for eligibility rate and enrollment rate is an average of the percentage of the individual tracts, not the percentage of the county or total households. This means that at the county and grand total level for this pivot table, the percentage is not a weighted score, just an average of the census tract percentages. For example, Boone County shows a value of 5.16% eligibility rate for senior homes. However, 878 (the number of eligible homes in Boone County) divided by 18,162 (the number of homes in Boone County) is equal to 4.83%.
Exhibit 45 Senior Eligibility Rate

P a g e | 117
Finally, this data is limited to the accuracy of the data that American Census produced with its surveys. Due to sampling error, there may be an over or under representation of enrolled households in a given census tract, just by who filled out the survey. Furthermore, as discussed in the Data Disparity, a fair amount of homes do not report receiving SNAP benefits, so we may expect there to be fewer census tracts showing 0 homes enrolled in reality as compared to what ACS reported. As calculated in Phase II, about 4,500 out of the 53,000 homes eligible are not receiving SNAP benefits
Exhibit 46 Overestimation of Eligible Seniors

P a g e | 118
Total Score
Exhibit 47 Phase I Total Scores Exhibit 48 Phase II Total Scores
Overall, there was a marginal change to the total score by tract calculated, in Phase I and refined in Phase II, due to the increase in eligible senior homes. Most tracts went up by a few tenths of a point. A number of reasons account for this. In Phase I, a correlation score of only 10% was given to eligible, senior homes when calculating the total score for the census tracts. Therefore, even a large increase in eligible homes will only minimally affect the total score.
This correlation value is liable to change since Phase I accounted for the difference in demographics, 100% poverty level with a member 65-years or older vs. 200% poverty level with a member 60-years or older, when comparing eligible households to enrolled households. When the Phase II team recalculated the correlation score for eligible senior households to total need, based on Phase I’s methodology, the results were 73% correlation as compared to 10%. This meant that the total score increased by a larger factor than it would have it the correlation value remained at 10%. The scaling for total score is on a relatively small scale compared to the scaling of households used to compute it - senior homes, female head of household, etc. (see Phase I report) - and so even a small change to total score can represent hundreds of home in need.
P a g e | 119
Recommendations Concentrate on new areas of seniors As shown in the heat maps, the areas of need have changed from the Phase I to Phase II reports. Northern Illinois Food Bank outreach for regional managers should focus on areas of highest need, whether that be tracts with highest percentages of households that lack enrollment or tracts with highest number of households that lack enrollment (whichever proves to be more efficient) Update Information The estimates calculated in this portion of the ELC project are only as good as the numbers input into the various equations. Since it is on the verge of 2017 and the most recent year of ACS data was 2014, some caution should be used when applying the data. If the 2014 accurate data is used, realize that the final number of senior households at 200% poverty level will have changed over the last three years. If the 2017 data is used, realize that the base numbers used to calculate number of senior households at 200% poverty level are estimates. Continuously updating the source information as it comes out from ACS is critical to having the most reliable numbers to work with to properly allocate resources to the areas in need.

P a g e | 120
Direct Mailing List
The purpose of the direct mailing list was to easily identify location of the 836 census tract areas in the Northern Illinois Food Bank 13-county service area. As per Phase I data, the Needs Assessment Profile was broken down from the county level to the census tract level, provided by American Census Survey. However, most people are unfamiliar with the geographical locations of the census tracts. Therefore, Northern Illinois Food Bank requested the Phase II Team to develop a direct mailing list for their SNAP team to use. Methods Standard Operating Procedure 1. Match the census tracts to cities and zip codes in the thirteen county operating area Sources of data:
● US Boundary ● Best Places ● United States Postal Service (USPS)
The USPS provides a Zip to Census Tract Excel worksheet that lists all the zip codes and census tracts in America. To determine which census tracts were in the 13-county operating area the Experiential Learning Center Supplemental Nutrition Assistance Program team needed a list of what zip codes were assigned to the thirteen counties Northern Illinois Food Bank operates in. USBoundary.com and bestplaces.net both provided a list of zip codes and corresponding cities.
Exhibit 49 USPS ZIP to Tract
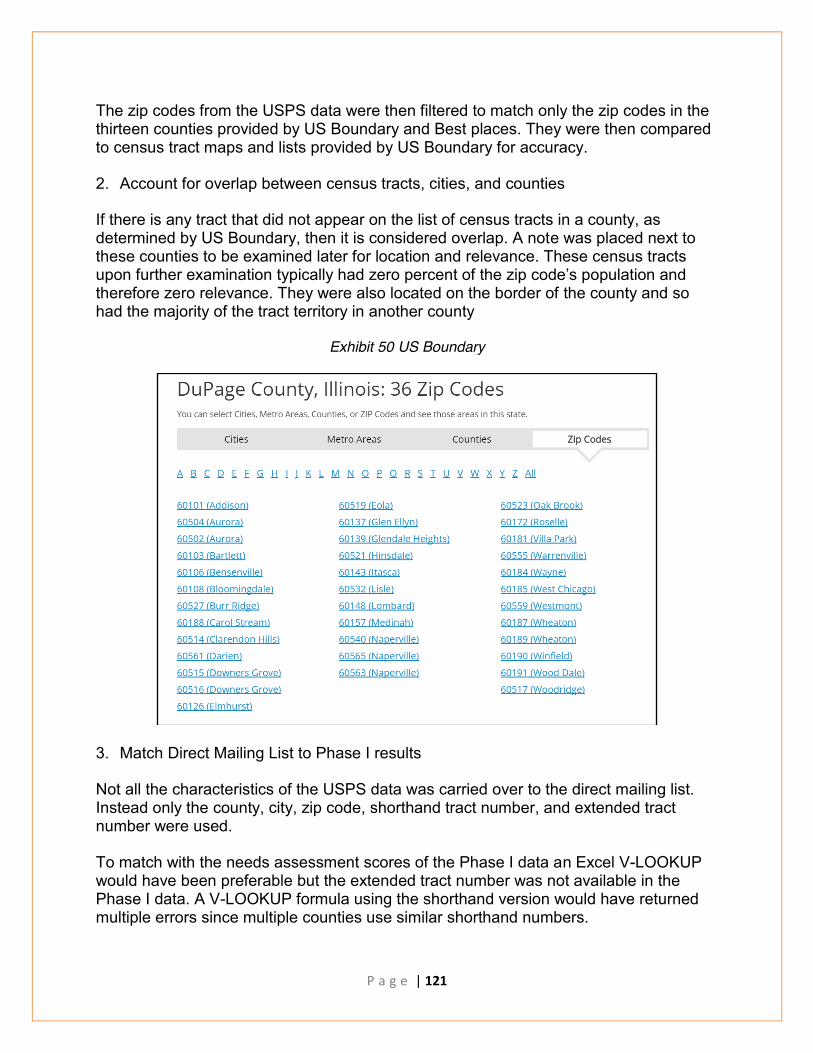
P a g e | 121
The zip codes from the USPS data were then filtered to match only the zip codes in the thirteen counties provided by US Boundary and Best places. They were then compared to census tract maps and lists provided by US Boundary for accuracy. 2. Account for overlap between census tracts, cities, and counties If there is any tract that did not appear on the list of census tracts in a county, as determined by US Boundary, then it is considered overlap. A note was placed next to these counties to be examined later for location and relevance. These census tracts upon further examination typically had zero percent of the zip code’s population and therefore zero relevance. They were also located on the border of the county and so had the majority of the tract territory in another county
Exhibit 50 US Boundary
3. Match Direct Mailing List to Phase I results Not all the characteristics of the USPS data was carried over to the direct mailing list. Instead only the county, city, zip code, shorthand tract number, and extended tract number were used. To match with the needs assessment scores of the Phase I data an Excel V-LOOKUP would have been preferable but the extended tract number was not available in the Phase I data. A V-LOOKUP formula using the shorthand version would have returned multiple errors since multiple counties use similar shorthand numbers.

P a g e | 122
Exhibit 51 Common Tract Numbers
Since a V-LOOKUP was inefficient, a MATCH formula had to be used instead. This particular function allows there to be 2 variables for every 1 returned value, as opposed to the 1:1 ratio of the V-LOOKUP. The chosen variables would then be shorthand tract number and the county it is in.
Exhibit 52.1 MATCH function tutorial
A copy of the Phase I List was added to the spreadsheet containing the Mailing List. The copied data had to then be formatted to exactly match the variables being used or the desired tract score – computed in Phase I - wouldn’t be returned. Once the data was formatted properly, the 836 census tracts with corresponding cities and zip codes had a proper score and could be filtered to show greatest need or particular city. Another MATCH formula was used to match the extended tract number from the Mailing List to the original Phase I data by repeating steps b-e, and changing the return value to extended tract number instead of tract score.
Exhibit 52.2 MATCH function result
P a g e | 123
4. Generate Heat Maps as a visual of the needs assessment. The extended tract number in the original Phase I score would then be used to generate heat maps, using the Tableau software. Phase I excel spreadsheet was uploaded to Tableau. The breakdown of geographies is by extended tract numbers in the 13-county operating territory. “Big 3” data was then filtered by overall score, senior households, Spanish speaking households, and households without a working member in the last 12 months. A scale of 0-1 was used for the heat maps for comparability between topics based on original scores from Phase I of mentioned in part iii. Assumptions The following assumptions were applied to develop our methodology. These assumptions will enable Northern Illinois Food Bank to have a better understanding of both the methodology and the data used
● The US Boundary and Zillow data is accurate for the cities and counties ● The USPS data is accurate for ZIP to Tract Excel worksheet conversion ● Census tracts that had 0% of the population of that zip code were the tracts that
overlapped either between zip codes and/or counties, and were determined to be irrelevant for that zip code.
● The data provided in Phase I is accurate. Furthermore, the list of specific census tracts that could not find further data on – due to restrictions in the American Census Data – could similarly not be accounted for in the Direct Mailing List or heat maps.
Deliverables Identify easily recognizable geographic locations based on the census tract data used in Phase I so the Food Bank could engage in outreach and allocation of resources to those areas. The Direct Mailing List was created to be that legend tool. It corresponds all of the census tracts in the thirteen county area Northern Illinois Food Banks serves to a city, zip code, and county. The Direct Mailing List was then broken down into a Pivot Table for easy viewing and user friendly adaptation. It can now be used to sort any specific county, city, tract, etc. Report views of these pivot tables can be generated for individual managers of specific regions.

P a g e | 124
Exhibit 53 Direct Mailing List
As an extension of the Direct Mailing List, and as a requested addition to the Phase I project, the Phase II ELC team has developed a visual to easily sort through the data provided in the needs assessment. These heat maps can show an overall 13-county view or be broken down into individual areas. What the heat maps do is reflect the amount of food insecurity in a census tract based upon the scores provided in the Phase I report. The scale goes from 0-1, with areas closer to zero being lighter, and areas closer to one being darker.
Exhibit 54 Heat Map 13 Counties
During the SNAP training provided by Hollie Baker-Lutz, Manager of Healthy Community Programs to the Phase II Team, the possibility of the distance between a particular census tract and the Department of Human Services (DHS) aid-qualifying individuals are required to visit being a factor in enrollment rates was discussed.

P a g e | 125
Therefore, we plotted the DHS locations on heat maps to attempt to find a correlation between distance and decreased enrollment.
Exhibit 55.1 DHS Sites List
These sites were then plotted against the Unenrollment Heat Map of the thirteen county operating area of Northern Illinois Food Bank. The Unenrollment Map was chosen as the purpose of plotting these points was to determine if there was a correlation between the distance away from the nearest DHS site and the Unenrollment Score for a census tract. After all, applicants for SNAP benefits must take an interview at a DHS site to qualify for reception of benefits, and if they are unable to get to said interview, then they won’t be able to enroll.
Exhibit 55.2 DHS Heat Map
Findings Overlapping Census Tracts There were a number of census tracts from USPS that did not have a corresponding value in the Phase I data. These census tracts upon further examination typically had

P a g e | 126
zero percent of the zip code’s population and therefore zero relevance. They were also located on the border of the county and so had the majority of the tract territory in another county. Heat Maps For primarily Spanish-speaking households, there was one specific city (Aurora, IL) that was considered an outlier compared to the rest of the group. Most census tracts had a score below 0.5 on the 0-1 scale, but Aurora was well over, resulting in the majority of the map being similar shades of lightness with one dark spot in Aurora. To create a better visual for the remaining counties, a filter was put on to cap the scale at 0.6 which will give the Northern Illinois Food Bank staff an easier time of identifying areas of need with primarily Spanish-speaking households. Keep in mind that Aurora still has the highest number, and that the map is just for visibility of the other tracts.
Exhibit 56 Heat Map - Spanish Speaking Homes
The census tracts with no data appear as black on the heat maps. This indicates a score of zero, but there is still need in those areas and further research needs to be done.

P a g e | 127
Recommendations When census tracts are updated in 2020, add the extended tract number format of census tract in addition to the shorthand numbers so the SNAP team will be able to use the V-LOOKUP function instead of the MATCH function. For the census tracts with a score of zero in the heat maps, additional sites – outside of American Census Survey and FNS data – need to be used to get an accurate representation of need at the census tract level for those areas. For now, assume need in those areas is similar to surrounding census tracts.
Exhibit 57 Further Analysis
Overall Conclusions The Phase II Snap team concludes that Northern Illinois Food Bank should utilize the deliverables presented to come closer to reaching the #75MillionMealGoal. The deliverables included an optimized Needs Assessment Profile, research on the data disparity (regarding both the meals calculator and senior data), and the zip code mailing list database. Overall Recommendations The following are recommendations for the Northern Illinois Food Bank to help utilize the SNAP deliverables listed in Exhibit 23. Needs Assessment Profile Optimization (Database Improvement) and Manager Reports Enhance the utility of the Needs Assessment Profile by including following:
● Pivot Tables, Pivot Charts, and Slicers to summarize data

P a g e | 128
● Static Operating Report for use by those who may not need full access to the data provided by the Profile
● Dashboard as a one-sheet, visual representation of the data within the Profile, and ● Heat maps to easily identify areas of need and prioritize actions needed.
Data Disparity Reconcile and improve the accuracy of household reporting:
● Apply a conversion factor to American Census Survey (ACS) data and use for SNAP-based meals calculator
● After determining the conversion factor that will allow Northern Illinois Food Bank to efficiently convert between the SNAP Needs Assessment Profile and SNAP-based meals calculator, it must be applied to the ACS data
● Once the conversion factor has been applied, input the updated data into the SNAP-based meals calculator to determine served and underserved meal consumption
Seniors
● As shown in the heat maps, the areas of need have changed from the Phase I to Phase II reports
● Outreach activities for regional managers should focus on areas of highest need, whether that be tracts with highest percentages of households that lack enrollment, or tracts with highest number of households that lack enrollment (whichever proves to be more efficient) Direct Mailing List When census tracts are updated in 2020, add the extended tract number format of census tract in addition to the shorthand numbers so the SNAP team will be able to use the Excel V-LOOKUP function instead of the MATCH function. For the census tracts with a score of zero in the heat maps, additional sites – outside of American Census Survey and Food and Nutrition Service (FNS) data – need to be used to get an accurate representation of need at the census tract level for those areas. For now, assume need in those areas is similar to surrounding census tracts.

P a g e | 129
APPENDIX B1: DATA DISPARITY

P a g e | 130
Data Disparity
Background
During the Phase I research, disparities between ACS Census data and USDA Food and Nutrition Service (FNS) SNAP Application became problematic. With the major differences between data sets, it led to an inaccurate meals calculation because the SNAP Needs Assessment database is sourced from Census data and the meals computations should be based on SNAP Application data.
The task of the Phase II Team was to review the Phase I research, as well as conducting its own, to determine meaningful assumptions and adjustments to the meals calculation. This included the analysis of the “Big 3” non-income characteristics of seniors, Spanish speakers, and unemployed individuals.
According to the article, Errors in Survey Reporting and Imputation and Their Effects on Estimates of Food Stamp Program Participation by Bruce D. Meyer and Robert M. George, 32% of individuals do not report that they are receiving SNAP benefits to the ACS survey. This research and methodology was used specifically in the state of Illinois, as well as Maryland, and the study was done in 2011. A 2016 study focusing on Texas and New York applied this same method. This will be used to determine an appropriate rationale that could be developed and applied to provide reliable assumptions to convert between the SNAP Needs Assessment profile and Feeding America SNAP impact meals calculator to determine the served and underserved meals.
Methodology
The following outlines the methods and steps to develop a conversion factor that may be applied to determine a more appropriate number the American Census Survey (ACS) data compared to USDA FNS SNAP Application data. Rationale is provided in the body of this report.
1) Determine the number of Households receiving SNAP benefits
● Total number of Illinois households receiving SNAP benefits for the years 2005-2015 were determined from the ACS Census data and FNS data
● Total number of households, as a whole, in the state of Illinois, were determined for the years 2005-2015 using ACS Census data

P a g e | 131
2) Calculate percentage changes of households receiving SNAP benefits
● Determine the percentage change of Illinois households receiving SNAP benefits by taking the ACS Census number of Illinois households receiving SNAP benefits and dividing it by the total households
● Determine the percentage change of households receiving SNAP benefits using ACS Census data. The existing year’s number of households receiving SNAP benefits is divided by the previous years number of households and subtract one. Using this same methodology, perform the percentage change of Illinois households receiving SNAP benefits using FNS data
● Compute the percentage change of total households using ACS Census data by taking the current year’s total number of households and dividing it by the previous year’s total number of households and subtract one
3) Compute the difference between FNS and ACS data across 10 years (Factor #1)
● Determine the difference between FNS and ACS data by taking the FNS data value of total Illinois households receiving SNAP benefits and dividing it by the ACS data value of total Illinois households receiving SNAP benefits.
● Once those values have been determined for the years 2005-2015, compute the average for each individual year.
4) Use formula and incorporate “Big 3” data (Factor #2)
Index of Disparity (ID) = 100.00 × ((Σ|𝑟 − 𝑅|/𝑛)/𝑅)
● r is the subgroup rate, R is the total population rate, and n is the number of population subgroups
● “Big 3”: Seniors, Spanish speakers, and the unemployed were used as the different subgroups, and the total population rate was the total number of households according to FNS data in the state of Illinois
● Use this formula to compute index of disparity for the years 2005-2015. ● This formula was derived from the research previously discovered in the article,
“Racial Disparity, Households Receiving SNAP benefits, ACS 2009-13” adopted by researchers from the National Center for Health Statistics and the National Institute of Health. According to the article, the “index of disparity measures the magnitude of variation in indicator percentages across population groups-- in this case racial and ethnic groups” (1). This article used four population subgroups in their index of disparity calculation which included Non-Hispanic White, Hispanic or Latino, Black or African-American, and other race, which includes Hawaiian, Asian, Native American, or multiple races.

P a g e | 132
5) Underreporting factor (Factor #3)
● According to the article, Errors in Survey Reporting and Imputation and Their Effects on Estimates of Food Stamp Program Participation by Bruce D. Meyer and Robert M. George, 32% of individuals do not report that they are receiving SNAP benefits to the ACS survey.
6) Combine all factors and apply to Census data
● Once all factors have been computed for the years 2005-2015, sum all values and take the average
● After this conversion factor is computed, multiply it by each Illinois household receiving SNAP benefits data value determined by the ACS data set for the years 2005-2015
Exhibit 58 Conversion Factor
Assumptions
The following assumptions were applied to develop our methodology. These assumptions will help enable Northern Illinois Food Bank to have a better understanding of both the methodology and the data used.
Primary differences between Census data (ACS) and SNAP Administrative data (FNS) were identified by the Phase I SNAP Team and are due to:
1. Underreporting of benefits – the issue of underreporting of benefits is well-documented and has been a problem for many years, according to a research article titled, Errors in Survey Reporting and Imputation and Their Effects on Estimates of Food Stamp Program Participation, by Bruce D. Meyer and Robert M. George from the University of Chicago. According to the article, “in the ACS, the share of recipients according to the administrative data who are classified as non-recipients in the survey, in other words the false negative rate, is 32 percent in Illinois” (9). This research and methodology was used in a study for Illinois and once validated, was applied to other states.

P a g e | 133
2. Inconsistent different methods for reporting income eligibility a. How information is collected – ACS census data is collected by conducting
surveys while FNS data is collected by application and certification records
b. The components of the data i. ACS – collects data on the gross income for household members
aged 15 and older so an economic unit’s income can be compared with 130 percent and 185 perfect of the applicable poverty guideline to determine the economic unit’s income eligibility status
ii. FNS data generally includes all recurring sources of gross income
3. Reporting Periods a. ACS – Annual 12-month income (averages the 12-month period) b. FNS – Current monthly income c. Consumer Price Index (CPI) adjustments (ACS data)
4. Changing economic conditions
a. ACS uses 12-month reporting but adjusts for differences between the calendar year reporting and the month of interviews using the CPI
b. ACS is determined to be less responsible than FNS, which uses current monthly reporting
c. In periods where economic conditions are… i. Deteriorating: ACS estimates will likely understate eligibility ii. In recovery: ACS estimates will likely overstate eligibility iii. More pronounced for three-year and five-year ACS estimates than
for the one-year ACS estimates iv. 2008/2009 major economic downturn pattern shows a faster pace
of increase in reported FNS data than in ACS data used to estimate 2014 using 2010 census data
d. Different “household” definitions i. ACS tends to have lower results than FNS ii. ACS inclusive (includes all living in the same residence) iii. FNS may consider multiple economic units within the same
residence e. Errors made in the process
i. Survey sampling errors exist in ACS census data while application procedures errors exist in FNS data
ii. Minor parts of the ACS data are incomplete or inaccurate and there are mistakes in the certification/application entry

P a g e | 134
Deliverables
Compute 10-year trends between FNS and ACS data
Exhibit 59 FNS vs. ACS Data Disparity
Determine Non-income Characteristics That Will Affect Disparity Between ACS vs. FNS Data
The major non-income characteristics, that were determined by the Phase I Team and Hollie Baker-Lutz’s 2014 data analysis, to include in the conversion factor calculation were seniors, Spanish speakers, and unemployed. It was determined that these three characteristics were ultimately major factors that caused ACS data to be reportedly lower than FNS data with individuals receiving SNAP benefits.
Another significant factor in the data disparity between US Census data and SNAP applications data is the underreporting of benefits. According to the article, Within and Across County Variation in SNAP Misreporting: Evidence from linked ACS and Administrative Records, by Benjamin Cerf Harris at the U.S. Census Bureau, the two main issues pertaining to misreporting rates are cognitive and motivational. The cognitive aspect of the issue is related to the misunderstanding of survey questions or due to individuals having a faulty memory. It assumes that respondents make a good faith effort to respond correctly. The other aspect of underreporting is motivational. Individuals willingly provide false information to survey questions. This is due to unwillingness to cooperate with surveys or social desirability bias, interviewer effects, or stigma.
Findings

P a g e | 135
Throughout the research, the ultimate goal was to find an appropriate rationale that may be developed and applied to provide reliable assumptions to efficiently convert between the SNAP Needs Assessment Profile and SNAP-based meals calculator to determine served and underserved meals.
Starting with the unadjusted unenrollment rate and using the new conversion factor, a new adjusted unenrollment rate was determined. The ACS data is multiplied by the new conversion factor to get a new adjusted number that is close to the FNS data. With this new number, the meals calculation will be more accurate in determining the served and underserved meals consumption.
Exhibit 60 Adjusted ACS Values of IL Households Receiving Snap
By using the conversion factor of 1.63 and multiplying it by the total number of Illinois households receiving SNAP benefits, according to the ACS, it generated a new value. Although this new value isn’t perfectly the value of the total number of Illinois households receiving SNAP, as reported by the FNS, it is closer than if it was kept at the original value. With this new number for Illinois households receiving SNAP benefits, it will help Northern Illinois Food Bank determine served and underserved meals.

P a g e | 136
Exhibit 61 FNS Data Compared to Adjusted ACS Data
Table 62 Estimate of Households With Conversion Factor
Using the 13-county level data from the 2014 data spreadsheet and Hollie’s data analysis from the Phase I report, the 1.63 conversion factor was applied in order to determine new values of total eligible households, participating households, and unenrolled households. These new values will then be placed in the Feeding America SNAP impact meals calculator to determine the served and underserved meals consumption.
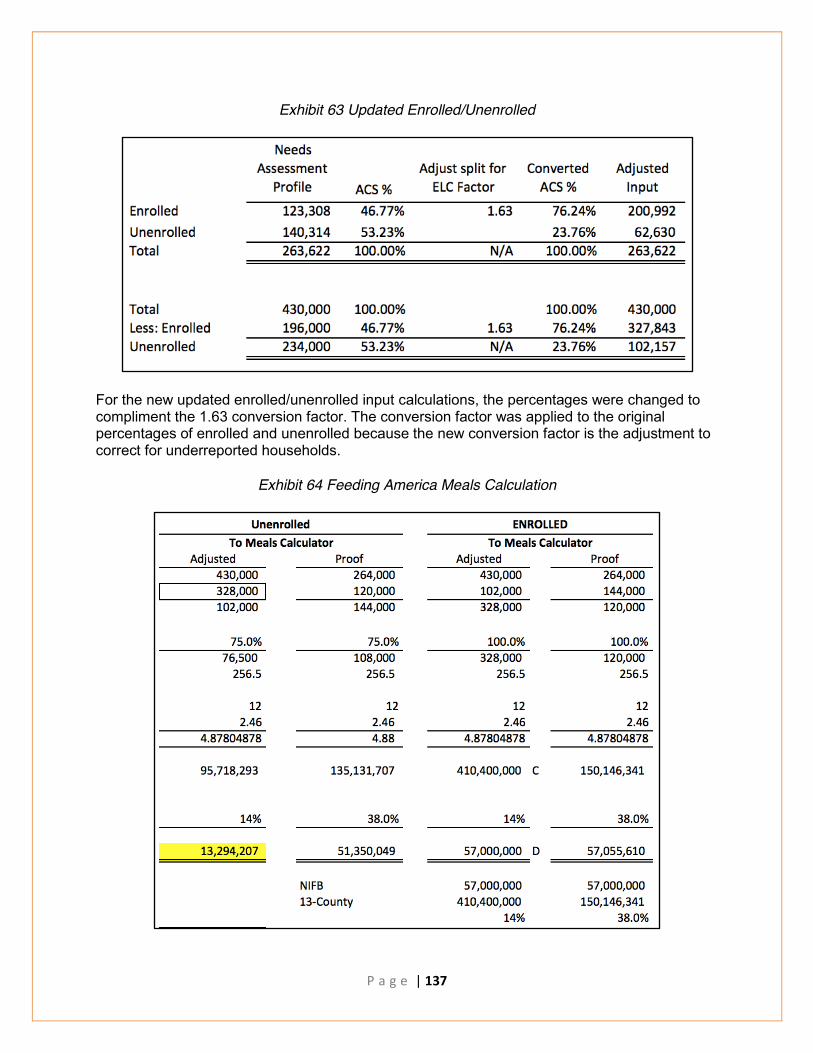
P a g e | 137
Exhibit 63 Updated Enrolled/Unenrolled
For the new updated enrolled/unenrolled input calculations, the percentages were changed to compliment the 1.63 conversion factor. The conversion factor was applied to the original percentages of enrolled and unenrolled because the new conversion factor is the adjustment to correct for underreported households.
Exhibit 64 Feeding America Meals Calculation

P a g e | 138
By using the new percentages of enrolled and unenrolled households, we were able to adjust the numbers to create a new meals calculator computation.
One main driver that was found in developing this new meals calculation was determining that the 57,000,000 meals that Northern Illinois Food Bank provides is a fixed number. With this value being fixed, the total number of meals served in the 13-county region increases from 150,146,341 to 410,400,000. As the total number of meals served increases, the percentage of Northern Illinois Food Bank’s meal share in the 13-county region decreases from 38% to 14%.
After determining the new percentage of Northern Illinois Food Bank’s share of meals in the 13-county region, we determined the actual number of meals.The Phase I Team determined 51,250,049 meals were needed to serve, but after using the conversion factor, as well as our new calculations, 13,294,207 meals were determined.
Northern Illinois Food Bank has a goal of serving 75 million meals by the year 2020. The Phase II Team created a “what-if” scenario to determine the number of underserved meals if the Food Bank provided 75 million meals.
Exhibit 65 Northern Illinois Food Bank Share to Serve at 75M
410,400,000 meals were used as the total number of enrolled within the 13-county region, and 95,718,293 was used as the total number of unenrolled in the 13-county region. By using our conversion and meals calculator calculation, 17,492,378 underserved meals were determined.
These new values for the underserved meals is more accurate compared to Phase I, due to the fact that the numbers were adjusted for the specific criteria, including, the “Big 3,” underreported rate, and the historical 10-year trends.

P a g e | 139
These new values and conversion factor can be used in each individual tract within the 13-county region, therefore Northern Illinois Food Bank can pinpoint the specific areas where they are underserving meals and be more accurate and efficient in their process.
Recommendations
● Apply conversion factor that was determined by the methodology conducted by the Phase II team, to ACS data, and use for Feeding America SNAP Impact meals calculator.
● Convert between the SNAP Needs Assessment Profile and Feeding America
SNAP Impact meals calculator. Once the conversion factor has been applied to the Illinois households receiving SNAP ACS data, determine the values that must be entered into the Feeding America SNAP Impact meals calculator.
● Input the updated data into the Feeding America SNAP Impact meals calculator.
Placing the updated data in the meals calculator will allow Northern Illinois Food Bank to determine the served and underserved meal consumption based on the results.
● Apply the updated conversion factor and meals calculation to each individual census tract in the 13-county region.

P a g e | 140

P a g e | 141
APPENDIX B2: SENIORS

P a g e | 142
Seniors
Background The Supplemental Nutritional Assistance Program allows citizens 60 years and older to be defined as seniors, and they are eligible to receive SNAP benefits if they are under 200% of the poverty level. The Phase I Team could not find accurate data for the previously mentioned criteria and used 65 years and older at 100% poverty level to do its needs assessment. One deliverable the Phase II Team was to provide more accurate data for the needs assessment profile of Northern Illinois Food Bank. Assumptions The following assumptions were applied to develop our methodology. These assumptions will enable Northern Illinois Food Bank to have a better understanding of both the methodology and the data used. Assumptions on distribution of income levels Income for the United States follows a normal distribution that is skewed right. This means that the mean income in America is greater than the median income, and the median income is greater than the mode income.
● Mean: average number in a set of data ● Median: middle number in a set of data ● Mode: most frequent number in a set of data

P a g e | 143
Exhibit 66 American Income Distribution
This distribution model can be applied with accuracy to the thirteen counties Northern Illinois Food Bank operates in. Standard Income Distribution for Seniors It is assumed that senior income will follow a more standard distribution (mean equals median equals mode) than the entire age population. This is due to many seniors being retired and living off of retirement income - 401K, Social Security, IRA, etc.
Exhibit 67 Senior Income Distribution
The 200% poverty level is below the mean ($72,641) and median ($51,939) income of the population observed. Therefore, we would expect to see an exponential growth in

P a g e | 144
the number of households eligible for SNAP benefits at the 200% poverty level as opposed to the 100% poverty level.
Exhibit 68 Exponential Growth
Uniform distribution, as opposed to standard distribution, can be adopted when applying senior age level to the poverty level with reasonable accuracy. This is due in part to the senior population living longer as it also increases in number, as well as seniors having a more even distribution of income due to Social Security, Medicare, and other benefits.
Exhibit 69 Uniform Distribution

P a g e | 145
Assumptions on growth of population over time
● Data used is from five-year surveys ending in 2014 and is most reliable data ACS has to offer.
● Growth formulas used to compute future years’ populations have small variance in the first few years, but variance increases as time goes on.
● The percentage of seniors should increase at a predetermined rate since medical advancements have caused population to live longer.
● The total number of households did not change with a predictable growth formula but continually shifted. This is due to variances in number of births, immigration, and deaths per year in the different census tracts/counties. To compute the total number of households, the average of 3 different methods taken was used. The total number of households computed for future years up to 2020 is within the acceptable margin of error.
▪ Percentage of seniors 60 years and older compared to total households
▪ Average growth of households over 5-year period A regression analysis was used to compute the increase of senior households on a county basis. The average growth of percentage of senior households in a tract per county can be accurately to distribute senior households per tract based on the regression analysis
Phase I and ACS data is accurate, but inherent to error ACS and Phase I data is based on surveys from individuals at the tract level. While this data is the most accurate found for requested population size, it does have it’s own margin of error with every estimate. Therefore, when using these estimates in computing the final number, a similar margin of error is expected and will be defined as acceptable. Methodology Based on the information available through American Census Surveys (ACS), the following formula was used to compute households at the 200% poverty level with at least one occupant who was 60 years or older: the percentage of seniors of a census tract multiplied by the percentage of population at 200 poverty level at that census tract multiplied by the total households at that census tract.
A number of assumptions and estimates were made to come up with the final number of senior households that qualify for SNAP benefits, These are both outlined in either the Assumptions or Standard Operating Procedure sections above and below, respectively.

P a g e | 146
Standard Operating Procedure A Standard Operating Procedure (SOP) document was developed for Phase II to outline the methods and steps to determine the conversion formula to compute seniors 60 years and older at 200% poverty level using seniors 65 years and older at 100% poverty level data. Computing Percentage of Seniors The first step in computing the number of seniors who is 60 years and older at the 200% poverty level was to first determine the number of seniors at the census tract level. The Phase I Team had already completed this step, but the Phase II Team also imported five-year estimates for not just 65 years and older, but 60 years and older as well. The purpose of this adjustment was to first refine the total need of senior households in 2014 – the most recent year for which ACS had the required information – and secondly to analyze the trend of senior population growth in the census tracts. With proper growth models, the ELC team could project future senior households with reasonable accuracy through 2020 when the census tracts would be updated again. Seniors 60 Years and Older The five-year data was initially filtered to the thirteen counties Northern Illinois Food Bank operates in, then for each individual year. For easy filtering options, a pivot table was set up for each year that included the following criteria:
● Total households ● Households with at least one member 60 years or older ● Margin of error for households with at least one member 60 years or older ● Households with no members 60 years or older ● Margin of error for households for households with no members 60 years or older
Exhibit 70 Senior Population
Margin of Error was used to test discrepancies when the data was used in practice. If there were misleading numbers later in the formula, the margin of error for individual census tracts could be examined to shed some light on the variance.

P a g e | 147
A growth model was decided upon to compute the number of senior households for future years up to 2020 instead of taking the average population of the census tracts over the five-year estimate. A quick examination of the five-year data shows the number of senior households was increasing. This increase in households is most likely attributable to advances in medical technology allowing the Baby Boomers to live longer; see Assumptions for more details. The most accurate model for straight-line growth is the regression analysis offered by Excel, converting any numbers that are input to a y=mx+b equation. The value R-square in the regression analysis measures the accuracy of the equation. The P-value denotes the percentage variance from the equation. High R-squares and low P-values indicate the accuracy of the given equation, and by extension, the resulting numbers. The regression analysis is time consuming; however, so the analysis was only performed on the county level to predict future senior households. Any R-square or P-value that was less than .9 and greater than .05, respectively, was taken note of as it could negatively influence the final calculation. Only Boone county had an R-square value of lower than .9 (.892), but it’s P-value was at .004 which is within the acceptable margin of error.
Exhibit 71 Regression Analysis

P a g e | 148
Since time constraints would make calculating the number of senior households at the census tract level inefficient, the marginal growth of the percentage of senior households in a census to total senior households in the county was taken over the five-year period 2009-2014. An average growth percentage was then applied to each census tract for the respective counties. For each consecutive year after 2014, that percentage of the population at a particular census tract level was then multiplied by the regression analysis households for that county, to give us the total senior households in each census tract. Seniors 65 Years and Older Apply the same method from seniors 60 years and older to the data for seniors 65 and older.
Exhibit 72 Age 65 Household Growth
60-65 Household Ratio It was determined necessary to have a conversion factor from 65 years and older households to 60 years and older households. This was computed in years 2010-2014 by taking the number of senior households that are 60 years and older in each census tract and dividing them by the number of senior households that are 65 years and older in the same census tract, then subtracting 1. This would give the percentage increase from 65 to 60 year households.
For years 2015-2020, the estimated number of senior households had to be used. This was accomplished by taking the number of senior households computed per county using the regression analysis, for both 60 and 65 year households, and allocating the total number to that county’s specific census tracts based upon the historic percentage of senior households each tract had.

P a g e | 149
The percentage of each county's’ census tracts summed to a value of one, and was computed for years 2015-2020 by taking the change in growth for each year and multiplying it by the number of years after 2014.
Since the growth formula is based on the average growth, there is an increasing variance over time. This is due to census tract populations not following an average growth in percentage of senior households, but fluctuating from year to year. This gives negative ratios in some census tracts for years 2019 and 2020, which means there are more households at 65 years and older than there are at 60 years and older, which is mathematically impossible. A note listing the census tracts and years this was applicable was made, and Northern Illinois Food Bank staff are advised to use those tracts with caution during those years. For all other census tracts that do not have a negative 60:65 household ratio, the increase in percentage from households with seniors at 60 years and older vs. households with seniors at 65 years and older was typically between 30-40% on average. Computing Total Households Total households for a census tract between years 2015-2020 could not be computed in the same way as senior households. While it was assumed that typically households with at least one senior was consistently increasing over a measurable rate, the same could not be said for total households. The main, attributable factor in this is the assumption that the rate of new seniors per year is outpacing the rate of new households being constructed. In other words, the senior population is growing, while total households are not. This can be attributed to advancements in healthcare, people moving back in with their families due to financial hardships instead of getting their own house, and the collapse of the housing market in 2008 which is only now starting to recover. Taking all of this into account, three different estimations of total households per census tract were used to determine total households for years 2015-2020. All estimates were done at the county level to be able to use the numbers received from the regression analysis, and then allocate the number of households to individual census tracts afterwards. Number of Households with Seniors who are 60 years and older to Total Households For years 2010-2014, the percentage of seniors to total households was calculated, then based on a growth formula, applied to years 2015-2020. Then, the number of total households was calculated by taking the number of senior households (taken from the regression analysis) divided by the percentage of senior households to total households.

P a g e | 150
Number of Households with Seniors 65 years and older to Total Households The same method that was applied to number of households with seniors 60 years and older was applied was applied to number of households with seniors 65 years and older, in computing total households. Average Change in Total Households The third method was to take the average change over years 2010 to 2014 of total households, and gradually increase or decrease the number of total households from there. Averaging the Three Methods Since no preference could be given to one method over another, the three methods were all given the same weight. The average number of households from the three methods was then calculated, to give us the total number of households per county for years 2015-2020.
A method similar to the distribution of senior households at the census tract level, was used for distributing total households at the census tract level. Income Levels One of the main issues the Phase I Team encountered was limited information: the only income level data available for households with at least one senior who are 65 years or older at the 100% poverty level. SNAP benefits; however, allows eligibility for households with seniors who are 60 years and older at the 200% poverty level. The issue then was finding a formula to go from Phase I eligibility numbers to desired SNAP benefit eligibility numbers. The assumption was that as income levels per household approach the mean and median household income, the number of total households at each income level begins to increase at an exponential rate. This is evident in statistics by observing a standard distribution curve. Therefore, simply multiplying the number of eligible households by 2 to go from 100% to 200% poverty level would give a significantly lower value than the
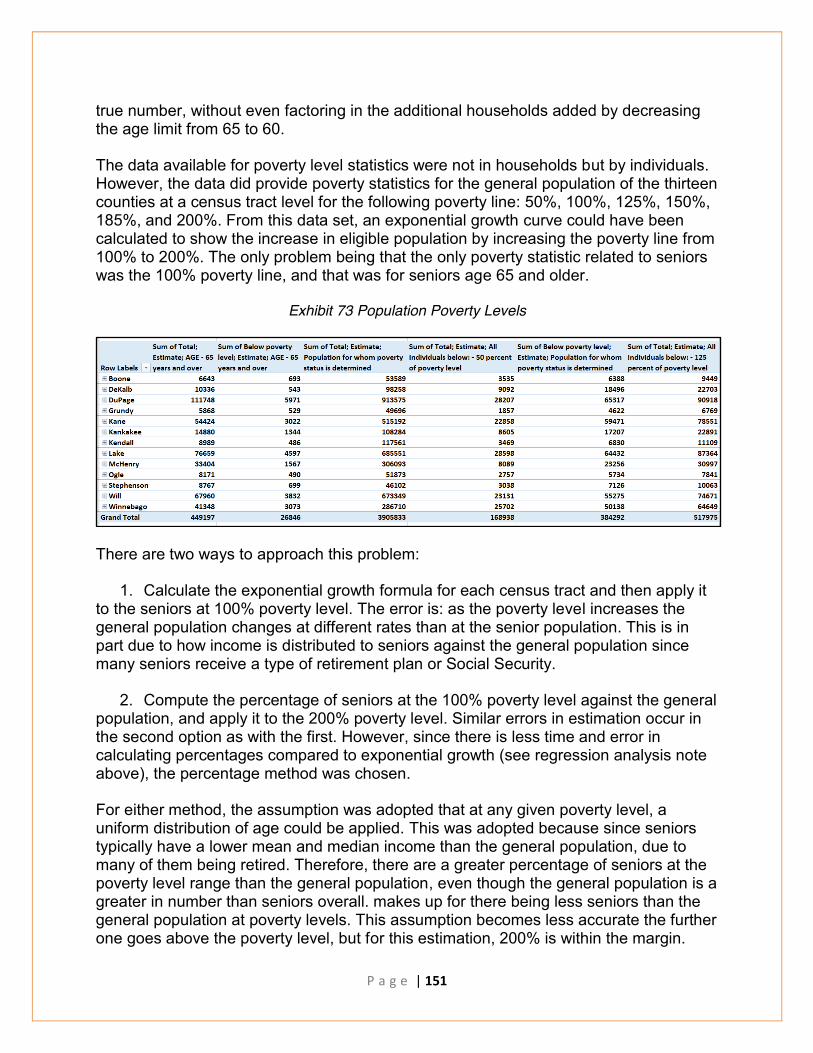
P a g e | 151
true number, without even factoring in the additional households added by decreasing the age limit from 65 to 60. The data available for poverty level statistics were not in households but by individuals. However, the data did provide poverty statistics for the general population of the thirteen counties at a census tract level for the following poverty line: 50%, 100%, 125%, 150%, 185%, and 200%. From this data set, an exponential growth curve could have been calculated to show the increase in eligible population by increasing the poverty line from 100% to 200%. The only problem being that the only poverty statistic related to seniors was the 100% poverty line, and that was for seniors age 65 and older.
Exhibit 73 Population Poverty Levels
There are two ways to approach this problem:
1. Calculate the exponential growth formula for each census tract and then apply it to the seniors at 100% poverty level. The error is: as the poverty level increases the general population changes at different rates than at the senior population. This is in part due to how income is distributed to seniors against the general population since many seniors receive a type of retirement plan or Social Security.
2. Compute the percentage of seniors at the 100% poverty level against the general population, and apply it to the 200% poverty level. Similar errors in estimation occur in the second option as with the first. However, since there is less time and error in calculating percentages compared to exponential growth (see regression analysis note above), the percentage method was chosen. For either method, the assumption was adopted that at any given poverty level, a uniform distribution of age could be applied. This was adopted because since seniors typically have a lower mean and median income than the general population, due to many of them being retired. Therefore, there are a greater percentage of seniors at the poverty level range than the general population, even though the general population is a greater in number than seniors overall. makes up for there being less seniors than the general population at poverty levels. This assumption becomes less accurate the further one goes above the poverty level, but for this estimation, 200% is within the margin.

P a g e | 152
This also ties in with the assumption that senior income is more uniformly distributed than the general population, meaning there are a similar amount of seniors at any given income level, as opposed to the general population where there are few at the bottom and top, and most in the middle. To calculate the percentage of seniors at 200% poverty level, first divide the number of people at the 200% poverty level by the number of people in that population. This will give the percentage of the population at 200% poverty level. Next, calculate the percentage of seniors at 100% poverty level by dividing seniors at poverty level by total people at poverty level. This will produce the relative ratio of seniors in poverty compared to the population. Finally, multiply the two percentages together to produce the percentage of seniors at 200% poverty level.
This method was adopted since the ACS data provided number of seniors to population and population at 200% poverty level at the individual level, not the household level. As a percentage, the demographic can now be applied to households instead of individuals. This is done by multiplying the total households in a census tract by the percentage of seniors at 200% poverty level. Computing Households 60+ at 200% Once calculated for households, multiply the number of households with seniors 60 and over at 200% poverty level by the conversion ratio calculated earlier for 60:65. Computing Seniors 60 Years and Older at 200% Poverty Level Formula After all the assumption and calculations were made, the ending equation was the percentage of seniors (65) at the tract level multiplied by the percentage of people at 200% poverty level at the tract level multiplied by the total households at the tract level. This is then adjusted from 60 to 65 years in age through a conversion ratio.
Deliverables Finally, the estimated number of households with at least one senior who is 60 years or older at the 200% poverty level was compared against the actual number of

P a g e | 153
households of the same category (200%, 60 years and older). Strangely enough, ACS provides this data so no calculations were needed to determine how many households were receiving SNAP benefits. To calculate the final enrollment rate by tract or county, simply divide the number of households receiving SNAP benefits, by the number of households that are eligible to. This was done for the year 2014 to compare to the Phase I results, as well as years 2015-2020 so the Northern Illinois Food Bank staff could gauge where the senior population was likely to need the most help moving forward. For 2014, there were just over 53,000 eligible, senior homes.
Exhibit 74 Example from Pivot Table Deliverable
Comparison to Phase I data As compared to Phase I, this new number for total, eligible, senior households is 40,000 additional homes.

P a g e | 154
Exhibit 75 Phase I Eligible Senior Homes Exhibit 76 Phase II Eligible Senior Homes
Check Figure To make sure the equation was accurate, the Phase II Team tested its results against the only known results that ACS provided – 100% poverty level for seniors 65 and older. However, our data was in households and their data was in individuals. Therefore, we divided the individuals number by the household number to get average family size per census tract. When checked against average family size taken from the Phase I data, the results were usually within .01 variance for the entire data set.
Exhibit 77 Senior Check Figure

P a g e | 155
Findings Eligibility vs. Enrolled Disparity The enrollment rate for seniors receiving SNAP benefits is lower in Phase II than in Phase I. We expect this since ACS data reports on those households at the 200% poverty level that have at least one member 60-years or older receiving benefits, but does not report on the same demographics for eligibility. Therefore, the total number of enrolled households remained the same, while the new number of eligible households drastically increased.
Exhibit 78 Senior Enrollment Rate
However, the enrollment rate for Phase I is not a good representation of the true enrollment rate since two sets of demographics were used, which caused a large error. Since the number of eligible households used in Phase I had a stricter set of requirements, there were usually fewer eligible households than enrolled households. This of course is mathematically impossible, assuming that people are not falsifying their information when applying for SNAP benefits. Since Phase II computed eligible households using the same demographics as enrolled households, the enrollment rate is below 100% for the majority of census tracts, as expected. For Phase II, it seems that the eligibility rate is about 4-5% per county and the enrollment rate is between 40-60% for a given county. Caution should be used when taking the raw value at the county level for the exhibit above however. Due to the format of a Pivot Table the counties’ and grand total score for eligibility rate and enrollment rate is an average of the percentage of the individual tracts, not the percentage of the county or total households. This means that at the county and grand total level for this pivot table, the percentage is not a weighted score, just an average of the census tract

P a g e | 156
percentages. For example, Boone County shows a value of 5.16% eligibility rate for senior homes. However, 878 (the number of eligible homes in Boone County) divided by 18,162 (the number of homes in Boone County) is equal to 4.83%.
Exhibit 79 Senior Eligibility Rate
Finally, this data is limited to the accuracy of the data that American Census produced with its surveys. Due to sampling error, there may be an over-o- under representation of enrolled households in a given census tract, just by who filled out the survey. Furthermore, as discussed in the Data Disparity, a fair amount of homes do not report receiving SNAP benefits, so we may expect there to be fewer census tracts showing 0 homes enrolled in reality as compared to what ACS reported. As calculated in Phase II, about 4,500 out of the 53,000 homes eligible are not receiving SNAP benefits
Exhibit 80 Overestimation Eligible Seniors

P a g e | 157
Total Score
Exhibit 81 Phase I Total Scores Exhibit 82 Phase II Total Scores
Overall, there was a marginal change to the total score by tract calculated, in Phase I and refined in Phase II, due to the increase in eligible senior homes. Most tracts went up by a few tenths of a point. A number of reasons account for this. In Phase I, a correlation score of only 10% was given to eligible, senior homes when calculating the total score for the census tracts. Therefore, even a large increase in eligible homes will only minimally affect the total score. This correlation value is liable to change since Phase I accounted for the difference in demographics, 100% poverty level with a member 65-years or older vs. 200% poverty level with a member 60-years or older, when comparing eligible households to enrolled households. When the Phase II team recalculated the correlation score for eligible senior households to total need, based on Phase I’s methodology, the results were 73% correlation as compared to 10%. This meant that the total score increased by a larger factor than it would have it the correlation value remained at 10%. The scaling for total score is on a relatively small scale compared to the scaling of households used to compute it - senior homes, female head of household, etc. (see Phase I report) - and so even a small change to total score can represent hundreds of home in need.

P a g e | 158
Uniform Distribution Error As with Phase I, Phase II reported a number of tracts that had a higher number of enrolled households than eligible households. While the number of tracts was not nearly as large as Phase I, it still did represent 150 out of the total 827 census tracts - nearly 20%. Further examination of the data revealed the possible causes for this variance. Nature of Uniform Distribution The purpose of uniform distribution was to provide an estimate for the area under a curved slope. After all, the area of a rectangle is much easier to compute, height x width, than the area of circle, radius squared x pi - where usually pi is rounded to the nearest hundredth of 3.14. However, most curves are not ‘perfect’ like a circle, and in this case, we assumed an exponential growth curve to represent number of eligible senior homes - see Assumptions. This means that all the area under the curve represents the homes with at least one member 60-years or older at 200% of the poverty level. Uniform distribution applies easy to calculate, known areas to each point on the curve, then sums them to together to produce the estimated result. For each individual point, some areas might be less than the actual area, and some might be more. However, when taken together the number is fairly accurate.
Exhibit 83 Example of a Uniform Distribution Error
As it applies to senior homes, some census tracts will have a lower estimated number of senior homes, and some census tracts will have a higher number of estimated homes than in reality. Upon examination of the data, it seems that urban centers - census tracts in DuPage, Lake, and Will counties - tend to have more census tracts that have a larger amount of enrolled households than eligible ones.

P a g e | 159
Exhibit 84 Underestimated Eligible Seniors
Therefore, we assume that the census tracts in densely populated urban centers have an understated amount of eligible homes as calculated using uniform distribution. Conversely, if urban centers do understate eligible homes, than the Phase II SNAP team also assumes that rural areas - Boone, Grundy, and Ogle counties - will have more census tracts with overstated eligible homes. This can be attributed to the higher number of retirement and assisted living homes (i.e. more seniors in need) in urban areas compared to rural communities, as well as other contrasts (such as standard of living) between the two.
Exhibit 85 Overestimate Eligible Seniors
Since uniform distribution is an averaging tool used to calculate the total area under the curve, it is follows that while there are some large discrepancies between a census tract’s eligible to enrolled households, this variance decreases the larger the geographic region becomes. Therefore, counties have a better representation of eligible to enrolled households than census tracts do, and the grand total of eligible households is more accurate than the counties. Margin of Error As the Assumptions section stated, the data provided by American Census is an estimated number of the true value of whichever demographic was surveyed, and therefore each estimate has an inherent margin of error. It follows then, that the calculation made by Phase II carry with it the same, or even amplified, margin of error as the raw data provided. As stated above, 150 out of the 827 census tracts (that had available data) had a higher number of enrolled households than eligible ones. The SNAP team decided to have an acceptable margin of error as +/- 10% of both the enrollment number and eligible number. Therefore, if the difference between enrolled households and eligible households was within the sum total of 10% in either direction of the eligible and enrolled values, the census tract was deemed to be in the acceptable margin of error.
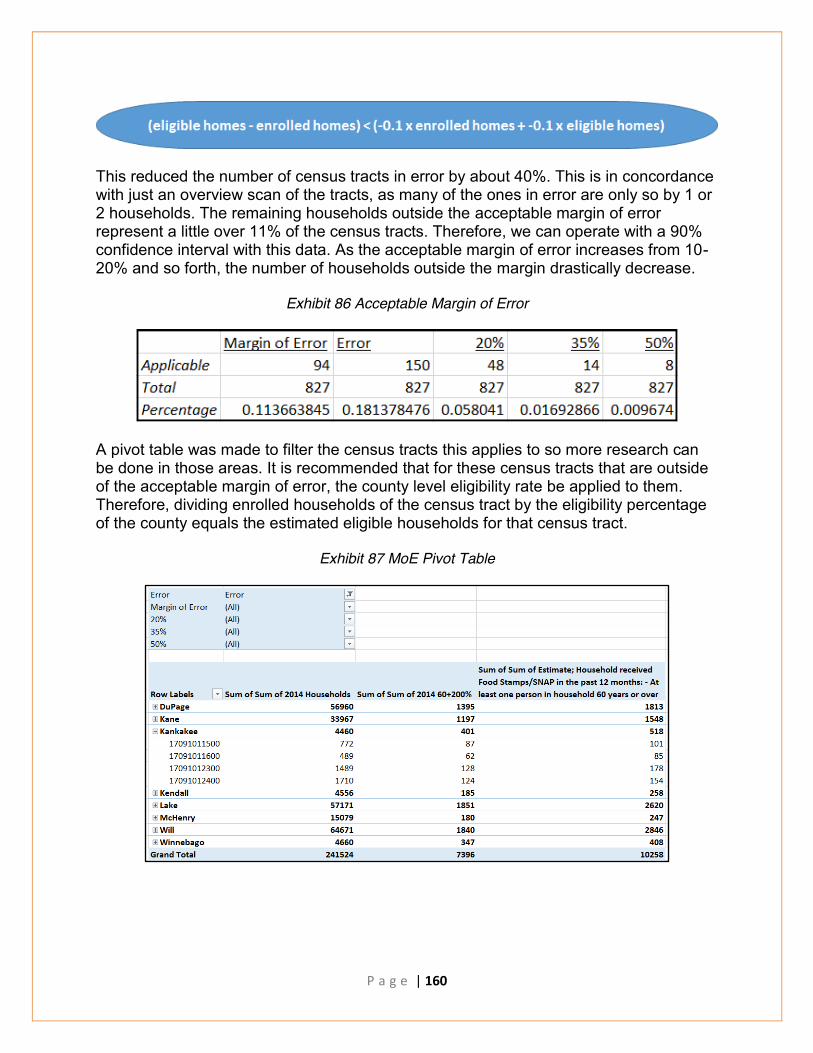
P a g e | 160
This reduced the number of census tracts in error by about 40%. This is in concordance with just an overview scan of the tracts, as many of the ones in error are only so by 1 or 2 households. The remaining households outside the acceptable margin of error represent a little over 11% of the census tracts. Therefore, we can operate with a 90% confidence interval with this data. As the acceptable margin of error increases from 10-20% and so forth, the number of households outside the margin drastically decrease.
Exhibit 86 Acceptable Margin of Error
A pivot table was made to filter the census tracts this applies to so more research can be done in those areas. It is recommended that for these census tracts that are outside of the acceptable margin of error, the county level eligibility rate be applied to them. Therefore, dividing enrolled households of the census tract by the eligibility percentage of the county equals the estimated eligible households for that census tract.
Exhibit 87 MoE Pivot Table
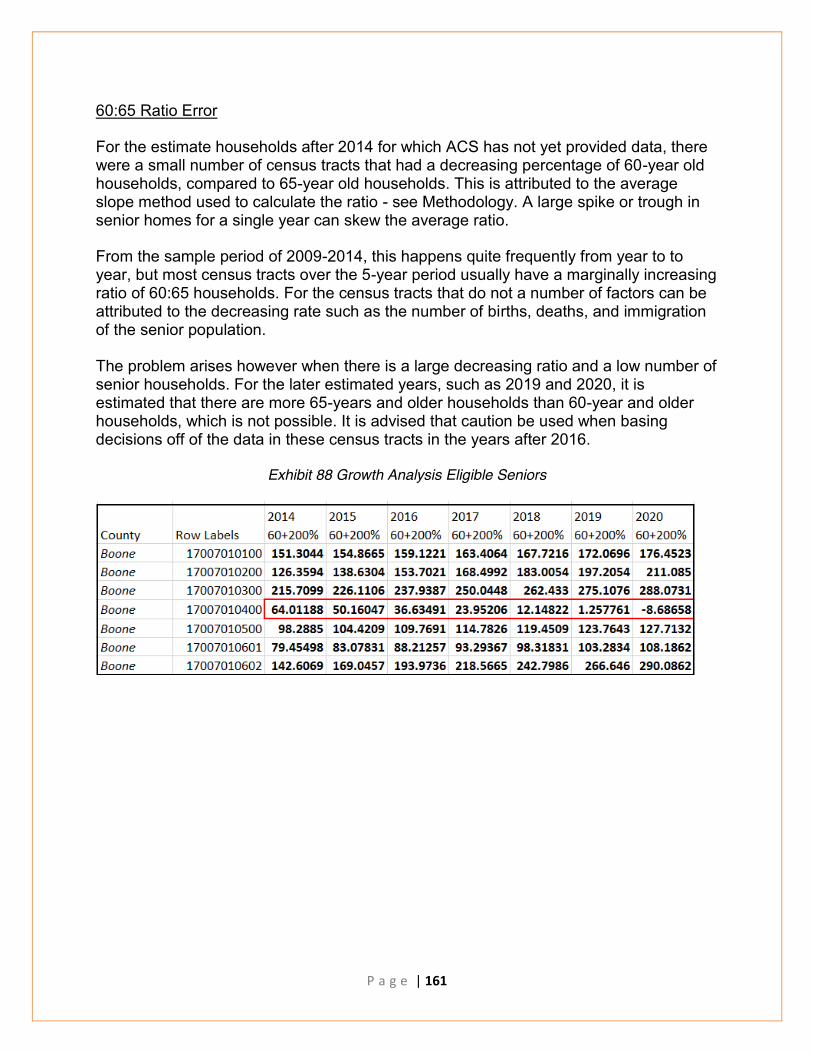
P a g e | 161
60:65 Ratio Error For the estimate households after 2014 for which ACS has not yet provided data, there were a small number of census tracts that had a decreasing percentage of 60-year old households, compared to 65-year old households. This is attributed to the average slope method used to calculate the ratio - see Methodology. A large spike or trough in senior homes for a single year can skew the average ratio. From the sample period of 2009-2014, this happens quite frequently from year to to year, but most census tracts over the 5-year period usually have a marginally increasing ratio of 60:65 households. For the census tracts that do not a number of factors can be attributed to the decreasing rate such as the number of births, deaths, and immigration of the senior population. The problem arises however when there is a large decreasing ratio and a low number of senior households. For the later estimated years, such as 2019 and 2020, it is estimated that there are more 65-years and older households than 60-year and older households, which is not possible. It is advised that caution be used when basing decisions off of the data in these census tracts in the years after 2016.
Exhibit 88 Growth Analysis Eligible Seniors

P a g e | 162
Recommendations Concentrate on new areas of seniors As shown in the heat maps, the areas of need have changed from the Phase I to Phase II reports. Northern Illinois Food Bank outreach for regional managers should focus on areas of highest need- whether that be tracts with highest percentages of households that lack enrollment, or tracts with highest number of households that lack enrollment. Update Information The estimates calculated in this portion of the ELC project are only as good as the numbers input into the various equations. Since it is on the verge of 2017 and the most recent year of ACS data was 2014, some caution should be used when applying the data. If the 2014 accurate data is used, realize that the final number of senior households at 200% poverty level will have changed over the last three years. If the 2017 data is used, realize that the base numbers used to calculate number of senior households at 200% poverty level are estimates. Continuously updating the source information as it comes out from ACS is critical to having the most reliable numbers to work with to properly allocate resources to the areas in need.

P a g e | 163
APPENDIX B3: DATA DISPARITY ANOMOLY
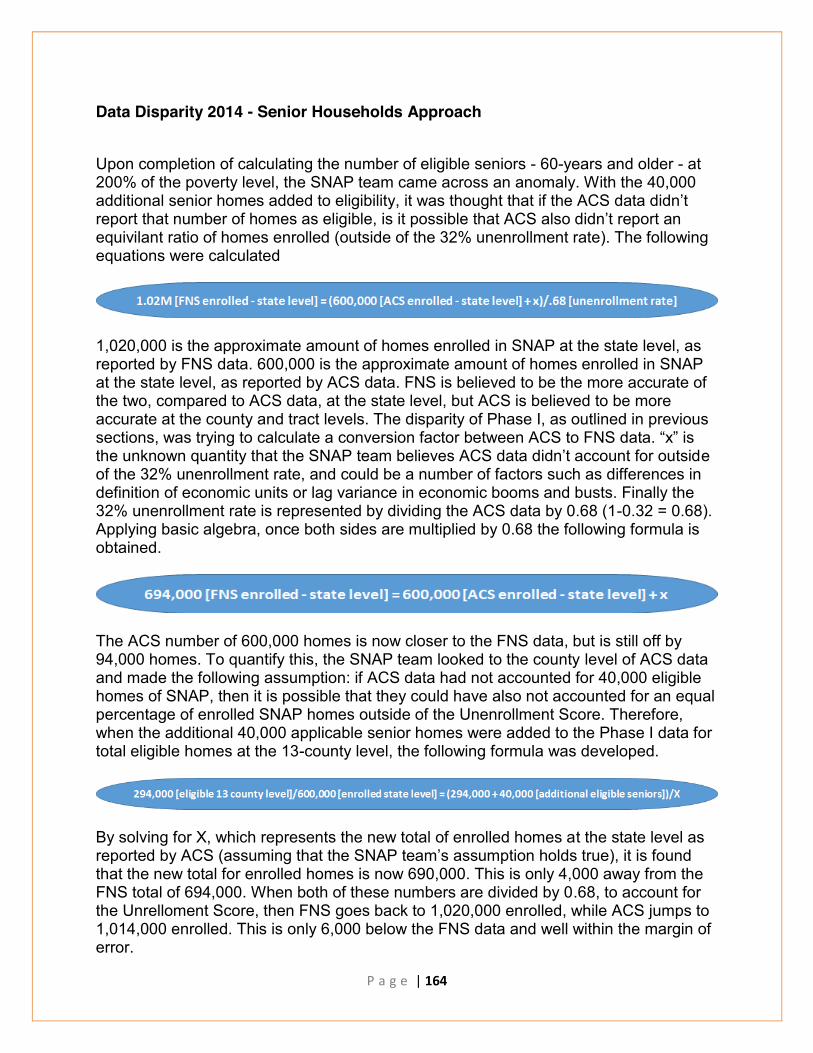
P a g e | 164
Data Disparity 2014 - Senior Households Approach
Upon completion of calculating the number of eligible seniors - 60-years and older - at 200% of the poverty level, the SNAP team came across an anomaly. With the 40,000 additional senior homes added to eligibility, it was thought that if the ACS data didn’t report that number of homes as eligible, is it possible that ACS also didn’t report an equivilant ratio of homes enrolled (outside of the 32% unenrollment rate). The following equations were calculated
1,020,000 is the approximate amount of homes enrolled in SNAP at the state level, as reported by FNS data. 600,000 is the approximate amount of homes enrolled in SNAP at the state level, as reported by ACS data. FNS is believed to be the more accurate of the two, compared to ACS data, at the state level, but ACS is believed to be more accurate at the county and tract levels. The disparity of Phase I, as outlined in previous sections, was trying to calculate a conversion factor between ACS to FNS data. “x” is the unknown quantity that the SNAP team believes ACS data didn’t account for outside of the 32% unenrollment rate, and could be a number of factors such as differences in definition of economic units or lag variance in economic booms and busts. Finally the 32% unenrollment rate is represented by dividing the ACS data by 0.68 (1-0.32 = 0.68). Applying basic algebra, once both sides are multiplied by 0.68 the following formula is obtained.
The ACS number of 600,000 homes is now closer to the FNS data, but is still off by 94,000 homes. To quantify this, the SNAP team looked to the county level of ACS data and made the following assumption: if ACS data had not accounted for 40,000 eligible homes of SNAP, then it is possible that they could have also not accounted for an equal percentage of enrolled SNAP homes outside of the Unenrollment Score. Therefore, when the additional 40,000 applicable senior homes were added to the Phase I data for total eligible homes at the 13-county level, the following formula was developed.
By solving for X, which represents the new total of enrolled homes at the state level as reported by ACS (assuming that the SNAP team’s assumption holds true), it is found that the new total for enrolled homes is now 690,000. This is only 4,000 away from the FNS total of 694,000. When both of these numbers are divided by 0.68, to account for the Unrelloment Score, then FNS goes back to 1,020,000 enrolled, while ACS jumps to 1,014,000 enrolled. This is only 6,000 below the FNS data and well within the margin of error.

P a g e | 165
Reasons For The final number of 1,014,000 enrolled homes as reported by ACS data is now only 6,000 homes away from the FNS data which is well within the margin of error. It is therefore viewed as unlikely that the two numbers could be so close after going through the math, without the assumption being correct - that there is a correlation between eligible and enrolled households. It is somewhat logical to assume that if ACS does not report on a certain number of eligible homes for a certain demographic, then they are liable to not report on a similar ratio of enrolled homes. After all, most statistics are in agreement with what the enrollment rate of Illinois is, but the actual numbers of enrolled to eligible differ depending on which study is chosen.
Reasons Against The assumption that the formula above was based on purported that the enrollment rate remains constant - that if eligible homes went up than the number of enrollment homes would go up as well and would be chalked up to reporting error. However, for the demographic - seniors - that increased eligible homes, ACS was already accurately reporting the 200% poverty level qualifier. What the research found in the Senior section was the enrollment rate actually went down for seniors. Therefore, it can be stated that there is error in assuming the enrollment rate remains constant. It would in fact be better if the formula was comparing enrolled households at the 13-county level to enrolled households at the state level, instead of eligible households at the 13-county level to enrolled households at the state level. Enrolled to enrolled is simply a better comparison than eligible to enrolled because of the previously mentioned unknown assumption of whether the enrollment rate remains constant or not. This correlation computed could just be a statistical anomaly and not actual causation. For example, a long-known statistic that has been taught to statisticians is that homicides increase increase at roughly the same rate as ice cream sales increase. This does not mean that ice cream sales cause murder, nor that the two statistics are even related to each other. It is just a statistical phenomenon. The 1,014,000 ACS enrolled value matching the 1,020,000 FNS enrolled value could be a similar phenomenon. Recommendation To justify the assumption used above, additional research is needed. The past years of ACS data need to be examined to determine the eligible senior households that were not accounted for in the survey at the 13-county level, then applied to the formulas above to see if there is or is not a relationship between ACS underreporting eligible and enrolled homes, or just eligible homes. If there is a correlation - the ACS data matches with the FNS data for a consecutive number of years at the state level - then the assumption is justified. If not, then this 2014 anomaly is just that, an anomaly.

P a g e | 166
SNAP Bibliography
“2010 Census Data for Kankakee County, Illinois.” http://www.co.kankakee.il.us/files/committees/ a kankakee_county_census_data.pdf.
“Census Tract, Illinois.” USBoundary, JSL, LLC, 2016. http://www.usboundary.com/Areas/Census%20Tract/Illinois. Accessed 27 Nov. 2016.
Coryat, John. “Zip Code Boundary Maps for all US States and Possessions.” Zip Map, USNaviguide, 2015. http://www.zipmap.net/. Accessed 27 Nov. 2016. Harris, Benjamin Cerf, Within and Across County Variation in SNAP Misreporting: Evidence from Linked ACS and Administrative Records. U.S. Census Bureau, a Washington, D.C., 2014. Illinois: 1384 Zip Codes. Sperling’s Best Places, 2016. http://www.bestplaces.net/find/zip.aspx?st=IL. Accessed 27 Nov. 2016. “Illinois ZIP Codes.” Zip-Codes.com, Datasheer, L.L.C.,2016. https://www.zip-codes.com/state/il.asp. Accessed 27 NOV. 2016.
Jacobson, Kristi & L. Silverbush (Directors and Producers). (2012). A Place at the Table [DVD]. United States: Magnolia Home Entertainment.
List of American Zip Codes, USA. Zip Codes To Go, 2016. http://www.zipcodestogo.com/. Accessed 27 Nov. 2016
List of Counties in Illinois. Zillow, 2016. www.zillow.com/browse/homes/il. Accessed 27 Nov. 2016.
Meyer, Bruce D. and Robert M. Goerge, Errors in Survey Reporting and Imputation and Their Effects on Estimates of Food Stamp Program Participation. University of Chicago, 2011. Northern Illinois University. (2016). Northern Illinois Food Bank Opportunity Analysis. DeKalb, IL: Agnew, Rob, et al. US Boundary. US Boundary, 2016. http://www.usboundary.com/Areas/Census%20Tract/Illinois. Accessed 27 Nov. 2016.

P a g e | 167
APPENDIX C: BUSINESS CASE

P a g e | 168
This is a contract made between Northern Illinois University Experiential Learning Center (ELC) team, Northern Illinois Food Bank client, Jennifer Lamplough, and Team coach, Barbara Fox, to establish the goals and objectives of the project. The Client must be included in the development of the Business Case to determine the expectations of the essential project elements. The expectations will provide the basis for evaluating the success of the project’s outcome. The signatures of the Client and Team Coach signify the acceptance of the Business Case.
Background
The NIU College of Business Experiential Learning Center connects teams of the very best students with organizations to work on real-world business issues. Over the course of a 16-week collaboration, NIU students apply their energy and talents to help solve cross-functional business issues.
Northern Illinois Food Bank is the source of nutritious food, innovative feeding programs, and hope for more than 71,000 people each week. As a nonprofit organization with a goal of solving hunger within a 13-county service area, Northern Illinois Food Bank relies on community partners (local food pantries and feeding programs, food manufacturers and retailers, companies, foundations and individuals) who share a vision for no one to be hungry in northern Illinois.
Northern Illinois Food Bank’s Mission: Leading the northern Illinois community in solving hunger by providing nutritious meals to those in need through innovative programs and partnerships.
In the 13-county service area of Northern Illinois Food Bank, there are 195,680 children at risk of hunger (Feeding America Map the Meal Gap 2015). Currently, Northern Illinois Food Bank is reaching less than 5% of those children to provide after-school or summer meals. Also, Congress is currently reviewing the Child Nutrition Reauthorization Act and considering lowering the eligibility for the CACFP and SFSP programs in schools or communities from 50% to 40% for children eligible for free and reduced meals. This will open up new areas of eligibility and increase the number of children eligible.
MOV (Measurable Organizational Value)
The ELC team will collect research through online databases, other academic sources and the data provided by Northern Illinois Food Bank. The team’s intent is to help Northern Illinois Food Bank reach out and increase the number of meals served to those in need by locating partners and agencies that may be eligible to provide CACFP and SFSP programs in underserved areas, and prioritizing locations with households eligible for the SNAP program. It will also develop communications materials to support this effort.

P a g e | 169
A formal written report will be provided, consisting of an opportunity analysis for CACFP, SFSP and SNAP expansion in the Northern Illinois Food Bank service area.
Overall Objectives
Identify areas where Northern Illinois Food Bank can reach additional children and families who could benefit from federally funded programs for food assistance. The ELC team will provide:
● An opportunity analysis for CACFP, SFSP and SNAP outreach in the 13-county service area for each program
● A list of areas and specific sites where there is potential in partnering with the Food Bank for afterschool and summer meals
● A list of areas and specific sites where the Food Bank could provide SNAP information and assistance
Scope
Within the time frame, resources and ultimately our desire to meet up with the expectations of our client, the ELC team will:
● Research within 13 county service area ● Conduct research based on government regulations as of January 1, 2016 ● Provide a final written report and presentation to the client at the end of the
semester ● Finalize project by December 2nd, end of Fall 16 semester
The scope of the project will not include:
● Communication and negotiation with target families, schools, organizations

P a g e | 170
Human Resources
Name Title Role Anticipated Time Commitment
Barb Fox Coach Project Management N/A
Carson Schwaller
Assistant Coach Project Management N/A
Ian Livingston SNAP Consultant
Technology Liaison 135 hours
Rebecca Wiebenga
CNP Consultant External Communication (CNP)
135 hours
Collin Plumb CNP Consultant External Communication (CNP)
135 hours
Emma Ray SNAP Consultant
Floater 135 hours
Amanda Mapes SNAP Consultant
Floater 135 hours
Danny Zabratanski
SNAP Consultant
External Communication (SNAP)
135 hours
Nimi Patel CNP Consultant Internal Communication 135 hours
Kaia Keefe-Oates
Feeding America, Child Hunger Core Member
Needs Assessment for Children’s Programs (Northern Illinois Food Bank)
N/A

P a g e | 171
Responsibilities
The Team is responsible for the following deliverables:
● Child Nutrition Programs (CNP) Summer – Summer Food Service Program (SFSP), and
After school – Child and Adult Care Food Service Program (CACFP)
● Identify geographic areas where new summer or afterschool sites may be added
○ Review and understand USDA CNP requirements documented in the Northern Illinois Food Bank-ELC Phase I Team Standard Operating Procedures
○ Identify existing programs that could be served by the USDA meals programs
○ Identify organizations that could provide new programs where meals could be served (all counties, Will County in particular)
○ Identify locations where children may gather and meals could be served
● Develop Northern Illinois Food Bank outreach materials “Toolkit” ○ Potential sites who may be interested – to understand what the
program is about ○ Instructions on how to become a site
● Identify additional potential partnerships/agencies/”champions” ● Supplemental Nutrition Assistance Program (SNAP)
○ SNAP Needs Assessment Profile ■ Database content – additional research
● Seniors – compute additional estimates for populations ○ Ages 60 (SNAP) vs. 65 (US Census) ○ At Federal Poverty Level (FPL) up to 200% threshold
● Correlations review, etc. ■ Database content and utility improvements
● Review correlations ● Improve/streamline the complex database by understanding
how SNAP Outreach Manager plans to use the data for analysis, reporting and prioritizing locations in need
● Build in utility columns for documentation/comments by user ■ Operational reports
● Develop user-friendly report for region SNAP field personnel to use and provide staff with information to direct their visit efforts without having to use the entire database

P a g e | 172
● Provide a mapping tool to facilitate efficient location identification and travel plans (tracts/city/county)
● Conduct pilot testing with primary users to get feedback and include recommendations
■ Finish heat maps ○ Refine served/under-served meals assumptions and computations
■ Review data disparity research and meals computations from Phase I
■ Review disparity categories and determine if specific items can be identified and quantified in order to include meaningful assumptions and adjustments to the calculation
■ Determine if there is an appropriate rationale that may be developed and applied to provide reliable assumptions to efficiently convert between the SNAP Needs Assessment Profile and SNAP-based meals calculator to determine served and underserved meals
■ Conduct additional research as needed to update data and research from Phase I
○ Provide a direct mail zip code list and map for all census tracts in the 13-county Northern Illinois Food Bank territory for a planned 2017 release
The Client is responsible for:
● Establishing project deliverables for the ELC team ● Providing data and necessary information that can help the ELC team to identify
their needs ● Granting the ELC team access to facilities and sites ● Providing volunteer opportunities ● Attending conference calls as needed ● Attending the mid-semester and final presentation
Resource Requirements (people, equipment, etc.)
● Northern Illinois Food Bank Sponsor Team ● Kaia Keefe-Oates - CNP ● NIU ELC Northern Illinois Food Bank Phase I report ● Data/Information ● Internet/Library ● NIU librarian Wayne Finley - Research assistance ● Technology

P a g e | 173
Assumptions
● The data and information provided by Northern Illinois Food Bank is accurate ● The scope has been accurately described ● The sponsor will provide timely feedback ● Resources from the sponsor will be available in a timely manner ● There are no major changes in the CACFP, SFSP, and SNAP programs ● NIU ELC Northern Illinois Food Bank Phase I report is a valid resource and the
assumptions will be used as a platform for Phase II assumptions
Constraints
● Limited project timeline ● Consultants’ background in the Food Bank Industry ● Data sources ● Data disparity (SNAP and Census data) ● Research experience
Risk Analysis
The ELC team developed a Team Charter to manage primary issues, other issues that may arise are:
● Inaccurate interpretation of data/information ● Health risks ● Government regulation/compliance/guidelines changes ● Unforeseen circumstances as bad weather, catastrophic events
Conclusion /Value
The results of the ELC project will help Northern Illinois Food Bank reach more hungry children with nutritious meals and enable more families to gain access to nutritious food through SNAP benefits. The ELC team will focus on the identified counties and provide a report for Northern Illinois Food Bank. In the long term this will help Northern Illinois Food Bank towards its strategic goal of providing 75 million meals annually to meet the meal gap and ensure every meal, every day for every hunger neighbor.
The ELC team will work closely with Northern Illinois Food Bank, NIU faculty, etc., to look into the details of the programs. Additionally, the team will take full advantage of available resources and find out the most efficient techniques to solve certain problems on the way. Since the ELC team consists of committed team members with diversified

P a g e | 174
backgrounds, the team will provide new insights into current situations and innovative ideas to help Northern Illinois Food Bank meet its goals.
Important Dates to Remember
● August 26, 2016: Client Meeting in Geneva at Northern Illinois Food Bank Headquarters, 10:00AM-Noon
● September 7, 2016: Kaia visits ELC at NIU, 3:30PM ● September 30, 2016: Workshop for ELC team, 10:00AM-Noon ● October 10, 2016: Mid-semester Debrief at NIU, 4:00-5:00PM ● November 21, 2016: Practice presentation with Joan at NIU ELC ● November 30, 2016: Presentation practice in Geneva at Northern Illinois Food
Bank Headquarters, 3:30-4:30PM ● December 2, 2016: Final presentation in Geneva at Northern Illinois Food Bank
Headquarters, 10:00AM-Noon