nigel davies practical sustainability profiting from sustainability conference york dec 2014
TRANSCRIPT
Practical SustainabilityBusiness Risk Management
Nigel Davies
Manufacturing & Sustainability Director

What is Sustainability?
WATER
FOOTPRINT ?
ENERGY
USE?
RECYCLING
“Practical Sustainability ......
it’s no afterthought”
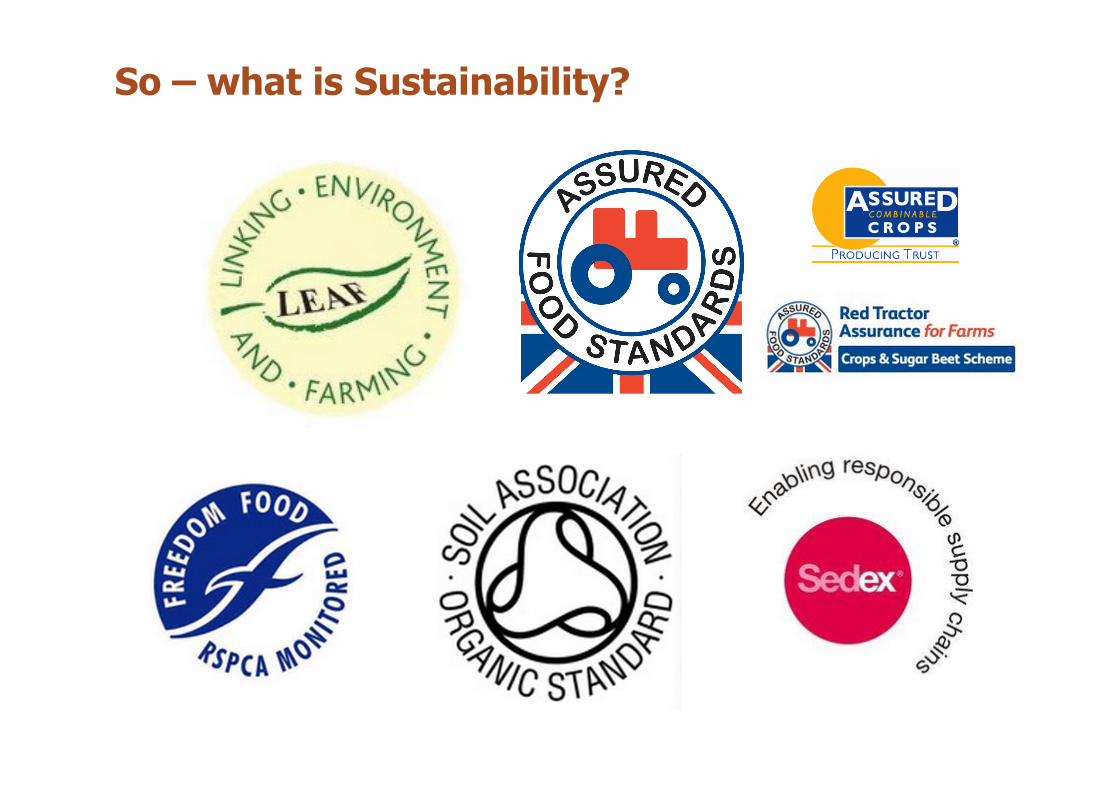
So – what is Sustainability?
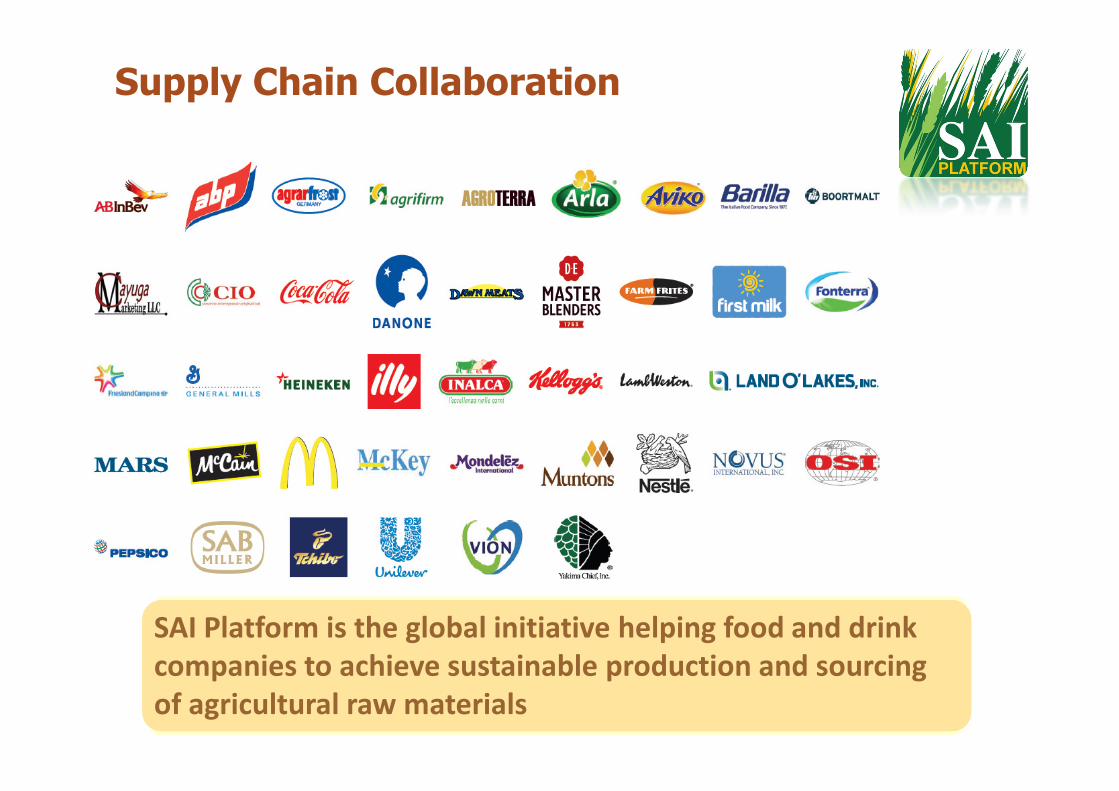
Supply Chain Collaboration
SAI Platform is the global initiative helping food and drink
companies to achieve sustainable production and sourcing
of agricultural raw materials

Farm Sustainability Assessment
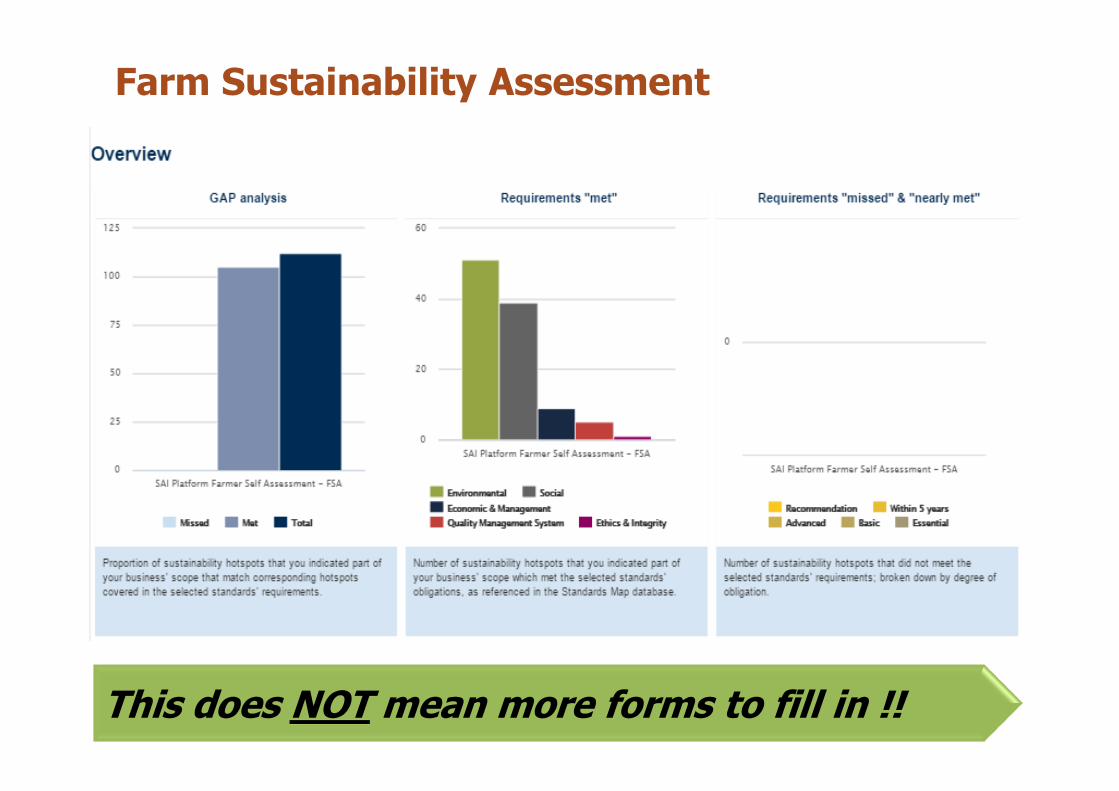
Farm Sustainability Assessment
This does NOT mean more forms to fill in !!

CARBON MANAGEMENT - THE SAFEST BET

CO2 levels of 546-568 parts per million would reduce nutrients in grains and legumes
ZINC IRON PROTEIN
WHEAT 9.3% 5.1% 6.3%
RICE 3.3% 5.2% 7.8%
FIELD PEAS 6.8% 4.1% 2.1%
SOYBEANS 5.1% 4.1% 4.6%
MAIZE / SORGHUM No significant reduction
1/3rdpopulation
already suffer from iron
and zinc shortages,
leading to some 63
million life years being
lost annually
2bn people get at least 70% of their
iron and zinc from
grains and legumes.
Myers et al: Nature (2014) doi:10.1038/nature13179
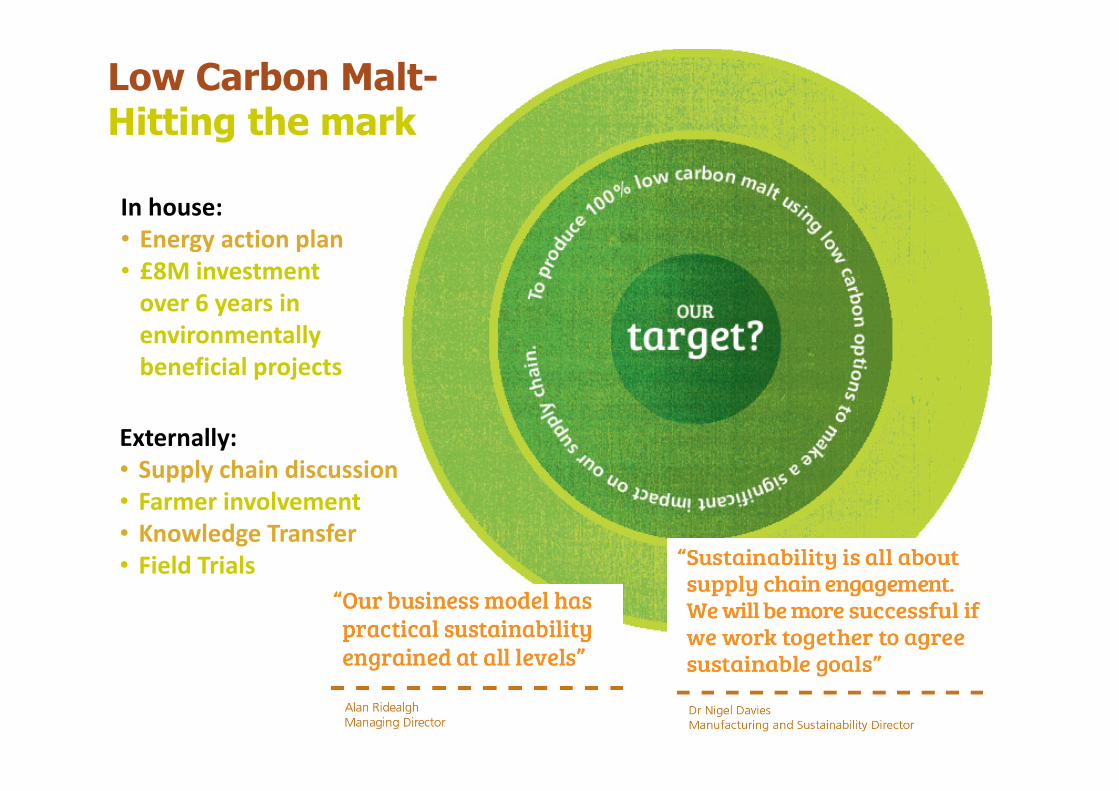
Low Carbon Malt-Hitting the mark
In house:
• Energy action plan
• £8M investment
over 6 years in
environmentally
beneficial projects
Externally:
• Supply chain discussion
• Farmer involvement
• Knowledge Transfer
• Field Trials

Carbon Footprint: Scopes 1-3
Fuel 17%
N2O from
Soil 35%
N fertiliser
48%
Difference
between
models
6%
1,000
1,050
1,100
1,150
1,200
1,250
1,300
1,350
1,400
1,450
2001-2 2002-3 2003-4 2004-5 2005-6 2006-7 2007-8 2008-9 2009-10 2010-11 2011-12 2012-13
kW
h/T
on
ne
Year
Energy used (kWh/to) CCA Target
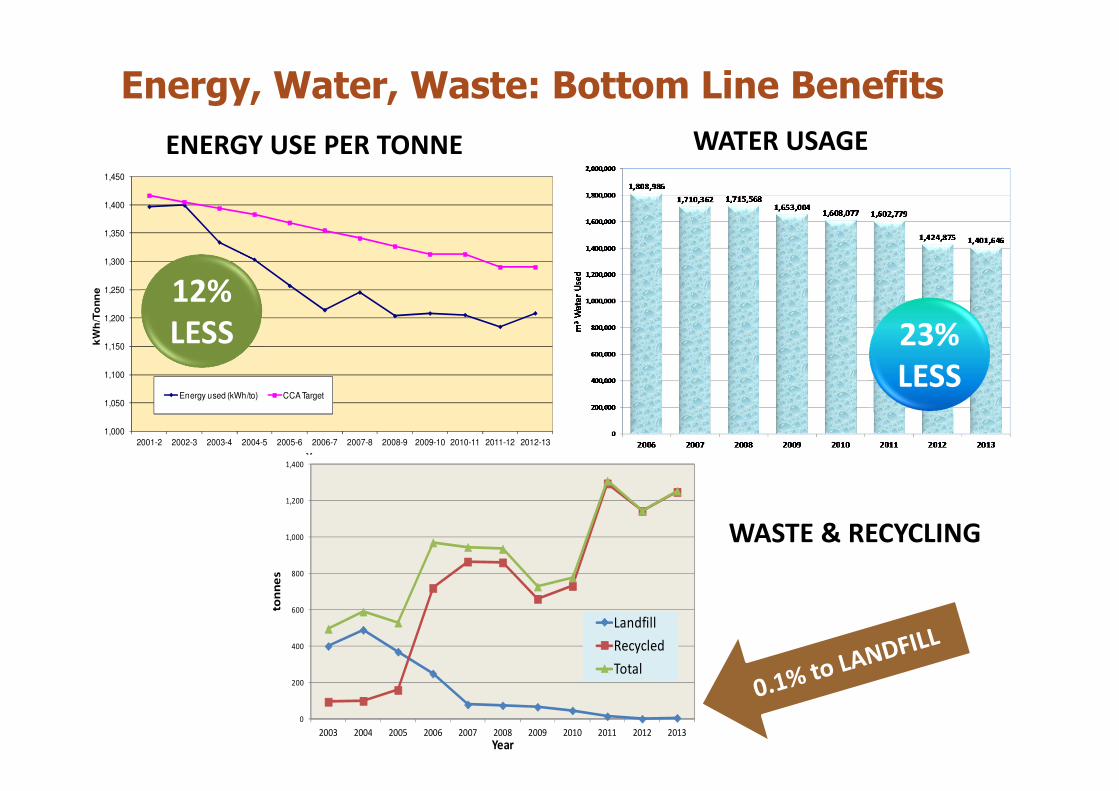
Energy, Water, Waste: Bottom Line Benefits
ENERGY USE PER TONNE WATER USAGE
WASTE & RECYCLING
23%
LESS
12%
LESS
0
200
400
600
800
1,000
1,200
1,400
2003 2004 2005 2006 2007 2008 2009 2010 2011 2012 2013
ton
ne
s
Year
Landfill
Recycled
Total

Energy Investment: Environmental benefits
£4m project to
install new silos
24,000 tonnes
capacity
SAVES: Farmers
installing less
efficient on-farm
drying
SAVES: 1700 vehicle
movements a year:
130 tonnes CO2

Muntons Carbon FootprintTotal is interesting but drill down is of increasing importance
Now express C footprint
PROCESSPRODUCT
SUPPLY CHAIN
ELEMENT
Muntons Carbon FootprintReduced by 18% - How? GREEN ELECTRICITY
GREEN
ELECTRICITY
0.05014
kg CO2/kWh
NORMAL
ELECTRICITY
0.48357
kg CO2/kWh
Electricity source % of supply
Hydro 63.7
On shore wind 23.7
Off shore wind 5.1
Biomass municipal 3.5
Municipal waste 0.2
Solar PV 3.8

Anaerobic Digestion
Total project Cost: £5.5M
Plant Life >25 yrs
….. Sale of Bio-Fertiliser?
Reduced electricity cost: up to 25% at half price
Income from Government Feed-in-Tariffs
Off-site Tankering costs £732,000
£650,000
PAYBACK
4.6 years

How Muntons
are helping
farmers save
money and
reduce the
supply chain
carbon footprint

Influencing Farmers – changing perceptions
85%
15%
Convinced
Uncertain

“Carbon calculators are so hard to use”
“What’s a good value?”

300
290
280
270
260
250
Which areas have the greatest impact?
YIELD
+20%
300
TRACTOR
HOURS -20%CAN
– 20%LOW CARBON
CAN
264
253
205
240
230
220
190
180
170
160
150
210
200
CA
RB
ON
FO
OT
PR
INT
OF
MA
LTIN
G B
AR
LEY
kg
CO
2e
q
Base level
301kg CO2 eq/tonne
Base level
301kg CO2 eq/tonne
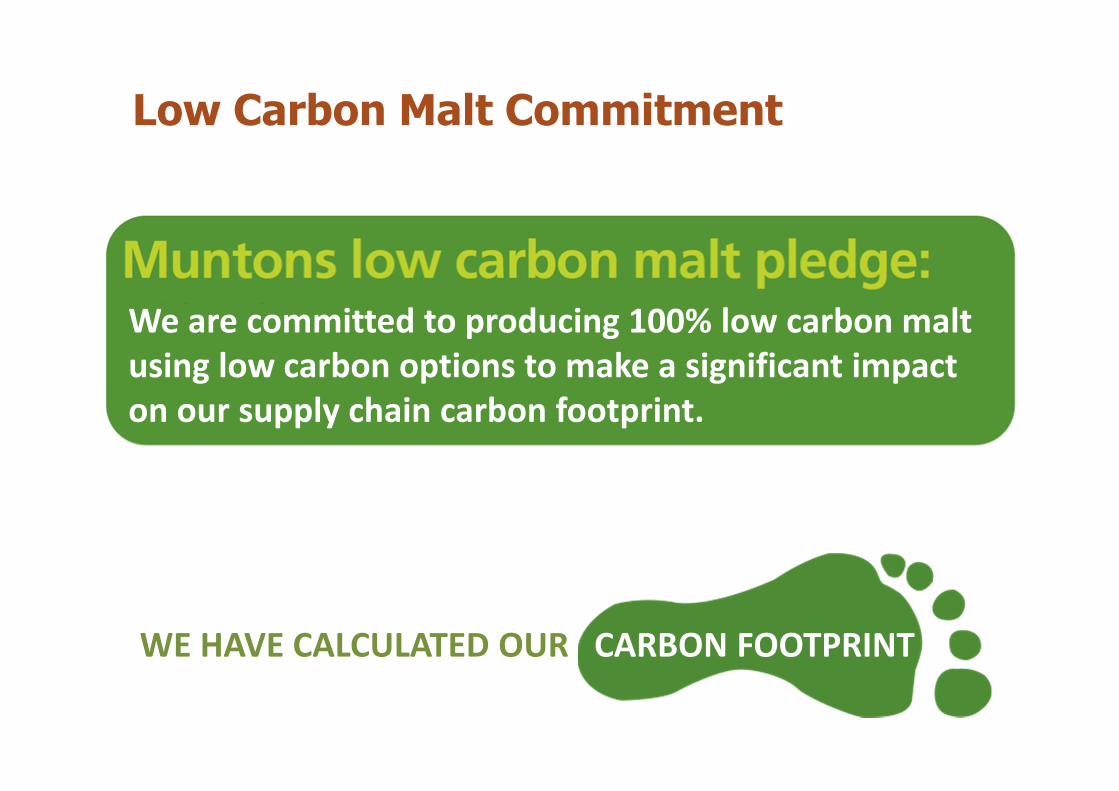
Low Carbon Malt Commitment
WE HAVE CALCULATED OUR CARBON FOOTPRINT
We are committed to producing 100% low carbon malt
using low carbon options to make a significant impact
on our supply chain carbon footprint.
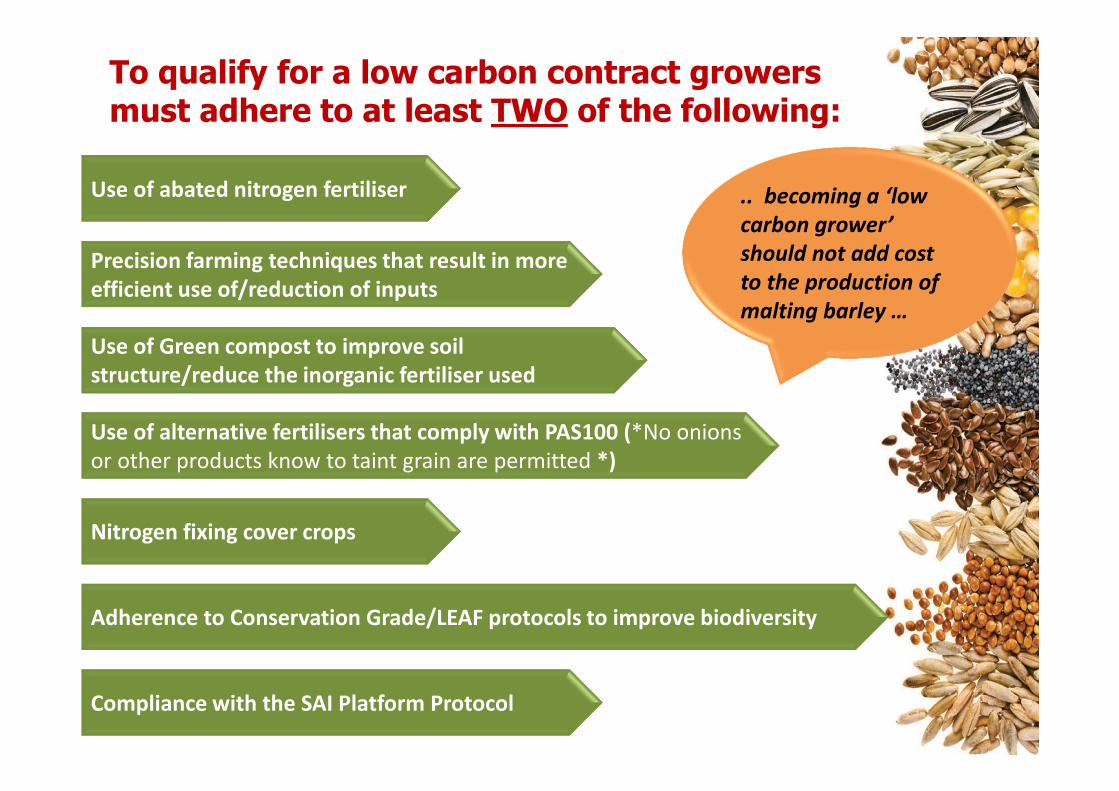
.. becoming a ‘low
carbon grower’
should not add cost
to the production of
malting barley …
Use of abated nitrogen fertiliser
Precision farming techniques that result in more
efficient use of/reduction of inputs
Use of Green compost to improve soil
structure/reduce the inorganic fertiliser used
Use of alternative fertilisers that comply with PAS100 (*No onions
or other products know to taint grain are permitted *)
Nitrogen fixing cover crops
Adherence to Conservation Grade/LEAF protocols to improve biodiversity
Compliance with the SAI Platform Protocol
To qualify for a low carbon contract growers must adhere to at least TWO of the following:

+12%
YIELD
Compost REALLY works – Yorkshire Wolds trial
Better than Winter
Barleys!
“The Compost crops looked excellent right
through from emergence to harvest”
£200
per acre
BENEFIT

Reducing Carbon Footprint of Beer
8-20%reduction in
carbon
footprint of
beer*
Research on the Carbon Footprint of Beer (Beverage Industry Environmental Roundtable, June 2012
http://www.bieroundtable.com/files/Beer%20Final%20DEP.pdf
39%25%
13%13% 4%
1%
6%
Malt Brewing Packaging
Transport Electricity Cooling
Other
50% reduction in
MALT
carbon
footprint
21%14%
48%
9%
3%
1%
4%
BOTTLED
CANNED
* % depends whether canned or bottled and on grist recipe
CARBON FOOTPRINT ANALYSIS
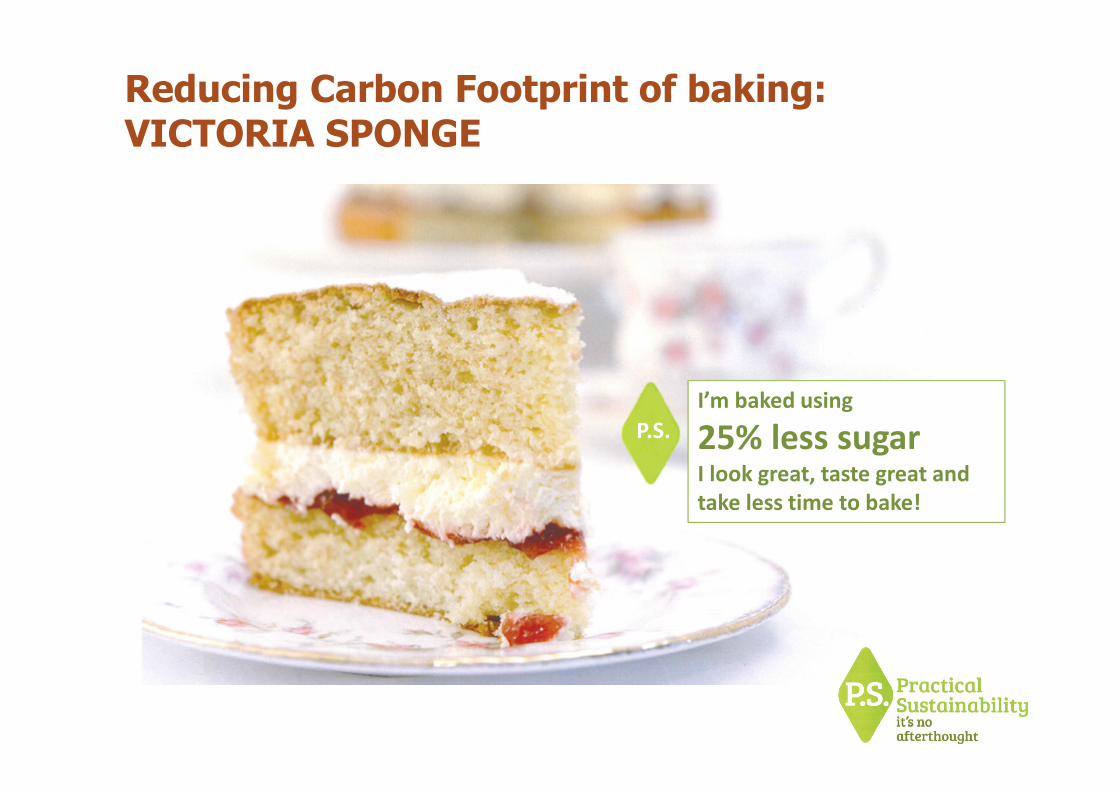
Reducing Carbon Footprint of baking: VICTORIA SPONGE
I’m baked using
25% less sugarI look great, taste great and
take less time to bake!
P.S.

Reducing Carbon Footprint of baking: Cocoa-based muffins
COCOA MALTICHOC

The journey of a thousand miles begins with a single stepConfucius
