nigerian equities weekly - investment one advise medium to long-term investment horizon as market...
TRANSCRIPT
-13.80%
-17.83%
-8.44%
-6.51%
-14.65%
-11.02%
-0.63%
-20%
-15%
-10%
-5%
0%
Economy: During the week, the federal government signalled a slight change
in its plan to fund the 2016 budget deficit with the planned visit of the Finance
Minister to China with a view to open negotiation with China Export-Import Bank
for a $2billion loan facility at concessionary rate of around 1.5%, temporarily
putting the proposed $1bn Euro Bond issuance on hold till March. This move is
part of the government’s strategy to finance its proposed N3tr deficit at the
lowest cost possible with a view to reduce the burden of interest payment.
Given the debt-to-GDP ratio at 11.9% as against 40% threshold set by IMF for
developing countries (according to data from DMO), we believe that the current
debt level is modest. With this said, it is our opinion that the government’s
ability to fund the budget will be enhanced if the facility is granted coupled with
the fact that there is N2.2trillion saving from the TSA account. Hence, we see
this as a positive for the macroeconomic prospect.
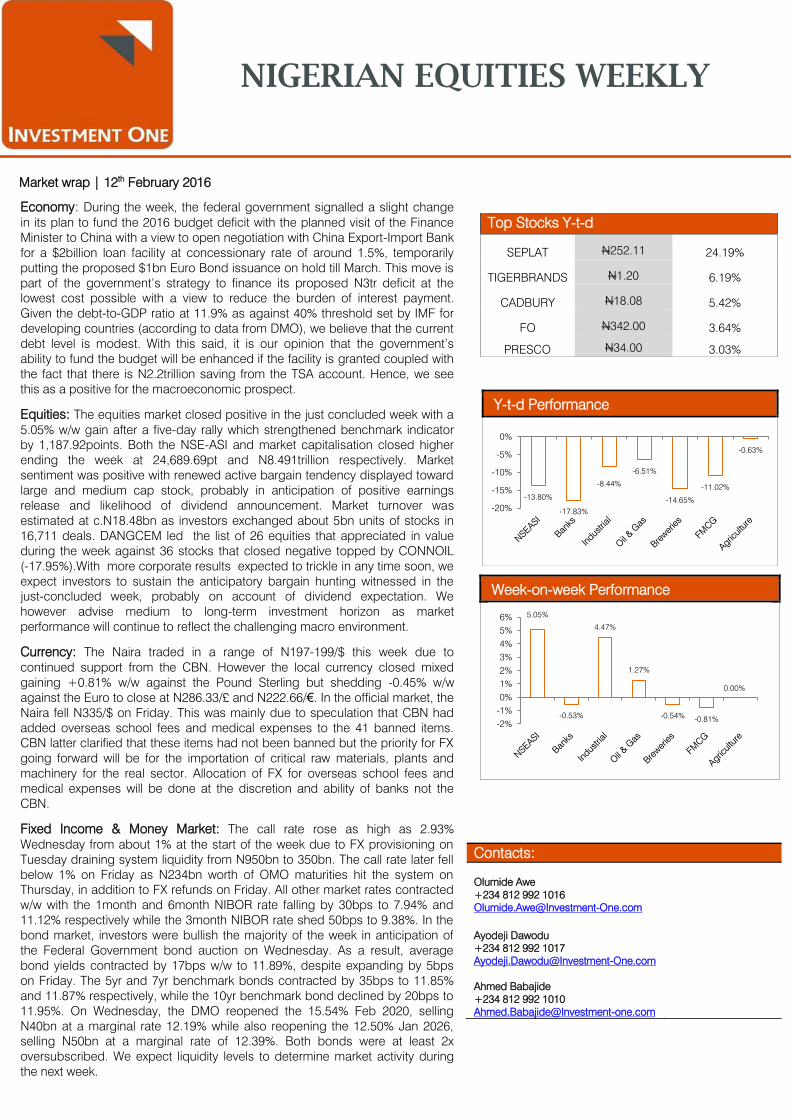
Equities: The equities market closed positive in the just concluded week with a
5.05% w/w gain after a five-day rally which strengthened benchmark indicator
by 1,187.92points. Both the NSE-ASI and market capitalisation closed higher
ending the week at 24,689.69pt and N8.491trillion respectively. Market
sentiment was positive with renewed active bargain tendency displayed toward
large and medium cap stock, probably in anticipation of positive earnings
release and likelihood of dividend announcement. Market turnover was
estimated at c.N18.48bn as investors exchanged about 5bn units of stocks in
16,711 deals. DANGCEM led the list of 26 equities that appreciated in value
during the week against 36 stocks that closed negative topped by CONNOIL
(-17.95%).With more corporate results expected to trickle in any time soon, we
expect investors to sustain the anticipatory bargain hunting witnessed in the
just-concluded week, probably on account of dividend expectation. We
however advise medium to long-term investment horizon as market
performance will continue to reflect the challenging macro environment.
Currency: The Naira traded in a range of N197-199/$ this week due to
continued support from the CBN. However the local currency closed mixed
gaining +0.81% w/w against the Pound Sterling but shedding -0.45% w/w
against the Euro to close at N286.33/£ and N222.66/€. In the official market, the
Naira fell N335/$ on Friday. This was mainly due to speculation that CBN had
added overseas school fees and medical expenses to the 41 banned items.
CBN latter clarified that these items had not been banned but the priority for FX
going forward will be for the importation of critical raw materials, plants and
machinery for the real sector. Allocation of FX for overseas school fees and
medical expenses will be done at the discretion and ability of banks not the
CBN.
Fixed Income & Money Market: The call rate rose as high as 2.93%
Wednesday from about 1% at the start of the week due to FX provisioning on
Tuesday draining system liquidity from N950bn to 350bn. The call rate later fell
below 1% on Friday as N234bn worth of OMO maturities hit the system on
Thursday, in addition to FX refunds on Friday. All other market rates contracted
w/w with the 1month and 6month NIBOR rate falling by 30bps to 7.94% and
11.12% respectively while the 3month NIBOR rate shed 50bps to 9.38%. In the
bond market, investors were bullish the majority of the week in anticipation of
the Federal Government bond auction on Wednesday. As a result, average
bond yields contracted by 17bps w/w to 11.89%, despite expanding by 5bps
on Friday. The 5yr and 7yr benchmark bonds contracted by 35bps to 11.85%
and 11.87% respectively, while the 10yr benchmark bond declined by 20bps to
11.95%. On Wednesday, the DMO reopened the 15.54% Feb 2020, selling
N40bn at a marginal rate 12.19% while also reopening the 12.50% Jan 2026,
selling N50bn at a marginal rate of 12.39%. Both bonds were at least 2x
oversubscribed. We expect liquidity levels to determine market activity during
the next week.
Top Stocks Y-t-d
SEPLAT N252.11 24.19%
TIGERBRANDS N1.20 6.19%
CADBURY N18.08 5.42%
FO N342.00 3.64%
PRESCO N34.00 3.03%
Y-t-d Performance
Week-on-week Performance
Contacts:
Olumide Awe
+234 812 992 1016
Ayodeji Dawodu
+234 812 992 1017
Ahmed Babajide
+234 812 992 1010
5.05%
-0.53%
4.47%
1.27%
-0.54% -0.81%
0.00%
-2%
-1%
0%
1%
2%
3%
4%
5%
6%
NIGERIAN EQUITIES WEEKLY
Market wrap | 12th
February 2016
2
0.0
2.0
4.0
6.0
8.0
10.0
P/E P/BV
0.74%
-1.01%
3.50% 3.19%
-4.91% -6%
-4%
-2%
0%
2%
4%
WoW Return
-15.46%
-23.39%
-8.97%
-13.91% -13.17%
-32.00%
-24.00%
-16.00%
-8.00%
0.00%
YTD Return
Banking sector
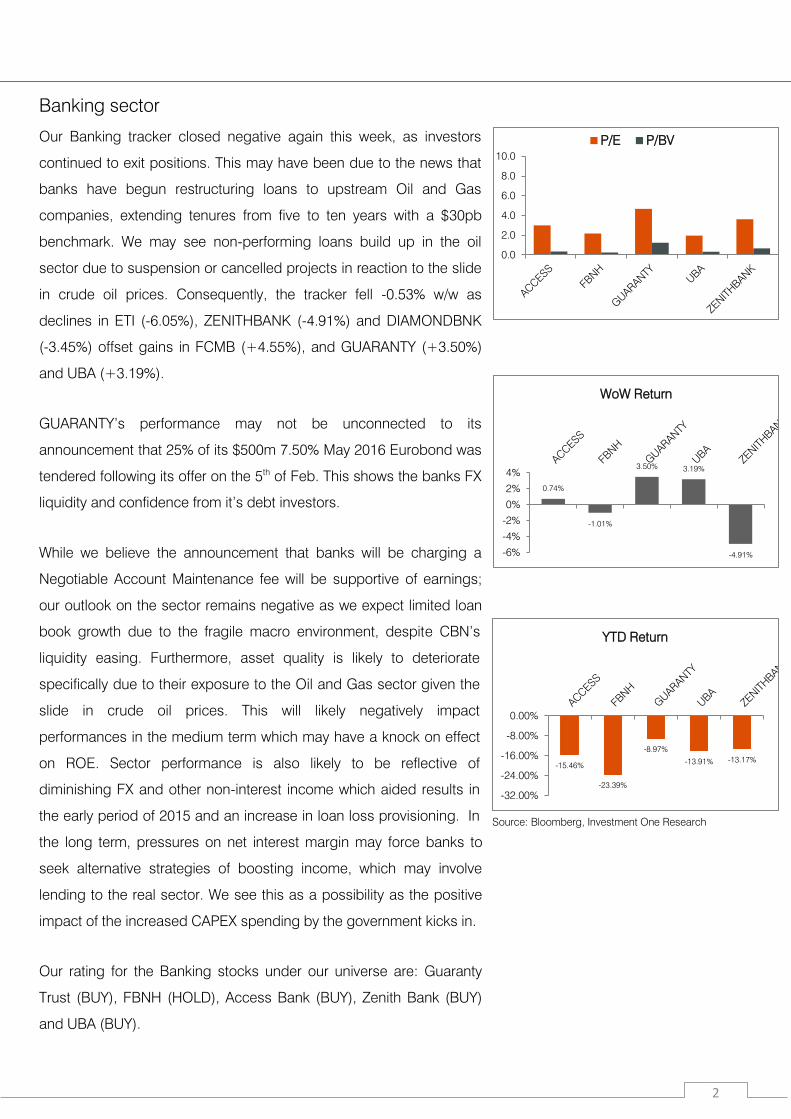
Our Banking tracker closed negative again this week, as investors
continued to exit positions. This may have been due to the news that
banks have begun restructuring loans to upstream Oil and Gas
companies, extending tenures from five to ten years with a $30pb
benchmark. We may see non-performing loans build up in the oil
sector due to suspension or cancelled projects in reaction to the slide
in crude oil prices. Consequently, the tracker fell -0.53% w/w as
declines in ETI (-6.05%), ZENITHBANK (-4.91%) and DIAMONDBNK
(-3.45%) offset gains in FCMB (+4.55%), and GUARANTY (+3.50%)
and UBA (+3.19%).
GUARANTY’s performance may not be unconnected to its
announcement that 25% of its $500m 7.50% May 2016 Eurobond was
tendered following its offer on the 5th
of Feb. This shows the banks FX
liquidity and confidence from it’s debt investors.
While we believe the announcement that banks will be charging a
Negotiable Account Maintenance fee will be supportive of earnings;
our outlook on the sector remains negative as we expect limited loan
book growth due to the fragile macro environment, despite CBN’s
liquidity easing. Furthermore, asset quality is likely to deteriorate
specifically due to their exposure to the Oil and Gas sector given the
slide in crude oil prices. This will likely negatively impact
performances in the medium term which may have a knock on effect
on ROE. Sector performance is also likely to be reflective of
diminishing FX and other non-interest income which aided results in
the early period of 2015 and an increase in loan loss provisioning. In
the long term, pressures on net interest margin may force banks to
seek alternative strategies of boosting income, which may involve
lending to the real sector. We see this as a possibility as the positive
impact of the increased CAPEX spending by the government kicks in.
Our rating for the Banking stocks under our universe are: Guaranty
Trust (BUY), FBNH (HOLD), Access Bank (BUY), Zenith Bank (BUY)
and UBA (BUY).
Source: Bloomberg, Investment One Research

3
0
20
40
P/E P/BV
14.00%
8.11%
-0.26%
0.00%
3.75%
-10%
0%
10%
20%
FO MOBIL OANDO TOTAL SEPLAT
WoW Return
3.64%
-0.25%
-35.93%
-4.77%
-10% -11%
-2%
-11%
-40.00%
0.00%
40.00%
FO
MO
BIL
OA
ND
O
TO
TA
L
Gru
pa
Lo
to
s
Hin
du
sta
n
Pe
t. C
orp
Sh
ell
Om
an
Tu
rca
s P
etro
l
YTD Return
Oil & Gas sector
The Oil and Gas tracker gained +1.27% w/w following the +1.55%
appreciation last week as Brent crude oil prices remained firmly above
$30pb. This performance was driven by FO (+14.00%) which
announced on Tuesday that it had joined the United Nations Compact
corporate responsibility initiative. There were also price appreciations
in MOBIL (+8.11%) and SEPLAT (+3.75%) while there were
significant sell offs in CONOIL (-17.95%).
The CBN’s FX management regime has led to marketers owing a total
sum of $1.29bn to foreign suppliers and such are blacklisted for
further orders. This led to the decision by the Petroleum Products
Pricing Regulatory Agency to allocate 78% of total sector volume,
3.1m metric tons of petrol import in Q1 2016, to the NNPC as
independent marketers were unable to meet their import volume
quota. This is likely to offset the gains from changes made to the PMS
pricing template, which increased retailers’ margin to N5per litre from
N4.60per litre.
The administration stated its primary focus will be on onshore oil
production in terms of investment while trying to reduce the cost of
production from $13pb. This maybe a benefit to upstream players in
the medium term as it could allow them to maintain production
onshore as offshore production, which cost c.$34pb, is unlikely to be
profitable.
On the whole, we reiterate our near term negative outlook on the
space on the back of; declining import quota, falling oil prices,
infrastructure sabotage, oil theft and regulation. However, as long-
drawn efforts to pass the PIB (to be split into two) seem to come to a
head, we see opportunities for investments in the upstream petroleum
sector for the likes of Seplat, FO and OANDO in the medium to longer
term.
Source: Bloomberg, Investment One Research
4
0.0
10.0
20.0
30.0
40.0
P/E P/BV
0.00% 0.00%
0%
20%
40%
60%
80%
100%
OKOMU PRESCO
WoW Return
-4.29%
3.03%
40%
1%
6%
1%
-10%
0%
10%
20%
30%
40%
50%
YTD Return
Agriculture sector
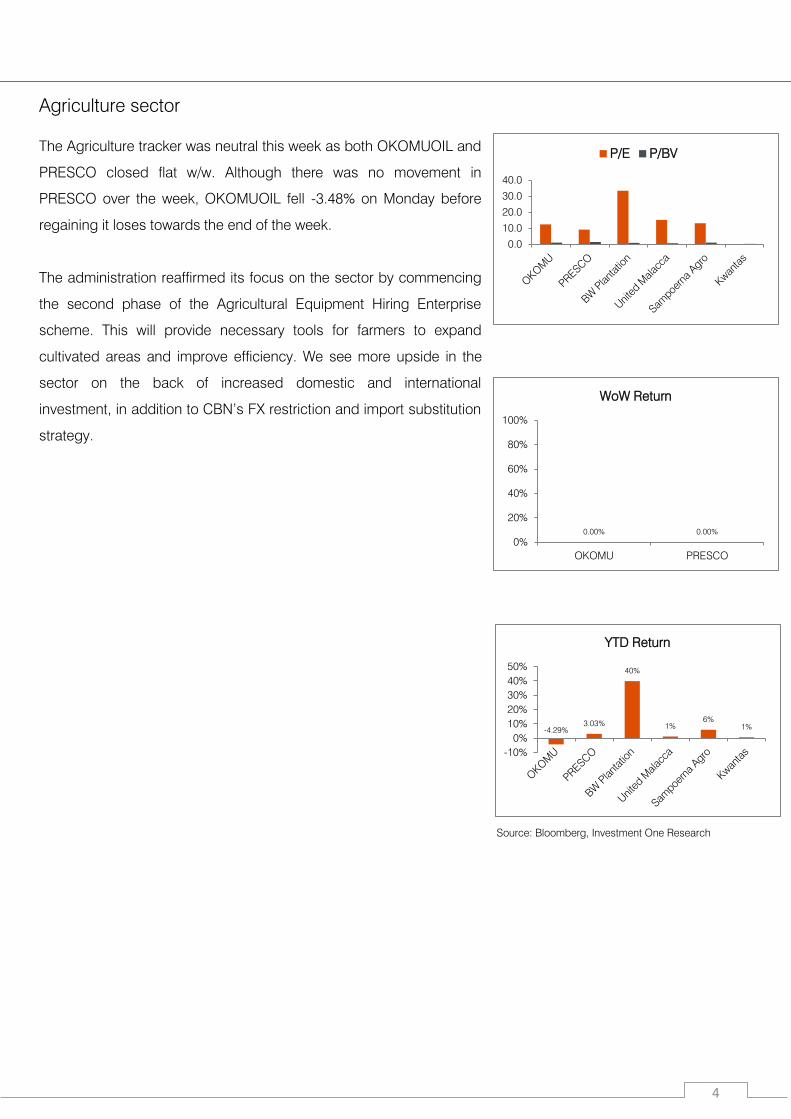
The Agriculture tracker was neutral this week as both OKOMUOIL and
PRESCO closed flat w/w. Although there was no movement in
PRESCO over the week, OKOMUOIL fell -3.48% on Monday before
regaining it loses towards the end of the week.
The administration reaffirmed its focus on the sector by commencing
the second phase of the Agricultural Equipment Hiring Enterprise
scheme. This will provide necessary tools for farmers to expand
cultivated areas and improve efficiency. We see more upside in the
sector on the back of increased domestic and international
investment, in addition to CBN’s FX restriction and import substitution
strategy.
Source: Bloomberg, Investment One Research
5
0
5
10
15
20
25
P/E P/BV
1.41%
-2.48% -3%
-2%
-1%
0%
1%
2%
NB GUINNESS
WoW Return
-28%
-1%
-7%
-11%
2%
-11%
-30%
-20%
-10%
0%
10%
YTD Return
Breweries sector
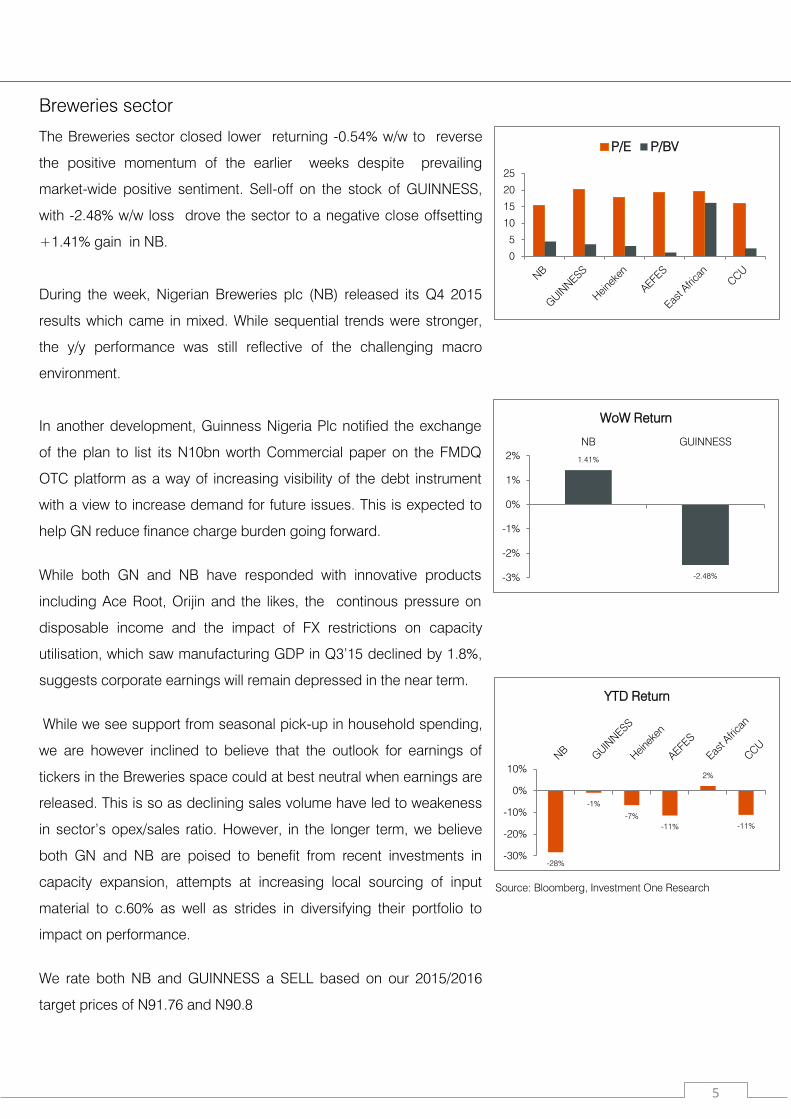
The Breweries sector closed lower returning -0.54% w/w to reverse
the positive momentum of the earlier weeks despite prevailing
market-wide positive sentiment. Sell-off on the stock of GUINNESS,
with -2.48% w/w loss drove the sector to a negative close offsetting
+1.41% gain in NB.
During the week, Nigerian Breweries plc (NB) released its Q4 2015
results which came in mixed. While sequential trends were stronger,
the y/y performance was still reflective of the challenging macro
environment.
In another development, Guinness Nigeria Plc notified the exchange
of the plan to list its N10bn worth Commercial paper on the FMDQ
OTC platform as a way of increasing visibility of the debt instrument
with a view to increase demand for future issues. This is expected to
help GN reduce finance charge burden going forward.
While both GN and NB have responded with innovative products
including Ace Root, Orijin and the likes, the continous pressure on
disposable income and the impact of FX restrictions on capacity
utilisation, which saw manufacturing GDP in Q3’15 declined by 1.8%,
suggests corporate earnings will remain depressed in the near term.
While we see support from seasonal pick-up in household spending,
we are however inclined to believe that the outlook for earnings of
tickers in the Breweries space could at best neutral when earnings are
released. This is so as declining sales volume have led to weakeness
in sector’s opex/sales ratio. However, in the longer term, we believe
both GN and NB are poised to benefit from recent investments in
capacity expansion, attempts at increasing local sourcing of input
material to c.60% as well as strides in diversifying their portfolio to
impact on performance.
We rate both NB and GUINNESS a SELL based on our 2015/2016
target prices of N91.76 and N90.8
Source: Bloomberg, Investment One Research
6
4.78%
-2.67%
0.17%
-2.40%
2.58% 2.05%
-1.14%
-6.65% -10%
-5%
0%
5%
10%
PZ
UN
ILE
VE
R
CA
DB
UR
Y
DA
NG
SU
GA
R
FLO
UR
MIL
L
HO
NY
FLO
UR
NE
STLE
UA
CN
WoW Return
-32%
5%
-6%
-19%
-6% -7% -13%
30%
13%
-4%
-60%
-30%
0%
30%
60%
UN
ILE
VE
R
CA
DB
UR
Y
FLO
UR
MIL
L
NE
STLE
UA
CN
Stra
uss
Nestle
In
dia
Illovo
su
ga
r
To
ng
att H
ulle
t
Jo
llibee
Fo
od
YTD Return
0
8
16
24
32
40
48
PZ
UN
ILE
VE
R
CA
DB
UR
Y
FLO
UR
MIL
L
NE
STLE
UA
CN
Stra
uss
Illovo
su
ga
r
To
ng
att H
ulle
t
Jo
llibee
Fo
od
P/E P/BV
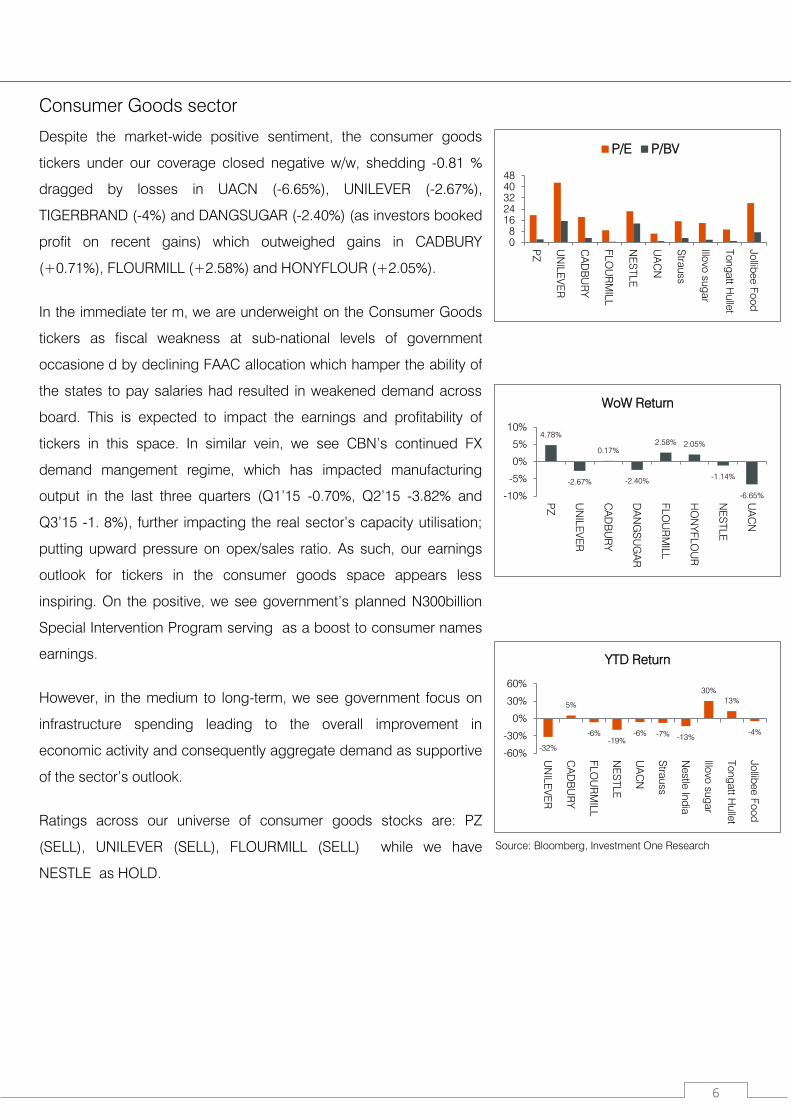
Consumer Goods sector
Despite the market-wide positive sentiment, the consumer goods
tickers under our coverage closed negative w/w, shedding -0.81 %
dragged by losses in UACN (-6.65%), UNILEVER (-2.67%),
TIGERBRAND (-4%) and DANGSUGAR (-2.40%) (as investors booked
profit on recent gains) which outweighed gains in CADBURY
(+0.71%), FLOURMILL (+2.58%) and HONYFLOUR (+2.05%).
In the immediate ter m, we are underweight on the Consumer Goods
tickers as fiscal weakness at sub-national levels of government
occasione d by declining FAAC allocation which hamper the ability of
the states to pay salaries had resulted in weakened demand across
board. This is expected to impact the earnings and profitability of
tickers in this space. In similar vein, we see CBN’s continued FX
demand mangement regime, which has impacted manufacturing
output in the last three quarters (Q1’15 -0.70%, Q2’15 -3.82% and
Q3’15 -1. 8%), further impacting the real sector’s capacity utilisation;
putting upward pressure on opex/sales ratio. As such, our earnings
outlook for tickers in the consumer goods space appears less
inspiring. On the positive, we see government’s planned N300billion
Special Intervention Program serving as a boost to consumer names
earnings.
However, in the medium to long-term, we see government focus on
infrastructure spending leading to the overall improvement in
economic activity and consequently aggregate demand as supportive
of the sector’s outlook.
Ratings across our universe of consumer goods stocks are: PZ
(SELL), UNILEVER (SELL), FLOURMILL (SELL) while we have
NESTLE as HOLD.
Source: Bloomberg, Investment One Research
7
0
6
12
18
24
30
AS
HA
KA
CE
M
DA
NG
CE
M
WA
PC
O
CC
NN
Sia
m C
em
en
t
Ultra
tech
Ce
me
nt
Se
me
n P
erse
ro
PP
C
Ho
lcim
(In
do
nesia
)
P/E P/BV
0.00%
17.78%
0.00% 0.00%
0%
5%
10%
15%
20%
WoW Return
0%
-14%
-17%
-3%
-7%
2%
-6%
-15%
-8%
-30%
0%
30%
AS
HA
KA
CE
M
DA
NG
CE
M
WA
PC
O
CC
NN
Sia
m C
em
en
t
Ultra
tech
C
em
en
t
Se
me
n P
erse
ro
PP
C
Ho
lcim
(In
do
nesia
)
YTD Return
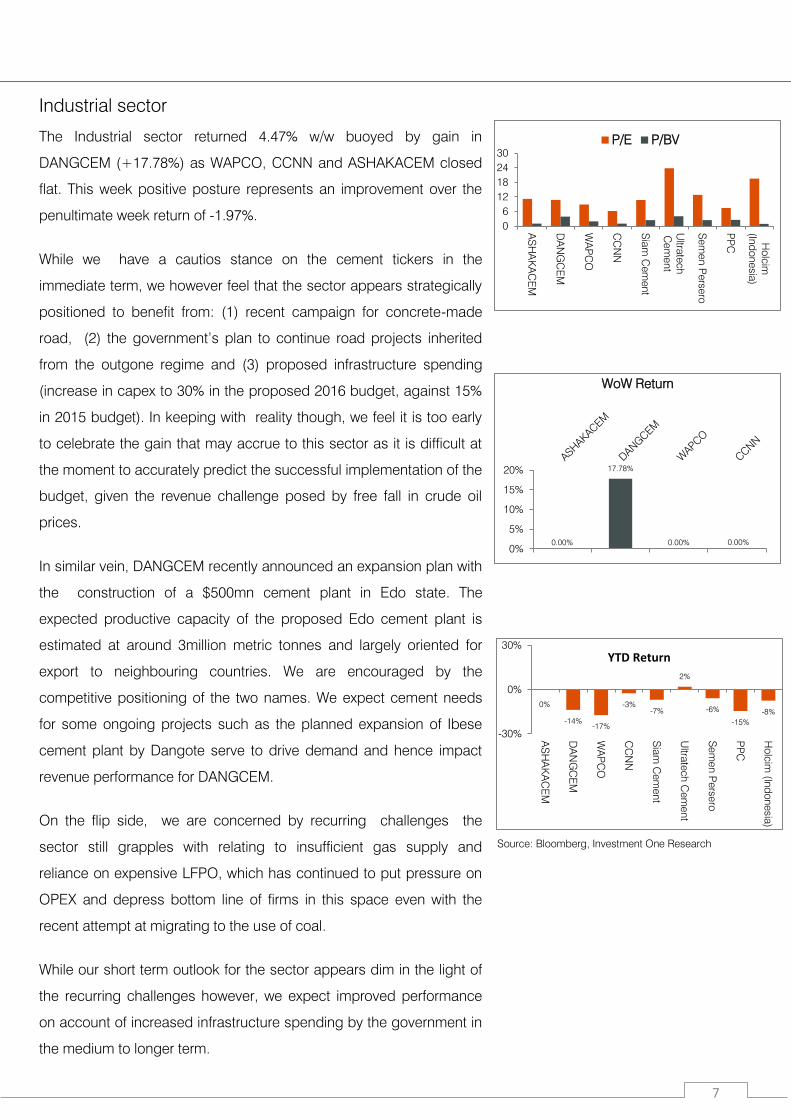
Industrial sector
The Industrial sector returned 4.47% w/w buoyed by gain in
DANGCEM (+17.78%) as WAPCO, CCNN and ASHAKACEM closed
flat. This week positive posture represents an improvement over the
penultimate week return of -1.97%.
While we have a cautios stance on the cement tickers in the
immediate term, we however feel that the sector appears strategically
positioned to benefit from: (1) recent campaign for concrete-made
road, (2) the government’s plan to continue road projects inherited
from the outgone regime and (3) proposed infrastructure spending
(increase in capex to 30% in the proposed 2016 budget, against 15%
in 2015 budget). In keeping with reality though, we feel it is too early
to celebrate the gain that may accrue to this sector as it is difficult at
the moment to accurately predict the successful implementation of the
budget, given the revenue challenge posed by free fall in crude oil
prices.
In similar vein, DANGCEM recently announced an expansion plan with
the construction of a $500mn cement plant in Edo state. The
expected productive capacity of the proposed Edo cement plant is
estimated at around 3million metric tonnes and largely oriented for
export to neighbouring countries. We are encouraged by the
competitive positioning of the two names. We expect cement needs
for some ongoing projects such as the planned expansion of Ibese
cement plant by Dangote serve to drive demand and hence impact
revenue performance for DANGCEM.
On the flip side, we are concerned by recurring challenges the
sector still grapples with relating to insufficient gas supply and
reliance on expensive LFPO, which has continued to put pressure on
OPEX and depress bottom line of firms in this space even with the
recent attempt at migrating to the use of coal.
While our short term outlook for the sector appears dim in the light of
the recurring challenges however, we expect improved performance
on account of increased infrastructure spending by the government in
the medium to longer term.
Source: Bloomberg, Investment One Research
8
AFRICA*** Value DOD% MOM% YTD (%) 52 WK LO. 52 WK HI. DAILY VOL. MKT CAP. P/E P/BV DY (%)
NGSEINDX INDEX 24,689.69 0.10 5.00 -13.80 22,330.96 35,843.39 311.60 8,572.19 15.57 1.30 4.31
JALSH INDEX 49,654.51 2.19 5.74 -2.05 45,975.78 55,355.12 244.47 10,177.84 37.66 2.00 3.39
NSEASI INDEX 140.49 0.06 -0.97 -3.58 135.71 177.51 17.62 1,985.85 12.40 1.98 4.19
EGX 30 INDEX 5,793.74 0.70 -1.09 -17.30 5,526.02 9,833.48 114.07 246.86 7.25 0.76 2.35
MAURITIUS 1,850.00 -0.18 2.04 2.15 1,790.03 2,025.15 4.70 206.41 14.63 0.89 3.21
MOROCCO 263.65 -0.33 3.29 2.80 252.08 309.03 1.05 318.02 16.66 2.55 4.72
MSCI FM 478.31 0.04 2.59 -5.44 449.79 611.61 256.50 250.18 9.71 1.31 4.36
EMERGING** Value DOD% MOM% YTD (%) 52 WK LO. 52 WK HI. DAILY VOL. MKT CAP. P/E P/BV DY (%)
SHANGHAI SE 2,746.20 -0.63 -13.82 -22.41 2,638.30 5,178.19 14,118.50 23,204.57 14.48 1.59 2.24
S&P BSE SENSEX 23,569.81 2.54 -3.62 -9.75 22,600.39 30,024.74 25.94 39,202.16 18.13 2.54 1.58
KARACHI 100 31,896.84 1.38 2.89 -2.80 28,648.23 36,471.68 86.60 5,718.06 9.10 1.60 6.32
IBOV INDEX 39,808.05 1.25 3.21 -8.17 37,046.07 58,574.79 343.07 1,336.81 20.99 0.94 4.26
INDEXCF INDEX 1,731.83 0.34 7.68 -1.68 1,569.69 1,873.53 11,463.27 25,175.39 9.59 0.66 4.83
MSCI EM 711.24 -0.25 0.29 -10.44 686.74 1,069.13 17,943.88 6,310.59 10.89 1.22 3.18
DEVELOPED Value DOD% MOM% YTD (%) 52 WK LO. 52 WK HI. DAILY VOL. MKT CAP. P/E P/BV DY (%)
DOW JONES 15,973.84 2.00 -0.09 -8.33 15,370.33 18,351.36 132.57 4,892.09 14.49 2.74 2.82
S&P 500 INDEX 1,864.78 1.95 -0.83 -8.77 1,810.10 2,134.72 803.72 16,931.40 16.82 2.51 2.37
FTSE 100 INDEX 5,812.44 1.84 0.14 -6.89 5,499.51 7,122.74 1,083.60 1,603.72 25.70 1.65 4.58
CAC 40 INDEX 4,115.83 3.02 -2.24 -11.24 3,892.46 5,283.71 162.26 1,092.75 19.31 1.28 3.76
DAX INDEX 9,200.22 2.60 -3.61 -14.36 8,699.29 12,390.75 160.47 882.81 20.04 1.44 3.27
NIKKEI 225 16,022.58 7.16 -6.56 -15.82 14,865.77 20,952.71 3,405.22 269,783.87 17.62 1.42 2.00
HANG SENG 18,918.14 3.27 -3.09 -13.67 18,278.80 28,588.52 2,082.28 11,425.87 8.24 1.00 4.58
FTSE STR TIMES 696.09 1.65 3.00 0.02 651.85 824.62 138.70 57.64 11.71 0.90 6.52
MSCI U.S 1,768.52 1.98 -1.18 -9.29 1,716.31 2,044.90 901.05 17,927.39 17.34 2.52 2.33
EQUITY MARKET INDICES
Source: Bloomberg, Investment One Research.

9
52 Wk High 52 Wk Low 1M (%) 3M (%) 6M (%) 12M (%) YTD (%) 2015 (%)
All Share Index 35843.39 22330.96 5.00 -14.40 -19.59 -10.50 -13.80 -17.36
Sector 52 Wk High 52 Wk Low 1M (%) 3M (%) 6M (%) 12M (%) YTD (%) 2015 (%)
ACCESS Banking 7.09 3.48 8.75 -12.77 -5.75 -22.93 -15.46 -26.52
DIAMONDBNK Banking 4.91 1.50 -7.18 -35.38 -49.70 -52.00 -26.96 -58.78
FIDELITYBK Banking 2.27 1.13 -4.65 -12.14 -8.21 -1.60 -18.00 -7.41
FBNH Banking 9.95 3.28 9.17 -21.87 -39.72 -32.14 -23.39 -41.70
GUARANTY Banking 31.88 13.16 23.78 -29.21 -28.20 -2.65 -8.97 -27.80
STANBIC Banking 33.19 12.23 3.40 -32.98 -29.54 -43.78 -15.31 -38.78
SKYEBANK Banking 2.90 0.92 13.13 -38.46 -40.74 -35.38 -29.11 -40.60
UBA Banking 6.00 2.48 11.92 -23.02 -13.91 -3.00 -13.91 -21.40
FCMB Banking 3.74 0.84 -22.03 -54.00 -62.75 -54.00 -45.56 -32.13
ZENITHBANK Banking 25.48 8.83 29.24 -28.24 -24.13 -21.90 -13.17 -23.68
ETI Banking 23.02 14.20 -3.91 -16.19 -24.82 -2.70 -12.20 -9.58
STERLNBANK Banking 2.48 1.58 -2.23 -10.26 -18.60 -24.57 -4.37 -27.95
UBN Banking 11.74 4.70 1.92 -6.69 -27.30 -39.77 -23.19 -18.82
UNITYBNK Banking 5.00 0.58 9.68 -41.38 -61.58 -86.40 -39.29 124.00
WEMABANK Banking 1.12 0.77 0.00 2.04 11.11 6.38 0.00 4.17
Sector 52 Wk High 52 Wk Low 1M (%) 3M (%) 6M (%) 12M (%) YTD (%) 2015 (%)
ASHAKACEM Industrials 26.50 17.22 -5.66 13.58 6.38 43.93 0.00 14.16
DANGCEM Industrials 188.68 122.90 10.15 -10.08 -18.84 3.24 -13.82 -15.00
WAPCO Industrials 105.00 75.10 -7.78 -11.11 -22.71 1.90 -17.36 20.25
CCNN Industrials 13.23 7.31 -5.10 13.73 4.11 -10.69 -2.57 -10.01
Sector 52 Wk High 52 Wk Low 1M (%) 3M (%) 6M (%) 12M (%) YTD (%) 2015 (%)
FO Oil & Gas 342.00 146.51 3.64 17.93 59.07 93.50 3.64 44.80
CONOIL Oil & Gas 42.00 18.33 -25.91 -33.13 -44.92 -43.77 -25.91 -35.08
MOBIL Oil & Gas 175.00 118.06 10.07 14.83 3.64 6.40 -0.25 1.27
OANDO Oil & Gas 20.48 3.43 -0.53 -50.97 -67.64 -72.00 -35.93 -63.38
TOTAL Oil & Gas 188.89 134.05 -6.67 -2.10 -11.39 4.44 -4.77 3.16
SEPLAT Oil & Gas 481.57 151.74 42.47 11.06 -11.54 NA 24.19 -45.28
Sector 52 Wk High 52 Wk Low 1M (%) 3M (%) 6M (%) 12M (%) YTD (%) 2015 (%)
NB Breweries 184.99 88.00 0.52 -23.73 -23.26 -24.50 -28.38 -17.73
GUINNESS Breweries 192.00 92.87 4.66 -11.62 -1.40 4.65 -0.91 -28.40
Sector 52 Wk High 52 Wk Low 1M (%) 3M (%) 6M (%) 12M (%) YTD (%) 2015 (%)
PZ FMCG 35.00 19.08 9.06 -15.77 -33.74 -18.86 -14.79 7.98
UNILEVER FMCG 47.00 29.53 -31.72 -18.83 -27.98 -13.17 -31.72 20.81
CADBURY FMCG 44.00 12.00 35.94 -5.34 -45.71 -57.93 5.42 -57.13
DANGFLOUR FMCG N/A N/A N/A N/A N/A N/A N/A N/A
DANGSUGAR FMCG 8.12 5.20 0.18 -9.52 -5.00 -7.17 -5.47 -5.04
FLOURMILL FMCG 38.53 15.93 3.83 -11.32 -30.43 -32.38 -6.25 -46.94
HONYFLOUR FMCG 4.15 1.34 -17.22 -38.93 -48.08 -52.70 -27.32 -40.75
NESTLE FMCG 1102.50 670.00 -6.09 -14.20 -19.00 -6.87 -19.19 -15.00
UACN FMCG 44.49 15.58 13.70 -28.04 -47.30 -43.61 -6.02 -38.97
Sector 52 Wk High 52 Wk Low 1M (%) 3M (%) 6M (%) 12M (%) YTD (%) 2015 (%)
OKOMUOIL Agriculture 39.37 18.70 -11.15 0.35 16.79 -0.99 -4.29 19.53
PRESCO Agriculture 36.00 25.00 3.03 11.48 6.25 21.43 3.03 34.69
Sector Per formance
Source: Bloomberg, Investment One Research

10
Name
Banks
TP Pr ice Up/Downside MCap. (US$'m)
P/E
2015E
P/E
2016E
EPS Growth
2015 P/BV 2015E ROE 2015E DY (%)
Access Bank Nigeria 6.24 4.10 52.13 595.85 2.13 3.00 26.46 0.34 18.05 13.63
FBNH Nigeria 6.20 3.93 57.87 708.71 2.31 2.17 18.06 0.25 14.62 2.88
GTBank Nigeria 24.21 16.55 46.28 2447.05 4.86 4.66 9.46 1.23 29.03 10.27
Diamond Bank Nigeria 2.97 1.68 77.04 195.48 2.01 1.63 -11.45 0.17 11.17 8.81
UBA Nigeria 10.70 2.91 267.66 530.39 1.83 1.97 2.63 0.33 22.20 12.92
Zenith Bank Nigeria 19.42 12.20 59.16 1924.33 3.75 3.62 8.59 0.67 20.35 13.63
Barclays South Africa 15131.46 15316.00 -1.20 8221.87 9.04 8.57 10.33 1.55 17.05 6.49
Nedbank South Africa 19955.21 19030.00 4.86 5957.79 8.46 8.22 12.36 1.37 15.96 5.89
Equity Bank Kenya 47.78 39.75 20.21 1473.66 8.25 6.82 28.97 2.11 29.24 4.87
KCB Kenya 57.01 40.00 42.52 1188.81 6.35 5.28 15.56 1.48 23.69 5.63
ADCB UAE 7.98 6.12 30.40 9323.46 7.14 6.83 25.68 1.38 20.35 7.27
Gulf Bank Kuwait N/A 208.00 N/A 2121.71 10.40 N/A 5.00 1.12 7.43 4.81
BPI Phillipines 92.04 89.65 2.67 7424.24 17.75 15.70 -9.28 2.34 13.25 2.03
SHB Saudi Arabia 33.03 24.20 36.50 3687.43 6.88 5.88 11.20 1.19 18.55 4.10
Average 2722.64 2485.36 53.55 3271.48 6.51 5.34 10.97 1.11 11.75 7.37
STOCK VALUATIONS AND PEERS
Industr ials
TP Pr ice Up/Downside MCap. (US$'m)
EV/EBITDA
2015E
P/E
FY 2014
P/E
FY 2015E
EPS Growth
2015/14 DY (%)
Ashaka Cement Nigeria 25.53 25.00 2.14 281.27 5.48 20.11 11.21 61.90 2.10
Dangote Cement Nigeria 178.85 146.50 22.08 12541.74 8.82 13.35 10.80 -20.51 4.83
Lafarge Wapco Nigeria 104.45 80.00 30.56 1830.66 6.75 11.50 8.96 -45.19 4.41
Siam Cement Thailand 548.11 428.00 28.06 14406.73 8.91 11.31 10.78 35.06 3.91
Cemex Mexico 12.71 8.47 50.11 6026.01 6.58 279.22 15.07 N/A 0.00
Ultratech Cement India 3171.84 2831.05 12.04 11403.28 13.30 37.02 23.85 -4.93 0.34
Semen Persero Indonesia 12251.50 10725.00 14.23 4753.46 8.40 13.60 12.89 3.60 3.46
PPC Ltd South Africa 2165.00 1287.00 68.22 493.36 4.69 8.88 7.51 -16.88 4.45
Holcim Indonesia 1045.91 920.00 13.69 526.78 7.95 N/A 19.59 -29.98 3.90
Average 1951.48 1646.01 26.09 5232.08 7.44 44.58 12.69 0.72 3.32
Agr iculture
TP Pr ice Up/Downside MCap. (US$'m)
EV/EBITDA
2015E
P/E
FY 2014
P/E
FY 2015E
EPS Growth
2015/14 DY (%)
Okomu Oil Palm Nigeria 30.15 29.00 3.97 138.98 7.04 16.40 12.48 -25.68 3.25
Presco Nigeria 32.38 34.00 -4.76 170.81 5.61 8.65 9.23 107.75 2.46
BW Plantation Indonesia 196.20 193.00 1.66 454.64 8.79 N/A 33.54 -27.82 N/A
United Malacca Malaysia 6.94 6.05 14.71 306.41 8.77 27.79 15.32 -33.28 2.64
Sampoerna Agro Indonesia 1842.00 1800.00 2.33 254.20 7.94 15.13 13.16 185.71 2.50
Kwantas Malaysia N/A 1.53 N/A 115.44 N/A N/A N/A 41.47 N/A
Average 421.53 343.93 N/A 240.08 7.63 16.99 16.75 41.36 2.71
Source: Bloomberg, Investment One Research
11
Oil & Gas
TP Pr ice Up/Downside MCap. (US$'m)
EV/EBITDA
2015E
P/E
FY 2014
P/E
FY 2015E
EPS Growth
2015/14 DY (%)
Forte Oil Nigeria 145.57 342.00 -57.44 2237.87 28.43 75.62 35.89 124.18 N/A
Conoil Nigeria 26.45 18.33 44.30 63.90 N/A 21.31 N/A -72.85 N/A
Mobil Nigeria 135.47 159.60 -15.12 289.13 6.33 14.22 10.88 83.73 5.32
Oando Nigeria 8.21 3.78 117.28 228.54 16.18 N/A 34.36 -3434.57 11.64
Total Nigeria 146.15 140.00 4.39 238.80 5.60 12.16 8.36 -17.06 7.08
Seplat Nigeria 321.62 252.11 27.57 713.64 4.89 2.53 5.44 -63.77 7.03
Zhejiang Haiyue China N/A 11.23 N/A 667.64 N/A 198.06 10.07 81.25 N/A
Grupa Lotos Warsaw 29.94 24.40 22.70 1147.58 5.55 N/A 8.38 N/A 0.00
Erg Spa Italy 14.07 11.42 23.20 1920.94 4.84 140.50 19.32 -46.50 4.38
Hindustan Pet. Corp India 950.52 733.90 29.52 3647.71 6.55 16.59 7.53 38.71 3.80
Shell Oman 2.13 1.97 8.14 498.57 9.05 13.88 13.10 15.45 5.60
Turcas Petrol Turkey 1.78 1.33 34.21 121.76 44.08 N/A 5.86 N/A 2.78
Average 161.99 141.67 N/A 981.34 13.15 54.99 14.47 -329.14 5.29
Brewer ies
TP Pr ice Up/Downside MCap. (US$'m)
EV/EBITDA
2015E
P/E
FY 2014
P/E
FY 2015E
EPS Growth
2015/14 DY (%)
Nigerian breweries Nigeria 137.01 97.40 40.66 3879.90 7.47 20.19 15.26 -14.23 4.98
Guinness Nigeria 126.15 119.30 5.74 902.55 8.21 261.05 20.12 -18.55 2.09
Heineken Netherlands 80.47 73.55 9.41 47406.43 10.42 22.27 17.88 25.38 1.89
Ghana Breweries Ghana N/A 1.97 N/A 104.61 N/A N/A N/A -424.39 N/A
AEFES Turkey 20.36 16.73 21.72 3358.74 9.37 N/A 19.32 N/A 1.27
EABL Kenya 356.75 279.00 27.87 2167.46 9.80 24.76 19.55 37.36 3.03
CCU Chile 8070.33 6907.50 16.83 3624.20 7.62 21.13 15.94 1.05 2.73
Average 1465.18 1070.78 N/A 8777.70 8.82 69.88 18.01 -65.56 2.67
Consumer Goods
TP Pr ice Up/Downside MCap. (US$'m)
EV/EBITDA
2015E
P/E
FY 2014
P/E
FY 2015E
EPS Growth
2015/14 DY 2015E (%)
PZ Nigeria 24.16 21.90 10.32 436.84 9.71 25.60 19.64 -12.07 2.70
Unilever Nigeria 23.29 29.53 -21.14 561.27 15.11 147.65 42.92 -48.80 0.76
Cadbury Nigeria 17.74 18.08 -1.87 170.60 10.38 N/A 18.24 -76.56 1.57
DSR Nigeria 7.25 5.70 27.12 343.63 2.89 5.78 5.47 7.78 8.88
FMN Nigeria 31.24 19.50 60.23 257.08 5.75 2.07 8.70 95.58 11.18
Nestle Nigeria 837.54 695.00 20.51 2767.63 14.16 24.37 22.35 -0.11 3.63
UACN Nigeria 36.72 19.50 88.29 188.18 6.26 8.94 6.36 11.15 5.85
Strauss Group Israel N/A 5370.00 N/A 1484.48 N/A 27.23 15.30 0.46 N/A
Illovo sugar South Africa 2122.50 2202.00 -3.61 642.42 8.68 27.66 13.99 -9.85 2.18
Tongatt Hullet South Africa 13761.67 10290.00 33.74 880.38 7.19 14.02 9.36 -16.42 4.10
Jollibee Food Phillipines 220.91 209.60 5.40 4725.53 14.60 46.52 28.25 -11.25 1.15
Average 1424.55 1453.19 N/A 988.37 9.28 34.45 15.99 -4.65 111.77
Source: Bloomberg, Investment One Research
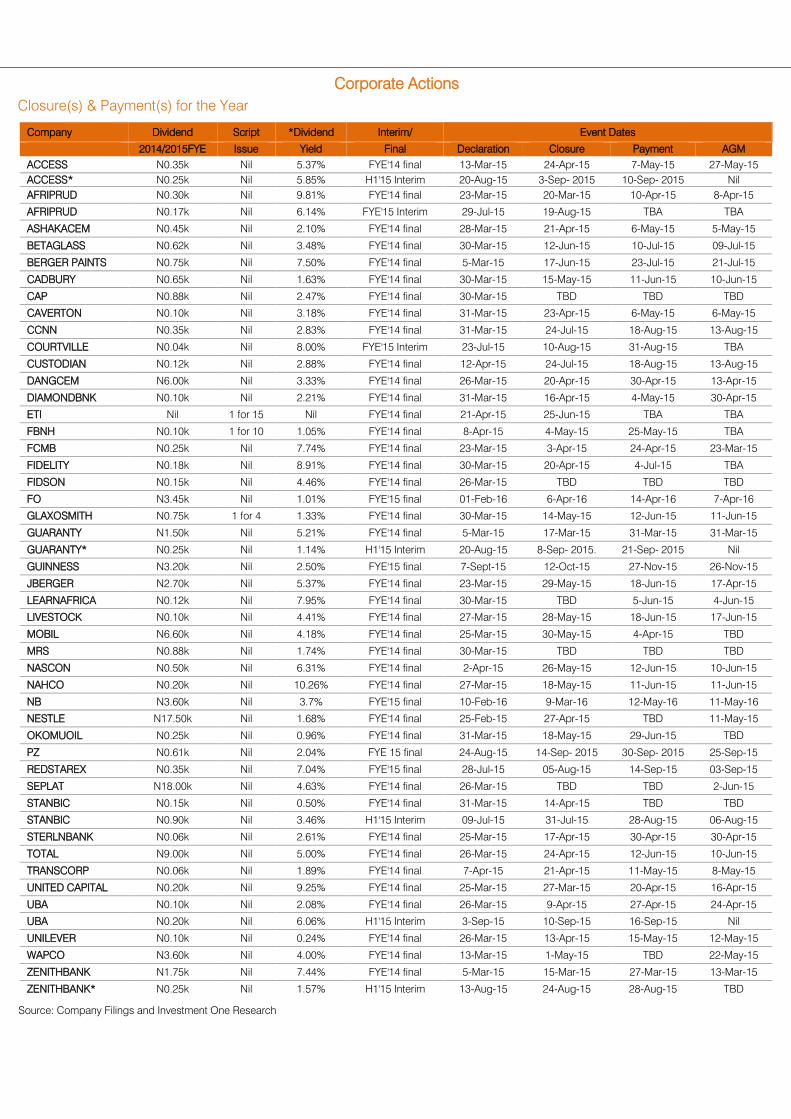
Company Dividend Script *Dividend Interim/ Event Dates
2014/2015FYE Issue Yield Final Declaration Closure Payment AGM
ACCESS N0.35k Nil 5.37% FYE'14 final 13-Mar-15 24-Apr-15 7-May-15 27-May-15
ACCESS* N0.25k Nil 5.85% H1'15 Interim 20-Aug-15 3-Sep- 2015 10-Sep- 2015 Nil
AFRIPRUD N0.30k Nil 9.81% FYE'14 final 23-Mar-15 20-Mar-15 10-Apr-15 8-Apr-15
AFRIPRUD N0.17k Nil 6.14% FYE'15 Interim 29-Jul-15 19-Aug-15 TBA TBA
ASHAKACEM N0.45k Nil 2.10% FYE'14 final 28-Mar-15 21-Apr-15 6-May-15 5-May-15
BETAGLASS N0.62k Nil 3.48% FYE'14 final 30-Mar-15 12-Jun-15 10-Jul-15 09-Jul-15
BERGER PAINTS N0.75k Nil 7.50% FYE'14 final 5-Mar-15 17-Jun-15 23-Jul-15 21-Jul-15
CADBURY N0.65k Nil 1.63% FYE'14 final 30-Mar-15 15-May-15 11-Jun-15 10-Jun-15
CAP N0.88k Nil 2.47% FYE'14 final 30-Mar-15 TBD TBD TBD
CAVERTON N0.10k Nil 3.18% FYE'14 final 31-Mar-15 23-Apr-15 6-May-15 6-May-15
CCNN N0.35k Nil 2.83% FYE'14 final 31-Mar-15 24-Jul-15 18-Aug-15 13-Aug-15
COURTVILLE N0.04k Nil 8.00% FYE'15 Interim 23-Jul-15 10-Aug-15 31-Aug-15 TBA
CUSTODIAN N0.12k Nil 2.88% FYE'14 final 12-Apr-15 24-Jul-15 18-Aug-15 13-Aug-15
DANGCEM N6.00k Nil 3.33% FYE'14 final 26-Mar-15 20-Apr-15 30-Apr-15 13-Apr-15
DIAMONDBNK N0.10k Nil 2.21% FYE'14 final 31-Mar-15 16-Apr-15 4-May-15 30-Apr-15
ETI Nil 1 for 15 Nil FYE'14 final 21-Apr-15 25-Jun-15 TBA TBA
FBNH N0.10k 1 for 10 1.05% FYE'14 final 8-Apr-15 4-May-15 25-May-15 TBA
FCMB N0.25k Nil 7.74% FYE'14 final 23-Mar-15 3-Apr-15 24-Apr-15 23-Mar-15
FIDELITY N0.18k Nil 8.91% FYE'14 final 30-Mar-15 20-Apr-15 4-Jul-15 TBA
FIDSON N0.15k Nil 4.46% FYE'14 final 26-Mar-15 TBD TBD TBD
FO N3.45k Nil 1.01% FYE'15 final 01-Feb-16 6-Apr-16 14-Apr-16 7-Apr-16
GLAXOSMITH N0.75k 1 for 4 1.33% FYE'14 final 30-Mar-15 14-May-15 12-Jun-15 11-Jun-15
GUARANTY N1.50k Nil 5.21% FYE'14 final 5-Mar-15 17-Mar-15 31-Mar-15 31-Mar-15
GUARANTY* N0.25k Nil 1.14% H1'15 Interim 20-Aug-15 8-Sep- 2015. 21-Sep- 2015 Nil
GUINNESS N3.20k Nil 2.50% FYE'15 final 7-Sept-15 12-Oct-15 27-Nov-15 26-Nov-15
JBERGER N2.70k Nil 5.37% FYE'14 final 23-Mar-15 29-May-15 18-Jun-15 17-Apr-15
LEARNAFRICA N0.12k Nil 7.95% FYE'14 final 30-Mar-15 TBD 5-Jun-15 4-Jun-15
LIVESTOCK N0.10k Nil 4.41% FYE'14 final 27-Mar-15 28-May-15 18-Jun-15 17-Jun-15
MOBIL N6.60k Nil 4.18% FYE'14 final 25-Mar-15 30-May-15 4-Apr-15 TBD
MRS N0.88k Nil 1.74% FYE'14 final 30-Mar-15 TBD TBD TBD
NASCON N0.50k Nil 6.31% FYE'14 final 2-Apr-15 26-May-15 12-Jun-15 10-Jun-15
NAHCO N0.20k Nil 10.26% FYE'14 final 27-Mar-15 18-May-15 11-Jun-15 11-Jun-15
NB N3.60k Nil 3.7% FYE'15 final 10-Feb-16 9-Mar-16 12-May-16 11-May-16
NESTLE N17.50k Nil 1.68% FYE'14 final 25-Feb-15 27-Apr-15 TBD 11-May-15
OKOMUOIL N0.25k Nil 0.96% FYE'14 final 31-Mar-15 18-May-15 29-Jun-15 TBD
PZ N0.61k Nil 2.04% FYE 15 final 24-Aug-15 14-Sep- 2015 30-Sep- 2015 25-Sep-15
REDSTAREX N0.35k Nil 7.04% FYE'15 final 28-Jul-15 05-Aug-15 14-Sep-15 03-Sep-15
SEPLAT N18.00k Nil 4.63% FYE'14 final 26-Mar-15 TBD TBD 2-Jun-15
STANBIC N0.15k Nil 0.50% FYE'14 final 31-Mar-15 14-Apr-15 TBD TBD
STANBIC N0.90k Nil 3.46% H1'15 Interim 09-Jul-15 31-Jul-15 28-Aug-15 06-Aug-15
STERLNBANK N0.06k Nil 2.61% FYE'14 final 25-Mar-15 17-Apr-15 30-Apr-15 30-Apr-15
TOTAL N9.00k Nil 5.00% FYE'14 final 26-Mar-15 24-Apr-15 12-Jun-15 10-Jun-15
TRANSCORP N0.06k Nil 1.89% FYE'14 final 7-Apr-15 21-Apr-15 11-May-15 8-May-15
UNITED CAPITAL N0.20k Nil 9.25% FYE'14 final 25-Mar-15 27-Mar-15 20-Apr-15 16-Apr-15
UBA N0.10k Nil 2.08% FYE'14 final 26-Mar-15 9-Apr-15 27-Apr-15 24-Apr-15
UBA N0.20k Nil 6.06% H1'15 Interim 3-Sep-15 10-Sep-15 16-Sep-15 Nil
UNILEVER N0.10k Nil 0.24% FYE'14 final 26-Mar-15 13-Apr-15 15-May-15 12-May-15
WAPCO N3.60k Nil 4.00% FYE'14 final 13-Mar-15 1-May-15 TBD 22-May-15
ZENITHBANK N1.75k Nil 7.44% FYE'14 final 5-Mar-15 15-Mar-15 27-Mar-15 13-Mar-15
ZENITHBANK* N0.25k Nil 1.57% H1'15 Interim 13-Aug-15 24-Aug-15 28-Aug-15 TBD
Closure(s) & Payment(s) for the Year
Corporate Actions
Source: Company Filings and Investment One Research
13
Disclaimer
This publication is for general information only and is not intended to be relied upon as a forecast, research or
investment advice, and is not a recommendation, offer or solicitation to buy or sell any securities or to adopt any
investment strategy. The opinions expressed in this article represent the current, good-faith views of the
author(s) at the time of publication.
The information and opinions contained in this material are derived from proprietary and non-proprietary
sources deemed by INVESTMENT ONE Financial Services to be reliable, are not necessarily all-inclusive and are
not guaranteed as to accuracy, completeness or otherwise. Opinions expressed are our own unless otherwise
stated. INVESTMENT ONE Financial Services and its affiliates may trade for their own accounts, the company
may decide to take a long or short position on any securities, and/or may take the opposite side of public
orders.
Past performance is no guarantee of future results. The inclusion of past performance figures is for illustrative
purposes only. There is no guarantee that any forecasts made will come to pass. Reliance upon information in
this material is at the sole discretion of the reader. This is not in any sense a solicitation or offer of the purchase
or sale of securities. Neither INVESTMENT ONE Financial Services nor any officer or employee of INVESTMENT
ONE Financial Services accepts any liability whatsoever for any direct, indirect or consequential damages or
losses arising from any use of this report or its contents. Investments in general and, equities, in particular,
involve numerous risks, including, among others, market risk, counterparty default risk and liquidity risk.
The ratings and company profile assessments reflect the opinion of the individual analyst and are subject to
change at any time.
This material has been issued by Investment One, which is regulated by the Securities and Exchange
Commission. Further information on any security mentioned herein may be obtained by emailing:
Address:
Investment Management & Research
INVESTMENT ONE Financial Services Limited
37, Karimu Kotun Street,
Victoria Island, Lagos.
Nigeria
Email: [email protected]
Visit us at: www.investment-one.com
