nigerian national petroleum corporation performance/1997 annual... · general review of nigeria’s...
TRANSCRIPT

NIGERIAN NATIONAL PETROLEUM
CORPORATION
ANNUAL STATISTICAL BULLETIN
JANUARY – DECEMBER 1997
CORPORATE PLANNING AND DEVELOPMENT DIVISION (CPDD)

TABLE OF CONTENTS
S/N 1. 2. 3. 4. 5. 6. 7. 8. 9. 10. 11. 12. 13. 14. 15. 16. 17. 18. 19. 20. 21. 22. 23. 24. 25. 26. 27. 28. 29. 30. 31. 32. 33. 34. 35. 36. 37. 38. 39. 40. 41. 42.
43.
Executive Summary General Review of Nigeria’s Petroleum Industry Activities in 1999 1997 Seismic Activities: Exploration 1997 Seismic Activities: Processing and Re-processing 1997 Rig Operations by Company 1997 Drilling Summary by Company Crude oil, Gas and Water Production - Full year 1997 Summary of Crude Oil Production compiled from Company’s Monthly Report Crude Oil Production by Company, Crude stream Monthly Analysis of Crude Oil Production by Stream Monthly Analysis of Crude Oil Production by Company Nigeria Crude Oil Exports Analysis of Crude Oil Production vs Exports Nigeria Crude Oil Exports by Destination NNPC Equity Crude Oil Exports & Revenue by Types Gas Export and Revenue Gas Production and Utilization by field Summary of Gas Production and Utilization by Company Nigerian Gas Company: Gas Sales Joint Venture Gas Sales Statistics Total Crude Oil and Gas Revenue Flow Nigerian Crude Oil Realizable Prices Average Spot Prices of OPEC Reference Basket and Some Selected Crudes Nigerian Crude Oil Production and Exports (1961 – 1997) Nigerian Natural Gas Production and Disposal (1961 – 1997) World Crude Oil Production and Exports (1961 – 1997) Crude Oil Production in OPEC Member Countries (1961 – 1997) OPEC & Nigeria: % Contribution to World Crude Oil Production and Exports Nigerian Crude Oil Reserves and Production Ratio 1997 Refinery Crude Oil Balance Crude Oil Received Crude Oil Processed Finished Products Refinery Production Returns Refinery Fuel and Loss Statistics Domestic Consumption of Petroleum Products by States Petroleum Products Distribution by Marketing Company Bunker Sales Report Petroleum Product Exports Petroleum Products Imports Annual Petroleum Products Sales in Nigeria Petroleum Products Retail Price Trend Glossary of Terms
Page 1 3 10 11 12 13 14 24 25 26 27 28 30 31 33 34 35 44 46 47 48 49 50 51 52 53 54 55 56 57 60 62 64 66 67 68 70 71 72 74 76 78
79
2
EXECUTIVE SUMMARY
The operation Division of NAPIMS with the Joint Venture Partners and oil
producing companies operating under the Production Sharing Contract
(PSC) acquired 750 kilometres of 2-D seismic data and 17,458 square
kilometers of 3-D seismic lines. In all, 26 rigs were in operations both
onshore and offshore terrains. A total of 155 wells were spudded involving
twelve (12) exploratory, fourteen (14) appraisal and one hundred and one
(101) development wells, while the remaining twenty-eight (28) were
worked over.
Total crude oil production, including condensates, stood at 855.736 million
barrels or an average of 2.344 million barrels per day in 1997. Total
revenue generated into Federation Account amounted to $12.198 billion.
Of this, PPT contribution stands at $3.014 billion, Royalties about $1.453
billion while equity oil sales accounted for about $7.527 billion.
Crude oil suppliers to the three local refineries amounted to about 80.473
million barrels while 78 million barrels were processed. Total petroleum
products produced by these refineries were put at about 9.37 million metric
tonnes (86.714 million barrels). The difference between crude oil
processed and product output can be explained as refinery fuel and loss
which is about 12%
3
Petroleum Products Marketing Company (PPMC), a subsidiary of NNPC
evacuated about 9.37 million metric tonnes of petroleum products from
refineries and imported about 1.666 million metric tonnes for local
consumption. In all, about 11.04 million metric tonnes of petroleum
products were available for domestic consumption.
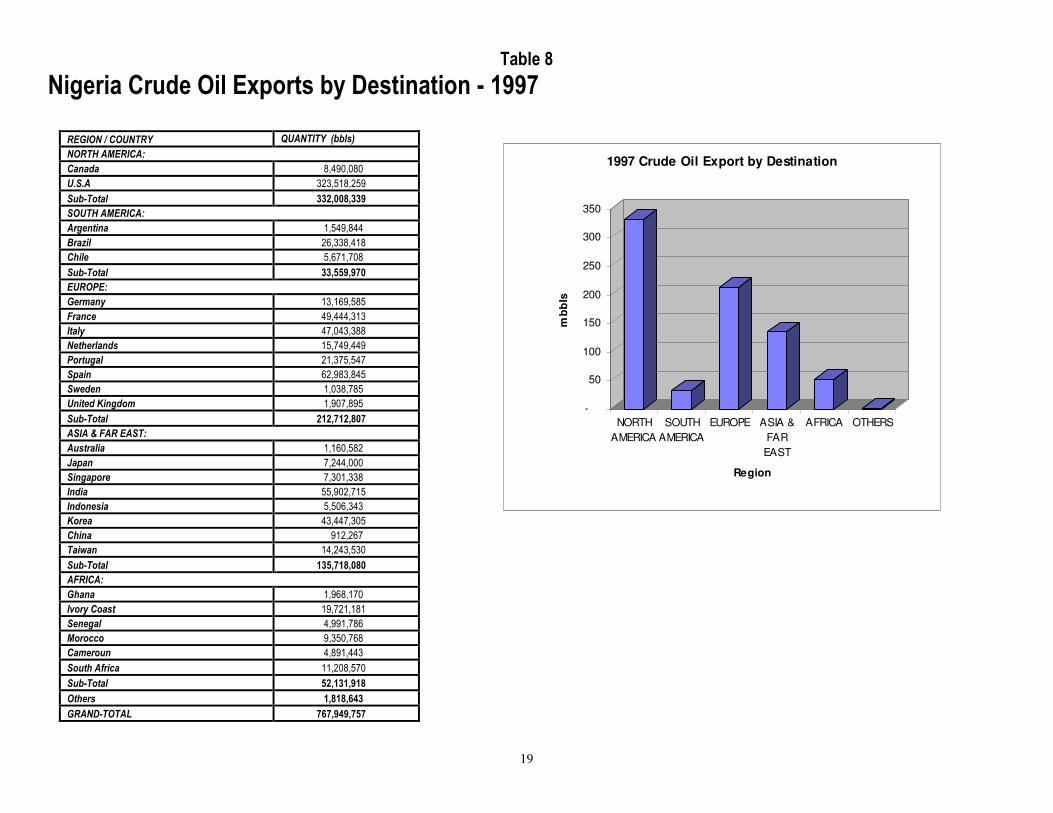
Available oil statistics shows that total crude oil exports stood at 767.9
million barrels averaging 2.104 million barrels per day in 1997. Of this, the
Federation (NNPC) Equity oil export stood at 392.3 million barrels.
Natural gas produced in association with oil amounted to 1,142 Billion
standard cubic feet. Of this, 801.8 Bscf (70.21%) was flared, while the
remaining were re-injected, used as fuel, sold, or converted to NGL.
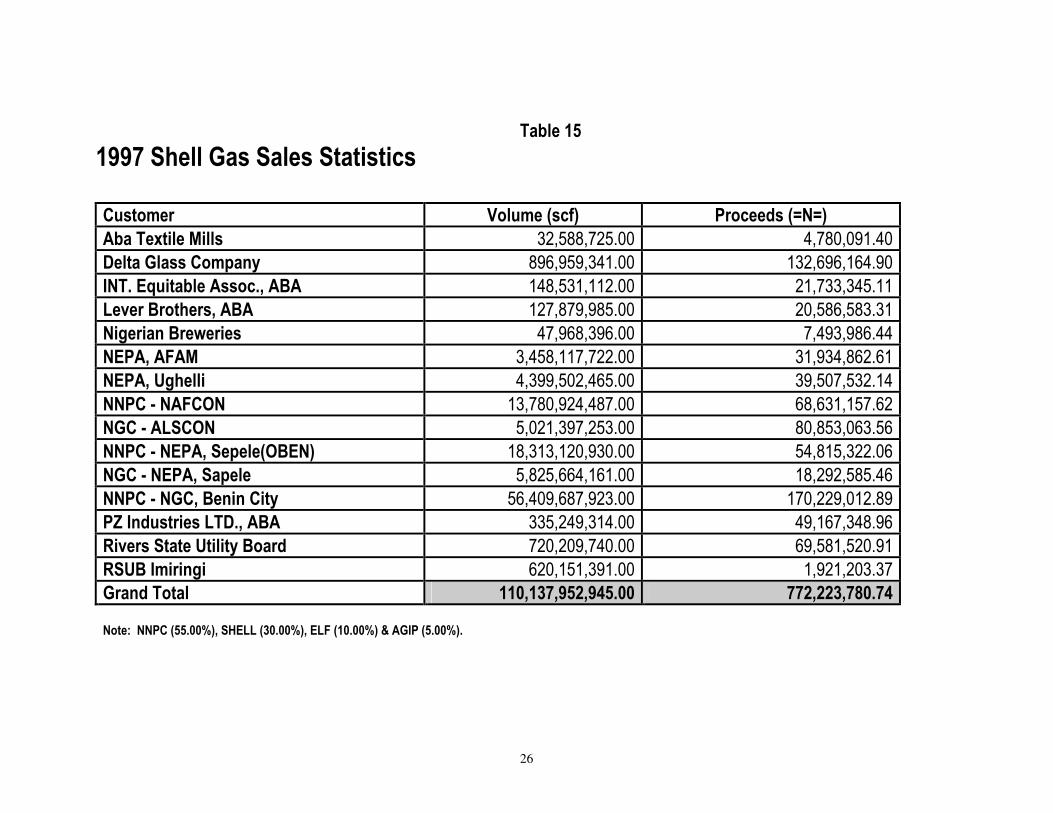
Shell Development Producing Company (SPDC) sold 110.138 Bscf of
natural gas amounting to N772,224 million, while NGC sold a total of
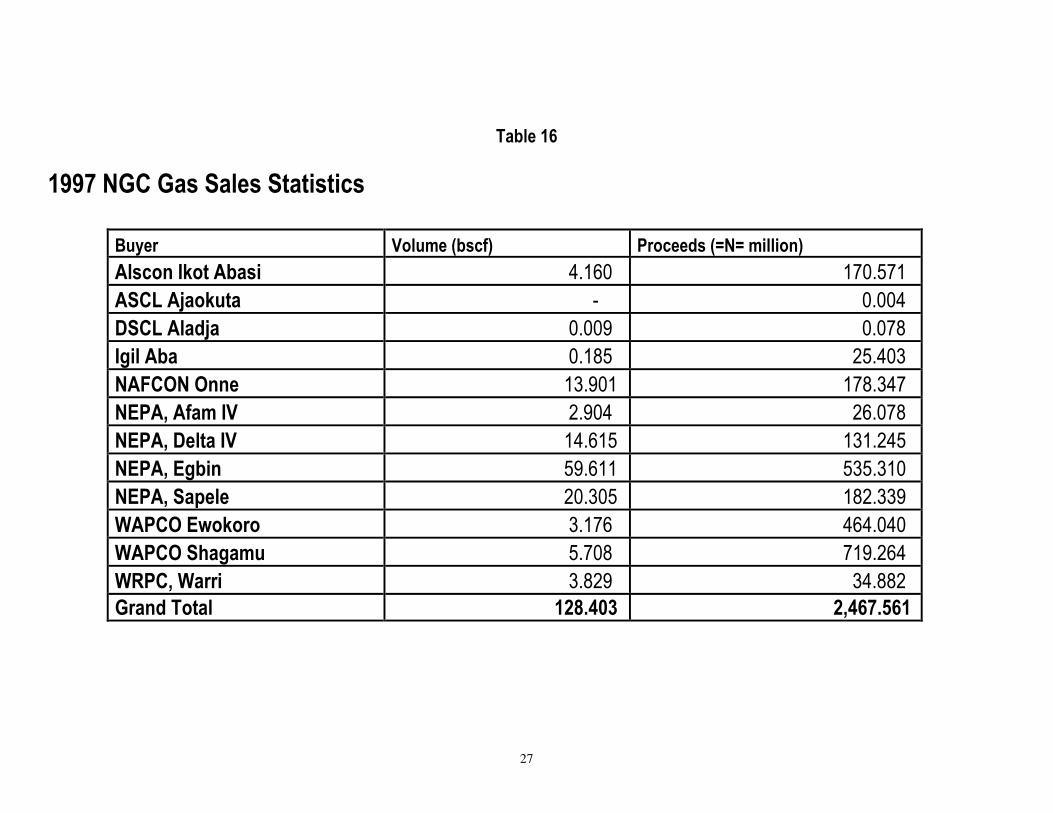
128.403 Bscf amounting to N2.468 billion. However, it should be noted that
85% of NGC sales is to NEPA at subsidized rate.
4
GENERAL REVIEW OF NIGERIA’S PETROLEUM INDUSTRY
ACTIVITIES IN 1997
1. Seismic Activities
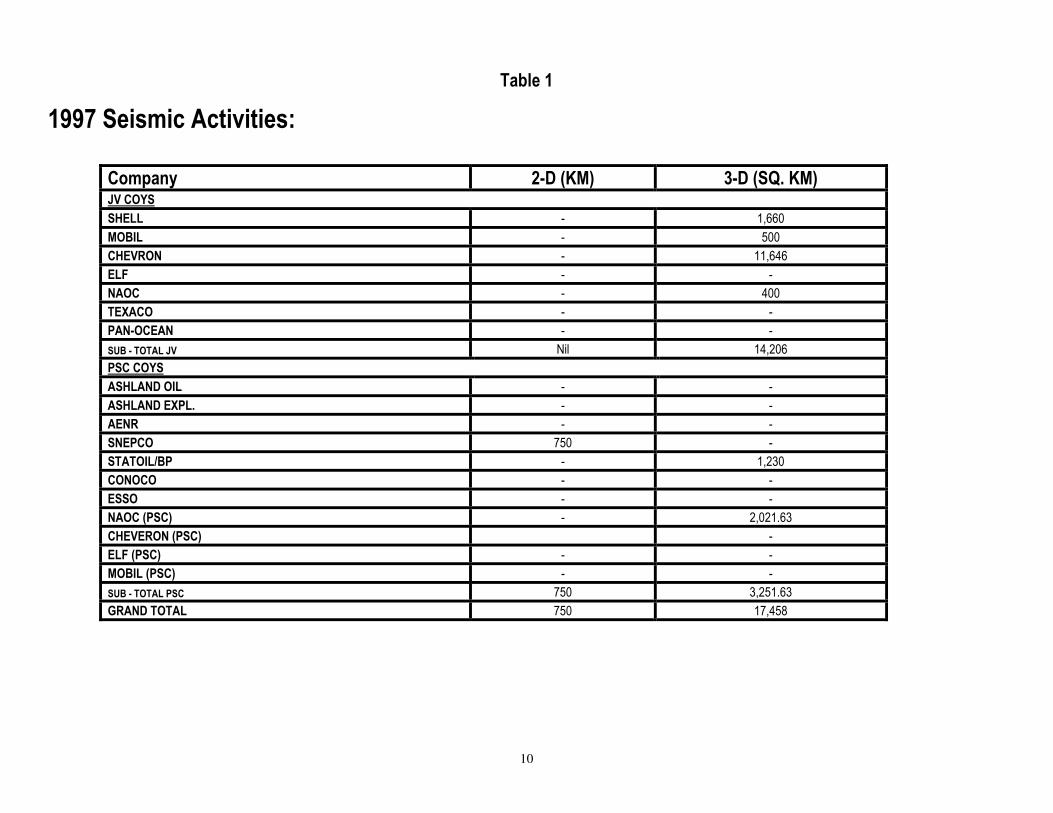
Geographical activities during the year were undertaken by four joint
ventures companies and two other oil companies that are operating
under production sharing contracts. Overall the companies acquired
a total 17,457.63 square kilometers of 3-D seismic data while a total
of 750 were covered under 2-D seismic survey.
Nigeria Agip Oil Company (NAOC) shot a total of 2,021.63 square
kilometers (3-D) seismic survey under production sharing contract
and 400 square kilometers operating under the joint ventureship. The
leading producing oil company, Shell Petroleum Development
Company (SPDC) shot a total of 1,660 square kilometers of seismic
activities.
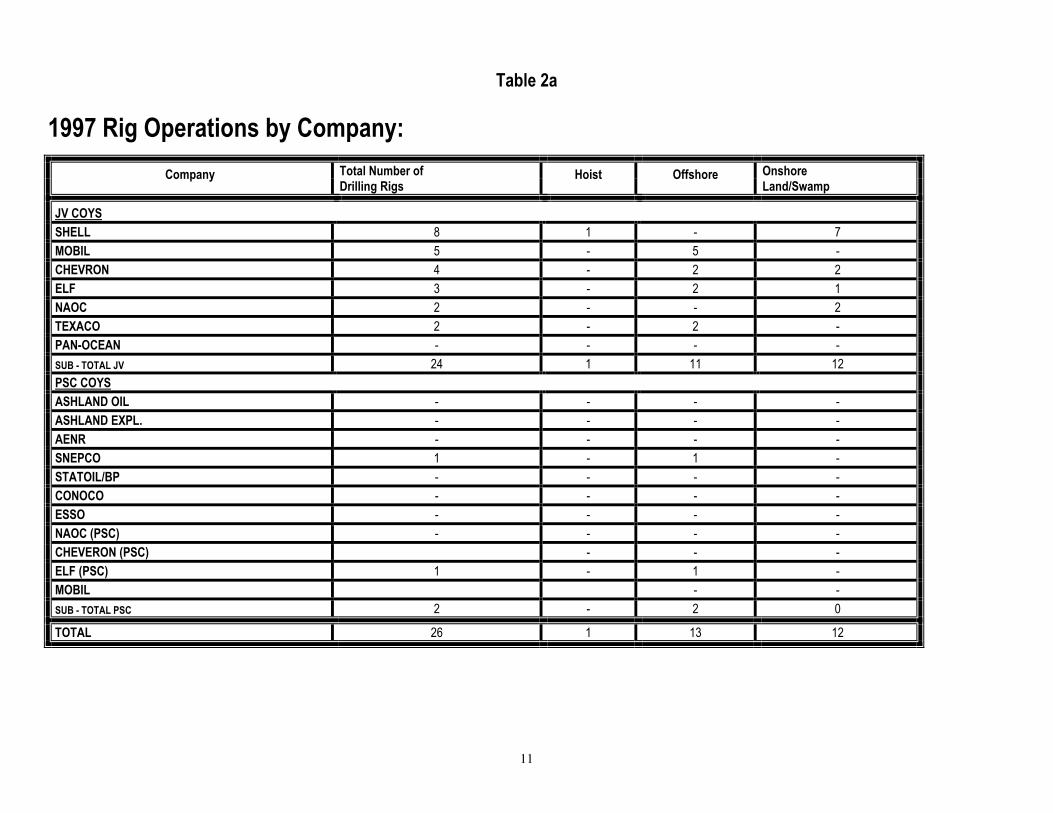
2. Drilling Activities
During the year under review a total number of 26 rigs were in
operations both offshore and onshore (Land/Swamp) terrain’s.
Thirteen (13) of the rigs were both for offshore drilling activities
while twelve (12) were involved in onshore drilling projects. The
remaining one ( 1 ) rig was used as hoist

5
A total of 155 wells were spudded involving twelve (12)
exploratory/completion, fourteen (14) appraisal, one hundred and
one (101) development wells, while the remaining twenty-eight (28)
wells were worked over.
Joint Venture Oil Companies were involved in the four areas of
drilling activities. In all, eight (8) exploratory, twelve (12) appraisal,
one hundred and one (101) development and twenty-eight (28)
worked-over wells were undertaken. The total wells spudded under
this arrangement stood at one hundred and forty-nine (149) wells.
Only six wells were spudded by companies operating under
production sharing contracts (PSC).
3. Crude Oil Production
Crude oil production, including Condensate, for the year stood at
855,736,287 barrels or an average of 2,344,483 barrels per day.
This figure shows an increase of 173,841,647 (20.3%) over that of
1996 which stood at 681.894,600 barrels or an average of
1,863,100 barrels per day.
Shell producing Development Company of Nigeria (SPDC)
Produces 328,118,620 barrels (898,955 b/d) which is about 38.34%
of all the production. SPDC is followed by Mobil 230,889,049
barrels (632,573 b/d), chevron 152,906,246 barrels (418,921 b/d),
NAOC 54,177,629 barrels (148,432b/d) in that order. Other
noticeable oil producers are Elf 5,857,103 barrels (118,907 b/d),
Texaco 3,839,099 barrels (77,939 b/d), Pan-Oceanic 171,320
6
barrels (3,478 b/d), NPDC 232,918 barrels (4,729 b/d) and
Connoco 398,050 barrels (8,081 b/d). shell, Mobil and chevron
produced about 83.19% of the total oil and Condensate produced
in 1997.
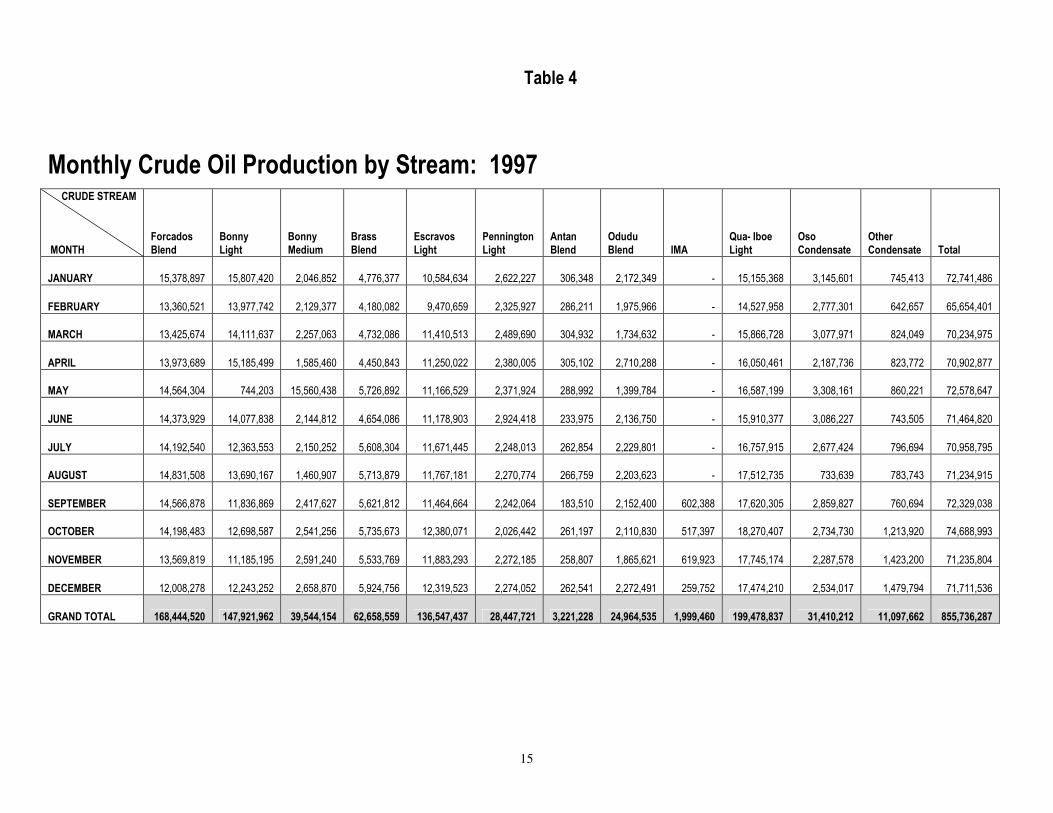
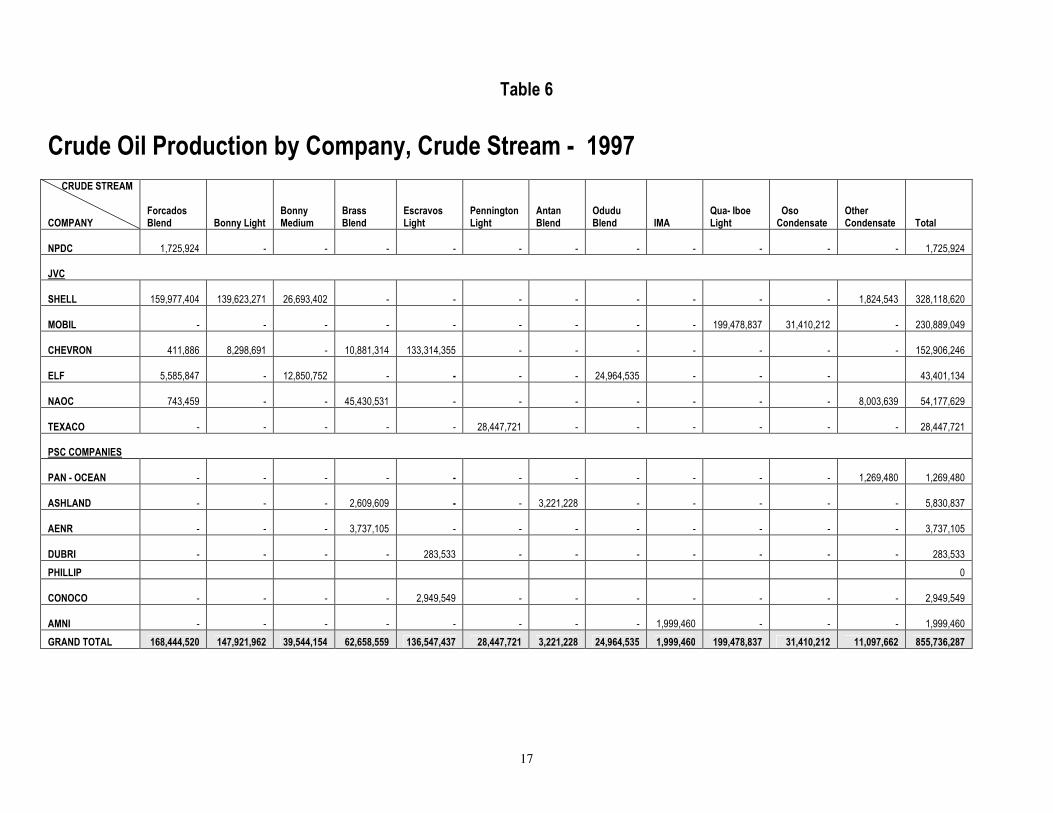
Qua Iboe light crude stream topped the list of all crude oil streams
with a total production of 199,478,837 barrels followed by Forcados
Blend with 168,444,520 barrels and Bonny Light with 147,921,962
barrels in that order.
Escravos Blend 136,547,437 barrels
Brass Blend 62,658,559 “
Bonny Medium 39,544,154 “
Pennington Light 28,447,721 “
Odudu Blend 24,964,535 “
The total production of the least crude oil stream Ima, which was
first produced in September 1997, stood at 1,999,460 barrels.
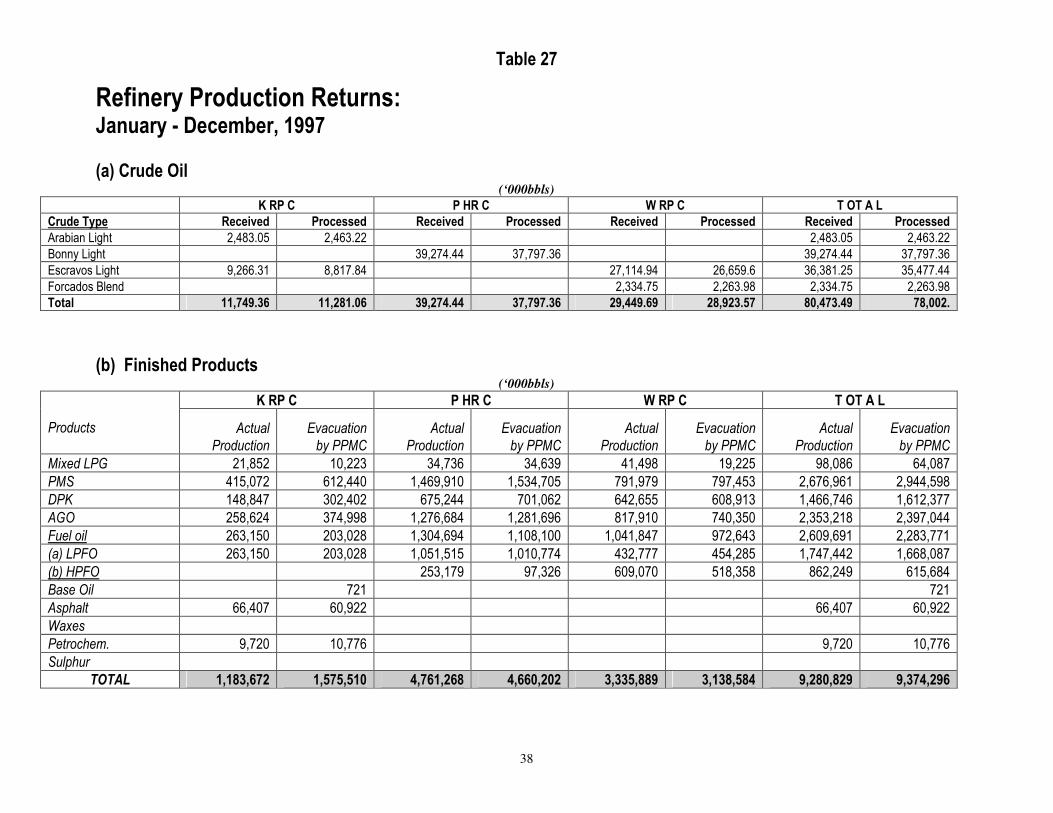
4. Domestic Refining
During the period under review, three local refineries made up of
WRPC, KRPC and PHRC received a total of 80,473,490 barrels, for
processing. This includes Bonny Light 39,274,440 barrels,
Escravos Light 36,381,250 barrels and Forcados Blend 2,334,750

7
barrels. Arab Light, which is foreign crude oil stream accounted for
2,463,220 barrels.
Refinery Crude Processed (bbl) Through Put (b/d)
Port-Harcourt 37,797,360 103,554
Warri 28,923,570 79,242
Kaduna 11,281,060 30,907
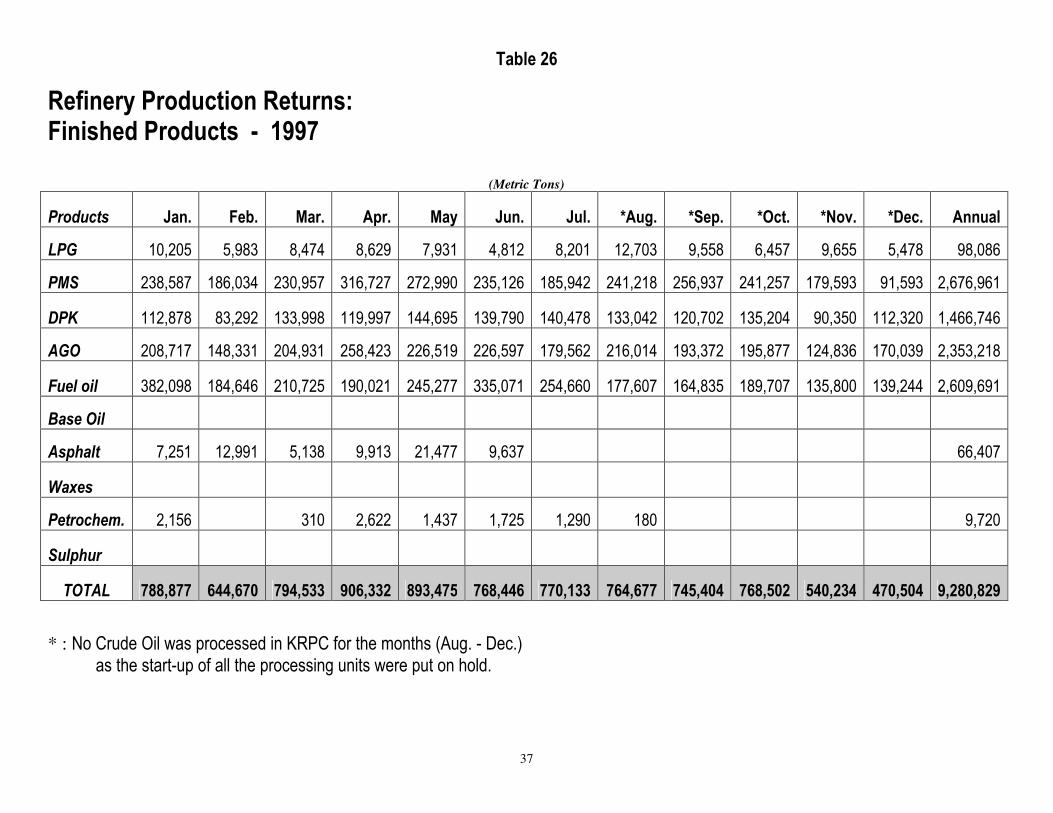
Total petroleum product produced by the three local refineries
amounted to 9,280 ,829 metric tonnes for the year 1997. Of this
PHRC produced 4,761,268 metric tonnes, WRPC 3,335,889 metric
tonnes while KRPC produced 1,183,672 metric tonnes of petroleum
products.
5. DOMESTIC Crude Oil Consumption
Crude oil supplies to local refineries were 80,473,490 barrels. A
total of 78,002,000 barrels was processed for local consumption.
PPMC Evacuated 9,374,296 metric tons (68,713,589 barrels) of
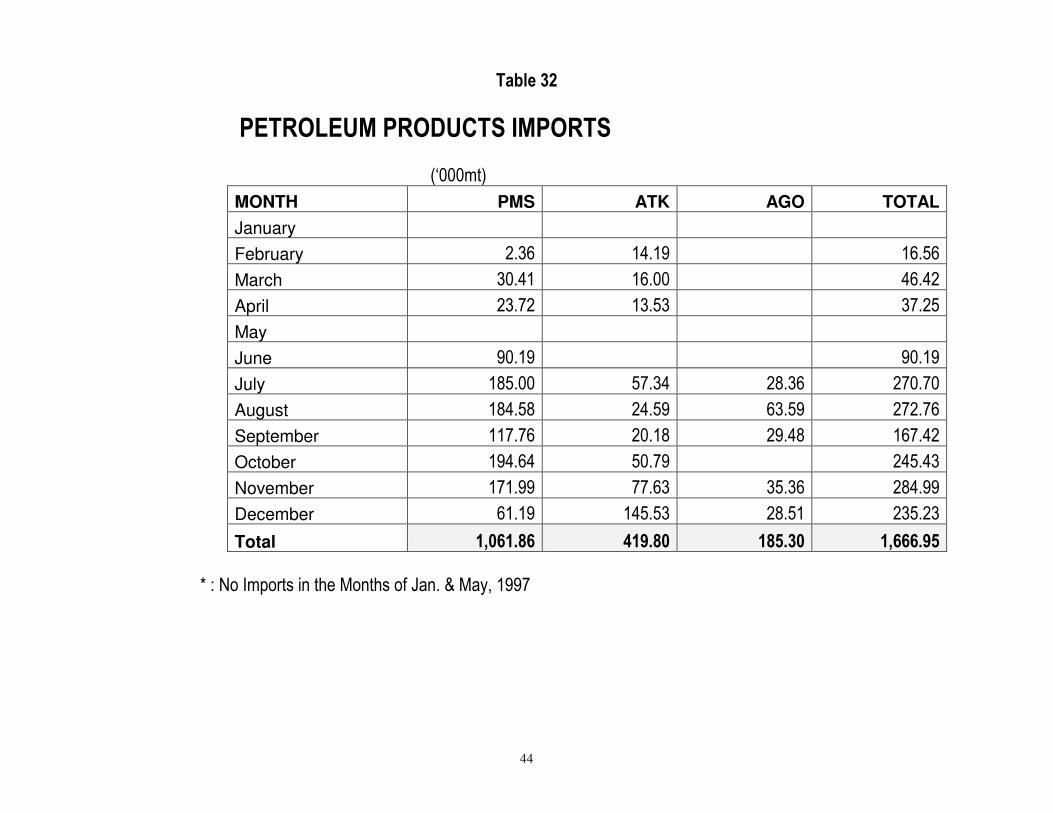
petroleum products from the refineries imported about 1,666,952
metric tons (12,218,758 barrels) in to the country. Hence a total of
11,041,248 metric tons of petroleum products were available
221,732 barrels per day.
Petroleum product delivered for local consumption through the
refineries are as follows:

8
Product Metric Tons
LPG 64,087
PMS 2,994,598
DPK 1,612,377
AGO 2,397,044
Fuel Oil (LPFO) 1,668,087
Fuel Oil(HPFO) 615,684
Base Oil 721
Asphalt 60,922
Petrochemicals 10,776
Total 1,666,952
Petroleum Products imported for local consumption are as follows:
Product Metric Tons PMS 1,061,856
TK 419,799
AGO 185,297
Total 1,666,952
6. Natural Gas Production and Disposal
Natural gas produced in association with oil during the year
amounted to 1,142 Bscf. Of this, 801.8 Bscf (70.21%) was flared,
while the remaining were re-jected, used as fuel, sold or converted to
NGL.
9
Natural gas sales were made both by Shell Development Producing
Company (SPDC) and Nigeria Gas Company (NGC), a subsidiary of
NNPC. SPDC made a total sale of 110.138 Bscf amounting to
772,224 million while NGC made a total sales of 1218.403 Bscf
amounting to 2.4768 billion Crude
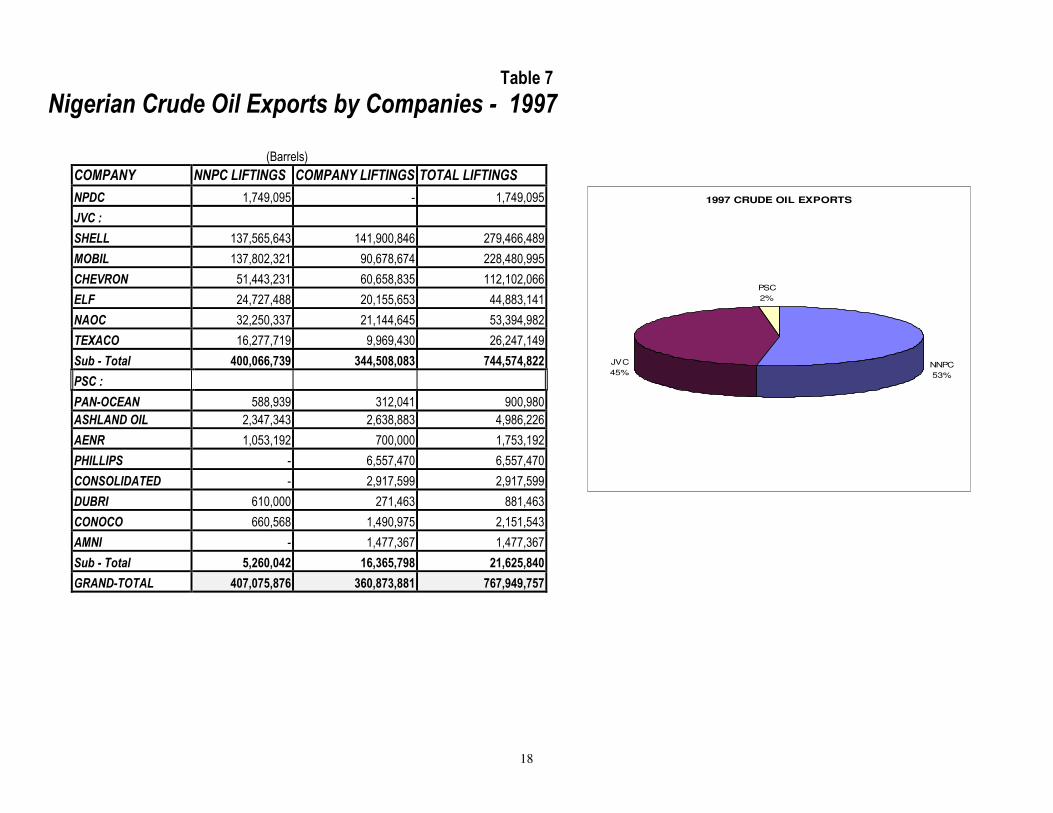
7. Oil Exports
Available oil statistic shows that crude oil exports stood at
767,949,757 barrels averaging 2,103,972 barrels per day. NNPC
equity crude oil exports total 392,279,889 barrels amounting to
$7,402,215,884 or 161,191,292,312.
10
Table 1
1997 Seismic Activities:
Company 2-D (KM) 3-D (SQ. KM) JV COYS
SHELL - 1,660
MOBIL - 500
CHEVRON - 11,646
ELF - -
NAOC - 400
TEXACO - -
PAN-OCEAN - -
SUB - TOTAL JV Nil 14,206
PSC COYS
ASHLAND OIL - -
ASHLAND EXPL. - -
AENR - -
SNEPCO 750 -
STATOIL/BP - 1,230
CONOCO - -
ESSO - -
NAOC (PSC) - 2,021.63
CHEVERON (PSC) -
ELF (PSC) - -
MOBIL (PSC) - -
SUB - TOTAL PSC 750 3,251.63
GRAND TOTAL 750 17,458
11
Table 2a
1997 Rig Operations by Company:
Total Number of Onshore Company Drilling Rigs
Hoist Offshore Land/Swamp
JV COYS
SHELL 8 1 - 7
MOBIL 5 - 5 -
CHEVRON 4 - 2 2
ELF 3 - 2 1
NAOC 2 - - 2
TEXACO 2 - 2 -
PAN-OCEAN - - - -
SUB - TOTAL JV 24 1 11 12
PSC COYS
ASHLAND OIL - - - -
ASHLAND EXPL. - - - -
AENR - - - -
SNEPCO 1 - 1 -
STATOIL/BP - - - -
CONOCO - - - -
ESSO - - - -
NAOC (PSC) - - - -
CHEVERON (PSC) - - -
ELF (PSC) 1 - 1 -
MOBIL - -
SUB - TOTAL PSC 2 - 2 0
TOTAL 26 1 13 12

12
Table 2b
1997 Drilling Summary by Company:
Company Exploratory/ Completion Appraisal Development Work over
JV COYS
SHELL 1 - 16 12
MOBIL 3 10 49 -
CHEVRON 2 - 25 5
ELF 1 - 4 -
NAOC 1 - 1 9
TEXACO - 2 6 -
PAN-OCEAN - - - 2
SUB - TOTAL JV 8 12 101 28
PSC COYS
ASHLAND OIL - - - -
ASHLAND EXPL. - 1 - -
AENR - - - -
SNEPCO - 1 - -
STATOIL/BP 1 - - -
CONOCO - - - -
ESSO - - - -
NAOC (PSC) - - - -
CHEVERON (PSC) - - - -
ELF (PSC) 2 - - -
MOBIL 1 - - -
SUB - TOTAL PSC 4 2 0 0
TOTAL 12 14 101 28

13
Table 2c
List of Indigenous License Holders, As at December 31, 1996
S/NO. NAME OF COMPANY LICENSE AWARD DATE
1 Dubri Oil OML 96 August,1987
2 Queens Petroleum OPL 135 November,1990
3 Cavendish Petroleum OPL 453 " "
4 Consolidate Oil OPL 113 " "
5 Express Oil & Gas OPL 74 " "
6 Summit Oil International OPLs 205 &206 " "
7 International Petrol Energy Co. (IPEC) OPLs229 & 202 " "
8 Paclantic Oil Co. OPL 204 " "
9 Inko Petroleum (Now Oriental Energy) OPL 224 " "
10 Ultramar Energy OPL 227 " "
11 Solgas (Nig.)Ltd. OPL 226 February, 1991
12 Atlas Petroleum OPL 75 " "
13 Supra Investment (Now Amalgamated OPLs 203 & 452 May/June, 1991
14 Union Square Petrogas OPL 201 " "
15 Seagull OPL 467 " "
16 Moncrief Oil International OPL471 " "
17 Yinka Folawiyo Petroleum OPL 309 " "
18 Alfred James Petroleum OPL 302 " "
19 General Oil OPL 304 " "
20 Allied Energy Resources OPL 210 June, 1992
21 Noreast Petroleum OPL 215 " "
22 AMNI Petroleum Dev.,Co. OPL 469 1993
23 Peak Petroleum OPL 460 1993
24 Intoil Nig. Ltd OPLs 214 & 237 1993
25 Optimum Petroleum OPL 310 "
26 Famfa Oil OPL 216 "
27 Azenith (Nig.) Ltd OPL 458 (?) "
28 Crescent Oil OPL 234 "
29 First Aries OPL 235 "
30 Asaris OPL 236 "
31 Petroleum Product Ltd OPL 233 "
32 Nyemoni Petroleum OPL 230 "
33 Sunlink Petroleum OPL 474 "
34 MLM Petroleum OPL 454 "
35 Mareena OML 12 "
36 Brass Petroleum OPL 203 "
37 Dunia Oil OPL 241 "
38 Lamont Oil OPL 207 "

14
Table 3
1997 Summary of Crude Oil Production by Companies
COMPANY
PRODUCTION bbls
m3
DAILY AVG. (BARREL)
% OF TOTAL PRODUCTION
NPDC 1,725,924 232,918 4,729 0.20
JV:
SHELL 328,118,620 44,280,516 898,955 38.34
MOBIL 230,889,049 31,159,116 632,573 26.98
CHEVRON 152,906,246 20,635,121 418,921 17.87
ELF 43,401,134 5,857,103 118,907 5.07
NAOC 54,177,629 7,311,421 148,432 6.33
TEXACO 28,447,721 3,839,099 77,939 3.32
Sub - Total 837,940,399 113,082,375
2,295,727 97.92
PSC:
PAN-OCEAN 1,269,480 171,320 3,478 0.15
ASHLAND OIL 5,830,837 786,888 15,975 0.68
AENR 3,737,105 504,333 10,239 0.44
DUBRI 283,533 38,264 777 0.03
CONOCO 2,949,549 398,050 8,081 0.34
AMNI 1,999,460 269,833 5,478 0.23
Sub - Total 16,069,964 2,168,686 44,027 1.88
GRAND- TOTAL 855,736,287 115,483,979 2,344,483 100.00
15
Table 4
Monthly Crude Oil Production by Stream: 1997
CRUDE STREAM MONTH
Forcados Blend
Bonny Light
Bonny Medium
Brass Blend
Escravos Light
Pennington Light
Antan Blend
Odudu Blend IMA
Qua- Iboe Light
Oso Condensate
Other Condensate Total
JANUARY 15,378,897
15,807,420
2,046,852
4,776,377
10,584,634
2,622,227
306,348
2,172,349 -
15,155,368
3,145,601
745,413 72,741,486
FEBRUARY
13,360,521
13,977,742
2,129,377
4,180,082
9,470,659
2,325,927
286,211
1,975,966 -
14,527,958
2,777,301
642,657 65,654,401
MARCH 13,425,674 14,111,637 2,257,063
4,732,086
11,410,513
2,489,690
304,932
1,734,632 -
15,866,728
3,077,971
824,049 70,234,975
APRIL
13,973,689
15,185,499
1,585,460
4,450,843
11,250,022
2,380,005
305,102
2,710,288 - 16,050,461 2,187,736
823,772 70,902,877
MAY 14,564,304 744,203
15,560,438 5,726,892 11,166,529
2,371,924
288,992
1,399,784 -
16,587,199
3,308,161
860,221 72,578,647
JUNE 14,373,929
14,077,838 2,144,812
4,654,086
11,178,903
2,924,418
233,975 2,136,750 -
15,910,377
3,086,227
743,505 71,464,820
JULY 14,192,540
12,363,553
2,150,252 5,608,304
11,671,445
2,248,013
262,854
2,229,801 -
16,757,915
2,677,424 796,694 70,958,795
AUGUST
14,831,508
13,690,167
1,460,907
5,713,879
11,767,181 2,270,774
266,759
2,203,623 -
17,512,735
733,639
783,743 71,234,915
SEPTEMBER
14,566,878
11,836,869
2,417,627
5,621,812
11,464,664
2,242,064
183,510
2,152,400
602,388
17,620,305
2,859,827
760,694 72,329,038
OCTOBER
14,198,483
12,698,587
2,541,256
5,735,673
12,380,071
2,026,442
261,197
2,110,830
517,397
18,270,407
2,734,730 1,213,920 74,688,993
NOVEMBER
13,569,819
11,185,195
2,591,240 5,533,769
11,883,293
2,272,185 258,807
1,865,621
619,923
17,745,174
2,287,578
1,423,200 71,235,804
DECEMBER
12,008,278
12,243,252
2,658,870 5,924,756
12,319,523
2,274,052
262,541
2,272,491
259,752
17,474,210
2,534,017
1,479,794 71,711,536
GRAND TOTAL 168,444,520 147,921,962 39,544,154 62,658,559 136,547,437 28,447,721 3,221,228 24,964,535 1,999,460 199,478,837 31,410,212 11,097,662 855,736,287

16
Table 5
Monthly Crude Oil Production by Company: 1997
MONTH COMPANY January February March April May June July August September October November December Total
NPDC 119,753 104,600
106,251
98,670
98,875
120,070
119,553
121,710
190,525
204,104
211,617
215,043 1,710,771
JVC
SHELL 29,835,838 26,478,154 26,667,567 27,684,633
28,908,984
27,685,491
26,472,297
28,247,372
26,834,809
27,799,109
26,017,965
25,486,401 328,118,620
MOBIL 18,300,969
17,305,259
18,944,699
18,238,197
19,895,360
18,996,604
19,435,339
18,246,374
20,480,132 21,005,137 20,032,752
20,008,227 230,889,049
CHEVRON 11,948,263 10,666,002 12,788,237 12,617,377 12,653,154
12,573,669
13,023,524
13,063,657
12,810,793
13,762,708
13,214,803
13,784,059 152,906,246
ELF 3,872,388 3,438,781 3,286,656
4,252,579
2,895,976
3,748,272
3,980,499 3,491,949
3,621,558
3,655,422
3,346,332
3,810,722 43,401,134
NAOC 4,708,166 4,134,193
4,675,737 4,416,109
4,570,858
4,310,884
4,530,751
4,615,580
4,492,050
4,586,639
4,437,944 4,698,718 54,177,629
TEXACO 2,622,227
2,325,927
2,489,690
2,380,005
2,371,924 2,924,418
2,248,013
2,270,774
2,242,064
2,026,442
2,272,185
2,274,052 28,447,721
PSC COMPANIES
PAN - OCEAN 75,202
63,037
75,167
79,159
88,318
93,626
122,017
127,573
132,951
134,253
132,268 145,909 1,269,480
ASHLAND 533,810
499,296
535,526 527,082
512,887
446,090 482,534
493,228
398,016
477,652
456,892
467,824 5,830,837
AENR 326,584
278,795
320,608 309,576
320,464
314,343
298,374
323,253
310,569
316,903
301,323
316,313 3,737,105
DUBRI 30,648
27,702
34,533
28,849 9,231
20,528
23,302
24,228
23,392
17,923
22,574
20,623 283,533
CONOCO 367,638
317,502
310,304
270,641 252,616
230,825
222,592
209,217
189,791
185,304
169,226
223,893 2,949,549
AMNI -
-
-
-
-
-
-
-
602,388
517,397
619,923
259,752 1,999,460
GRAND TOTAL 72,741,486 65,639,248 70,234,975 70,902,877 72,578,647 71,464,820 70,958,795 71,234,915 72,329,038 74,688,993 71,235,804 71,711,536 855,721,134
17
Table 6
Crude Oil Production by Company, Crude Stream - 1997
CRUDE STREAM
COMPANY Forcados Blend Bonny Light
Bonny Medium
Brass Blend
Escravos Light
Pennington Light
Antan Blend
Odudu Blend IMA
Qua- Iboe Light
Oso Condensate
Other Condensate Total
NPDC 1,725,924 -
-
-
-
-
-
-
-
-
- - 1,725,924
JVC
SHELL 159,977,404 139,623,271 26,693,402 -
-
-
-
-
-
-
-
1,824,543 328,118,620
MOBIL -
-
-
-
-
-
-
-
- 199,478,837 31,410,212 - 230,889,049
CHEVRON 411,886 8,298,691 - 10,881,314 133,314,355
-
-
-
-
-
- - 152,906,246
ELF 5,585,847 - 12,850,752
-
-
-
- 24,964,535
-
-
- 43,401,134
NAOC 743,459 -
- 45,430,531
-
-
-
-
-
-
- 8,003,639 54,177,629
TEXACO -
-
-
-
- 28,447,721
-
-
-
-
- - 28,447,721
PSC COMPANIES
PAN - OCEAN -
-
-
-
-
-
-
-
-
-
- 1,269,480 1,269,480
ASHLAND -
-
- 2,609,609
-
- 3,221,228
-
-
-
- - 5,830,837
AENR -
-
- 3,737,105
-
-
-
-
-
-
- - 3,737,105
DUBRI -
-
-
- 283,533
-
-
-
-
-
- - 283,533
PHILLIP 0
CONOCO -
-
-
- 2,949,549
-
-
-
-
-
- - 2,949,549
AMNI -
-
-
-
-
-
-
-
1,999,460
-
- - 1,999,460
GRAND TOTAL 168,444,520 147,921,962 39,544,154 62,658,559 136,547,437 28,447,721 3,221,228 24,964,535 1,999,460 199,478,837 31,410,212 11,097,662 855,736,287
18
Table 7
Nigerian Crude Oil Exports by Companies - 1997 (Barrels)
COMPANY NNPC LIFTINGS COMPANY LIFTINGS TOTAL LIFTINGS
NPDC 1,749,095 - 1,749,095
JVC :
SHELL 137,565,643 141,900,846 279,466,489
MOBIL 137,802,321 90,678,674 228,480,995
CHEVRON 51,443,231 60,658,835 112,102,066
ELF 24,727,488 20,155,653 44,883,141
NAOC 32,250,337 21,144,645 53,394,982
TEXACO 16,277,719 9,969,430 26,247,149
Sub - Total 400,066,739 344,508,083 744,574,822
PSC :
PAN-OCEAN 588,939 312,041 900,980
ASHLAND OIL 2,347,343 2,638,883 4,986,226
AENR 1,053,192 700,000 1,753,192
PHILLIPS - 6,557,470 6,557,470
CONSOLIDATED - 2,917,599 2,917,599
DUBRI 610,000 271,463 881,463
CONOCO 660,568 1,490,975 2,151,543
AMNI - 1,477,367 1,477,367
Sub - Total 5,260,042 16,365,798 21,625,840
GRAND-TOTAL 407,075,876 360,873,881 767,949,757
1997 CRUDE OIL EXPORTS
NNPC
53%
JVC
45%
PSC
2%
19
Table 8 Nigeria Crude Oil Exports by Destination - 1997
REGION / COUNTRY QUANTITY (bbls)
NORTH AMERICA:
Canada 8,490,080
U.S.A 323,518,259
Sub-Total 332,008,339
SOUTH AMERICA:
Argentina 1,549,844
Brazil 26,338,418
Chile 5,671,708
Sub-Total 33,559,970
EUROPE:
Germany 13,169,585
France 49,444,313
Italy 47,043,388
Netherlands 15,749,449
Portugal 21,375,547
Spain 62,983,845
Sweden 1,038,785
United Kingdom 1,907,895
Sub-Total 212,712,807
ASIA & FAR EAST:
Australia 1,160,582
Japan 7,244,000
Singapore 7,301,338
India 55,902,715
Indonesia 5,506,343
Korea 43,447,305
China 912,267
Taiwan 14,243,530
Sub-Total 135,718,080
AFRICA:
Ghana 1,968,170
Ivory Coast 19,721,181
Senegal 4,991,786
Morocco 9,350,768
Cameroun 4,891,443
South Africa 11,208,570
Sub-Total 52,131,918
Others 1,818,643
GRAND-TOTAL 767,949,757
-
50
100
150
200
250
300
350
mb
bls
NORTH
AMERICA
SOUTH
AMERICA
EUROPE ASIA &
FAR
EAST
AFRICA OTHERS
Region
1997 Crude Oil Export by Destination

20
Table 9
Analysis of Crude Oil Production and Exports By Companies for the Year 1997
COMPANY PRODUCTION EXPORTS VARIANCE
NPDC 1,725,924 1,749,095 (23,171)
JVC :
SHELL 328,118,620 279,466,489 48,652,131
MOBIL 230,889,049 228,480,995 2,408,054
CHEVRON 152,906,246 112,102,066 40,804,180
ELF 43,401,134 44,883,141 (1,482,007)
NAOC 54,177,629 53,394,982 782,647
TEXACO 28,447,721 26,247,149 2,200,572
Sub - Total 837,940,399 744,574,822 1,582,515,221
PSC :
PAN-OCEAN 1,269,480 900,980 368,500
ASHLAND OIL 5,830,837 4,986,226 844,611
AENR 3,737,105 1,753,192 1,983,913
PHILLIPS - 6,557,470 (6,557,470)
CONSOLIDATED - 2,917,599 (2,917,599)
DUBRI 283,533 881,463 (597,930)
CONOCO 2,949,549 2,151,543 798,006
AMNI 1,999,460 1,477,367 522,093
Sub - Total 16,069,964 21,625,840 (5,555,876)
GRAND-TOTAL 855,736,287 767,949,757 1,576,936,174
21
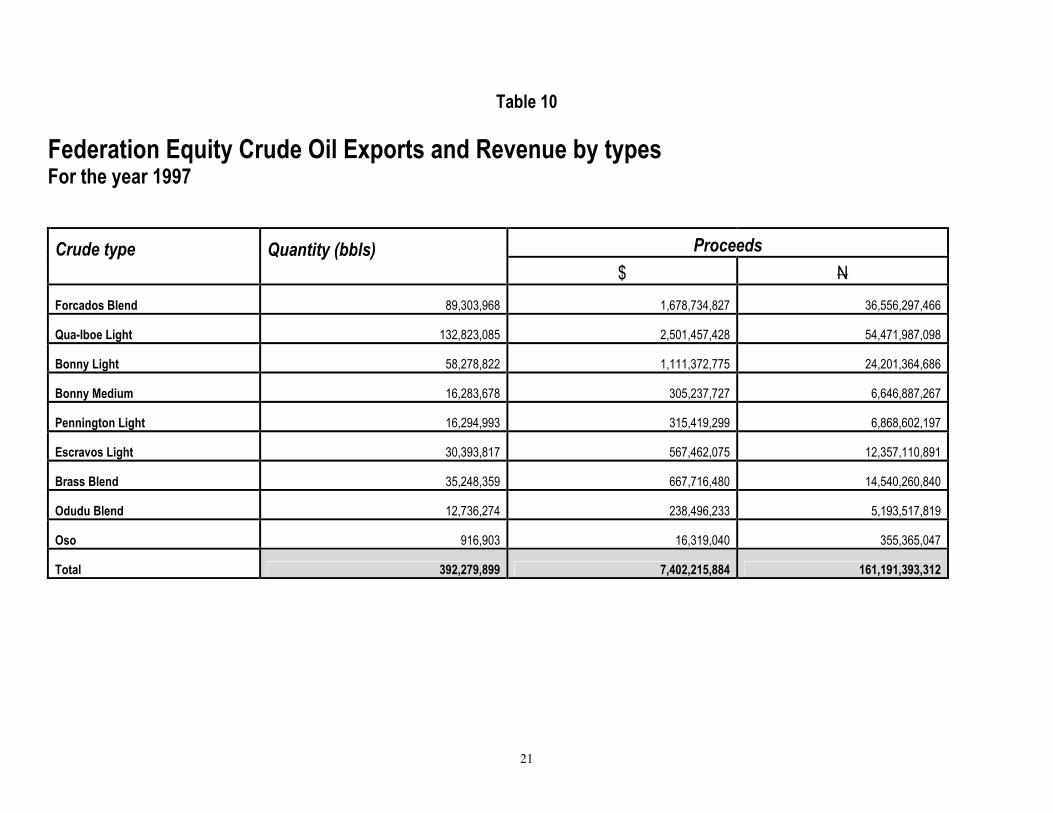
Table 10
Federation Equity Crude Oil Exports and Revenue by types For the year 1997
Proceeds Crude type
Quantity (bbls) $ N
Forcados Blend 89,303,968 1,678,734,827 36,556,297,466
Qua-Iboe Light 132,823,085 2,501,457,428 54,471,987,098
Bonny Light 58,278,822 1,111,372,775 24,201,364,686
Bonny Medium 16,283,678 305,237,727 6,646,887,267
Pennington Light 16,294,993 315,419,299 6,868,602,197
Escravos Light 30,393,817 567,462,075 12,357,110,891
Brass Blend 35,248,359 667,716,480 14,540,260,840
Odudu Blend 12,736,274 238,496,233 5,193,517,819
Oso 916,903 16,319,040 355,365,047
Total 392,279,899 7,402,215,884 161,191,393,312

22
TABLE 11
Total Crude Oil Revenue Flow January - December 1997 (US$ million)
Joint Venture Month
NNPC PPT ROYALTIES OTHERS
Total
January
765.78 319.18 120.41 14.99 1,220.36
February
781.30 356.37 156.31 7.00 1,300.98
March
490.13 391.60 130.49 11.13 1,023.35
April
700.35 167.94 138.97 9.05 1,016.31
May
601.23 184.53 123.98 6.37 916.11
June
676.04 226.08 109.67 25.34 1,037.13
July
589.95 200.00 103.32 17.63 910.90
August
676.60 204.36 104.01 7.32 992.29
September
546.54 164.45 85.27 16.96 813.22
October
582.79 192.09 83.59 11.09 869.56
November
520.30 266.35 123.15 18.60 928.40
December
645.71 341.27 174.16 8.26 1,169.40
TOTAL
7,576.72 3,014.22 1,453.33 153.74 12,198.01
23
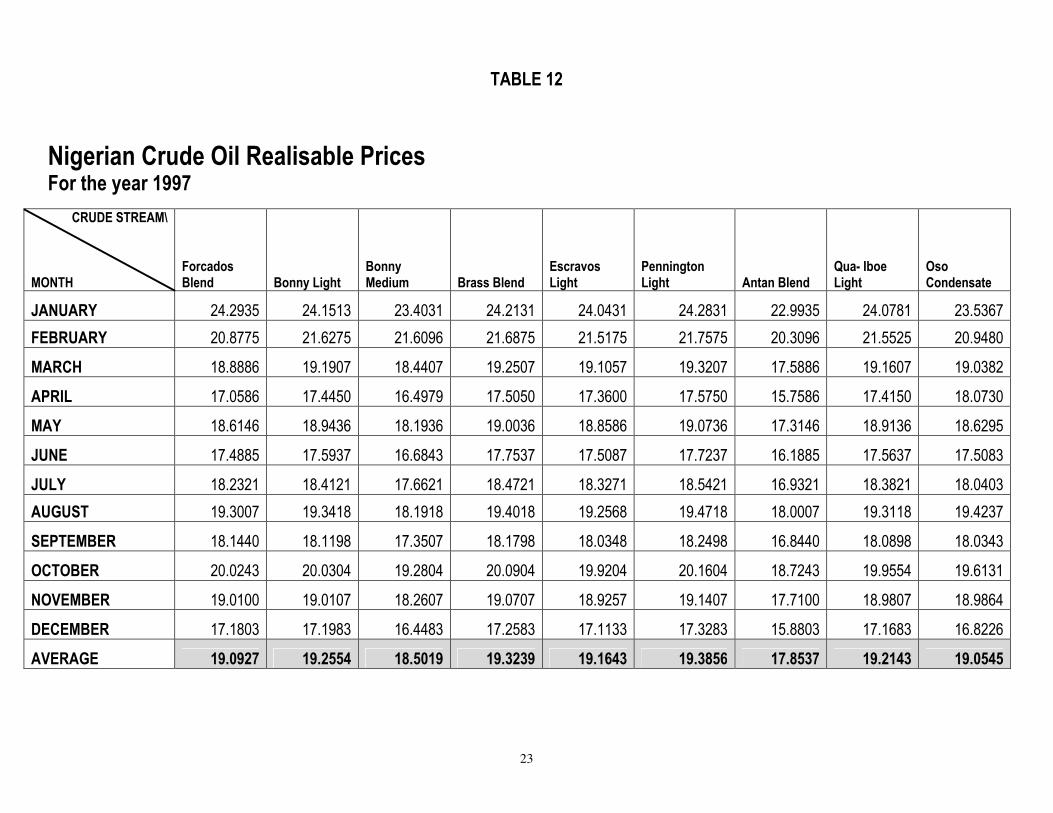
TABLE 12
Nigerian Crude Oil Realisable Prices For the year 1997
CRUDE STREAM\ MONTH
Forcados Blend Bonny Light
Bonny Medium Brass Blend
Escravos Light
Pennington Light Antan Blend
Qua- Iboe Light
Oso Condensate
JANUARY 24.2935 24.1513 23.4031 24.2131 24.0431 24.2831 22.9935 24.0781 23.5367
FEBRUARY 20.8775 21.6275 21.6096 21.6875 21.5175 21.7575 20.3096 21.5525 20.9480
MARCH 18.8886 19.1907 18.4407 19.2507 19.1057 19.3207 17.5886 19.1607 19.0382
APRIL 17.0586 17.4450 16.4979 17.5050 17.3600 17.5750 15.7586 17.4150 18.0730
MAY 18.6146 18.9436 18.1936 19.0036 18.8586 19.0736 17.3146 18.9136 18.6295
JUNE 17.4885 17.5937 16.6843 17.7537 17.5087 17.7237 16.1885 17.5637 17.5083
JULY 18.2321 18.4121 17.6621 18.4721 18.3271 18.5421 16.9321 18.3821 18.0403
AUGUST 19.3007 19.3418 18.1918 19.4018 19.2568 19.4718 18.0007 19.3118 19.4237
SEPTEMBER 18.1440 18.1198 17.3507 18.1798 18.0348 18.2498 16.8440 18.0898 18.0343
OCTOBER 20.0243 20.0304 19.2804 20.0904 19.9204 20.1604 18.7243 19.9554 19.6131
NOVEMBER 19.0100 19.0107 18.2607 19.0707 18.9257 19.1407 17.7100 18.9807 18.9864
DECEMBER 17.1803 17.1983 16.4483 17.2583 17.1133 17.3283 15.8803 17.1683 16.8226
AVERAGE 19.0927 19.2554 18.5019 19.3239 19.1643 19.3856 17.8537 19.2143 19.0545
24
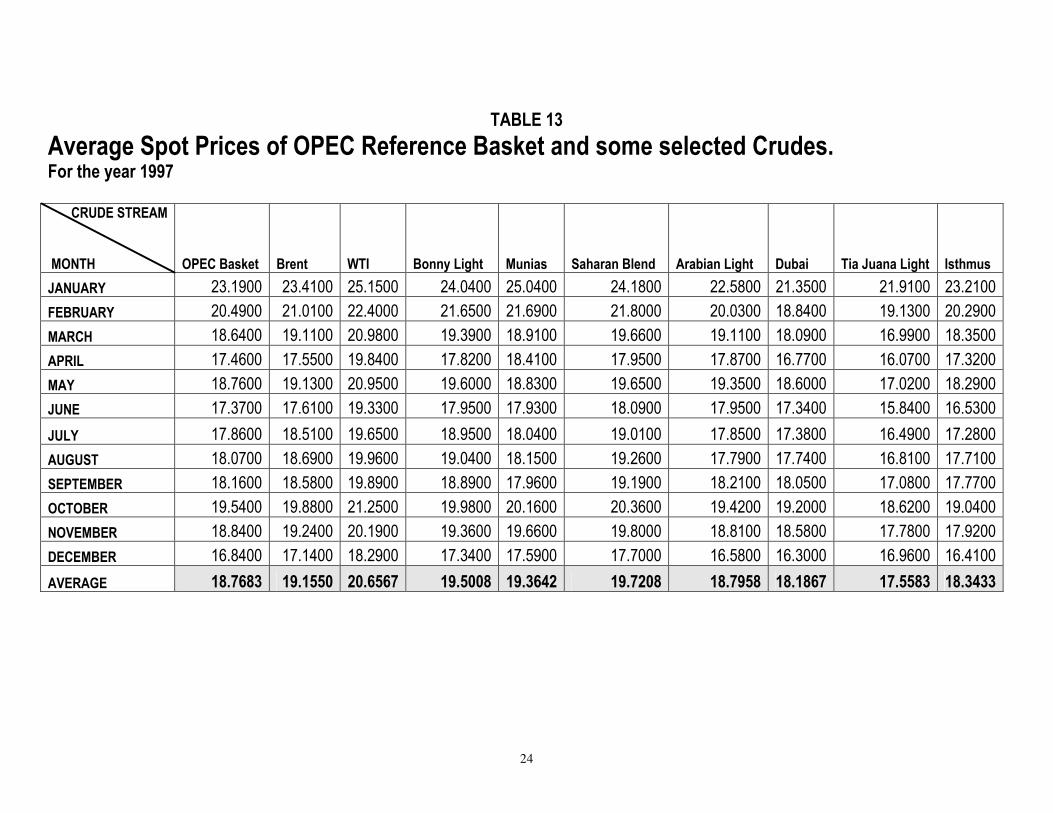
TABLE 13
Average Spot Prices of OPEC Reference Basket and some selected Crudes. For the year 1997
CRUDE STREAM MONTH OPEC Basket Brent WTI Bonny Light Munias Saharan Blend Arabian Light Dubai Tia Juana Light Isthmus
JANUARY 23.1900 23.4100 25.1500 24.0400 25.0400 24.1800 22.5800 21.3500 21.9100 23.2100
FEBRUARY 20.4900 21.0100 22.4000 21.6500 21.6900 21.8000 20.0300 18.8400 19.1300 20.2900
MARCH 18.6400 19.1100 20.9800 19.3900 18.9100 19.6600 19.1100 18.0900 16.9900 18.3500
APRIL 17.4600 17.5500 19.8400 17.8200 18.4100 17.9500 17.8700 16.7700 16.0700 17.3200
MAY 18.7600 19.1300 20.9500 19.6000 18.8300 19.6500 19.3500 18.6000 17.0200 18.2900
JUNE 17.3700 17.6100 19.3300 17.9500 17.9300 18.0900 17.9500 17.3400 15.8400 16.5300
JULY 17.8600 18.5100 19.6500 18.9500 18.0400 19.0100 17.8500 17.3800 16.4900 17.2800
AUGUST 18.0700 18.6900 19.9600 19.0400 18.1500 19.2600 17.7900 17.7400 16.8100 17.7100
SEPTEMBER 18.1600 18.5800 19.8900 18.8900 17.9600 19.1900 18.2100 18.0500 17.0800 17.7700
OCTOBER 19.5400 19.8800 21.2500 19.9800 20.1600 20.3600 19.4200 19.2000 18.6200 19.0400
NOVEMBER 18.8400 19.2400 20.1900 19.3600 19.6600 19.8000 18.8100 18.5800 17.7800 17.9200
DECEMBER 16.8400 17.1400 18.2900 17.3400 17.5900 17.7000 16.5800 16.3000 16.9600 16.4100
AVERAGE 18.7683 19.1550 20.6567 19.5008 19.3642 19.7208 18.7958 18.1867 17.5583 18.3433
25
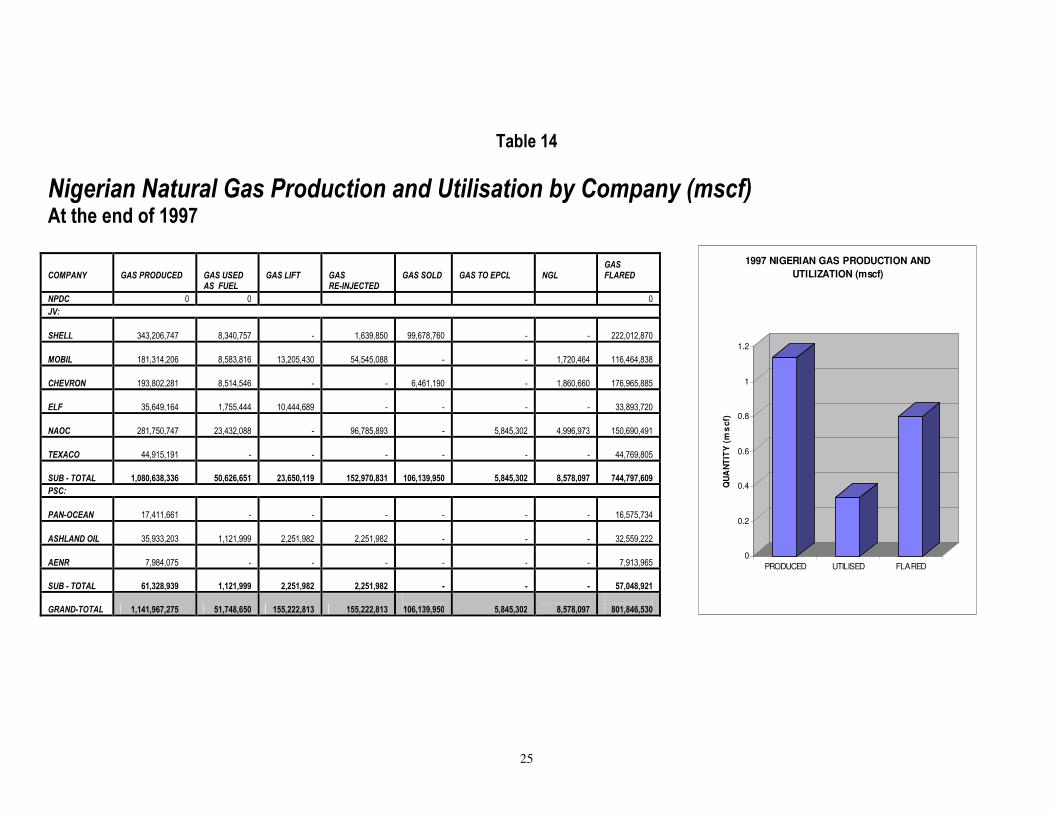
Table 14
Nigerian Natural Gas Production and Utilisation by Company (mscf) At the end of 1997
COMPANY
GAS PRODUCED
GAS USED AS FUEL
GAS LIFT
GAS RE-INJECTED
GAS SOLD
GAS TO EPCL
NGL
GAS FLARED
NPDC 0 0 0
JV:
SHELL 343,206,747 8,340,757 - 1,639,850
99,678,760 - -
222,012,870
MOBIL 181,314,206 8,583,816 13,205,430 54,545,088 - -
1,720,464
116,464,838
CHEVRON 193,802,281 8,514,546 - -
6,461,190 -
1,860,660
176,965,885
ELF 35,649,164 1,755,444 10,444,689 - - -
-
33,893,720
NAOC 281,750,747 23,432,088 - 96,785,893 - 5,845,302
4,996,973
150,690,491
TEXACO 44,915,191 - - - - -
-
44,769,805
SUB - TOTAL 1,080,638,336 50,626,651 23,650,119 152,970,831
106,139,950 5,845,302
8,578,097
744,797,609
PSC:
PAN-OCEAN 17,411,661 - - - - -
-
16,575,734
ASHLAND OIL 35,933,203 1,121,999 2,251,982 2,251,982 - -
-
32,559,222
AENR 7,984,075 - - - - -
-
7,913,965
SUB - TOTAL 61,328,939 1,121,999 2,251,982 2,251,982 - -
-
57,048,921
GRAND-TOTAL 1,141,967,275 51,748,650 155,222,813 155,222,813
106,139,950 5,845,302
8,578,097
801,846,530
0
0.2
0.4
0.6
0.8
1
1.2
QU
AN
TIT
Y (
ms
cf)
PRODUCED UTILISED FLARED
1997 NIGERIAN GAS PRODUCTION AND
UTILIZATION (mscf)
26
Table 15
1997 Shell Gas Sales Statistics Customer Volume (scf) Proceeds (=N=)
Aba Textile Mills 32,588,725.00 4,780,091.40
Delta Glass Company 896,959,341.00 132,696,164.90
INT. Equitable Assoc., ABA 148,531,112.00 21,733,345.11
Lever Brothers, ABA 127,879,985.00 20,586,583.31
Nigerian Breweries 47,968,396.00 7,493,986.44
NEPA, AFAM 3,458,117,722.00 31,934,862.61
NEPA, Ughelli 4,399,502,465.00 39,507,532.14
NNPC - NAFCON 13,780,924,487.00 68,631,157.62
NGC - ALSCON 5,021,397,253.00 80,853,063.56
NNPC - NEPA, Sepele(OBEN) 18,313,120,930.00 54,815,322.06
NGC - NEPA, Sapele 5,825,664,161.00 18,292,585.46
NNPC - NGC, Benin City 56,409,687,923.00 170,229,012.89
PZ Industries LTD., ABA 335,249,314.00 49,167,348.96
Rivers State Utility Board 720,209,740.00 69,581,520.91
RSUB Imiringi 620,151,391.00 1,921,203.37
Grand Total 110,137,952,945.00 772,223,780.74
Note: NNPC (55.00%), SHELL (30.00%), ELF (10.00%) & AGIP (5.00%).
27
Table 16
1997 NGC Gas Sales Statistics
Buyer Volume (bscf) Proceeds (=N= million)
Alscon Ikot Abasi 4.160 170.571
ASCL Ajaokuta - 0.004
DSCL Aladja 0.009 0.078
Igil Aba 0.185 25.403
NAFCON Onne 13.901 178.347
NEPA, Afam IV 2.904 26.078
NEPA, Delta IV 14.615 131.245
NEPA, Egbin 59.611 535.310
NEPA, Sapele 20.305 182.339
WAPCO Ewokoro 3.176 464.040
WAPCO Shagamu 5.708 719.264
WRPC, Warri 3.829 34.882
Grand Total 128.403 2,467.561

28
Table 17
Nigerian Crude Oil Reserves and Production Ratio 1961 - 1997 (Barrels)
Year Reserve(million) Production('000) R/P
1961 300 16,802 17.9
1962 400 24,624 16.2
1963 500 27,913 17.9
1964 1,000 43,997 22.7
1965 3,000 99,354 30.2
1966 3,500 152,428 23.0
1967 3,550 116,553 30.5
1968 4,000 51,907 77.1
1969 5,000 197,204 25.4
1970 9,300 395,836 23.5
1971 11,680 558,879 20.9
1972 15,000 665,283 22.5
1973 20,000 750,452 26.7
1974 20,900 823,321 25.4
1975 20,200 651,509 31.0
1976 19,445 758,058 25.7
1977 18,700 766,054 24.4
1978 18,200 692,269 26.3
1979 17,400 841,227 20.7
1980 16,700 752,223 22.2
1981 16,500 525,501 31.4
1982 16,750 470,687 35.6
1983 16,550 450,975 36.7
1984 16,650 507,999 32.8
1985 16,600 547,090 30.3
1986 16,066 535,297 30.0
1987 15,980 482,886 33.1
1988 16,000 490,440 32.6
1989 16,000 626,450 25.5
1990 17,100 630,246 27.1
1991 20,000 690,982 28.9
1992 20,991 716,262 29.3
1993 20,991 695,398 30.2
1994 20,991 664,629 31.6
1995 20,828 672,549 31.0
1996 20,828 681,895 30.5
* 1997 22,000 855,001 25.7
* Provisional
29
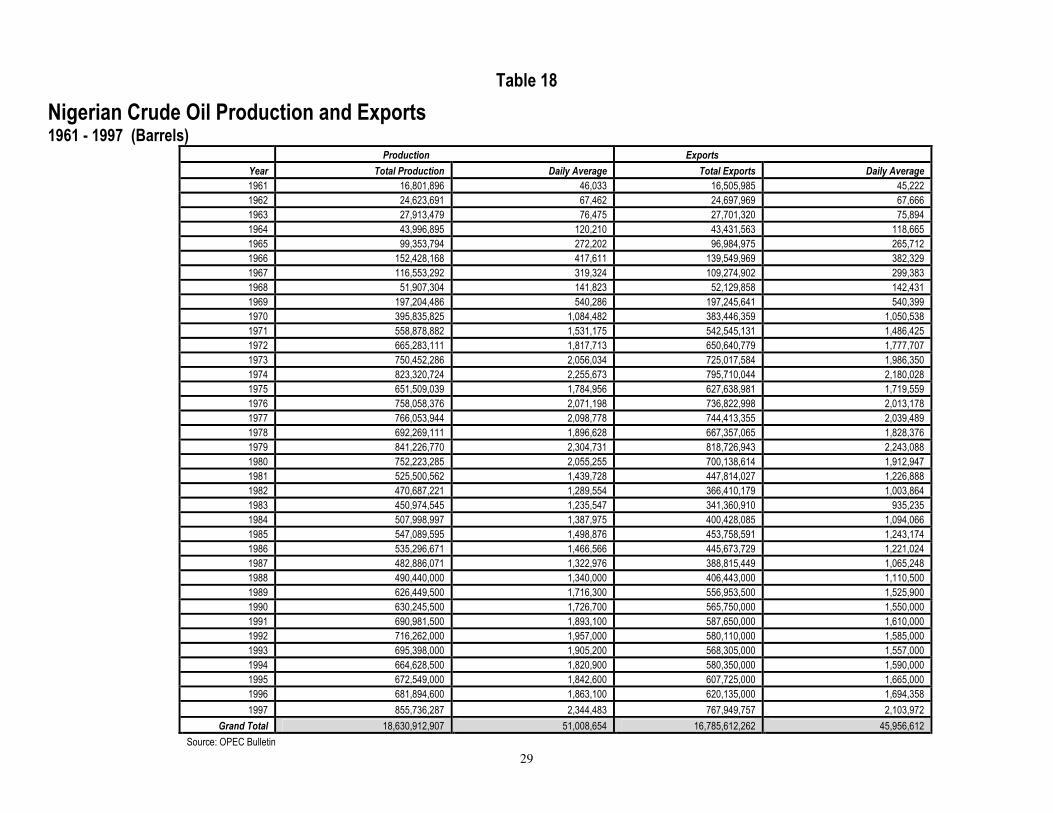
Table 18
Nigerian Crude Oil Production and Exports 1961 - 1997 (Barrels)
Production Exports
Year Total Production Daily Average Total Exports Daily Average
1961 16,801,896 46,033 16,505,985 45,222
1962 24,623,691 67,462 24,697,969 67,666
1963 27,913,479 76,475 27,701,320 75,894
1964 43,996,895 120,210 43,431,563 118,665
1965 99,353,794 272,202 96,984,975 265,712
1966 152,428,168 417,611 139,549,969 382,329
1967 116,553,292 319,324 109,274,902 299,383
1968 51,907,304 141,823 52,129,858 142,431
1969 197,204,486 540,286 197,245,641 540,399
1970 395,835,825 1,084,482 383,446,359 1,050,538
1971 558,878,882 1,531,175 542,545,131 1,486,425
1972 665,283,111 1,817,713 650,640,779 1,777,707
1973 750,452,286 2,056,034 725,017,584 1,986,350
1974 823,320,724 2,255,673 795,710,044 2,180,028
1975 651,509,039 1,784,956 627,638,981 1,719,559
1976 758,058,376 2,071,198 736,822,998 2,013,178
1977 766,053,944 2,098,778 744,413,355 2,039,489
1978 692,269,111 1,896,628 667,357,065 1,828,376
1979 841,226,770 2,304,731 818,726,943 2,243,088
1980 752,223,285 2,055,255 700,138,614 1,912,947
1981 525,500,562 1,439,728 447,814,027 1,226,888
1982 470,687,221 1,289,554 366,410,179 1,003,864
1983 450,974,545 1,235,547 341,360,910 935,235
1984 507,998,997 1,387,975 400,428,085 1,094,066
1985 547,089,595 1,498,876 453,758,591 1,243,174
1986 535,296,671 1,466,566 445,673,729 1,221,024
1987 482,886,071 1,322,976 388,815,449 1,065,248
1988 490,440,000 1,340,000 406,443,000 1,110,500
1989 626,449,500 1,716,300 556,953,500 1,525,900
1990 630,245,500 1,726,700 565,750,000 1,550,000
1991 690,981,500 1,893,100 587,650,000 1,610,000
1992 716,262,000 1,957,000 580,110,000 1,585,000
1993 695,398,000 1,905,200 568,305,000 1,557,000
1994 664,628,500 1,820,900 580,350,000 1,590,000
1995 672,549,000 1,842,600 607,725,000 1,665,000
1996 681,894,600 1,863,100 620,135,000 1,694,358
1997 855,736,287 2,344,483 767,949,757 2,103,972
Grand Total 18,630,912,907 51,008,654 16,785,612,262 45,956,612
Source: OPEC Bulletin

30
Table 19
Crude Oil Production in OPEC Member Countries 1961 - 1996 (Thousand Barrels Per Day)
Year Algeria Ecuador Gabon Indonesia I.R. of Iran Iraq Kuwait
S.P. Libyan A.J. Nigeria Qatar
Suadi Arabia
Unt. Arab Emirates Venezuela Total
1961 330.9 8 14.9 424.3 1,202.20 1,007.10 1,735.00 18.2 46 117.2 1,480.10 - 2,919.90 9,303.80 1962 436.9 7 16.4 453.4 1,334.50 1,009.20 1,957.80 182.3 67.5 186.2 1,642.90 14.2 3,199.80 10,508.10 1963 504.3 6.8 17.7 444 1,491.30 1,161.90 2,096.30 441.8 76.5 191.5 1,786.00 48.2 3,247.90 11,514.20 1964 554.8 7.6 21 456.6 1,710.70 1,255.20 2,301.00 862.4 120.2 215.3 1,896.50 186.8 3,392.80 12,980.90 1965 557.7 7.8 24.9 480.6 1,908.30 1,312.60 2,360.30 1,218.80 274.2 232.6 2,205.30 282.2 3,472.90 14,338.20 1966 718.7 7.3 28.6 464.6 2,131.80 1,392.20 2,484.10 1,501.10 417.6 291.3 2,601.80 360 3,371.10 15,770.20 1967 825.7 6.2 69 505.4 2,603.20 1,228.10 2,499.80 1,740.50 319.1 323.6 2,805.00 382.1 3,542.10 16,849.80 1968 904.2 5 91.9 600.7 2,839.80 1,503.30 2,613.50 2,602.10 141.3 339.5 3,042.90 496.6 3,604.80 18,785.60 1969 946.4 4.4 99.8 742.3 3,375.80 1,521.20 2,773.40 3,109.10 540.3 355.5 3,216.20 627.8 3,594.10 20,906.30 1970 1,029.10 4.1 108.8 853.6 3,829.00 1,548.60 2,989.60 3,318.00 1,083.10 362.4 3,799.10 779.6 3,708.00 23,413.00 1971 785.4 3.7 114.6 892.1 4,539.50 1,694.10 3,196.70 2,760.80 1,531.20 430.7 4,768.90 1,059.50 3,549.10 25,326.30 1972 1,062.30 78.1 125.2 1,080.80 5,023.10 1,465.50 3,283.00 2,239.40 1,815.70 482.4 6,016.30 1,202.70 3,219.90 27,094.40 1973 1,097.30 208.8 150.2 1,338.50 5,860.90 2,018.10 3,020.40 2,174.90 2,054.30 570.3 7,596.20 1,532.60 3,366.00 30,988.50 1974 1,008.60 177 201.5 1,374.50 6,021.60 1,970.60 2,546.10 1,521.30 2,255.00 518.4 8,479.70 1,678.60 2,976.30 30,729.20 1975 982.6 160.9 223 1,306.50 5,350.10 2,261.70 2,084.20 1,479.80 1,783.20 437.6 7,075.40 1,663.80 2,346.20 27,155.00 1976 1,075.10 187.9 222.8 1,503.60 5,882.90 2,415.40 2,145.40 1,932.60 2,066.80 497.3 8,577.20 1,936.40 2,294.40 30,737.80 1977 1,152.30 183.4 222 1,686.20 5,662.80 2,348.20 1,969.00 2,063.40 2,085.10 444.6 9,199.90 1,998.70 2,237.90 31,253.50 1978 1,161.20 201.8 208.7 1,635.20 5,241.70 2,562.00 2,131.40 1,982.50 1,897.00 486.7 8,301.10 1,830.50 2,165.50 29,805.30 1979 1,153.80 214.2 203.4 1,590.80 3,167.90 3,167.90 2,500.30 2,091.70 2,302.00 508.1 9,532.60 1,830.70 2,356.40 30,619.80 1980 1,019.90 204.1 174.5 1,575.70 1,467.30 2,646.40 1,663.70 1,831.60 2,058.00 471.4 9,900.50 1,701.90 2,165.00 26,880.00 1981 797.8 211 151.4 1,604.20 1,315.90 897.4 1,129.70 1,217.80 1,439.60 415.2 9,808.00 1,502.30 2,108.30 22,598.60 1982 704.5 198.3 155.1 1,324.80 2,391.30 1,012.10 824.3 1,136.00 1,287.00 332 6,483.00 1,248.80 1,895.00 18,992.20 1983 660.9 237.5 155.4 1,245.30 2,441.70 1,098.80 1,054.10 1,104.90 1,235.50 269 4,539.40 1,149.00 1,800.80 16,992.30 1984 695.4 256.1 157.4 1,280.10 2,032.40 1,221.30 1,163.00 984.6 1,388.00 325.3 4,079.10 1,069.00 1,695.50 16,347.20 1985 672.4 280.6 171.7 1,181.50 2,192.30 1,404.40 936.3 1,023.70 1,498.90 290.1 3,175.00 1,056.80 1,564.00 15,447.70 1986 673.9 256.5 164.7 1,256.80 2,037.10 1,876.50 1,237.70 1,308.00 1,466.60 313.6 4,784.20 1,308.90 1,648.50 18,333.00 1987 648.2 180.9 154.5 1,158.10 2,297.60 2,358.70 971.6 972.5 1,323.00 291.4 3,975.20 1,417.70 1,575.50 17,324.90 1988 650.7 300.8 157 1,177.50 2,305.40 2,739.80 1,396.50 1,029.80 1,367.60 319.4 5,086.30 1,509.50 1,578.10 19,618.40 1989 727.3 278.9 204.3 1,231.00 2,814.10 2,785.80 1,463.50 1,129.20 1,716.30 320.2 5,064.50 1,857.80 1,747.40 21,340.30 1990 785.9 - - 1,299.30 3,134.50 2,110.00 849.2 1,388.70 1,726.70 405.6 6,412.50 1,819.70 2,135.20 22,067.30 1991 803 - - 1,450.00 3,398.90 285.8 190.1 1,403.20 1,893.10 391.2 8,117.80 2,093.90 2,286.20 22,313.20 1992 756.5 - - 1,347.70 3,431.60 526.2 1,057.20 1,432.70 1,957.00 423.2 8,331.70 2,240.50 2,345.60 23,849.90 1993 747.3 - - 1,327.30 3,425.20 659.5 1,881.80 1,361.00 1,905.20 390.3 8,047.70 2,159.30 2,326.00 24,230.60 1994 752.5 - - 1,332.80 3,596.00 748.7 2,006.60 1,389.80 1,820.90 378.7 8,049.00 2,166.50 2,367.90 24,609.40 1995 752.5 - - 1,328.40 3,595.00 736.9 2,006.60 1,399.00 1,842.60 389.8 8,023.40 2,148.00 2,378.50 24,600.70 1996 805.7 - - 1,326.70 3,596.00 740.4 2,005.60 1,394.00 1,863.10 393.1 8,162.30 2,161.30 2,381.00 24,829.20

31
Table 20
World Crude Oil Production and Exports Vis- a -Vis OPEC and Nigeria: 1961 - 1997 ('000 Barrels Per Day)
Production Exports
Year World OPEC Nigeria World OPEC Nigeria
1961 22,343.6 9,363.8 46.0 8,150.5 7,407.6 45.2
1962 24,263.4 10,508.1 67.5 9,202.1 8,353.2 67.7
1963 25,960.1 11,514.2 76.5 10,176.9 9,250.9 75.9
1964 28,071.9 12,983.9 120.2 11,979.1 10,617.2 118.7
1965 30,201.5 14,339.2 272.2 13,276.7 11,768.3 265.7
1966 32,812.3 15,770.2 417.6 15,225.3 13,507.7 382.3
1967 35,291.9 16,849.8 319.3 16,291.7 14,239.5 299.4
1968 38,054.1 18,785.6 141.8 18,461.6 16,076.7 142.4
1969 41,246.0 20,906.3 540.3 20,975.6 18,080.0 540.4
1970 45,272.7 23,413.0 1,084.5 23,516.6 20,223.4 1,050.5
1971 47,854.7 25,326.3 1,531.2 25,480.0 22,031.7 1,486.4
1972 50,708.4 27,094.4 1,817.7 27,779.9 24,078.5 1,777.7
1973 55,478.9 30,988.5 2,056.0 31,703.9 27,547.2 1,986.4
1974 55,813.4 30,729.2 2,255.7 31,130.6 27,258.9 2,180.0
1975 52,746.1 27,155.0 1,785.0 28,521.3 24,063.9 1,719.6
1976 57,434.4 30,737.8 2,071.2 32,306.8 27,098.8 2,013.2
1977 59,985.7 31,253.5 2,098.8 32,990.0 27,322.7 2,030.2
1978 60,245.3 29,805.3 1,896.6 31,848.0 25,792.5 1,827.1
1979 62,890.8 30,928.9 2,304.7 33,433.4 26,477.5 2,210.1
1980 60,024.8 26,880.0 2,055.3 29,876.2 22,605.3 1,960.2
1981 56,183.0 22,598.6 1,439.7 25,849.5 18,319.5 1,228.4
1982 53,495.0 18,992.3 1,289.6 22,399.1 14,049.4 1,002.8
1983 52,418.0 16,992.3 1,235.5 21,168.3 12,210.7 935.2
1984 53,021.1 16,347.2 1,388.0 21,506.6 11,737.1 1,094.1
1985 52,633.1 15,447.7 1,498.9 20,632.5 10,569.5 1,333.3
1986 55,530.0 18,333.1 1,466.6 23,001.4 12,594.0 1,221.2
1987 54,958.0 17,324.8 1,323.0 22,639.9 11,797.6 1,065.2
1988 57,349.5 19,618.5 1,340.0 24,314.8 13,032.9 1,110.5
1989 58,206.0 21,340.3 1,716.3 25,884.4 14,875.9 1,525.9
1990 59,496.9 22,067.2 1,726.7 27,262.5 16,050.9 1,550.0
1991 59,124.1 22,313.1 1,893.1 27,870.2 16,956.7 1,610.0
1992 59,709.1 23,849.9 1,957.0 29,078.1 17,413.9 1,585.0
1993 59,349.9 24,230.5 1,905.2 30,396.2 17,899.6 1,557.0
1994 59,999.6 24,609.4 1,820.9 31,412.6 18,017.9 1,590.0
1995 60,416.8 24,600.8 1,842.6 32,244.1 18,084.3 1,665.0
1996 61,619.0 24,769.2 1,863.1 33,245.1 18,288.0 1,699.0
1997 65,443.0 25,384.0 1,877.0 38,070.0 25,636.0 2,104.0
Grand Total 1,865,652.1 804,151.9 50,541.3 909,301.5 651,335.4 46,055.7

32
Table 21
OPEC & Nigeria: % Contribution to World Crude Oil Production and Exports 1961 - 1997 ('000 Barrels Per Day)
Production Exports
Year OPEC Nigeria Nigeria OPEC Nigeria
1961 41.9 46.0 0.2 90.9 0.6
1962 43.3 67.5 0.3 90.8 0.7
1963 44.4 76.5 0.3 90.9 0.7
1964 46.3 120.2 0.4 88.6 1.0
1965 47.5 272.2 0.9 88.6 2.0
1966 48.1 417.6 1.3 88.7 2.5
1967 47.7 319.3 0.9 87.4 1.8
1968 49.4 141.8 0.4 87.1 0.8
1969 50.7 540.3 1.3 86.2 2.6
1970 51.7 1,084.5 2.4 86.0 4.5
1971 52.9 1,531.2 3.2 86.5 5.8
1972 53.4 1,817.7 3.6 86.7 6.4
1973 55.9 2,056.0 3.7 86.9 6.3
1974 55.1 2,255.7 4.0 87.6 7.0
1975 51.5 1,785.0 3.4 84.4 6.0
1976 53.5 2,071.2 3.6 83.9 6.2
1977 52.1 2,098.8 3.5 82.8 6.2
1978 49.5 1,896.6 3.1 81.0 5.7
1979 49.2 2,304.7 3.7 79.2 6.6
1980 44.8 2,055.3 3.4 75.7 6.6
1981 40.2 1,439.7 2.6 70.9 4.8
1982 35.5 1,289.6 2.4 62.7 4.5
1983 32.4 1,235.5 2.4 57.7 4.4
1984 30.8 1,388.0 2.6 54.6 5.1
1985 29.3 1,498.9 2.8 51.2 6.5
1986 33.0 1,466.6 2.6 54.8 5.3
1987 31.5 1,323.0 2.4 52.1 4.7
1988 34.2 1,340.0 2.3 53.6 4.6
1989 36.7 1,716.3 2.9 57.5 5.9
1990 37.1 1,726.7 2.9 58.9 5.7
1991 37.7 1,893.1 3.2 60.8 5.8
1992 39.9 1,957.0 3.3 59.9 5.5
1993 40.8 1,905.2 3.2 58.9 5.1
1994 41.0 1,820.9 3.0 57.4 5.1
1995 40.7 1,842.6 3.0 56.1 5.2
1996 40.2 1,863.1 3.0 55.0 5.1
1997 38.8 1,877.0 2.9 67.3 5.5
33
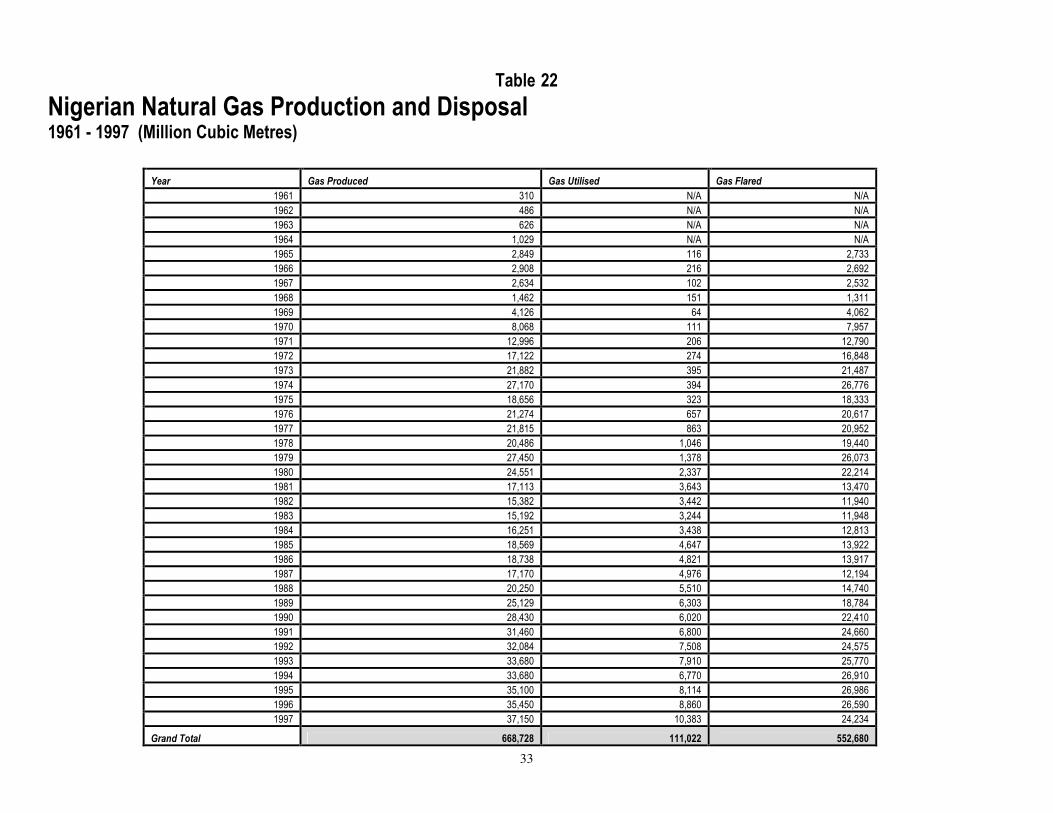
Table 22
Nigerian Natural Gas Production and Disposal 1961 - 1997 (Million Cubic Metres)
Year Gas Produced Gas Utilised Gas Flared
1961 310 N/A N/A
1962 486 N/A N/A
1963 626 N/A N/A
1964 1,029 N/A N/A
1965 2,849 116 2,733
1966 2,908 216 2,692
1967 2,634 102 2,532
1968 1,462 151 1,311
1969 4,126 64 4,062
1970 8,068 111 7,957
1971 12,996 206 12,790
1972 17,122 274 16,848
1973 21,882 395 21,487
1974 27,170 394 26,776
1975 18,656 323 18,333
1976 21,274 657 20,617
1977 21,815 863 20,952
1978 20,486 1,046 19,440
1979 27,450 1,378 26,073
1980 24,551 2,337 22,214
1981 17,113 3,643 13,470
1982 15,382 3,442 11,940
1983 15,192 3,244 11,948
1984 16,251 3,438 12,813
1985 18,569 4,647 13,922
1986 18,738 4,821 13,917
1987 17,170 4,976 12,194
1988 20,250 5,510 14,740
1989 25,129 6,303 18,784
1990 28,430 6,020 22,410
1991 31,460 6,800 24,660
1992 32,084 7,508 24,575
1993 33,680 7,910 25,770
1994 33,680 6,770 26,910
1995 35,100 8,114 26,986
1996 35,450 8,860 26,590
1997 37,150 10,383 24,234
Grand Total 668,728 111,022 552,680

34
Table 23 Refinery Crude Oil Balance For the year 1997
(‘000bbls)
Q1 Q2 Q3 Q4 Annual
Opening Stock
Arabia Light 2,661.96 1,681.32 2,007.14 3,131. 9,481.42
Bonny Light 5,048.94 3,890.08 4,043.98 5,166.26 18,149.26
Escravos Light 3,566.95 3,882.87 2,789.83 5,770.85 16,010.5
Forcados Blend 634.73 470.94 723. 764.02 2,592.69
Total Stock Addittions 11,912.58 9,925.21 9,563.95 14,832.13 46,233.87
Crude Oil Received
Arabia Light 321.56 1,421.36 740.13 2,483.05
Bonny Light 9,098.52 10,798.94 9,811.24 9,565.75 39,274.44
Escravos Light 9,751.25 10,181.65 8,956.46 7,491.88 36,381.25
Forcados Blend 375.47 600.35 754.01 604.93 2,334.75
Total Receipts 19,546.81 23,002.3 20,261.83 17,662.56 80,473.49
Crude Oil Processed
Arabia Light 594.07 1,565.74 303.41 2,463.22
Bonny Light 8,601.11 10,910.63 9,876.67 8,408.95 37,797.36
Escravos Light 9,104.13 11,040.38 7,784.26 7,548.67 35,477.44
Forcados Blend 417.26 478.57 817.81 550.34 2,263.98
Total Processed 18,716.57 23,995.32 18,782.15 16,507.95 78,002.
Closing Stock
Arabia Light 2,389.45 1,536.95 2,443.85 3,131. 9,501.25
Bonny Light 5,546.36 3,778.39 3,978.55 6,323.05 19,626.34
Escravos Light 4,214.07 3,024.13 3,962.03 5,714.07 16,914.3
Forcados Blend 592.94 592.72 659.2 818.61 2,663.47
Total Closing Stock 12,742.82 8,932.19 11,043.63 15,986.73 48,705.36
5
10
15
20
25
mb
bls
Q1 Q2 Q3 Q4
Crude Received Vs Processed
Crude Oil Received Crude Oil Processed
35
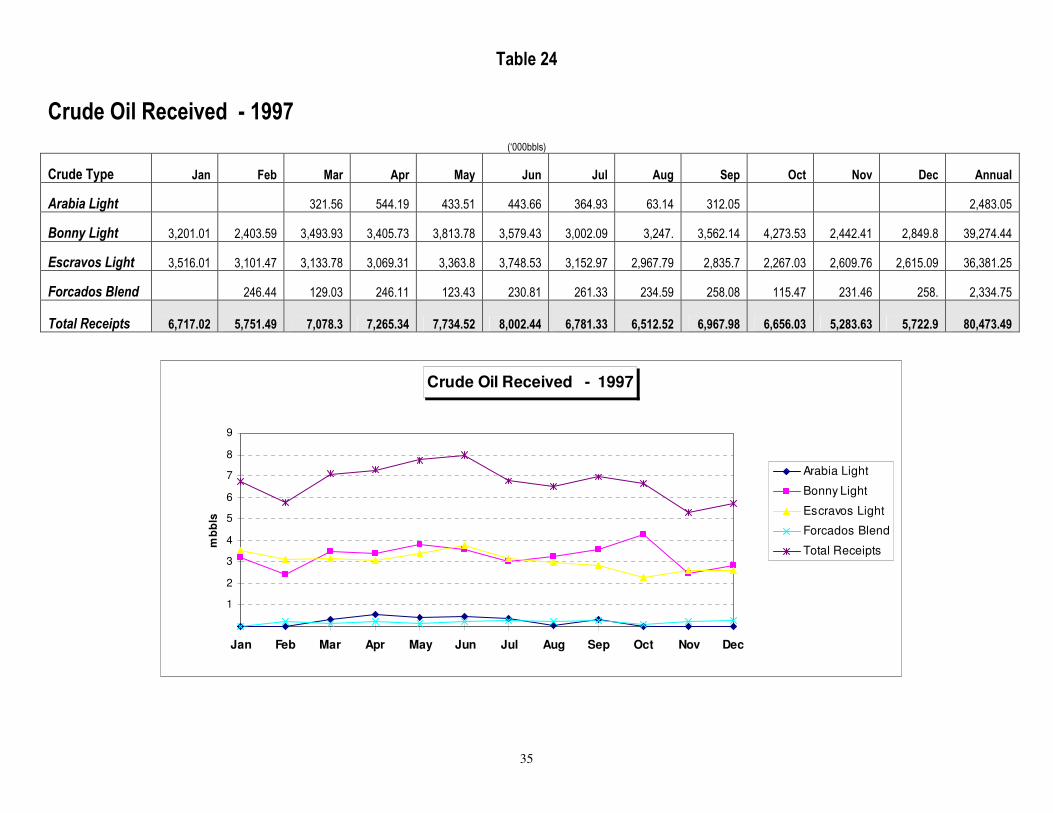
Crude Oil Received - 1997
1
2
3
4
5
6
7
8
9
Jan Feb Mar Apr May Jun Jul Aug Sep Oct Nov Dec
mb
bls
Arabia Light
Bonny Light
Escravos Light
Forcados Blend
Total Receipts
Table 24
Crude Oil Received - 1997
(‘000bbls)
Crude Type Jan Feb Mar Apr May Jun Jul Aug Sep Oct Nov Dec Annual
Arabia Light 321.56 544.19 433.51 443.66 364.93 63.14 312.05 2,483.05
Bonny Light 3,201.01 2,403.59 3,493.93 3,405.73 3,813.78 3,579.43 3,002.09 3,247. 3,562.14 4,273.53 2,442.41 2,849.8 39,274.44
Escravos Light 3,516.01 3,101.47 3,133.78 3,069.31 3,363.8 3,748.53 3,152.97 2,967.79 2,835.7 2,267.03 2,609.76 2,615.09 36,381.25
Forcados Blend 246.44 129.03 246.11 123.43 230.81 261.33 234.59 258.08 115.47 231.46 258. 2,334.75
Total Receipts 6,717.02 5,751.49 7,078.3 7,265.34 7,734.52 8,002.44 6,781.33 6,512.52 6,967.98 6,656.03 5,283.63 5,722.9 80,473.49

36
Crude Oil Processed - 1997
1
2
3
4
5
6
7
8
9
Jan Feb Mar Apr May Jun Jul Aug Sep Oct Nov Dec
mb
bls
Arabia Light
Bonny Light
Escravos Light
Forcados Blend
Total Processed
Table 25
Crude Oil Processed - 1997
(‘000bbls)
Crude Type Jan Feb Mar Apr May Jun Jul Aug Sep Oct Nov Dec Annual
Arabia Light 411.97 182.1 636.1 820.07 109.57 303.41 2,463.22
Bonny Light 3,376.76 1,894.7 3,329.65 3,551.61 3,713.97 3,645.05 2,678.54 3,601.19 3,596.93 4,179.83 1,170.03 3,059.09 37,797.36
Escravos Light 3,357.85 2,676.15 3,070.13 3,422.44 3,566.95 4,051. 3,025.33 2,547.38 2,211.56 2,331.31 2,591.55 2,625.8 35,477.44
Forcados Blend 22.19 211.37 183.7 279.55 74.87 124.15 312.57 302.04 203.2 94. 205.74 250.6 2,263.98
Total Receipts 6,756.8 5,194.19 6,765.58 7,889.7 8,175.85 7,929.77 6,319.85 6,450.61 6,011.69 6,605.14 3,967.32 5,935.49 78,002.
37
Table 26
Refinery Production Returns: Finished Products - 1997
(Metric Tons)
Products Jan. Feb. Mar. Apr. May Jun. Jul. *Aug. *Sep. *Oct. *Nov. *Dec. Annual
LPG 10,205 5,983 8,474 8,629 7,931 4,812 8,201 12,703 9,558 6,457 9,655 5,478 98,086
PMS 238,587 186,034 230,957 316,727 272,990 235,126 185,942 241,218 256,937 241,257 179,593 91,593 2,676,961
DPK 112,878 83,292 133,998 119,997 144,695 139,790 140,478 133,042 120,702 135,204 90,350 112,320 1,466,746
AGO 208,717 148,331 204,931 258,423 226,519 226,597 179,562 216,014 193,372 195,877 124,836 170,039 2,353,218
Fuel oil 382,098 184,646 210,725 190,021 245,277 335,071 254,660 177,607 164,835 189,707 135,800 139,244 2,609,691
Base Oil
Asphalt 7,251 12,991 5,138 9,913 21,477 9,637 66,407
Waxes
Petrochem. 2,156 310 2,622 1,437 1,725 1,290 180 9,720
Sulphur
TOTAL 788,877 644,670 794,533 906,332 893,475 768,446 770,133 764,677 745,404 768,502 540,234 470,504 9,280,829
* : No Crude Oil was processed in KRPC for the months (Aug. - Dec.) as the start-up of all the processing units were put on hold.
38
Table 27
Refinery Production Returns: January - December, 1997 (a) Crude Oil
(‘000bbls) K RP C P HR C W RP C T OT A L Crude Type Received Processed Received Processed Received Processed Received Processed
Arabian Light 2,483.05 2,463.22 2,483.05 2,463.22 Bonny Light 39,274.44 37,797.36 39,274.44 37,797.36 Escravos Light 9,266.31 8,817.84 27,114.94 26,659.6 36,381.25 35,477.44 Forcados Blend 2,334.75 2,263.98 2,334.75 2,263.98 Total 11,749.36 11,281.06 39,274.44 37,797.36 29,449.69 28,923.57 80,473.49 78,002.
(b) Finished Products
(‘000bbls) K RP C P HR C W RP C T OT A L
Products
Actual
Production
Evacuation
by PPMC
Actual
Production
Evacuation
by PPMC
Actual
Production
Evacuation
by PPMC
Actual
Production
Evacuation
by PPMC
Mixed LPG 21,852 10,223 34,736 34,639 41,498 19,225 98,086 64,087 PMS 415,072 612,440 1,469,910 1,534,705 791,979 797,453 2,676,961 2,944,598 DPK 148,847 302,402 675,244 701,062 642,655 608,913 1,466,746 1,612,377 AGO 258,624 374,998 1,276,684 1,281,696 817,910 740,350 2,353,218 2,397,044 Fuel oil 263,150 203,028 1,304,694 1,108,100 1,041,847 972,643 2,609,691 2,283,771 (a) LPFO 263,150 203,028 1,051,515 1,010,774 432,777 454,285 1,747,442 1,668,087 (b) HPFO 253,179 97,326 609,070 518,358 862,249 615,684 Base Oil 721 721 Asphalt 66,407 60,922 66,407 60,922 Waxes Petrochem. 9,720 10,776 9,720 10,776 Sulphur
TOTAL 1,183,672 1,575,510 4,761,268 4,660,202 3,335,889 3,138,584 9,280,829 9,374,296

39
Table 28
Domestic Consumption of Petroleum Products By States - 1997 ('000Litres)
Products Abia Adamawa
Akwa-
Ibom Anambra Bauchi Bayelsa Benue Borno
Cross-
River Delta Ebonyi Edo Ekiti Enugu Gombe Imo Jigawa Kaduna Kano Katsina
LPG. 19 1 12 294 20 4 83 27 3,344 89 1,047 51 385 11 330 14 247,269 4,893 40
Aviation Gasoline 151 821 762 2,698
Super Gasoline 57,782 37,195 15,570 55,578 41,814 38,990 72,021 58,102 146,497 1,745 120,387 2,632 66,975 9,639 67,940 7,519 221,640 147,825 18,652
Household Kerosine 17,364 12,204 5,331 23,092 17,203 68 13,581 38,785 7,062 86,821 985 63,471 419 24,943 4,266 32,791 3,451 54,374 40,816 5,479
Jet Fuel 110 153 309 93 210 534 500 4,838 1,133 1,204 28 2,245 30,982 22
Auto. Gas Oil 15,581 18,465 42,714 17,257 19,102 16,603 54,188 17,633 112,535 351 49,795 520 21,798 5,058 24,338 3,343 91,311 63,167 13,325
HPFO 99 72 14 393 552 96 3,083 438 389 33 534 741 235
LPFO 1,964 1,112 5 6,757 2,985 9,324 123 11,928 6,211 28 794 654 18,746 12,967 1,918
Lubricating Oils 431 183 353 1,085 402 32 535 13,229 1,181 3,342 1 1,830 25 855 100 409 132 3,596 2,124 378
Greases 6 5 84 174 4 9 15 17 89 66 64 1 36 231 79 15
Pet. Jelly / Waxes 61 55 8 10,911 1 18 33,110 1,256 141
Bitumen & Asphalts 5 20
Base Oils
Additives
Brake Fluids 53 2 10 1 35 48 2 13 17 21 43 376 17
Special Products 1 7 4
Chemicals 1,072 15 262 3 65 1 1 314 42 731 10 115 628 2
Total 94,541 69,392 64,558 104,569 79,036 100 72,982 188,775 84,742 384,592 3,173 244,433 3,675 118,172 19,075 126,590 14,459 673,983 308,558 40,224

40
Table 28Contd.
Domestic Consumption of Petroleum Products By States - 1997 ('000Litres)
Products Kebbi Kogi Kwara Lagos Nassarawa Niger Ogun Ondo Osun Oyo Plateau Rivers Sokoto Taraba Yobe Zamfara Abuja
Independent Marketer's
Liftings Total
LPG. 96 53 12,408 4 882 251 107 1,244 656 2,357 24 2 2 154 276,172
Aviation Gasoline 1 35,880 509 40,822
Super Gasoline 14,216 45,424 72,842 952,777 7,667 60,486 189,458 74,605 57,734 181,522 112,232 204,745 65,405 21,369 25,461 7,952 84,211 2,544,678 5,911,286
Household Kerosine 6,262 15,115 21,312 122,369 3,176 17,263 29,867 20,240 14,583 55,416 30,944 49,863 11,478 9,403 12,083 2,600 8,239 667,210 1,549,927
Jet Fuel 23 301 134,732 84 289 31 13 232 427 3,512 101 42 182,148
Auto. Gas Oil 4,931 44,066 16,600 324,633 1,359 23,242 40,371 22,335 9,917 66,417 41,450 172,037 21,636 5,270 17,344 4,070 18,245 1,074,082 2,495,091
HPFO 68 528 6,391 528 396 370 542 414 2,943 98 33 18,990
LPFO 116 31 3,549 213,141 893 9,409 4,049 1,075 10,113 2,607 1,889 10,187 138 195 34 332,943
Lubricating Oils 38 555 252 24,738 21 349 1,910 694 473 3,497 1,085 5,532 1,227 223 379 46 1,103 72,345
Greases 2 10 21 1,473 5 24 14 1 81 50 282 20 13 1 54 2,950
Pet. Jelly / Waxes 67,974 1 587 18,093 132,216
Bitumen & Asphalts 72,588 3,543 76,155
Base Oils 5,627 5,627
Additives
Brake Fluids 53 168 1,918 3 3 2 1 1 82 25 4 2,899
Special Products 50 2 1 1 66
Chemicals 18,232 40 92 2 184 12 5,732 19 27,574
Total 25,619 105,386 115,627 1,994,930 12,223 102,857 272,648 122,683 83,908 319,252 190,548 471,063 110,180 36,280 55,409 14,863 112,135 4,285,970 12,900,108

41
Table 29
Petroleum Products Distribution By Marketing Companies - 1997
('000Litres)
Products African Agip Elf Mobil Nationa
l Texaco Total Unipetro
l
Independent Marketer's
Liftings Total
LPG. 6,220 3,589 247,798 5,020 1,480 6,342 5,723 276,172
Aviation Gasoline 2,172 172 3,657 9,494 25,327 40,822
Super Gasoline 600,498 271,681 169,720 423,583 440,416 423,879 628,962 407,869 2,544,678 5,911,286
Household Kerosine 173,927 88,339 65,939 103,010 107,332 97,102 135,875 101,487 667,210 1,540,220
Jet Fuel 3,199 2,495 57,152 34,934 30,101 22,514 38,745 189,140
Auto. Gas Oil 295,885 137,900 64,718 162,574 193,349 156,508 248,087 153,266 1,074,082 2,486,369
HPFO 18,990 11,437 30,427
LPFO 87,284 12,805 20,066 24,769 91,392 25,933 36,670 29,086 328,005
Lubricating Oils 8,757 6,067 630 12,735 23,450 5,312 11,593 8,434 76,978
Greases 41 398 411 188 504 1,107 605 3,255
Pet. Jelly / Waxes 128,305 3,002 909 132,216
Bitumen & Asphalts 3,855 10,427 19,044 42,829 76,155
Base Oils 3 5,624 5,627
Additives
Brake Fluids 254 2,646 2,899
Special Products 66 66
Chemicals 177 13,861 13,436 100 27,574
Total 1,310,212 523,446 569,713 822,623 948,471 751,825 1,158,199 756,752 4,285,970 11,127,211

42
Table 30
BUNKER SALES - 1997
(‘000mt)
MONTH A G O LPFO TOTAL
January 22.60 23.37 45.97
February 12.26 11.53 23.79
March 8.47 18.62 27.08
April 13.10 9.62 22.72
May 19.62 40.66 60.28
June 23.19 14.66 37.85
July 31.87 36.03 67.91
August 20.80 17.46 38.26
September 10.82 22.19 33.01
October 29.67 24.13 53.80
November 43.98 23.35 67.33
December 43.06 17.30 60.36
Total 279.45 258.92 538.36

43
Table 31
Petroleum Products Exports January - December 1997
(Metric Ton)
MONTH P M S A T K A G O LPFO HPFO NAPH VGO SLOP TOTAL
January 71,683.00 81,876.66 33,003.94 186,563.60
February 7,026.12 124,063.53 44,966.08 176,055.73
March 4,823.51 22,327.87 89,881.70 42,264.98 159,298.06
April 9,967.04 102,846.15 22,895.41 13,891.57 149,600.17
May 645.88 2,712.54 79,503.00 174,590.99 3,605.93 261,058.34
June 2,977.62 165,811.87 168,789.49
July 488.72 991.14 35,587.62 219,354.45 23,971.73 280,393.66
August 70,720.16 106,447.69 177,167.85
September 133,911.82 26,837.16 160,748.98
October 48,685.72 87,218.58 23,187.94 159,092.24
November 117,478.92 117,478.92
December 577.19 638.99 1,965.66 53,627.44 4,496.44 61,305.72
Total 1,223.07 1,127.71 20,459.89 643,529.29 1,183,425.22 146,736.34 47,159.67 13,891.57 2,057,552.76
Source: Generated by CPDD, NNPC June 2001
44
Table 32
PETROLEUM PRODUCTS IMPORTS (‘000mt)
MONTH PMS ATK AGO TOTAL
January
February 2.36 14.19 16.56
March 30.41 16.00 46.42
April 23.72 13.53 37.25
May
June 90.19 90.19
July 185.00 57.34 28.36 270.70
August 184.58 24.59 63.59 272.76
September 117.76 20.18 29.48 167.42
October 194.64 50.79 245.43
November 171.99 77.63 35.36 284.99
December 61.19 145.53 28.51 235.23
Total 1,061.86 419.80 185.30 1,666.95
* : No Imports in the Months of Jan. & May, 1997
45
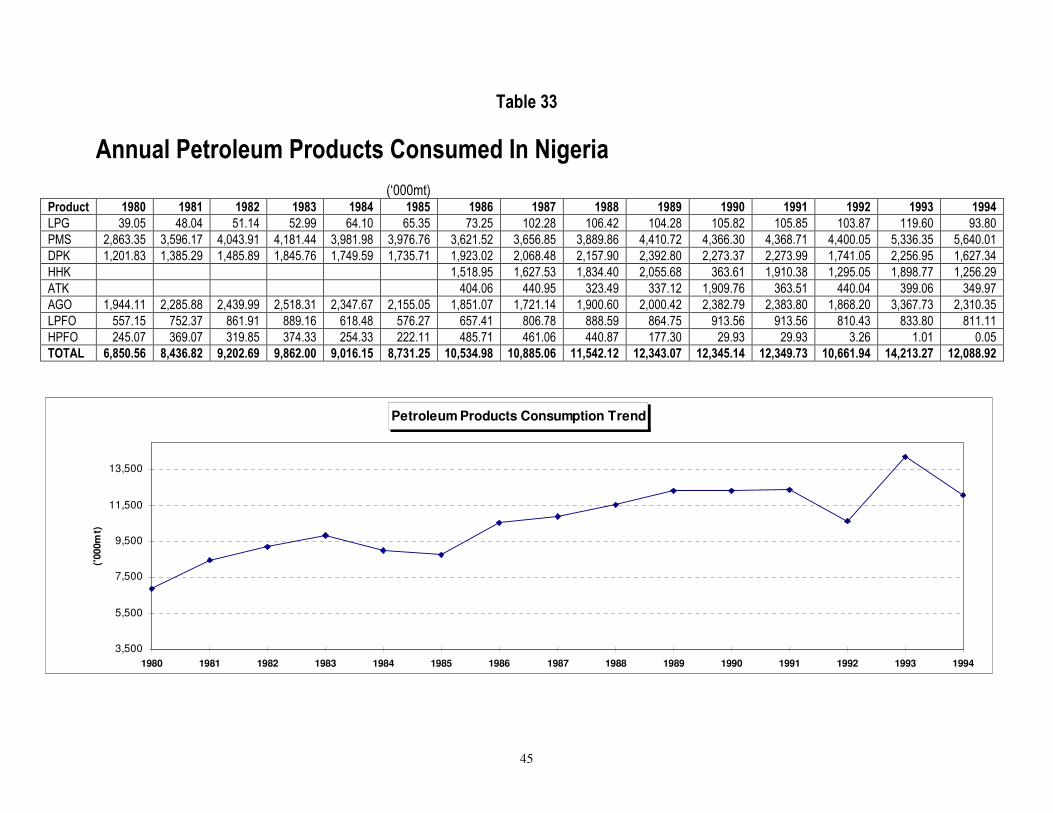
Petroleum Products Consumption Trend
3,500
5,500
7,500
9,500
11,500
13,500
1980 1981 1982 1983 1984 1985 1986 1987 1988 1989 1990 1991 1992 1993 1994
('000m
t)
Table 33
Annual Petroleum Products Consumed In Nigeria (‘000mt)
Product 1980 1981 1982 1983 1984 1985 1986 1987 1988 1989 1990 1991 1992 1993 1994
LPG 39.05 48.04 51.14 52.99 64.10 65.35 73.25 102.28 106.42 104.28 105.82 105.85 103.87 119.60 93.80 PMS 2,863.35 3,596.17 4,043.91 4,181.44 3,981.98 3,976.76 3,621.52 3,656.85 3,889.86 4,410.72 4,366.30 4,368.71 4,400.05 5,336.35 5,640.01 DPK 1,201.83 1,385.29 1,485.89 1,845.76 1,749.59 1,735.71 1,923.02 2,068.48 2,157.90 2,392.80 2,273.37 2,273.99 1,741.05 2,256.95 1,627.34 HHK 1,518.95 1,627.53 1,834.40 2,055.68 363.61 1,910.38 1,295.05 1,898.77 1,256.29 ATK 404.06 440.95 323.49 337.12 1,909.76 363.51 440.04 399.06 349.97 AGO 1,944.11 2,285.88 2,439.99 2,518.31 2,347.67 2,155.05 1,851.07 1,721.14 1,900.60 2,000.42 2,382.79 2,383.80 1,868.20 3,367.73 2,310.35 LPFO 557.15 752.37 861.91 889.16 618.48 576.27 657.41 806.78 888.59 864.75 913.56 913.56 810.43 833.80 811.11 HPFO 245.07 369.07 319.85 374.33 254.33 222.11 485.71 461.06 440.87 177.30 29.93 29.93 3.26 1.01 0.05 TOTAL 6,850.56 8,436.82 9,202.69 9,862.00 9,016.15 8,731.25 10,534.98 10,885.06 11,542.12 12,343.07 12,345.14 12,349.73 10,661.94 14,213.27 12,088.92
46
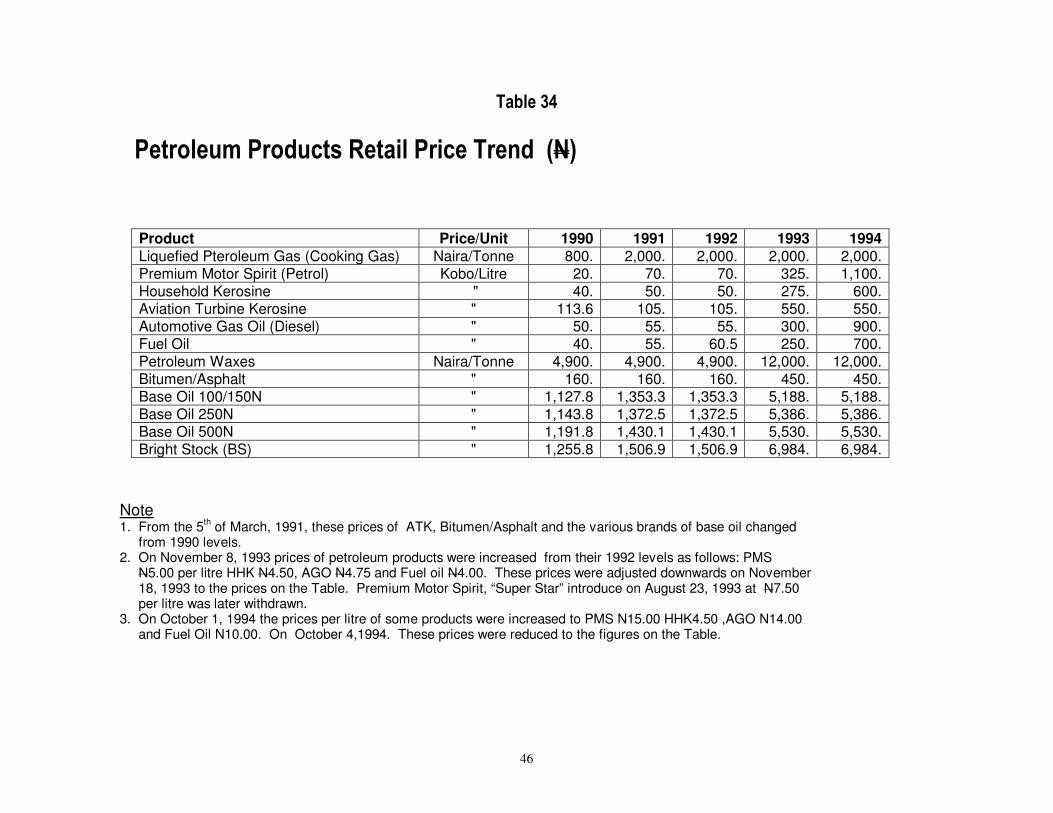
Table 34
Petroleum Products Retail Price Trend (N)
Product Price/Unit 1990 1991 1992 1993 1994
Liquefied Pteroleum Gas (Cooking Gas) Naira/Tonne 800. 2,000. 2,000. 2,000. 2,000. Premium Motor Spirit (Petrol) Kobo/Litre 20. 70. 70. 325. 1,100. Household Kerosine " 40. 50. 50. 275. 600. Aviation Turbine Kerosine " 113.6 105. 105. 550. 550. Automotive Gas Oil (Diesel) " 50. 55. 55. 300. 900. Fuel Oil " 40. 55. 60.5 250. 700. Petroleum Waxes Naira/Tonne 4,900. 4,900. 4,900. 12,000. 12,000. Bitumen/Asphalt " 160. 160. 160. 450. 450. Base Oil 100/150N " 1,127.8 1,353.3 1,353.3 5,188. 5,188. Base Oil 250N " 1,143.8 1,372.5 1,372.5 5,386. 5,386. Base Oil 500N " 1,191.8 1,430.1 1,430.1 5,530. 5,530. Bright Stock (BS) " 1,255.8 1,506.9 1,506.9 6,984. 6,984.
‘
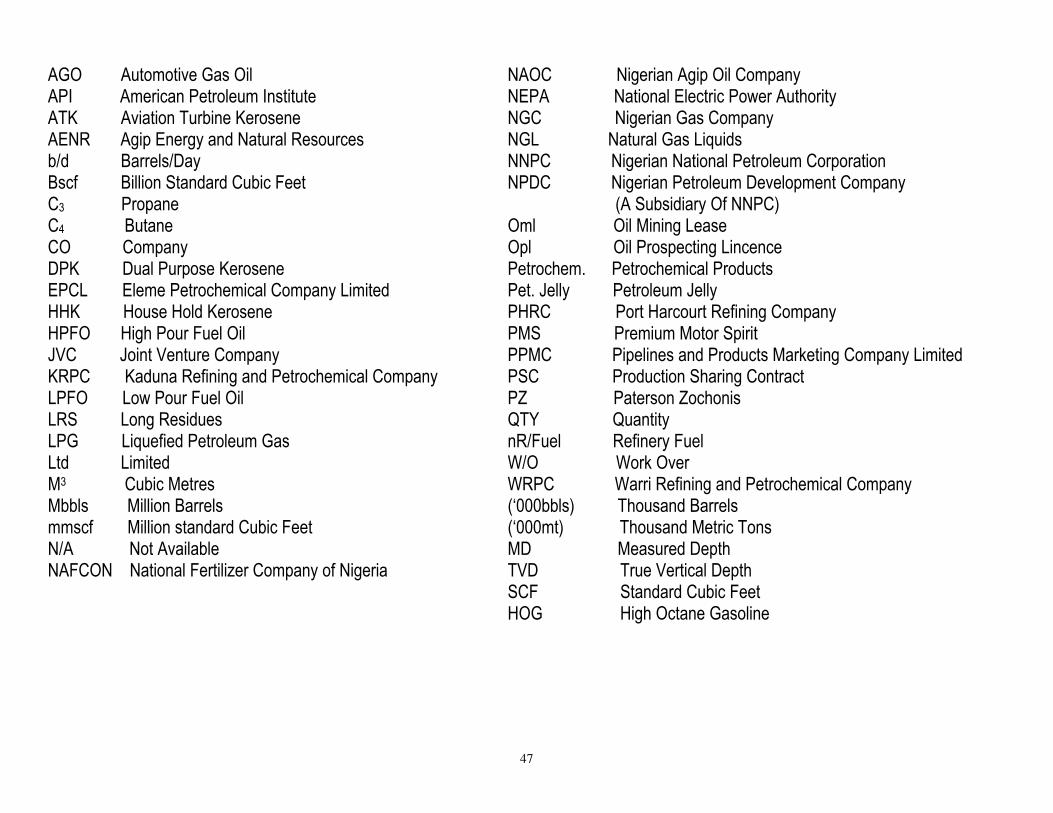
GLOSSARY OF TERMS
Note 1. From the 5
th of March, 1991, these prices of ATK, Bitumen/Asphalt and the various brands of base oil changed
from 1990 levels. 2. On November 8, 1993 prices of petroleum products were increased from their 1992 levels as follows: PMS
N5.00 per litre HHK N4.50, AGO N4.75 and Fuel oil N4.00. These prices were adjusted downwards on November 18, 1993 to the prices on the Table. Premium Motor Spirit, “Super Star” introduce on August 23, 1993 at N7.50 per litre was later withdrawn.
3. On October 1, 1994 the prices per litre of some products were increased to PMS N15.00 HHK4.50 ,AGO N14.00 and Fuel Oil N10.00. On October 4,1994. These prices were reduced to the figures on the Table.
47
AGO Automotive Gas Oil API American Petroleum Institute ATK Aviation Turbine Kerosene AENR Agip Energy and Natural Resources b/d Barrels/Day Bscf Billion Standard Cubic Feet C3 Propane C4 Butane CO Company DPK Dual Purpose Kerosene EPCL Eleme Petrochemical Company Limited HHK House Hold Kerosene HPFO High Pour Fuel Oil JVC Joint Venture Company KRPC Kaduna Refining and Petrochemical Company LPFO Low Pour Fuel Oil LRS Long Residues LPG Liquefied Petroleum Gas Ltd Limited M3 Cubic Metres Mbbls Million Barrels mmscf Million standard Cubic Feet N/A Not Available NAFCON National Fertilizer Company of Nigeria
NAOC Nigerian Agip Oil Company NEPA National Electric Power Authority NGC Nigerian Gas Company NGL Natural Gas Liquids NNPC Nigerian National Petroleum Corporation NPDC Nigerian Petroleum Development Company (A Subsidiary Of NNPC) Oml Oil Mining Lease Opl Oil Prospecting Lincence Petrochem. Petrochemical Products Pet. Jelly Petroleum Jelly PHRC Port Harcourt Refining Company PMS Premium Motor Spirit PPMC Pipelines and Products Marketing Company Limited PSC Production Sharing Contract PZ Paterson Zochonis QTY Quantity nR/Fuel Refinery Fuel W/O Work Over WRPC Warri Refining and Petrochemical Company (‘000bbls) Thousand Barrels (‘000mt) Thousand Metric Tons MD Measured Depth TVD True Vertical Depth SCF Standard Cubic Feet HOG High Octane Gasoline