nigerian seaborne trade and the demand for transport by buhari, chima momoh
TRANSCRIPT

International Affairs and Global Strategy www.iiste.org
ISSN 2224-574X (Paper) ISSN 2224-8951 (Online)
Vol.15, 2013
13
An Analysis of Nigerian Seaborne Trade (Dry Bulk) and the Demand
for Transport. BUHARI, CHIMA MOMOH
Department of Maritime Management Technology, School of Management Technology, Federal University of Technology, PMB 1526, Owerri, Imo State, Nigeria +2348033394046 [email protected]
ABSTRACT The research project deals with the size, structure and trend of Nigerian International seaborne trade, although with emphasis on dry bulks. Facts and figures about the geographical distribution of the seaborne trade and its cargo type by packaging were presented for a 10 years research period (1996-2005) with comments on the trend of Nigerian’s seaborne trade over these years. The researcher was able to analyze these, with the aid of the expo-facto scientific research design using secondary data for the demand for transport within the various selected regions of the world. The result reveals that there were most frequent shipping routes between Nigeria-USA region, this was followed by the Nigeria-Asia region trading with larger volume. And demand for transport is therefore greatest within these regions!
CHAPTER ONE
1.0 INTRODUCTION 1.1 BACKGROUND TO THE RESEARCH The phrase, ‘‘he who controls the trade, controls the world economy’’ has remained a truism. It may seem obvious to say that, today, we live in a global world, and it is certainly true the seaborne trade among all the nations and regions of the world are nothing new. From the Phoenicians, the Vikings, the Omanis, the Spaniards, the Portuguese, the Italians, the British, the French, the Dutch, the Polynesians and Celts, the history of the world is a history of exploration, conquest and trade by sea. Eventually, the great seaborne trade became established: Coal from Australia, Southern African, and North America to Europe and the Far East, Grain from North and South America and Australia to Europe and the Far East, Oil from the Middle East, West Africa, South America and Asia, and now adding to this list, Containerized goods from China, Japan and South East Asia to the consumer market of the Western world.
According to Stopford (1988) seaborne trade involves the movements of merchandise by vessels between the port of embarkation (origin), were merchandise is receives from the exporter at the port of destination where the merchandise is claimed by the importer. It is a common knowledge that seaborne trade remains the backbone of international trade with over 80 percent of world merchandise trade by volume being carried by sea. Quantifying the value of volume of World seaborne trade in monetary terms, is difficult as figures for trade estimates are traditionally in terms of tons or tons miles, and are therefore not comparable with monetary based statistics for the value of the world economy. However, the United Nations Conference on Trade and Development (UN), Review of Maritime Transport (2005) estimates that operation of merchant ships contributes about US $380 billon freight rates within the global economy, equivalent to about 5 percent of total world trade. Seaborne trade, estimates are often calculated in tons miles as a way of measuring the demand for transports (Stopford, 1997). As the world became more developed, proximity to raw materials and to markets, demand became the factors that, about all others shaped the world’s economy and, in particular the major trade partners and sea routes. Today, seaborne trade has evolved to the point where almost no nation can be fully self sufficient only on its domestic resources. According to Hume (1752) in his book discourse on the balance of trade, every country is involved at one or another, in the process of selling what it produces (export) and acquiring what it lack (import): none can be dependent or sufficient only on its domestic resource. Seaborne trade also has effectively permitted an enormous variety of resources to be more widely accessible and has this facilitated the wide-spread distribution of our planet. It is seen, also that seaborne trade has fostered on interdependency and inter-connectivity, today on the principles of free trade are broadly accepted through the General Agreement on Trade and Tariffs (GATT), between people who would previously have considered themselves completely unconnected. The potential benefits are clear: growth can be accelerated and prosperity more widespread; skills and technology can be more evenly dispersed, and both individuals and countries or regions can take advantage of previously unimagined economic opportunities (IMF, Global Economic Outlook, 2004). The research focuses on the demand side of dry bulk cargoes. The demand for transport of dry bulk cargo is a derived demand. The derived demand is dependent upon the nature of goods traffic in seaborne trade. If the demand for a commodity is more, the relative nature of that goods traffic becomes more. Most of the cargoes transported in dry bulk vessels are raw materials or semi-finished products used as input into industrial production (IP). The marine industry is

International Affairs and Global Strategy www.iiste.org
ISSN 2224-574X (Paper) ISSN 2224-8951 (Online)
Vol.15, 2013
14
an essential link in international seaborne trade, with ocean-going vessels representing the most efficient, and often the only method of transporting large volumes of basic commodities and finished products. In 2006, approximately 2.7 billion tons of dry bulk cargo was transported by sea, comprising more than one-third of all international seaborne trade (Genco Shipping Report, 2006). This dry bulk cargo is shipped in large quantities and can be easily stowed in a single hold with little risk of cargo damage. In relatively terms iron ore and coals are by far the two most important commodity groups when measured in volumes shipped, having a combined share of more than 53 percent of the total seaborne demand in 2004 (Mikkelson and Tronstad,2006). The three largest commodities drivers of the dry bulk industry, iron ore, steam coal and grains, are all affected by seasonal demand fluctuations. Steam coal is linked to the energy markets and in general encounters upswings towards the end of the year in anticipation of the forthcoming winter period as power supply companies try to increase their stocks, or during hot summer periods when increased electricity demand is required for air conditioning and refrigeration purposes. Grain production is highly seasonal and driven by the harvest cycle of the northern and southern hemispheres. However, with four nations and the European Union representing the largest grain producers (the United States, Canada and the European Union in the northern hemisphere and Argentina and Australia in the southern hemisphere), harvests and crops reach seaborne markets throughout the year (Fearnresearch, 2004). Demand for bulk carriers is intrinsically depended on the level of seaborne commodity trading, which in turn is linked to the state of the world economy in general and the main importing areas in particular. An abundance of low cost labour in combination with investments in modern production facilities has turned developing Asia and China in particular into the ‘‘factory of the world” similar to Japan and South Korea. China must import a large share of the raw materials needed in the industrial production Clarkson Research Studies (2005). This development in Asia is expected to continue and Asia’s direct impact on seaborne demand will in all probability grow further in the future, with its sea route hectic. 1.1.2 NIGERIA’S BACKGROUND OF SEABORNE TRADE Nigeria has a long and proud maritime heritage which has played an integral role in the development of Western Africa, by the provision of an efficient and cost effective seaborne into Western and Central Africa and beyond. Nigeria’s location and population make it a country of diverse economic capabilities with large investment opportunities as its seaborne trade. Thus this advantage opposition enables her easy access for other ports of the sub-region are being transshipped from Nigerian major seaports. The country has a coastline of over 750km and eight major ports excluding oil terminals with a cargo handling capacity of 35million tones per annum. These ports, over the past decade, have accounted for around 99 percent by volume and 95 percent by value of the country’s total seaborne trade. The eight major ports are strung along Nigeria’s coastline and the estuaries of the main navigable rivers. These seaports provide some 93 General cargo berths, 5 RoRo berth, 7 Bulk solid berths, 63 Buoy berths, 11 Bulk liquid cargo berths and numerous private jetties. Also available in the ports is a fleet of 54 harbour craft and over 600 different types of cargo handling equipment (source, NPA, Annual Abstract of Ports Statistics). Among others, Apapa port complex is Nigeria’s largest and most vital port, which handling about half of the total seaborne trade of the country and some cargo in transit to and from the Niger, Chad, Burkina Faso and Cameroun. Nigeria’s seaborne trade remains the focal point of West African traffic. For instance, the cargo throughput to and from Nigeria accounts for more than 70 percent of the total volume of cargo generated by the entire West Africa sub-region of Africa. Without Nigeria as a foremost market, international seaborne trading activities in West Africa region would be much affected, due to her major export commodities such as crude oil, cocoa, palm kernel, rubber and coffee, among others. With their highly developed infrastructures, modern equipments and efficiencies, professional cargo handlings and freight managements, the ports have great potential to exploit their strategic position for serving both the rapidly developing national economy and the wider West and Central African sub-regions. According to figures released by the Nigerian Ports Authority (NPA), the ports handled 45 million tons of cargo in 2005, the highest volume recorded and a 12 percent increase on the previous year. Almost 3,700 vessels, with gross registered tonnage of 60 million tons, entered Nigeria’s harbours. Imported cargo, which made up 29 million tons, or 64 percent of the total, came from 114 different countries – the main sources being the United States, Taiwan and Brazil. 1.2 RESEARCH PROBLEMS
An obvious question is what is the tonnage of the dry bulk cargoes in tons compared to other seaborne commodity types by packaging? Usually, problem of obtaining statistics about the seaborne commodity by type shipped through sea transport and unfortunately, there is another statistical problem in determining how the seaborne commodities are transported (Stopford, 1997). The difficulty of identifying such trade from Nigerian Ports Authority’s Annual Abstract of Ports Statistics, is very inconvenient for analyzing and thereby making decisions, recommendations or futuristic plans for the demand of transport, (say more fleets of vessel to region of

International Affairs and Global Strategy www.iiste.org
ISSN 2224-574X (Paper) ISSN 2224-8951 (Online)
Vol.15, 2013
15
higher demand of trade difficult), since seaborne trade data are collected mainly in this form, and very little comprehensive information is available about the dry bulk cargo type and its average haul.
According to Damachi and Yang Zhaosheng (2005) the demand for shipping in Nigeria has always been there, but Nigeria cannot participate effectively in international trade due to some basic administrative problems that are confronting the country's shipping lines. As a result Nigeria has failed to take advantage of the competitive edge that she has in the trade as a cargo-originating state, thus loosing freight earnings to ships of other nationalities. The meaning of this is that Nigerian corporations importing necessary raw materials for manufacturing processes would have to depend on foreign vessels to carry their cargo. The existence of shipping companies with reasonable number of bulk carriers flying the Nigerian flag would have made some difference. Nigeria and Nigeria's investment in shipping have advanced retrogressively since the end of the eighties. Nigerian government’s ships then which was over twenty six were all sold to settle accumulated debts. Private sector investment in the industry was also very low from the Nigerian side. The intrinsical assumption from this could be that Nigeria lacks the shipping demand output to support investment in shipping activities (Onyemaechi, 2010).
In addition to these problems, which to some extent plague the relevant analysis of demand for any seaborne commodity, the study of transportation demand suffer from a number of handling which affect it to an unusual degree. First, the state of transportation activity greatly affects the state of prosperity of the economy, just as the state of the economy affects, in turns the demand for transportation (Coutinho, 2006). For instance, there was a notable fall of seaborne trade which occurred during the worldwide economic recessions of the early 1980s and recently in 2005. Thus, these sections of the economy cannot be treated separately. Rather, their interdependence must be taken into account in a statistical calculation using simultaneous equations. This raises a host of technical problems and difficult data requirements. Secondly, transportation technology is no mean static. There are in prospect, a number of revolutionary innovations which may change significantly the nature of the seaborne trade. Third is, transportation costs. Transportation cost, may reflect the costs directly involved in shipping (cost of service) or may be determined by the value of the commodity (value of service). Yet little attention has been given to the role of service quality and travel time as determinants of transport costs, due largely to the lack of relevant data and the difficulty of measurement (Coutinho, 2006). 1.3 AIM AND OBJECTIVES OF THE RESEARCH The aim of this research is to analysis Nigerian dry bulk cargoes, in order to determine the demand for transport in it most trading regions in the world and shipping routes. Specifically, the objectives of this research are to:
I. Determine the traffic flow of dry bulk commodities over a 10 years research period. II. Determine the tonnage of Nigerian exports and imports of dry bulk cargoes relative to other type of trade by
packaging. III. Determine the average haul by regions. IV. Determine the tonnage of cargoes by regions. V. Determine the demand for transport by regions.
VI. Make suggestions for recommendation for shippers, ship owners, and the government for efficient and effective seaborne trading in Nigeria.
1.4 RESEARCH QUESTIONS In order to achieve the slated aim and objectives of this research study, the researcher will attempt to provide answers to the following research questions;
1. What is the volume of Nigerian entire seaborne trade by region? 2. What is the percentage distribution of Nigerian Seaborne Trade within the research period? 3. What is the trend of Nigerian seaborne trade? 4. Is there any relative degree of importance attached to the trend of Nigerian seaborne trade by type of
packaging?
1.5 STATISTICAL HYPOTHESES To provide answers to the research questions, the following statistical hypotheses will be tentatively tested by the researcher in this research: 1. HO=μ2 The volume of seaborne trade through major regions is not significantly different from zero (at a level of significant (α) 0.05).

International Affairs and Global Strategy www.iiste.org
ISSN 2224-574X (Paper) ISSN 2224-8951 (Online)
Vol.15, 2013
16
2. HO=μ2 The volumes of Nigeria’s seaborne general cargo and bulk trades (1996 – 2005) are not significantly different from zero at (at a level of significant (α) 0.05). 3. HO=μ3 The trend of Nigeria’s seaborne trade for the period under consideration is not significantly positive (at a level of significant (α) 0.05).
1.6 SIGNIFICANCE OF THE RESEARCH A research of this kind is anticipated to make hypothetical and realistic contributions to Nigerian seaborne trading, particularly to trade of dry bulks. By this, the researcher provides a basic for closer scrutiny of the formulations and applications of the different relevant aspects of the dry bulk trading in existence and in use. The research is likely to be useful in the various range of decisions to which the demand for transport contribute, for it is extra ordinarily wide, particularly if we take into accounts the decisions made by;
I. Liner companies: planning new services. II. Ship owner: specializing in industrial shipping or chattering.
III. Shipbuilder: planning capacity. IV. Shipper: chartering vessel for boom of a particular dry bulk trade. V. Bankers: financing fleet expansion.
<All have interest in understanding the demand for transport, due to its change. To end with, this research is anticipated to arouse research benefit in other aspects to seaborne trades, in general and liquid bulk trading, in particular. 1.7 SCOPE AND LIMITATIONS OF THE RESEARCH The basic premise, on which this research is based, is scrutiny of Nigerian seaborne trade and the demand for transport. This research will focus on dry bulk, confined within a manageable research period of 10 years, from 1996-2005. This research is a prelude and indeed a pioneering work in seaborne trade, particularly in dry bulk trade in a developing country like ours. It is meant, among others, to be underpinning for other similar research. The exploratory nature of this research should be noted so that its limitations can be understood. The limitation of the researcher includes;
1. Lack of funds for research and data analyses. 2. Lack of sufficient literatures and relevant materials to the research. 3. Attitudes to research by Nigerian Ports Authority officials. 4. Lack of encouraging government policy on research. 5. Past data from NPA.
1.8 DEFINITION OF RESEARCH TERMS I. AVERAGE HAULS: Average distance over which each ton of cargo is transported.
II. BALANCE OF TRADE: This is the relationship between the total volume of export and import of a country for a certain period of time.
III. BULK CARGO: Any individual cargo consignment sufficiently large to fill a whole ship. IV. BULK CARRIER: Vessels in which the cargo is carried in bulk, rather than any individual cargo
consignment. V. CAPESIZE VESSEL: Vessel over 80,000 dwt.
VI. DEMAND FOR TRANSPORT: Is defined as the tonnage of cargo to be moved and the average distance over each ton of cargo is transported. It measured in tons-miles.
VII. FREIGHT RATE: Means the remuneration payable to the ship owner for the carriage of goods or hire of a ship.
VIII. FIVE MAJOR BULKS: Bulks that covers the five homogeneous bulk cargoes, i.e. Iron ore, grain, coal, phosphates and bauxites which can be transported satisfactorily in a concentrated dry bulk carrier or tweendecker stowing at 45-55 cubic feet per-ton.
IX. MINOR BULKS: They cover the many other commodities that travel in shiploads. X. GENERAL CARGO: Is consists of any individual cargo consignment too small to fill a whole ship or
hold. XI. GDP: The gross domestic product (GDP) refers to the total value of goods and services produced in the
country during one year. XII. HANDYMAX VESSEL: Vessel over between 30,000 and 60,000dwt.
XIII. HANDYSIZE VESSEL: Vessel up to 30,000 which carry exclusively minor bulk cargo. XIV. SEA ROUTE: Is a logistical network identified as a series of pathways and stoppages used for the
commercial transport of cargo.
International Affairs and Global Strategy www.iiste.org
ISSN 2224-574X (Paper) ISSN 2224-8951 (Online)
Vol.15, 2013
17
XV. TERM OF TRADE (TOT): Is defined to as the quantity of domestic goods that must be given up to get a unit of imported goods.
XVI. TRADE DEFICIT OR GAP: This is as a result of an increase of import trade over export trade. XVII. TRANSPORT COST: In this research, transport costs are defined as the costs incurred in moving
freight. XVIII. UNFAVOURABLE BALANCE OF TRADE: The difference between the value of a country’s exports and
the value of its imports such that imports exceed export.
1.9 RESEARCH DISPOSITION In chapter one, the researcher reveals the introductory part of the research, illustrating the research problems, aim and objectives of the research, research questions, statistical hypotheses, etc.
Chapter 2, he further researches on review of literatures, facts and figures regarding dry bulk trading. Chapter 3, the researcher covers the model and research method of analysis, which is the theory behind the process of handling and analyzing the data, with the use of SPSS analytical tools. The actual process is described in chapter 4, where the researcher analysis the findings for instant, he would analysis each regions using the ANOVA pair wise comparism of Nigerian’s entire seaborne trade separately.
Finally, the researcher will make the summary of the research work together with the recommendations, conclusive remarks and areas for further research in chapter 5.
CHAPTER TWO 2.0 LITERATURE REVIEW 2.1 HISTORICAL BACKGROUND In this research the researcher focuses on the demand side of dry bulk commodities. Most of the cargoes transported in dry bulk vessels are raw materials or semi-finished products used as input into industrial production (IP). Over the last 10-15years, Asia relative share of dry bulk cargoes imports has increased substantially. In the Far East, Japan and South Korea have been significant importance of a variety of commodities for a long time. More recently China has developed in to the most significant importer of dry bulk commodities. Dry bulk commodity demand is relatively complex to analyze with over 40 different commodities or commodity groups included, each having a range of different factors influencing their overall demand for transport (Mikkelson and Tronstad, 2006). Traditionally, however, dry bulk cargo demand has been divided into the five “Major” bulks (iron ore, coal, grain, bauxite/aluminum and phosphate) in addition to the “Minor” bulks . As inputs to steel production, fluctuations in both the iron ore and coking coal markets are strongly correlated to the steel industry, whist the remaining major bulk are related to other specific factors. Wergeland and Wijnolst, (1982) and Stopford, (1996), identify the main seaborne dry bulk commodities as iron ore and coal. They further said that the seaborne trade in these two major bulks covers roughly 65 percent of the total dry bulk demand today. The “minor” bulks are individually small in volume but collectively they make up a significant share of world commodity trades, primary as input to industrial production. Fourteen minor dry bulks cover a wide variety of commodities, such as forest products, ferrous ore, minerals and pet coke, cement, other construction materials and salt. In general there are five major factors that influence the demand for transportation (ship). The development in the world economy is probably the most important factor. There seems to be a clear relationship between seaborne dry bulk demand and the global business cycle. One can say that without significant growth in the global economy, we are not likely to see strong growth in demand for dry bulk transportation. Generally, growth in gross domestic product and industrial production correlates with peaks in demand for seaborne transportation. Both logic and several studies suggested that there is such a link (Klovaland, 1991 and Stopford, 1997). Empirical analysis shows that business cycles have been a major determinant of the short run behaviuor of seaborne freight rate. Klovaland (2003) found that peaks in the business cycle have coincided with peaks in commodity prices and seaborne rates, as seen in table 2.1. Adding together the GDP for Japan, China and other Asia, their total contribution to world GDP was no more than 33 percent, but their share of total dry bulk imports was approximately 62 percent, in 2004 and their share of the total growth in dry bulk imports between 1990 and 2004 was 86 percent. ,

International Affairs and Global Strategy www.iiste.org
ISSN 2224-574X (Paper) ISSN 2224-8951 (Online)
Vol.15, 2013
18
Table 2.1: GDP based on PPP in USD billion and as share of the World GDP.
1999 2004 E 2004-1990
USD % USD % USD % Share of Growth %
JAPAN 2451 9% 3612 7% 1160 -2.5% 4%
CHINA 1497 6% 6913 13% 5416 7.3% 20%
OTH ASIA 2743 10% 7130 13% 4387 3% 16%
W. EUROPE 4843 18% 8614 16% 3771 -2.2% 14%
USA 5760 22% 11175 21% 5415 -0.8% 20%
FSU/E.EUR 2974 11% 3733 7% 759 -4.3% 3%
L.AMERICA 2126 8% 4034 8% 1908 -0.5% 7%
AFRICA 915 3% 1845 3% 931 0% 3%
Others 3035 12% 6015 11% 2979 -0.2% 11%
Total 26344 100% 53070 100% 26726 100% Source: Clarkson Research Studies (2004). This underlines what was mentioned above about the correlated relationship between GDP and seaborne activity. In fact, even though there is and has been a clear relationship between global economic growth and dry bulk trades it is important to remember that national economic size does not necessarily say very much about a countries direct importance for dry bulk demand (IMF, Global Economic outlook, 2004 and Clarkson Research Studies). Indirectly, however, through the consumption of finished goods there will be an effect. Together with the overall effects from global growth, structural development in various areas of the world has a direct influence on the flow of commodities and has seaborne commodity trades. It is, for example positive for dry bulk trades that economy, such as China and Japan, with none or at least insufficient natural resources build up steel and manufacturing industrials. This initiates seaborne trade in two ways. First, through imports of raw materials to the manufacturing areas and further more it usually also generates trades for finished products to the consuming areas (Mikkelson and Tronstad 2006). The sailing distance or average hauls (AH), influence the time at sea which is positively correlated with the demand for seaborne transport. The development of iron is exploration in Brazil in combination with increased steel production in China has had a very positive influence on the average haul for capsize vessels (120-200,000 dwt). For instance, the average haul with iron ore from Brazil to China is more than twice as long (about 22 days) compared with the average haul from the iron ore parts in the Northern part of Australia (about 10days). This means that the demand for dry bulk transportation will be twice as high for the former compared with the latter for each additional ton of iron are shipped (Stopford, 1988; 1997). < Political events have always been an importance factor for dry bulk demands. The closing of the Suez Canal during the Yom Kippur war in the early 1970s is perhaps the event that has had the largest effect on the seaborne trading market. Due to the closure of the canal vessels that normally sailed through the canal were forced to sail around Africa, which in effect multiplied the average haul/or sailing distance (Eriksen, 1982). The political evolution of the world impacts the transportation sector as well. The emergence of free trade zones together with the opening of new markets due to political changes and the resulting globalization of the economy have tremendous consequences for the evolution of transportation systems, not all of which are yet apparent or well understood. For example, open borders generally mean that firms are no longer under obligation to maintain a major distribution center in each country. In consequence, distribution systems are reorganized around fewer but bigger warehouses and transportation services are operated over longer distances (Crainic and Laporte, 1997). The last major factor is the transport cost. In this research, transport costs are defined as the costs incurred in moving freight, that is, in a broader sense, transport costs could also include any number of costs that impede trade such as policy-induced trade barriers, for example, cultural or sociological barriers (Brakman, Garretsen and Marrewijk, 2001). These freight costs consist of direct and indirect elements. Direct elements include freight charges and insurance on the freight, whereas indirect elements include all costs incurred by the transport operator. Indirect elements vary with the shipment’s characteristics. For example, holding costs for the products in transit, inventory costs (in the case of late deliveries) and costs incurred during preparation for transit (which depends on the shipment size) (Anderson and Wincoop, 2003). A number of authors have recently investigated the determinants of transport costs from an empirical point of view (Limao and Venables, 2001; Mico and Pérez,

International Affairs and Global Strategy www.iiste.org
ISSN 2224-574X (Paper) ISSN 2224-8951 (Online)
Vol.15, 2013
19
2002; Clark, Dollar and Mico, 2004; Egger, 2004; Combes and Lafourcade, 2005; Martinez-Zarzoso and Suárez- Burguet, 2005). All these studies show that geographic conditions, the type of product transported, economies of scale, energy prices, trade imbalances, infrastructures, transport mode, competition and regulations are among the most important factors explaining the variation in transport costs across countries. An important finding of these studies is that a 10 percent reduction in transport costs increases trade volumes by more than 20 percent. However, the difficulties involved in measuring and inferring the value of transport costs, together with their high variability across goods, countries, and regions, calls for further investigation. For most seaborne trade commodities, transport cost have been relatively marginal compared with the value of the cargo that is shipped but in period of high freight rates, such as during the very high market seen in 2004 and 2005, it is sometimes less costly to purchase relatively more expensive seaborne commodities, from nearby suppliers. High transport costs elevate the cost of producing manufactures by increasing the price of imported intermediate and capital goods. These elevated production costs, together with high transport costs, impede the price competitiveness of manufactured exports (Radelet and Sachs, 1998; Hoffmann, 2002). Limão and Venables (2001) find that landlocked developing countries tend to have higher transport costs (approximately 50 percent) and lower trade volumes (around 60 percent) than coastal countries. Clark et al. (2004) find that transport costs are a significant determinant of bilateral trade between Latin America and the USA, and that port efficiency is an important determinant of international shipping costs (improving port efficiency from the 25th to the 75th percentile can reduce shipping costs by up to 12 percent). Transport cost contributes significantly to shaping the volume, structure and patterns of seaborne trade as well as countries comparative advantages and trade competitiveness. Therefore, during times of very high or low freight rates it is not unusual to see some changes in “normal” trading patterns, which again could influence average hauls (Stopford, 1988; Mikkelson et al, 2006). Transport costs have in recent years been recognized to have important and significant impacts on seaborne trade patterns and globalised production (Hoffmann, 2002). Limăo and Venables (2001) state that transport and other costs of conducting business on an international level are key determinants of a country’s ability to participate fully in the world economy, and especially to grow exports. For countries located far from markets, the effect of transport costs on seaborne trade is more severe. Distance is an important part of international seaborne trade relations and the impact of distance on transport costs has been widely documented. As distance increases, seaborne trade volumes decrease (Venables, 2001). Countries tend to trade with proximate partners (Grossman, cited in Anon., 2004) even if transport costs over distance have fallen (Hummels, 1999a). Approximately half of the world’s seaborne trade takes place between countries located within 3,000 km of each other (Anon., 2004). The distance of seaborne trade for the average countries in the world has decreased, implying that distance matters (Carrere and Schiff, 2004). Limão and Venables (2002) demonstrate that exports and imports of both final and intermediate goods carry transport costs that increase with distance. If a country is situated far from its trading partners, its Cost, Insurance and Freight / Free On Board ratio is higher than a country located close to its foreign markets. For example, Australia’s Cost, Insurance and Freight / Free On Board ratio is 10.3, whereas Switzerland in Europe has a ratio of only 1.7 (Radelet and Sachs, 1998). Busse (2003) illustrates this point through another example. The cost to ship a 40-foot container from Baltimore to China is around $13 000, whereas the cost to Rotterdam is only $2 000 (he follows the same method as Limão and Venables (2001) only with 2002 data). Venables (2005) argues that remoteness from economic activity increases transport costs and accounts for the poor export performance of many developing countries situated far from the major markets. Porto (2005) finds that for low-income countries, transport costs are amongst the most important of trade barriers. Higher transport costs are of more relevance for bulk cargo. To minimize the incidence of transport cost on low value/ high volume goods, importers of bulk cargo are mere likely to source from nearby providers (Farlex Free Library, 2008). The demand for dry bulk carrier capacity is determined by the underlying demand for commodities transported in dry bulk carriers, which in turn is influenced by trends in the global economy. Seaborne dry bulk trades increased by slightly more than 2 percent on an average annual basis during the 1980s and 1990s. However, this rate of growth has increased dramatically in recent years, as seen in table 2.2, between 1999 and 2006, trade in all dry bulk commodities increased from 2.0 billion tons to 2.5 billion tons, an increase of 35 percent overall (Klovland and Prescott, 1996). <

International Affairs and Global Strategy www.iiste.org
ISSN 2224-574X (Paper) ISSN 2224-8951 (Online)
Vol.15, 2013
20
Table 2.2: Seaborne Dry Bulk Imports, (% and million tons)
1999 2004 E 2004-1990
MT % MT % MT % Share of Growth %
JAPAN 510 32% 559 24% 49 -8% 7%
CHINA 64 4% 396 17% 332 13% 45%
OTH ASIA 239 15% 489 21% 250 6% 34%
W. EUROPE 542 34% 583 25% 40 -9% 5%
USA 64 4% 163 7% 99 3% 14%
FSU/E.EUR 144 9% 70 3% (74) -6% -10%
L.AMERICA 16 1% 47 2% 31 1% 4%
AFRICA 16 1% 23 1% 7 0% 1%
Total 1595 100% 2330 100% 735 100% Source: Clarkson Research Studies (2004). Generally, growth in gross domestic product and industrial production correlates with peaks in demand for seaborne transportation. Certain economies will act from time to time as the "primary driver" of the dry bulk carrier market. In the 1990s, Japan acted as the primary driver due to increased demand for seaborne trade and growth in Japanese industrial production. China has been the main driving force behind the recent increase in seaborne dry bulk trades and the demand for dry bulk carriers. Between 1999 and 2004, ton-mile demand in the dry bulk sector increased by a total of 25 percent to 11.5 billion ton-miles. Dry bulk carriers can be the most versatile element of the global shipping fleets in terms of employment alternatives. However, dry bulk carriers seldom operate on round-trip voyages. Rather, the norm is port-to-port liner service and triangular or multi-leg voyages. This means that every voyage has a ballast leg that must be paid for by the laden or revenue earning leg (Genco shipping reports, 2006). According to the Fearnresearch (2004) the worldwide dry bulk carrier fleet subdivides into four vessel size categories, which are based on cargo carrying capacity, they include;
1. Capesize-vessels over 80,000 dwt. While this is the traditional definition of a Cape size bulk carrier, in terms of deadweight, the sector is changing. As per the order book detailed below, there have been a number of new super-Panamaxes ordered, which are 82,000 dwt to 85,000 dwt, but which are able to transit the Panama Canal with a full cargo. Thus, a more modern definition of Capesize would be based on vessels over 100,000 dwt. The Capesize sector is focused on long haul iron ore and coal trade routes. Due to the size of the vessels there are only a comparatively small number of ports around the world with the infrastructure to accommodate them.
2. Panamax-vessels between 60,000 dwt and 80,000 dwt. Panamax vessels, defined as those with the maximum beam (width) of 32.2 metres permitted to transit the Panama Canal, carry coal, grain and, to a lesser extent, minor bulks, including steel products, forest products and fertilizers.
3. Handymax-vessels between 30,000 dwt and 60,000 dwt. The Handymax sector operates in a large number of geographically dispersed global trades, mainly carrying grains and minor bulks including steel products, forest products and fertilizers. Vessels less than 60,000 dwt are built with on-board cranes that enable them to load and discharge cargo in countries and ports with limited infrastructure.
4. Handysize vessels up to 30,000 dwt, which carry exclusively minor bulk cargoes. Historically, the Handysize dry bulk carrier sector was seen as the most versatile. Increasingly, however, this has become more of a regional trading, niche sector. The vessels are well suited for small ports with length and draft restrictions and also lacking infrastructure.
Key elements influencing the supply of dry bulk carriers are vessel deliveries and the loss of existing vessels through scrapping or other circumstances requiring removal. A comparison of vessels in each category reveals that Capesize vessels have the largest percentage of current fleet on order when compared to the Panamax, Handymax and Handysize categories (Genco Shipping Report, 2006).
<
The chattering of vessels for the specified period of time or to carry a specific cargo is an integral part of the market for seaborne transportation of dry bulks. The charter market is highly competitive. Competition is based primarily on the
International Affairs and Global Strategy www.iiste.org
ISSN 2224-574X (Paper) ISSN 2224-8951 (Online)
Vol.15, 2013
21
offered charter rate, the location, sea route, technical speciation and quality of the vessel and the reputation of the vessels manager. Typically, the charter party agreements are based standard industry terms, which are used to streamline the negotiation and documentation processes (UNCTAD (UN), Review of Maritime Transport, 2005). Winter (1952) in his book ‘Marine Insurance; Its principles and practice gave two purposes for which vessel are chartered at demand; first, the charter may be engaged in a specific line of trade shore vessel. Space in large quantity is needed, as in the shipment of bulk cargoes such as grain or coal of bale or bagged goods, such as cotton, coffee, or sugar. For these cargoes the merchant could not rely on obtaining sufficient space on liners, and so, through vessels brokers who space on liners, and so, through vessel broker who are in touch with the freight market of the world, he will engage one more entire ship on a basis of payment of much a day (time charter), so much a voyage (voyage charter) or so much a unit of cargo carried (commodity/voyage charter). The second, general reason for chartering a vessel is the necessity of additional tonnage for a line operating vessels over definite sea route. Shipping route reflect world trade flow. According to Wikipedia Report on trade route; trade route is a logistical network identified as a series of pathways and stoppages used for the commercial transport of cargo. Sailing is most numerous and most frequent on routes where trade volumes are larges and demand is therefore greatest. In liner trades to and from the UK, the besides routes are to the Far East (especially China and Japan), Passing through the Mediterranean, the Suez Canal and the Malacca straits. The North Atlantic route, linking Western Europe and the USA and Canada, is also busy and there are well-established routes to the Middle East, India, Australia and New Zealand, Central and South America, as well as East, south and West Africa. In dry bulk trades route reflect the places of origin and consumption of the commodities carried. For example, many of the main iron ore route being from Tubarao (Brazil) and West Australia and end in developed countries were demand for iron ore is greatest. 2.1.1 NIGERIA’S REVIEW OF SEABORNE TRADE. Both Ndikom, (2006) and Oladakun,(2009) viewed seaborne as a mode of transport, that has continued to represent the cheapest and most efficient means of moving very large volume of import and export trade goods in the Nigerian international trade. In Nigeria, the seaborne sector has been responsible for facilitating over 90 percent of trading prospects. Nigeria accounts for over 60 percent of total seaborne traffic in volume and value in the West African sub-region with a GDP accounting for over 60 percent of total GDP of 16 countries that make up the Economic Community of West African States (ECOWAS). The success or otherwise of the Nigeria seaborne trading sector therefore has a reverberating impact on the sub-region (Airahuobhor, 2010). Although, the Nigerian seaborne trade relations were built among the traditional agricultural and mining products of cocoa, palm produce, groundnuts, rubber, cotton, hides and skins, tin, coal and columbite among others. But with the discovery of oil our recipients were given a greater boost and very rapidly oil receipt dominated foreign exchange earnings by accounting for over 98 percent by 1996. That for several years after independence, the emergence of oil prosperity, in the country denied any serious attention to be paid to the prospects of non-oil exports trade, until the Structural Adjustment Programme (SAP) by the government in 1968. Okoh (2004) in his report on Global integration and the growth of Nigerians Non-oil export describe exporting as the process of earning profits by selling products or services in foreign markets. He further gave the concepts of exportation; he said “Exportation must be based on the principles of local sufficiency”. This connotes that a country that will engage in any export trade mission, should therefore as the case must be, has such a product in large quantities and it must be easily available in reasonable sufficiency. As a resource-rich country, Nigeria’s economic performance has been unfortunately driven by only the oil and gas sector to the extent that even progress recorded towards geniue economic development prior to the discovering of oil in commercial quantity has been virtually eroded. In recent time between 2000 and 2005, the GDP growth was about 5.7 percent and the growth in the non-oil sector which contributed about 5.9 percent of the GDP. The declined in the agricultural sector performance has been dramatic since the discovering of oil. The manufacturing sector has not performed even better; a few statistics illustrate the poor performance of the non-oil sector. The share of non-oil sector decreased from about 94 percent in 1970 to about 52 percent in 2004. The decrease affected all the sectors (Agriculture, Industry and Services) but in different magnitude. Agriculture GDP declined from about 41 percent to about 17 percent over the same period, as seen in table 2.3.

International Affairs and Global Strategy www.iiste.org
ISSN 2224-574X (Paper) ISSN 2224-8951 (Online)
Vol.15, 2013
22
Table 2.3: Structure of the Nigerian Economy, 1974-2004 (Percent of GDP at current factor costs). 1970 1980 1990 2000 2003 2009
oil sector GDP 6.0 29.1 39.3 48.2 44.6 48.2
Non-oil sector GDP 94.0 70.9 60.7 51.8 55.4 51.8
Agriculture 41.3 20.6 29.7 26.3 26.4 16.6
Industry 7.8 16.4 7.4 4.5 4.8 8.7
Services 45.0 33.8 23.6 21.0 24.2 26.5
Source, World Bank (2007) From the table 2.3 above Nigeria’s non-oil sector is inefficiently serving the domestic market as non-oil export is negligible. According to the Direction of Trade Statistics IMF year book (2007), Nigerian’s seaborne trade with G-15 countries was 11.2 percent of its global trade. Its biggest trading partner was Brazil with an import of 45.7 percent, and with 65.8 percent of export. Merchandise exports to Brazil have risen impressively while exports to India have slumped since 2004. Between 2000-2006 Nigeria’s exports to G-15 countries as a percentage of its global exports halved from 22.4 percent to 11.1 percent, while between the same periods, Nigeria’s imports global imports increased from 8.6 percent to 11.3 percent. Also, based on data from Nigerian Investment Promotion Commission (2006), available information points to a general upward trend in the inflow of Foreign Direct Investment (FDI) from China to Nigeria presents a global picture of FDI inflow to Nigeria from different region and China from 1999 to 2006. All the regions showed significant increase in FDI inflow from the 1999 level. Thus, the upward increase in the aggregate FDI inflows to Nigeria from about $190.61 million in 1999 to about $4169.14 million in 2006 is a joint increase in the levels of FDI by all the regions. 2.2 MODELS, PARADIGMS OR THEORIES RELEVANT TO THE RESE ARCH PROBLEMS. A great number of mathematical, heuristics, fuzzy logic, and econometric models have appeared in recent years. A great number of these models have gained usefulness in modeling demand in the shipping sector.
The demand for transport is a derived demand, which is dependent upon the nature of goods traffic in seaborne trade. If the demand for a commodity is more, the relative nature of that goods traffic becomes more (Stopford, 1997; 2009). The extent to which increase in dry bulk trade have affected demand for dry bulk carriers is reflected in estimates of ton-mile demand. Ton-mile demand is calculated by multiplying the volume of cargo moved on each route by the distance of the voyage. Hence, trade distances assume greater importance in the demand equation (Genco Shipping Report, 2006).
The demand for sea transport can be defined by the equation below. DDt = F(CTt., AH t)------------------------ Equ. 2.2.1 DDtk = CttK AH t ---------------------------Equ. 2.2.2 DDtk = ∑ (Atkm DDtk) --------------------Equ. 2.2.3 A tkm = D Dtkm --------------------------Equ. 2.2.4 DDtk Where DD = Demand for seaborne transport (ton- miles). CT = Tons of cargo transported in time period (in tons). AH = Average haul of cargo (in miles). T = Year subscripts. A = market share of ship type (m). K= commodity (e.g. Iron ore, etc). M =ship types (say, dry bulk carries). Demand measure in ton miles of transport requires is determined by the tonnage of cargo to be moved and the average haul over which each ton of cargo is transported as seen in equation 2.2.1.

International Affairs and Global Strategy www.iiste.org
ISSN 2224-574X (Paper) ISSN 2224-8951 (Online)
Vol.15, 2013
23
Moving on to equation 2.2.2, the volume of ship demand generated by each commodity, k, and measured in ton miles is the product of the tonnage cargo of each commodity and its average haul. At this stage, demand is expressed in terms of the total ton miles of demand by ship type, m. This is done in equation 2.2.3, which shows that the demand for ship type m is defined as the market share of that ship type in each commodity trade, summed over all commodities. This is a simple relationship to write in algebraic terms, but is much more difficult to define in practice. In reality trade will be carried in whatever ships are available, which depend on what ship owners order, so analyzing investment trends may be the answer (Stopford, 1997; 2009). Each ship operator develops his own rates usually without consultation with the shipper. The operator’s charges reflect the cost of providing the carriage, the value of this service of the owner of the goods, the ability of the merchandise to support the expense of transportation demand and economic conditions in general. To a noticeable extent, seaborne trade freight rates are the result of the working of the law of demand and supply of transport which may be influenced by port charges by ship owners, cargo allocation by reputable government body must be regulated equally by principles of justice, due process and fair play so that meaningful control could be applied and maintained. Makkar(2007) defines the market as the interaction of supply and demand, and both together determine the equilibrium freight rate and quantities sold at that rate. Figure 2.1, below shows different possible short run market equilibrium, each determined by different demand conditions. The key factors that make demand conditions alter relate to the volume of world trade, which is driven by overall economic activity, and changing degrees of openness towards trade by individual nations. Demand curves further to the right represent larger trade volumes. ,,,
Figure 2.1 Short Run Market Interactions. Source: Institute of Chartered Shipbrokers Column (2008) Demand volumes increase from D1 to D4. Between D1 to D3 there is a relatively small rise in the market freight rate and a large rise in ton miles produced. But between D3 and D4, the increase in demand is translated into large increases in rates, because supply becomes very inelastic, and the scope for increases in supply becomes increasingly limited. The above model can be used to examine short run fluctuations in market conditions, but not long run ones. This is because the supply schedule represented in Figure 2.1 is drawn for a given stock of ships. However it is a useful framework to explore fluctuations in freight rates in the short term. Still considering the shift in demand from D3 to D4. It will be observe that rates will move up very sharply, and supply not increasing much. This creates large profits for existing ship owners, who will be encouraged to demand for new vessels. The value of existing vessels will also rise, reflecting the markets’ expectation that profits are going to be healthy in the future. The increased number of demands will translate into a rightward shift in the supply curve in the long term, and this will lead, to a fall in rates if demand remains at D4. On the other hand, a fall in demand from D2 to D1 means a fall in supply and a rise in vessel lay-ups. Remember that in the short run, some vessels will be trading at rates which do not cover their full costs. While this is acceptable in the short term, it is not the case in the longer term. Some vessels will be laid up, or scrapped. The scrapping of vessels leads to a leftwards shift of the supply curve. This process will help raise rates if the supply shifts far enough. As with most other markets, the price (freight rate in dry bulk shipping) is determined by supply and demand. The supply side is a function of the fleet (new deliveries, scrapping, lay-ups, productive life), the fleet productivity (efficiently in ports congestion), efficiently at sea (vessel
Ton Miles/Year
Freight Rate $/ton mile
F1
F2
F3
Maximum Output
F4
D1
D2 D3 D4
Q1 Q2 Q3

International Affairs and Global Strategy www.iiste.org
ISSN 2224-574X (Paper) ISSN 2224-8951 (Online)
Vol.15, 2013
24
speed, ballasting, canal closures etc), and the freight rates. The sum of these elements makes up the hockey stick shaped supply curve shown in figure 2.2 below. The demand side for ship transportation is as mentioned a function of the global economic business cycle; the average haul, political events and transportation costs (Makkar, 2008).
Demand & Supply ModelScrapping
Supply - Tonnage
Freight Rate$/tonne
F1
F2
F3
F4
D1
D2 D3D4
Q1 Q2 Q3
Increase in Freight rates for same demand levels
Figure 2.2 Demands and Supply versus Freight Rates Source: Institute of Chartered Shipbrokers Column (2008). In figure 2.2, above illustrates a very simplified supply and demand model for seaborne transportation. It is a short term model; it gives a fair reflection of the dynamics in the seaborne market for transportation. In the model the maximum capacity of the fleet (the supply side) is fixed, as shown by the vertical dotted line. When freight rates fall below a certain level due to lower demand, the productivity of the fleets starts declining. First of all this takes effect through slow steaming. Later if the market falls below running costs of a ship some vessels are placed in lay-up with increased demand, freight rate eventually rise. It is a long term, new vessels are delivered, the infrastructure in the ports is improved relaxing possible congestion new trades are developed and the supply curve shifts to the right. Eventually the market finds a new equilibrium, which is to the left of full capacity in the simplified model (Mikkelson and Tronstad 2006). < In figure 2.3 below, shows that an increase in tonnage entering the market increases the elasticity of supply, as shown by the dotted curved line on the diagram. This means that more ships are available for a given demand and come into service to cater for this demand. The supply curve shifts to the right. The effect is a fall in the freight rates for the same demand. Unless the demand level increases (either in absolute terms or by virtue of change in trading patterns i.e. increase in ton-miles), the induction of new ships will depress the market. (Makkar, 2008).
Demand & Supply ModelIncreased Supply
Freight Rate$/tonne mile
F1
F2
F3
F4
D1
D2
D3
D4
Q1 Q2 Q3
Fall in Freight rates for same demand levels
Supply - Tonnage
Figure 2.3Scraps versus Freight Rate
International Affairs and Global Strategy www.iiste.org
ISSN 2224-574X (Paper) ISSN 2224-8951 (Online)
Vol.15, 2013
25
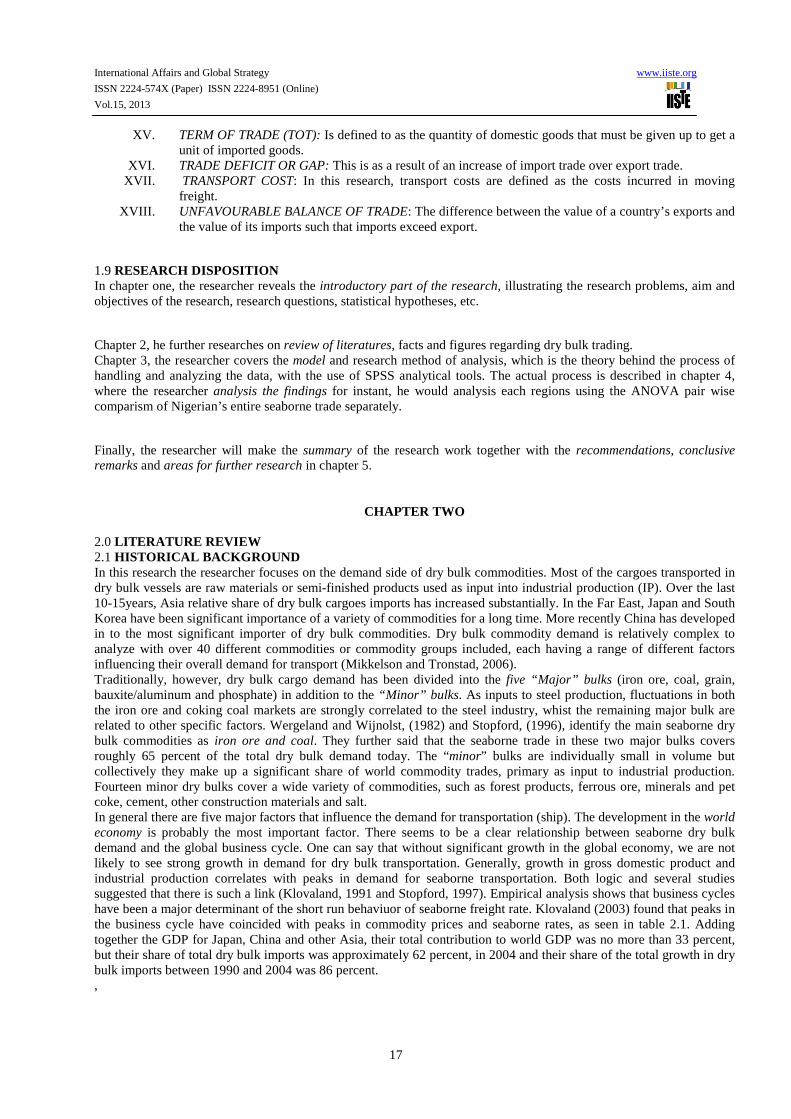
Source: Institute of Chartered Shipbrokers Column (2008) Figure 2.4 further views an increased supply condition, a rush for ordering new ships in a good market results in heavy new deliveries in the near future and an inevitable crash unless of course demand keeps up with this increased supply. Recall early 80’s, late 90’s and 2001! When the freight market is good, a perception (an illusion in most cases) that it is going to last forever injects optimism in the minds of bankers and investors (recently the IPOs with tons of retail investor funds).
Demand & Supply ModelFurther Increased Supply
Freight Rate$/tonne mile
F1
F2
F3
F4
D1
D2 D3D4
Q1 Q2 Q3
Supply - Tonnage
Almost Free Fall of Freight rates for
same demand levels
Figure 2.4 Deliveries versus Freight Rate. Source: Institute of Chartered Shipbrokers Column (2008)
The researcher further compares with an adjacent table taken from “Shipping Economics” by Stopford (2001) to explain the trends. It was observed that interaction of the supply and demand produces the resultant called the “market tone”. It was also observed that during the period when the demand tendency was fast, the market tone was either competitive or weak because of expanding or over capacity in the supply, as seen in fig. 2.5.
Period Demand Tendency Supply Tendency Market Tone
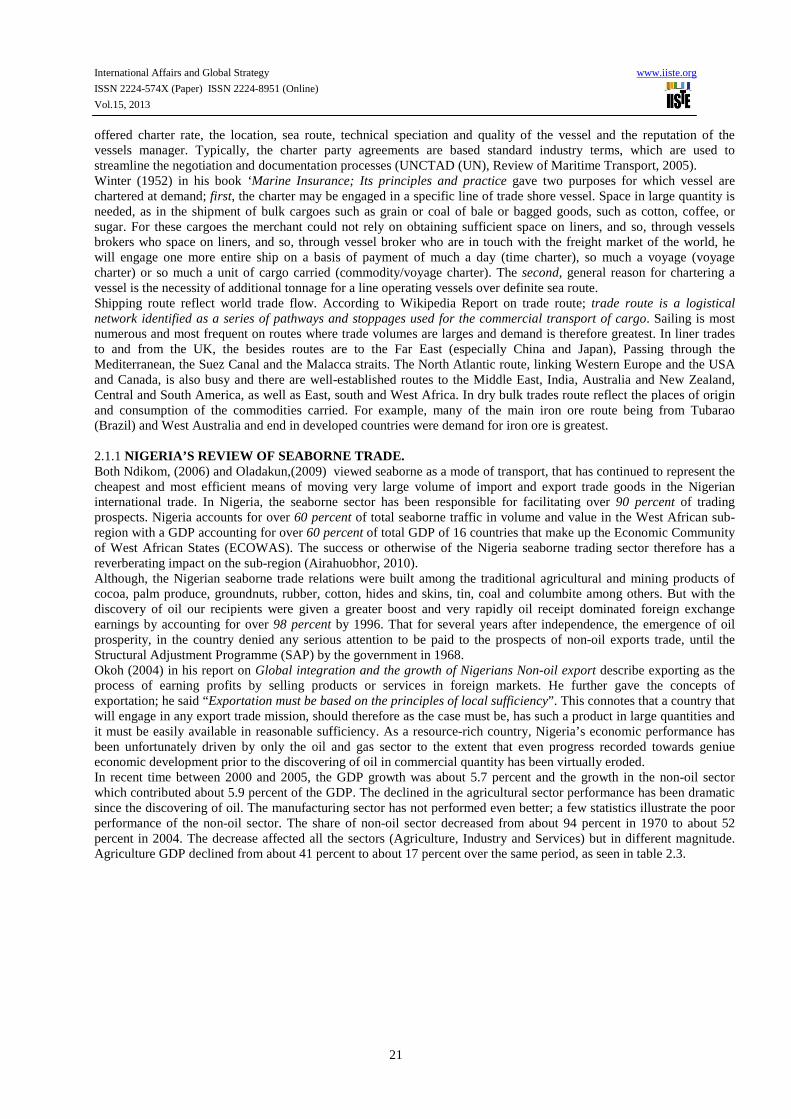
1869-1914 Fast Expanding Competitive 1920-1930 Fast Over-capacity Weak 1930-1939 Falling Over-capacity Depressed 1945-1956 Very Fast Shortage Prosperous 1956-1973 Very Fast Expanding Competitive 1973-1989 Falling Over-capacity Depressed 1988-2000 Slow Expanding Competitive Source, Stopford (2001). Figure 2.5 Shipping fundamental trends To summarize the ‘Shipping Markets’ the researcher, gave a further looked at the graph adapted from Clarkson Research Studies (2002). As foreseen then, the market experienced a boom most of the times when the new deliveries fell below 3 percent of the total fleet. For bulkers, this percentage was 2 percent for the year 2003. Also 2003 to early 2005, coupled with a surge of demand from China and resulting multiplying impact of port congestion. The adjacent graph in figure 2.6 further shows the interaction between Supply and Demand. The graph shows some offset (out of phase) between the changeover (intersects) and the actual boom points. The future projection, showing that vessel supply will be greater than demand is only an opinion and not a statement of fact!
International Affairs and Global Strategy www.iiste.org
ISSN 2224-574X (Paper) ISSN 2224-8951 (Online)
Vol.15, 2013
26
Shipowners’ Delight & not a depression !
Supply > Demand
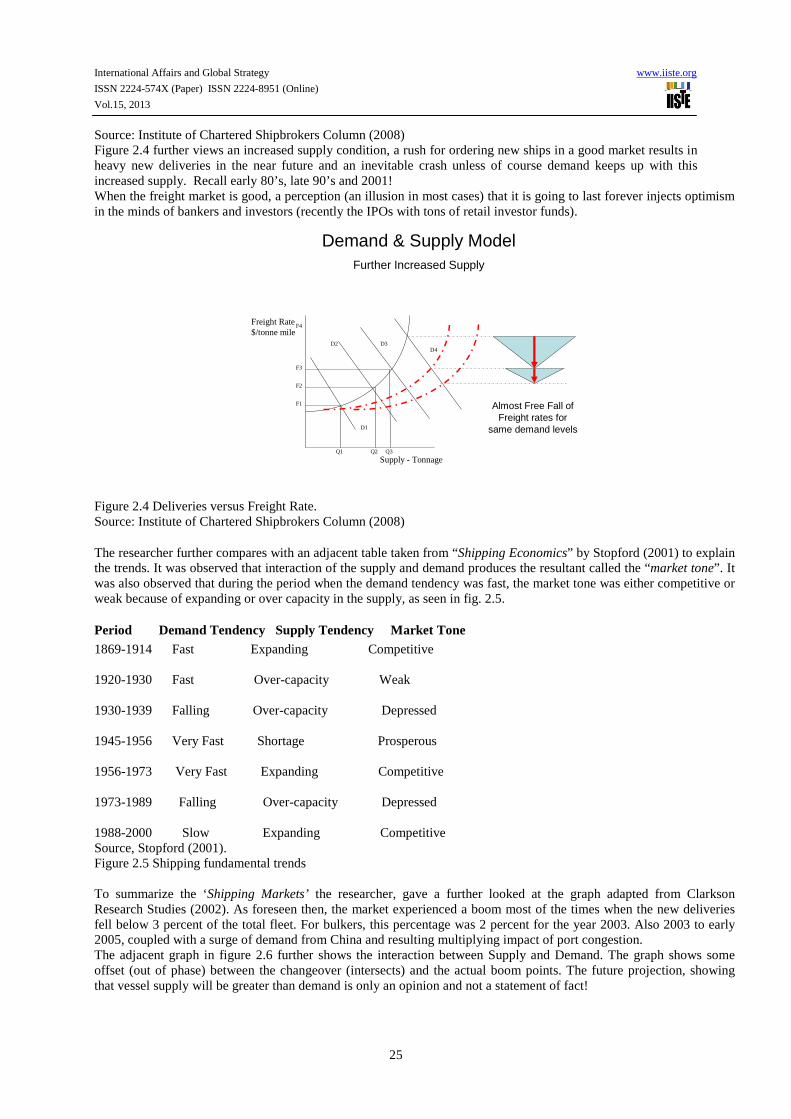
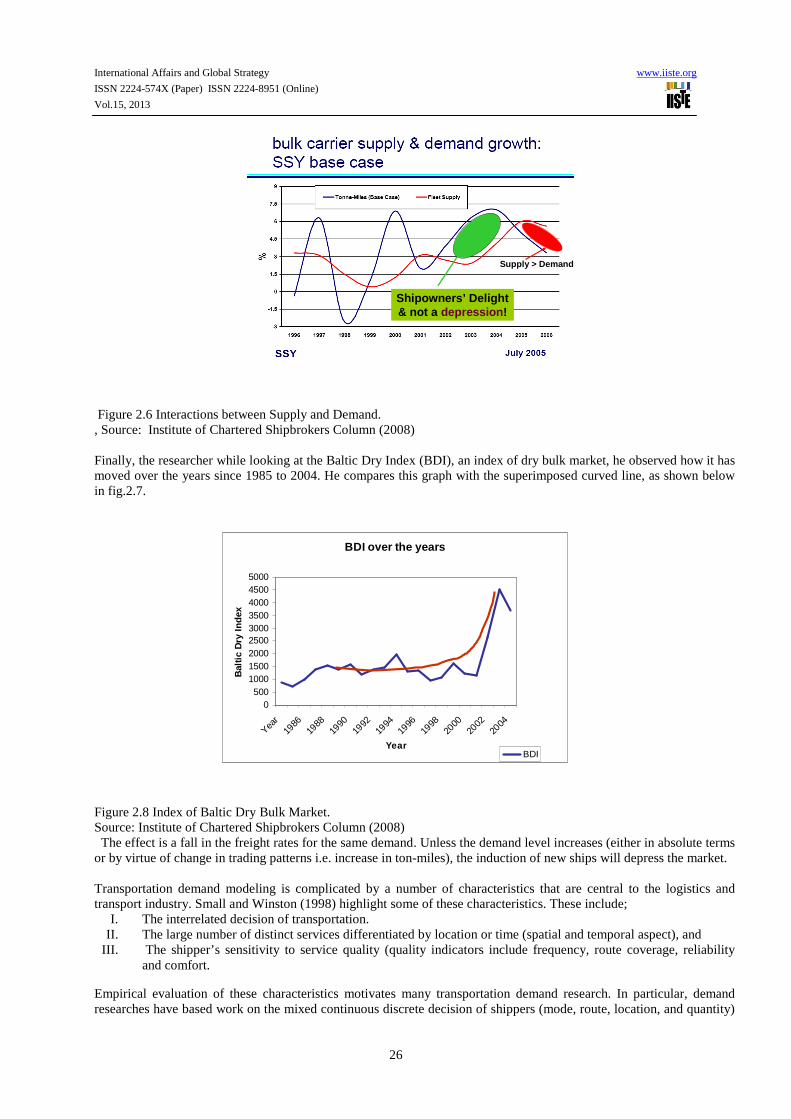
Figure 2.6 Interactions between Supply and Demand. , Source: Institute of Chartered Shipbrokers Column (2008) Finally, the researcher while looking at the Baltic Dry Index (BDI), an index of dry bulk market, he observed how it has moved over the years since 1985 to 2004. He compares this graph with the superimposed curved line, as shown below in fig.2.7.
Figure 2.8 Index of Baltic Dry Bulk Market. Source: Institute of Chartered Shipbrokers Column (2008) The effect is a fall in the freight rates for the same demand. Unless the demand level increases (either in absolute terms or by virtue of change in trading patterns i.e. increase in ton-miles), the induction of new ships will depress the market. Transportation demand modeling is complicated by a number of characteristics that are central to the logistics and transport industry. Small and Winston (1998) highlight some of these characteristics. These include;
I. The interrelated decision of transportation. II. The large number of distinct services differentiated by location or time (spatial and temporal aspect), and
III. The shipper’s sensitivity to service quality (quality indicators include frequency, route coverage, reliability and comfort.
Empirical evaluation of these characteristics motivates many transportation demand research. In particular, demand researches have based work on the mixed continuous discrete decision of shippers (mode, route, location, and quantity)
BDI over the years
0500
100015002000250030003500400045005000
Year
1986
1988
1990
1992
1994
1996
1998
2000
2002
2004
Year
Bal
tic D
ry I
ndex
BDI
International Affairs and Global Strategy www.iiste.org
ISSN 2224-574X (Paper) ISSN 2224-8951 (Online)
Vol.15, 2013
27
to evaluate relative import of factors important to choosing transportation model. Often there is a focus on role of reliability and travel time in shipper’s decisions and / or output price changes on the firm’s decision (McCarty, 2001). Despite the skepticism regarding the practical importance of the optimal tariff argument, it continues to feature prominently in the leading theoretical trade policy models. Grossman and Helpman (1995) extend their endogenous trade policy model to the case where a country is “large”, i.e. it faces finite export supply elasticities. Although not stressed in their paper, there would be no motive for trade talks in their model in the absence of a terms-of-trade use of the tariff. This is a key point made by Bagwell and Staiger (1999) who provide an economic theory of the General Agreement on Trade and Tariffs (GATT). In this and in subsequent work, Bagwell and Staiger have strongly argued that the use of tariffs to explore the terms-of-trade effect can explain many of the key features of the current multilateral trading system. Their work has been quite influential despite the fact that there is no direct evidence that countries use, or indeed possess, market power in trade prior to entering into reciprocal liberalization in the GATT or its successor, the WTO. The theory that a country might gain from protection has a long history (Irwin, 1996). The intuition for why countries might gain from tariffs through an improvement in their terms-of-trade stems from two key insights. The first, from Torrens (1833) and Mill (1844) is that there are many possible prices at which countries would be willing to trade. The imposition of a tariff creates a welfare loss due to consumption and production distortions, but it can also produce a gain if foreign suppliers reduce their prices in order to maintain market access. If the losses due to the domestic distortion are less than the gains from the price or terms-of-trade effect, a country can gain from a tariff. Edgeworth (1894) provided the key insight regarding when a country should impose a tariff. He showed that as long as a foreign country’s offer curve was not perfectly elastic, a country could gain from a tariff. In this case, the reduction in import demand caused by a tariff leads to a reduction in the price of all units imported and this first order gain offsets the distortion losses from lower imports. < Bickerdike (1907) extended Edgeworth’s framework and developed the formula relating the welfare maximizing tariff and the inverse of the export supply elasticity. Although Bickerdike framed his derivation with one import good and a welfare maximizing government, the basic insight that a country’s “optimal” tariff is increasing in its market power applies to more general settings and does not require governments to maximize welfare. (Broda; Limão; Weinstein (2006)). Finally, the researcher deems it obligatory to examine the relationship between the theory of “balance of trade” and “ term of trade”. Balance of trade is the relationship between the total volume of export and import of a country for a certain period of time. When the balance of trade is surplus by the export, then its favorable otherwise deficit (Branch, 2000).
Balance of Trade = Total Export – Total Import Term of Trade (TOT) is defined to as the quality of domestic goods that must be given up to get a unit of imported goods. They refer to the opportunity cost of obtaining goods through seaborne trade than producing them directly. The measurement of terms of trade is given as;
TOT index = Index of export trade x 100% Index of import trade In regard to the relationship between the both theories, terms of trade and balance of trade, an improvement in the former will lead to favorable result of the latter only if the demand for import and export is relatively inclusive. If the demand is elastic, then the balance of the trade will be less favorable or even worse. A device in the term of trade does not imply an unfavorable balance of trade. If the demand for more import and export is relatively elastic, then a device in the term of trade will cause demand to rise. 2.3 CURRENT LITERATURE BASED ON EACH OF THE RELEVANT VA RIABLES OF THE MODELS AND THEORIES . There is more seaborne trade in dry bulk commodity along the sea route of Asian region, than in anywhere else. This is true, since Japan and South Korea, China must import large share of the raw materials needed in the industrial production (IP) (Clarkson Research Studies, 2004). This development in Asia is expected to continue and Asia’s direct impact on seaborne demand will probably grow further. Whether one measures trade by how much of a goods is moved (volume), by it value or by the carrying capacity needed to move it. All measures are important and for different reason. Stopford (2009) in his recent edition of Maritime Economics, he divided the world seaborne trade by the Parcel Size
International Affairs and Global Strategy www.iiste.org
ISSN 2224-574X (Paper) ISSN 2224-8951 (Online)
Vol.15, 2013
28
Distribution function. Bulk cargo (big parcels) of over 2-3000 tons and general cargo (small parcels) of under 2-3000 tons.
Volumes of dry bulk trade provide insights about whether the infrastructure is adequate to accommodate the required flow. Value allows governments and economists to access patterns of international trade and balance of trade and balance of payments carrying capacity allows the shipping industry to access how many dry bulk vessels are required and on what route. Hence, dry bulk commodity must be moved from regions where supply is greater than demand exporting regions to regions where demand is greater than supply importing regions. They ‘‘have/ have not’’ balance results in dry bulk flows from one international region to another, from one country to another, and from one region within a country to another. This flows dictated by economics logistics (fleets of ship) and temporary in balance in supply and demand are central to the efficient operation of the dry bulk market (Fearnresearch, 2004).
The Baltic Dry Index, the main measure of seaborne costs for commodities, will extend a 46 percent rally over the past month driven by Chinese demand for iron ore and grains, China Ocean Shipping (Group) Co. said.
“The rebound may be bumpy, but in the final quarter the index should be much higher,” said Kong Fanhua, a Beijing-based senior researcher at the owner of the world’s largest operator of dry-bulk ships. Kong, who declined to give a forecast in figures, correctly called a rebound in the index last September, 2009. The Baltic Dry’s rally has come even as signs mount that the global recovery may be sputtering, including economic growth data from Japan. The index may surge to more than 4,000 points by the end of the 2010, a gain of at least 61 percent, according to Hanjin Shipping Co., South Korea’s largest shipping company.
China is “not collapsing but growing at a healthier pace,” said Chi Myunghwa, head of the bulk-planning team’s research division at Hanjin Shipping. “China is restocking iron ores and coal again as it braces for the winter season, while droughts and floods across the globe are aggravating a shortage of grains, resulting in greater trade.” Hanjin Shipping’s Chi said it may average 3,500 points this year compared with 2,617 points in 2009. “The outlook for bulk- shipping demand is very promising,” (Kyoungwha, 2010).
The international dry bulk shipping industry is highly fragmented and is divided among state controlled and independent dry bulk vessel owners. As a general principle, the smaller the cargo-carrying capacity of a dry bulk vessel, the more fragmented is its market, both with regard to charterers and vessel owners/operators.
There remains significant potential for industry consolidation within each vessel type, especially in the Handysize, Handymax and Panamax sectors in which we currently operate. Charter market dry bulk carriers are employed in the market via a number of different chartering options. The general terms typically found in these types of contracts are described brief below.
A "bareboat charter" involves the use of a vessel usually over longer periods of time ranging over several years. In this case all voyage related costs, including vessel fuel and port dues as well as all vessel-operating expenses such as day-to-day operations, maintenance, crewing and insurance, transfer to the charterer's account. The owner of the vessel receives monthly charter hire payments on a per-day basis and is responsible only for the payment of capital costs related to the vessel.
A "time charter" involves the use of the vessel, either for a number of months or years or for a trip between specific delivery and redelivery positions, known as a trip charter. The charterer pays all voyage-related costs. The owner of the vessel receives semi-monthly charter hire payments on a per-day basis and is responsible for the payment of all vessel operating expenses and capital costs of the vessel.
<<
A "voyage charter" or "spot charter" involves the carriage of a specific amount and type of cargo on a load-port to discharge-port basis, subject to various cargoes handling terms. Most of these charters are of a single voyage nature, as trading patterns do not encourage round voyage trading. The owner of the vessel receives one payment derived by multiplying the tons of cargo loaded on board times the agreed upon freight rate expressed on a per-ton basis. The owner

International Affairs and Global Strategy www.iiste.org
ISSN 2224-574X (Paper) ISSN 2224-8951 (Online)
Vol.15, 2013
29
is responsible for the payment of all expenses including voyage, operating and capital costs of the vessel. Chartering on a single voyage or a trip charter basis may be referred to as spot chartering activity.
A "contract of affreightment" relates to the carriage of multiple cargoes over the same route and enables the COA holder to nominate different ships to perform the individual sailings. Essentially it constitutes a number of voyage charters to carry a specified amount of cargo during the term of the COA, which usually spans a number of years. All of the ship's operating, voyage and capital costs are borne by the ship owner. The freight rate normally is agreed on a per cargo-ton basis (Kyoungwha, 2010).
Charter hire rates paid for dry bulk carriers are primarily a function of the underlying balance between vessel supply and demand, although at times other factors may play a role. Furthermore, the pattern seen in charter hire rates is broadly mirrored across the different charter types and between the different dry bulk carrier categories. However, because demand for larger dry bulk vessels is affected by the volume and pattern of trade in a relatively small number of commodities, charter hires rates (and vessel values) of larger ships tend to be more volatile than those for smaller vessels. Conversely, trade in minor bulks drives demand for smaller dry bulk carriers. Accordingly, charter hire rates and vessel values for those vessels are subject to less volatility.
< In the time charter market, rates vary depending on the length of the charter period and vessel specific factors such as age, speed and fuel consumption. Short-term time charter hire rates are generally higher than long-term charter hire rates. The market benchmark tends to be a 12-month time charter hire rate, based on a vessel of five to ten years age.
In the voyage charter market, rates are influenced by cargo size, commodity, port dues and canal transit fees, as well as delivery and redelivery regions. In general, a larger cargo size is quoted at a lower rate per ton than a smaller cargo size. Routes with costly ports or canals generally command higher rates than routes with low port dues and no canals to transit. Voyages with a load port within a region that includes ports where vessels usually discharge cargo or a discharge port within a region with ports where vessels load cargo also are generally quoted at lower rates, because such voyages generally increase vessel utilization by reducing the unloaded portion (or ballast leg) that is included in the calculation of the return charter to a loading area.
Within the dry bulk shipping industry, the charter hire rate references most likely to be monitored are the freight rate indices issued by the Baltic Exchange. These references are based on actual charter hire rates under charters entered into by market participants as well as daily assessments provided to the Baltic Exchange by a panel of major shipbrokers (Kyoungwha, 2010).
Report from the Financial Nigeria’s annual report (2007) reviews that as the global economy powered by raising seaborne trade volume, continued to increased, African countries have steadily lost out in opportunity and economic growth. According to the United Nations Conference on Trade and Development, the goods loaded at port worldwide in 2006 were estimated at 7.4 billons tons, an equivalent to an annual growth rate of 4.3 percent dry cargo accounted for 63.9 percent of total goods loaded with the inclusion of bulk, break bulk, and containerized goods. By this, the world seaborne trade is no doubt one of the contributory factors of the improvement of the world GPP. The UNCTAD, 2006 report further reported that “a break down by type of trade indicates the importance to developing Asia”. This reflects the importance of Western Asia producers of an industrious activity in the Far East region of Asian. This was proved by the report; in terms of dry bulk cargo loading developing Asia also accounted for the larger, 14.1 percent and Africa; 5.5 percent. Seaborne trade is and will continue to remains the backbone of international trade with over 80 percent of world merchandise trade by volume being carried by sea. With an annual average growth rate of the world seaborne trade would be expected to increase by 4.4 percent in 2020 and double by 2031, potentially reaching 11.5 billion tons and 16.04 billion tons, respectively (sources UNCTAD; Review of Maritime Transport, 2008). Economist recently wrote that 90 percent of the world cargo representing 8.9 trillion dollars in value moved on ships in 2004. Rate of growth of world trade moved up from 3.9 percent to 9 percent in the same year. Shipbuilding order book in the same year equaled 207m dwt equaling 23 percent of the World fleet size. Rate of growth of the world trade is expected to be 7 percent to serve such huge industrial operations. Where there is no single dominant player, no single nation controlling the operations and regulation is mostly international; the seaborne trade complexity is unmatched. According to World Trade Organization (WTO), the seaborne trade is generally been associated with carriage of high- volume, low -volume
International Affairs and Global Strategy www.iiste.org
ISSN 2224-574X (Paper) ISSN 2224-8951 (Online)
Vol.15, 2013
30
goods (e.g. iron ore, coal). Over recent years the share of low-volume goods (e.g. manufactured goods) carried by sea has been growing. According to the report, manufactured goods account for over 70 percent of the world merchandise trade by value. Trade manufacturing goods include consumption goods as well as inter mediate goods, past and semi-finished products that have expanded in tandem with intra-company trade, trade, international out sourcing and globalization. As much of this trade is carried in containers, world containerized trade has grow over the coming years at a pace that will require a doubling of the container handling capacity. In addition to economics of scale associated with larger large volume, the container shipping sectors is increasingly investing in larger containership to further capitalize on these economies and reduces cost. Traditional agricultural dry bulk cargoes are increasing being transported in containers. Avoiding the higher freight rates in the bulk market and reflecting the greater economies of scale available to larger containerships. These considerations highlight the economic importance of seaborne trading and the potential for further growth in this sector and the expansion of the maritime cargo base to include lower –volume goods, and higher-value goods. Over recent years, the conjunction of several factors has contributed to the dynamism of the international seaborne trade and maritime transport services. This include
� Increased trade liberalization. � Advance in information and communication technology (ICTS). � Transport (larger ships size tracking and tracing technologies). � Sophisticated logistics service (e.g. third party and forth party logistics). � And a new global production process.
A new emerging partner is the increased trade within and among developing regions. China, Brazil, India, Mexico, South Africa, the Republic of Korea and the Russian Federation are propelling south-south trade and corporation, the share of these countries in world exports was 17 percent in 1997, 18 percent in 2000 and 23 percent in 2007 (Farlex; Review of Maritime Transport, 2008).
Clarkson’s Research Studies, recently reviews that tons-miles for dry bulk cargoes may be expected to continue to grow with China’s iron ore needs being increasingly met by new suppliers such as Latin America. In addition to the supply side factor of demand for dry bulk transport (e.g. fleet, transport infrastructure and cargo availability) the performance of seaborne trade is dictated by demand size consideration such as; <
� Level of development (e.g. matured, emerging or growing economics). � The structure of the economy (e.g. service economy, industrial or agricultural based economies). � The political and regulatory frame work (e.g. Trade liberalization) as well as unforeseen event e.g. weather
strikes and political unrest.
An important poser in this regard is that, with all of these demands pull factors, what is the size of Nigerians fleet that can take advantage of the opportunities? (Airahuobhor, 2010). It is no lie that Nigeria as a country has steadily lost out in opportunities and economic growth of dry bulk seaborne trade. Analysts believe that under this circumstance, Nigeria should compel to devise strategies that we give leverage on the available information and opportunities. The urgent task before Nigeria according to experts is to develop their human economic resources and national fleets. By doing, the country will cease to be treasurers of resources and opportunities, it will become a utilizers. 2.4 SUMMARY OF EXTENT LITERATURE The research is based on scrutiny Nigerian seaborne dry bulk trade and the demand for transport. The researcher studies show that this work is a preliminary and indeed a ground-breaking work in dry bulk trade in Nigeria. Although the nation’s dry bulk trade has suffered from its seaborne trading with its trading facilitators, due to the monoculture attitude of trade, since the discoursing and switch to only liquid bulk trading (emphasis on crude oil products), in the early 1950. In 1996, for instant the total seaborne dry trade on Nigeria was 2, 810, 359 tons i.e. 6.25 percent of the entire seaborne trade, while within ten years it experience a dynamic increase to about 12, 536, 236 tons i.e. 28.89 percent of the entire seaborne trade for that year. If this increases continues charters and ship owners will be at gain trading in our sea routes, with most demands for transports originating from Asia with a total tonnage of about 63.86 percent of the entire seaborne trade during the research period.

International Affairs and Global Strategy www.iiste.org
ISSN 2224-574X (Paper) ISSN 2224-8951 (Online)
Vol.15, 2013
31
CHAPTER THREE 3.0 RESEARCH METHOD 3.1 A BRIEF INTRODUCTION The quintessence of this chapter is to define the entire method adopted in this research work. It describes the procedure followed in realizing the aim and objectives in the research.
3.2.1 RESTATEMENT OF RESEARCH QUESTIONS 1. What is the volume of Nigerian entire seaborne trade by regions? 2. What is the percentage distribution of Nigeria’s Seaborne Trade within the research period? 3. What is the trend of Nigerian seaborne trade? 4. Is there any relative degree of importance attached to trend of Nigerian seaborne trade by type of
packaging?
3.2.2 RESTATEMENT OF STATISTICAL HYPOTHESES HO =μ1 The volume of seaborne trade through major regions is not significantly different from zero (at a level of significant (α) 0.05). HO= μ2 The volumes of Nigeria’s seaborne general cargo and bulk trades (1996 – 2005) are not significantly different from zero at (at a level of significant (α) 0.05). HO= μ3 The trend of Nigeria seaborne trade for the period under consideration is not significantly positive (at a level of significant (α) 0.05).
3.3 RESEARCH DESIGN This research study is concerned with the Nigerian dry bulk cargoes and the demand for sea transport. For the purpose of collecting the necessary data for this research, the expo-facto scientific research design was adopted by the used of secondary data. The secondary data, which was primarily the external secondary data would be collected mainly from Nigerian Ports Authority’s Annual Abstract of Port Statistics and others from IMO Annual Review, United Nations Conference on Trade and Development (UN) Review of Maritime Transport Annual (UNCTAD), Clarkson Research Studies, Libraries, Encarta, various world atlas and related literatures, among others. 3.4 RESEARCH DATA COLLECTION SCHEDULE. Secondary data for this ex-pose facto research design were primarily collected from the Nigerian Ports Authority, Annual Abstract of Port Statistics. The data were well constructed to provide discussion of results, for both the research questions and statistical hypotheses by the use of Microsoft Excel (2007) and SPSS/PC+ package respectively. The researcher, for instance will design to use the SPSS/PC+ package schedule to measure the volume and the trend of the entire Nigerian seaborne trade through major regions of the world, using ANOVA and Regression analysis. 3.5. METHOD OF RESEARCH DATA ANALYSES. 3.5.1 INTRODUCTION Researchers often make decisions by studying the relationship between variables, population and process improvement can often be made by understanding how changes in one or more variable affect the process output. ANOVA (Analysis of Variance) models which are one of the methods used by the researcher in testing the statistical hypotheses are a basic type of statistical model used in business research (Osuagwu, 2001). It is a commonly used method for examining the statistically significant differences between the means of two or more populations. They are usually concerned, like regression analysis models, with statistical relation between one or more independent variable and a dependent variable. The researcher further made use of regression analysis, to test the trend of Nigerian seaborne trade over the research period. Regression model, which is a statistical technique in which we use observed data to relate a variable of interest which is called the dependent (or response) variable, to one or more independent (or predictor) variables, the objective is to build a regression model, or prediction, that can be used to describe, predict, and control the dependent variable predict, and control the dependent variable on the basis of the independent variables. In this case, since the researcher will be making use of two independent variables, (that is, cargoes transported and average haul) in his research process, he adopted the multiple regression analysis. 33.6 ANALYSIS OF VARIANCE The method is often referred to by its acronym ANOVA. ANOVA is often a statistical method for determining the existence of difference among several population means. While the aim of ANOVA is to detect difference among
International Affairs and Global Strategy www.iiste.org
ISSN 2224-574X (Paper) ISSN 2224-8951 (Online)
Vol.15, 2013
32
several population means, the technique requires the analysis of different forms under study- hence the name Analysis of Variances (Aczel and Sounderpandian, 2009). 3.6.1 THE HYPOTHESIS TEST OF ANOVA The hypothesis test of Analysis of Variance is and as follows; H0: μ1= μ2= μ3=…= μr
Ha : not all μi (i=1,…r) are equal ……………………………..equ (1) This implies that there are ‘‘r’’ populations, or treatments, under study. The researcher will draw an independent random sample from each of the ‘‘r’’ populations. The size of the sample from population I (i=1… r) is ni and the total sample size is given as n=n1 +n2+…+nr The researcher further presents the assumption that he satisfied in using the Analysis of Variance procedure in testing of the slated statistical hypotheses. They include;
� Assume independent random sample from each of the ‘‘r’’ population of the seaborne trade trends. � Assume that the ‘‘r’’ population under research are normally distributed, with means μi that may or may not be
equal, but with equal variances σ2.
3.7 MULTIPLE REGRESSION ANALYSIS Multiple regression analysis is the study of how many a dependent variable ‘‘y’’ is related to two or more independent variable x’’. It is given by; Y= βo+β1x1+β2x2+...+ β p Xp……………………………………Equ3.1 In the general case, as shown the researcher uses ‘‘y’’ to denote the number of independent variables (that is, Demand for transport). The equation that describes how the dependent variable ‘’y’’ is related to the independent variables x1 x2 ... Xp and an error term ‘‘E’’ is called the Multiple Regression Model, as shown below, Y= βo+β1x1+β2x2+...+ β p Xp + E ……………………………………… Equ 3.2 In the multiple regression model, = βo, β1, β2 ...+ βp are the parameters and E’ (the Greek letter epsilon) is a random variable. A close examination of this model reveals that ‘‘y’’ is a linear function of x1, x2. . . xp (the βo+β1x1+β2x2+...+ β p Xp part) plus an error term (Anderson, 2004). 3.7.1 TESTING FOR SIGNIFICANCE In this section, the researcher will show how he would conduct significance test for a multiple regression relationship. He starts by defining the purposes of f test and t test to be used. The F test was used to determine whether a significant relationship exist between the dependent variable and the set of all the independent variable in the model, the researcher will refer to the f test as the test for over all significance. If the f test shows an overall significance the test is used to determine whether each of the individual independent variables is significant. A separate t test is conducted for each of the independent variable in the model; the researcher refers to each of this t test as a test for individual significances.
CHAPTER FOUR 4.0 PRESENTATION AND ANALYSIS OF DATA 4.1 A BRIEF INTRODUCTION In this chapter, the researcher present the empirical findings resulting from the analyses of the data gathered in order to address the various research questions and statistical hypotheses. Major portions of these findings will be presented as tables, chart or graph accompanied by a narration that directs the attention of the reader to the important aspects of the displayed empirical results. 4.2 PRESENTATION OF DESCRIPTIVE STATISTICS AND BRIEF CO MMENTS ON THEM. 4.2.1 ANALYSING THE RESEACH QUESTIONS.
1. What is the volume of Nigerian entire seaborne trade by region? <,,,

International Affairs and Global Strategy www.iiste.org
ISSN 2224-574X (Paper) ISSN 2224-8951 (Online)
Vol.15, 2013
33
AFRICA AUSTRALIA ASIA USA EUROPE UNSPECIFIED
18.54569 0.654289 63.85595 38.80664 52.64201 7.060583 Figure 4.2.1a: Origin of Nigeria’s imports (1995 -2005). M/t (000,000) Source:Collated by the researcher. From figure 4.2.1a presents the descriptive statistics of the volume of Nigeria’s entire origin of import in respect to regions of the world. It was revealed from the figure, that Nigeria’s most imports were originated from Asia region with 63,855,950 tons of cargoes; this was followed by Europe with a total tonnage of 52,642,014 tons. Slightest in the tonnage of cargoes on imported to Nigeria within the research period was Australia with 654,289 tons of cargoes.
AFR AUSTR ASIA USA EUROPE UNSPEC
3.680039 0.00768 5.138717 47.180859 12.680735 17.872883 < Figure 4.2.1b: Destination of Nigeria’s Exports (1996-2005). M/T (000,000). Source:Collated by the researcher.
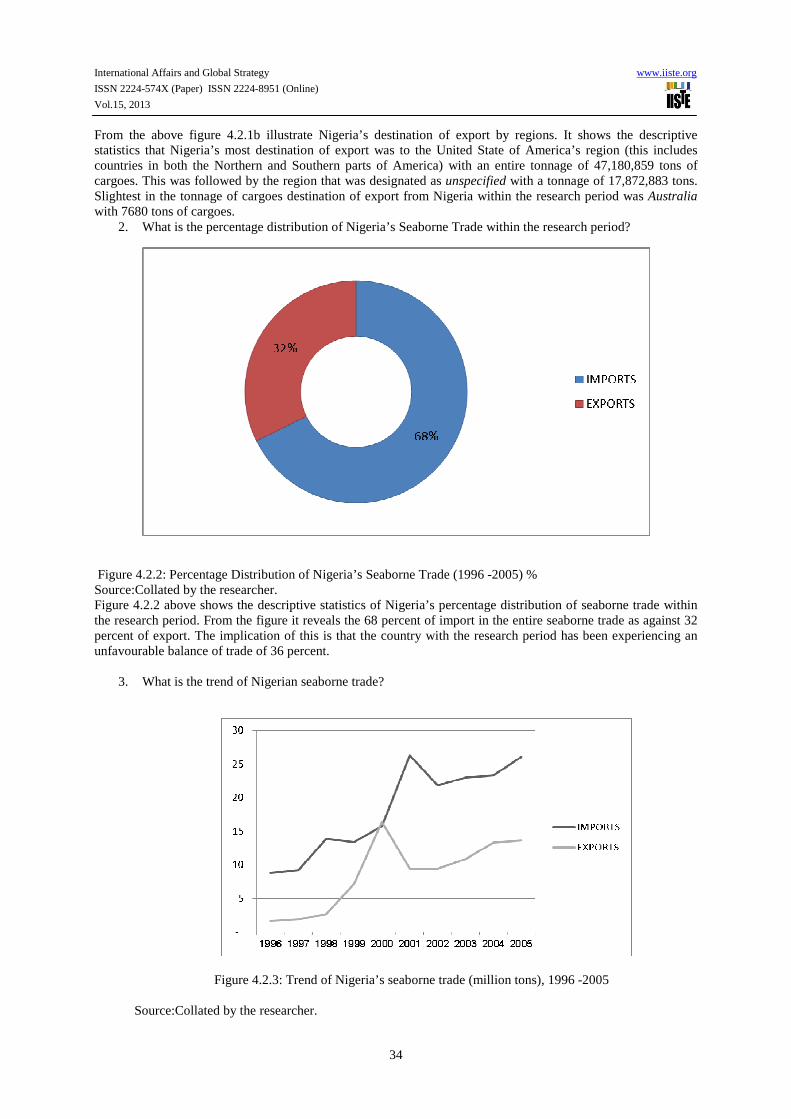
International Affairs and Global Strategy www.iiste.org
ISSN 2224-574X (Paper) ISSN 2224-8951 (Online)
Vol.15, 2013
34
From the above figure 4.2.1b illustrate Nigeria’s destination of export by regions. It shows the descriptive statistics that Nigeria’s most destination of export was to the United State of America’s region (this includes countries in both the Northern and Southern parts of America) with an entire tonnage of 47,180,859 tons of cargoes. This was followed by the region that was designated as unspecified with a tonnage of 17,872,883 tons. Slightest in the tonnage of cargoes destination of export from Nigeria within the research period was Australia with 7680 tons of cargoes.
2. What is the percentage distribution of Nigeria’s Seaborne Trade within the research period?
Figure 4.2.2: Percentage Distribution of Nigeria’s Seaborne Trade (1996 -2005) % Source:Collated by the researcher. Figure 4.2.2 above shows the descriptive statistics of Nigeria’s percentage distribution of seaborne trade within the research period. From the figure it reveals the 68 percent of import in the entire seaborne trade as against 32 percent of export. The implication of this is that the country with the research period has been experiencing an unfavourable balance of trade of 36 percent.
3. What is the trend of Nigerian seaborne trade?
Figure 4.2.3: Trend of Nigeria’s seaborne trade (million tons), 1996 -2005
Source:Collated by the researcher.

International Affairs and Global Strategy www.iiste.org
ISSN 2224-574X (Paper) ISSN 2224-8951 (Online)
Vol.15, 2013
35
Figure 4.2.3 provides a clearer picture about the descriptive statistics of Nigeria’s entire seaborne trade within the research period, with imports on a continuous progressively increases as against export.
4. Is there any relative degree of importance attached to trend of Nigerian seaborne trade by type of
packaging?
Figure 4.2.4a: Trend of Nigeria’s seaborne import trade (1996 -2005) by type of packaging.
Source:Collated by the researcher. Figure 4.2.4a illustrates Nigeria’s trend of imports by type of packaging. It presents the descriptive statistics and reveals that most of Nigerian imports by type of package were general cargo with 77,980,978 tons of cargoes during the research period, followed by dry bulk with 74,398,155 tons of cargoes and slightest by liquid bulk with 72,758,369 tons of cargoes.
Figure 4.2.4b: Trend of Nigeria’s seaborne export trade (1996 -2005) by type of packaging Source:Collated by the researcher. Figure 4.2.4b illustrates Nigeria’s trend of exports by type of packaging. Its reveals the descriptive statistics of Nigerians most exports by type of package as liquid bulk with 74,450,469 tonnes of cargoes during the research
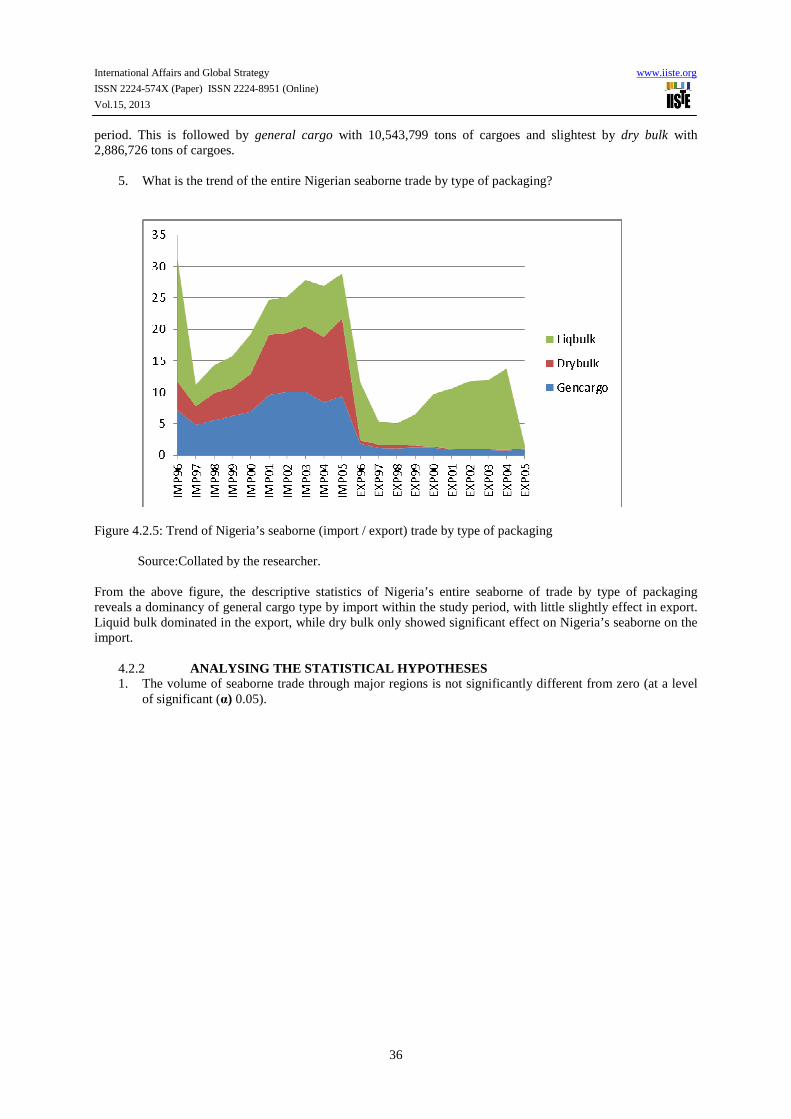
International Affairs and Global Strategy www.iiste.org
ISSN 2224-574X (Paper) ISSN 2224-8951 (Online)
Vol.15, 2013
36
period. This is followed by general cargo with 10,543,799 tons of cargoes and slightest by dry bulk with 2,886,726 tons of cargoes.
5. What is the trend of the entire Nigerian seaborne trade by type of packaging?
Figure 4.2.5: Trend of Nigeria’s seaborne (import / export) trade by type of packaging
Source:Collated by the researcher.
From the above figure, the descriptive statistics of Nigeria’s entire seaborne of trade by type of packaging reveals a dominancy of general cargo type by import within the study period, with little slightly effect in export. Liquid bulk dominated in the export, while dry bulk only showed significant effect on Nigeria’s seaborne on the import.
4.2.2 ANALYSING THE STATISTICAL HYPOTHESES 1. The volume of seaborne trade through major regions is not significantly different from zero (at a level
of significant (α) 0.05).

International Affairs and Global Strategy www.iiste.org
ISSN 2224-574X (Paper) ISSN 2224-8951 (Online)
Vol.15, 2013
37
Table 4.2.2a: Analysis of Variance showing the seaborne trade between Nigeria and major analytical regions
Bartlett's test for equal variances: chi2( 5) = 148.6987 Prob>chi2 = 0.000
Total 1.0300e+09 119 8655727.58 Within groups 752264496 114 6598811.37Between groups 277767087 5 55553417.3 8.42 0.0000 Source SS df MS F Prob > F Analysis of Variance
Total 2234.3839 2942.0618 120 USA 4299.3747 3053.6136 20 UNSPEC 1246.6733 2339.9566 20 EURO 3266.1374 2711.6107 20 AUST 33.09845 69.906435 20 ASIA 3449.7334 4063.0228 20 AFR 1111.2864 962.8299 20 ORI_DEST Mean Std. Dev. Freq. Summary of MT
Source:Collated by the researcher.
From table 4.2.2a, the average values of seaborne trade between Nigeria and major analytical regions for the relevant period are as shown above. The p-value of ANOVA’s F-statistic was 0.0000. This is less than 0.05 (the level of significance). Therefore we refute the null and accept the alternative hypothesis that significant differences exist in the volume of trade between Nigeria and the regions considered, at p<0.05. To statistically test the difference between any pair of regions, a post-hoc analysis employing Scheffe test was conducted. Table 4.2.2b below identifies the most important region as; USA (4,266.28 million tons), ASIA (3,416.63 million tons) and EUROPE (3,233.04 million tons) with p-values of 0.00, 0.005, and 0.01 (at α=0.05) respectively.
Table 4.2.2b: PAIRWISE COMPARISON OF MEAN TRADE VOL. BETWEEN REGIONS (SCHEFFE TEST)
Row Mean-
Col Mean AFRICA ASIA AUSTRALIA EUROPE UNSPEC
ASIA 2338.45
(0.151) AUSTRALIA -1078.19 -3416.63
(0.88) (0.005)* EUROPE 2154.85 -183.60 3233.04
(0.23) (1.00) (0.01)* UNSPEC 135.39 -2203.06 1213.57 -2019.46
(1.00) (0.205) (0.815) (0.297) USA 3188.09 849.64 4266.28 1033.24 3052.70
(0.012)* (0.954) (0.00)* (0.90) (0.02)*
P- Values in parenthesis. * Significant at α = 0.05.
Source:Collated by the researcher.

International Affairs and Global Strategy www.iiste.org
ISSN 2224-574X (Paper) ISSN 2224-8951 (Online)
Vol.15, 2013
38
2. The volumes of Nigeria’s seaborne general cargo and bulk trades (1996 – 2005) are not significantly different from zero at (at a level of significant (α) 0.05).
Table 4.2.3a: Summary of seaborne trade
Total 5216.9749 4295.7477 60 Liq_Bulk 7360.4419 4176.3546 20 Dry_Bulk 3864.2441 4316.5866 20 Gen_Cargo 4426.2389 3715.8217 20 TYPE Mean Std. Dev. Freq. Summary of Trade
Source:Collated by the researcher.
Table 4.2.3b: F-statistic of the ANOVA
Total 1.0888e+09 59 18453448.6 Within groups 947761567 57 16627395.9Between groups 140991898 2 70495949.2 4.24 0.0192 Source SS df MS F Prob > F Analysis of Variance
Source:Collated by the researcher.
The F- statistic of the ANOVAs test (table 4.2.3b) is 4.24 with p-value of 0.0192. This is significant at α = 0.05. Therefore we refute the null and accept the alternative hypothesis that significant differences exist in the general and bulk cargo trades between Nigeria and major trading regions during the period under consideration, at p<0.05. < A pair-wise comparison of the trade types shows that liquid bulk cargo constituted the major commodity during the relevant period with a total volume of 3,496.2 million tons. See table 4.2.3c below Table 4.2.3c: Comparison of Trade by Type
Source:Collated by the researcher.
0 . 0 8 4 0 . 032L iq_Bulk 29 3 4 . 2 34 9 6.2 0 . 9 1 0 D ry_Bulk -561 . 9 9 5
C ol Mean Gen_ C a r g Dr y_ B ul kR ow Mean- (S c h e ffe)

International Affairs and Global Strategy www.iiste.org
ISSN 2224-574X (Paper) ISSN 2224-8951 (Online)
Vol.15, 2013
39
3. The trend of Nigeria seaborne trade for the period under consideration is not significantly positive (at a
level of significant (α= 0.05)
<,
Table 4.2.4: Regression of seaborne trade
_cons 1835.888 571.8705 3.21 0.002 703.328 2968.447 _Itype_2 -3924.778 1012.851 -3.87 0.000 -5930.677 -1918.879 T 39.0229 14.61976 2.67 0.009 10.06924 67.97656 Trade Coef. Std. Err. t P>|t| [95% Co nf. Interval]
Total 1.0300e+09 119 8655727.58 Root MSE = 2773.5 Adj R-squared = 0.1113 Residual 900011427 117 7692405.36 R-squared = 0.1262 Model 130020156 2 65010077.9 Prob > F = 0.0004 F( 2, 117) = 8.45 Source SS df MS Number of obs = 120
i.type _Itype_1-2 (naturally co ded; _Itype_1 omitted)
Source:Collated by the researcher. Table 4.2.4 above, was obtained after regression of total trade volume (import and export) on the trend T. The coefficient of the trend is a positive value of 39.0229. Its t-statistic is 2.67. This is significant at α = 0.05. Therefore, we refute the null and accept the alternative that Nigeria’s seaborne trade increased in the relevant period. However to check for the effect of type of trade on the regression equation, import and export trade dummy was included as explanatory variable. Itype_2 is an indicator variable for export trade. Its negative coefficient with value of -3924.778 has a significant p-value of 0.00. This implies that for the research period, Nigeria’s exports declined in comparison with imports. 4.3 DISCUSSION OF FINDINGS 4.3.1 DISCUSSION OF FINDINGS ACCORDING TO RESEARCH QUESTIONS. Figure 4.2.1a as shown by the researcher, presents the descriptive statistics of the regions of the world as grouped as follows; Africa, Australia, Asia (including, Oceanic and Far East countries), USA (including, South and North America), Europe, and Unspecified region (that is, countries not specified by NPA). From the graph in fig.4.2.1a, it’s observed that most of Nigeria seaborne trades were most originated in Asia, with an approximated percentage of 35.17 of the entire imports to Nigeria, within the research period; this was followed by Europe with an approximated percentage 28.99. The slightest was Australia with a percentage 0.36 of the entire seaborne trade. Uninterrupted increase in the lead of the Asia region, mostly in the Far East (especially china and Japan), in its liner trades to and from the Nigeria, the besides routes are to Passing through the Mediterranean, the Suez Canal, the Malacca straits and finally to the Atlantic in West Africa. This implies that there is demand for transport between Nigeria’s sea route and that of Asia’s than any other. Figure 4.2.1b shows Nigeria’s most destination of seaborne trade to be USA region with an approximated value of 54.5 percent of the entire trade. This value is a combine tonnage of both North and South America cargo throughputs. The development of iron is exploration in Brazil (Northern America) in combination with increased steel production in China (Asia region) has had a very positive influence on the average haul for panamax vessels (60-80,000 dwt) in Nigeria. Figure 4.2.2 shows the descriptive presentation of the percentage distribution of the entire Nigeria seaborne trade within the research period. This clearly reveals Nigeria dependency on import (i.e. foreign reliance). This situation indeed had rely affected the economic state of the nation (including the GDP) and had caused an unfavourable balanced trade,

International Affairs and Global Strategy www.iiste.org
ISSN 2224-574X (Paper) ISSN 2224-8951 (Online)
Vol.15, 2013
40
there by leading to a trade deficit or trade gap. The researcher views the remedy to this on the side of import substitution strategy and import restriction, through;
� High tariff of locally trades imported. � High import quota, especially on luxurious goods and services. � Curtailment or reduction of imports.
, Figure 4.2.3 reveals the descriptive statistics of the trend of Nigeria’s seaborne trade within the study period. This show a steadily increase of the import. Similar situation as seen above will also be observed. Figure 4.2.4a addresses the issue of the relevance of dry bulk trades than other trades by packaging in Nigeria’s import trade. With an approximated tonnage of 33 percent of the entire seaborne trade of origin of import and 32.8 percent of destination of export. This will aid cargo balance of trade and balance of payments carrying capacity, which in turns, allows the shipping industry to access how many dry bulk vessels are required and on what route. Hence, the theory; dry bulk commodity must be moved from regions where supply is greater than demand exporting regions to regions where demand is greater than supply importing regions. Figure 4.2.4b reveals an incessant increase of the liquid bulk on the seaborne export trend. This reveals Nigeria’s over reliance and dependency on liquid bulk and neglect of the dry bulk. This is as a result of the oil discovery in the 50’s, since then trades have been monopolized. Figure 4.2.5 shows the descriptive statistics of Nigeria’s trend of seaborne trade (import and export) within the research periods. It reveals Nigeria’s most seaborne trade exported as liquid bulk, which is composed mainly as petroleum derivative. This trade has indeed been taking lead in Nigeria’s seaborne trade and will still until the Government strategies ways of dry bulk trades input.
4.3.2 DISCUSSION OF FINDINGS ACCORDING TO STATISTICAL HYP OTHESES.
Table 4.2.1a reveals the test of the slated null hypothesis that the volume of seaborne trade through major regions is not significantly different from at a level of significant (α) = 0.05. The selected regions include; Africa, Australia, Asia (including, Oceanic and Far East countries), USA (including, South and North America), Europe, and Unspecified region (that is, countries not specified by NPA). The p-value of ANOVA F-statistic was 0.0000 at .05 level of significant. This made the researcher to refute the null hypothesis, which means that it is tantamount to accept the alternative hypothesis that significant differences exist in the volume of trade between Nigeria and the selected regions under consideration. This gives the importance of Nigeria seaborne trade not only to its region along, but the entire world.
<< Table 4.2.1b, further gave the statistically test of the demand for transport using the Scheffe test by a pair wise comparison of the mean of the seaborne trade. USA region among others was most significant at 0.00 with 4,266.28 million tons. This was followed by ASIA region at 0.005 with 3,416.63 million tons and insignificance by unspecified region at (0.2970) with -2019.46 million tons. The implication of this implies an increase of vessels trading in USA regions than any other regions of the world and a hectic sea route to and from Nigeria.
Table 4.2.2 reveals the test of the slated null hypothesis that the volume of seaborne general cargo and bulk trade within the research period is not significantly different from at a level of significant (α) = 0.05. The selected bulk trades were liquid bulk and dry bulk. The researcher reveals that at F-statistic of the ANOVA test is 4.24 with p-value of 0.0192. This implies a refute of the null hypothesis and a acceptance of the alternative that there is significant differences exist in the general and bulk trades between Nigeria and major trading regions during the period under consideration, at p<0.05. It shows Nigeria’s dependence on liquid bulk, which had greatly affected the dry bulk trades in Nigeria’s seaborne.
Lastly tested was the trend of Nigeria’s seaborne trade within the research period not significantly positive at α = 0.05. Here the researcher made use of regression analysis after a total of the entire seaborne on the trend T at a coefficient 39.0229. The entire result reveals that within the research period, Nigeria’s exports declined in comparison with import. The implication of this is an unfavourable balance of trade or simply trade definite, which could only be ratified by any of the slated method by the researcher below;
� High tariff of locally trades imported. � High import quota, especially on luxurious goods and services. � Curtailment or reduction of imports.

International Affairs and Global Strategy www.iiste.org
ISSN 2224-574X (Paper) ISSN 2224-8951 (Online)
Vol.15, 2013
41
Furthermore, some economists and analysts believe that on unfavourable balance of trade, especially if sustained, causes unemployment and lowers GDP growth. Others believed that the more international trade occurs, the more likely it is that foreign companies will invest in the home country, negating any negative effect.
CHAPTER FIVE
5.0 SUMMARY, CONCLUSIONS AND RECOMMENDATIONS 5.1 SUMMARY The research focuses on the demand side of seaborne trade but emphasis on dry bulk. The demand for transport of dry bulk trade is a derived demand. The derived demand is dependent upon the nature of goods traffic in seaborne trade. If the demand for a commodity is more, the relative nature of that goods traffic becomes more. As the world became more developed, proximity to raw materials and to markets, demand became the factors that, about all others shaped the world’s economy and, in particular the major trade partners and sea routes. The key elements influencing the supply of dry bulk carriers are vessel deliveries and the loss of existing vessels through scrapping or other circumstances requiring removal. Generally, growth in gross domestic product and industrial production correlates with peaks in demand for seaborne transportation. Certain economies will act from time to time as the "primary driver" of the dry bulk carrier market. Nigeria’s seaborne trade has still and would still remain the focal point of West African traffic. For instance, the cargo throughput to and from Nigeria accounts for more than 70 percent of the total volume of cargo generated by the entire West Africa sub-region of Africa.
The descriptively statistics of the trends of Nigeria’s seaborne trade reveals that Nigeria major exports were of more demand in the United States of America and Europe regions of the world, which are the major converters of Nigerian raw-materials to semi-finished and finished products (industrialized products).
< What's more a test using the Statistical Package for Social Scientist to test for the volume of Nigerian seaborne trade through major regions, reveal a significant trade with the USA at α = 0.05. The implication of this is simply implies a demand of transport in the region and a busy sea route alone the region to and from Nigeria. Although the researcher support similar work such as Clark et al. (2004:417), who finds that transport costs are a significant determinant of bilateral trade between Latin America and the USA, as transport cost contributes significantly to shaping the volume, structure and patterns of seaborne trade as well as countries comparative advantages and trade competitiveness. 5.2 CONCLUSION
The conclusion and findings of this research work based on empirical evidence from this research are vast.
<
The trend in the volume of Nigerian seaborne trade through major regions was significantly different from zero at α = 0.05. However, because demand for larger dry bulk vessels is affected by the volume and pattern of trade in a relatively small number of commodities, charter hires rates (and vessel values) of larger ships tend to be more volatile than those for smaller vessels. This will persist to rise constantly yearly. Although, the Nigerian government cannot be said to have be earning much from this seaborne trades, since as a nation it’s still suffer its own national carriers. Also, the researcher further tested using ANOVA pair wise comparison of mean trade of the Nigeria’s seaborne trade between the selected regions of the world. The result reveals the USA region as the most significant with p-value of 0.000, using the Scheffe test. This signifies that Nigeria engages in seaborne international trade with most countries in the USA region compare to others. By this, Nigeria has evolved to the global trend of not being self-sufficient only on its domestic resources. It engages in one level or the other in the process of selling what it has and acquiring what it needs. In addition to the supply side factor of demand for dry bulk transport (e.g. fleet, transport infrastructure and cargo availability) the performance of seaborne trade was also dictated by the demand size consideration.
5.3 RECOMMENDATIONS
From the research, it was revealed that Nigeria’s trend of seaborne trade had been significant at p=0.05 within the research period. From the analyses of the research questions and statistical hypotheses, the researcher will
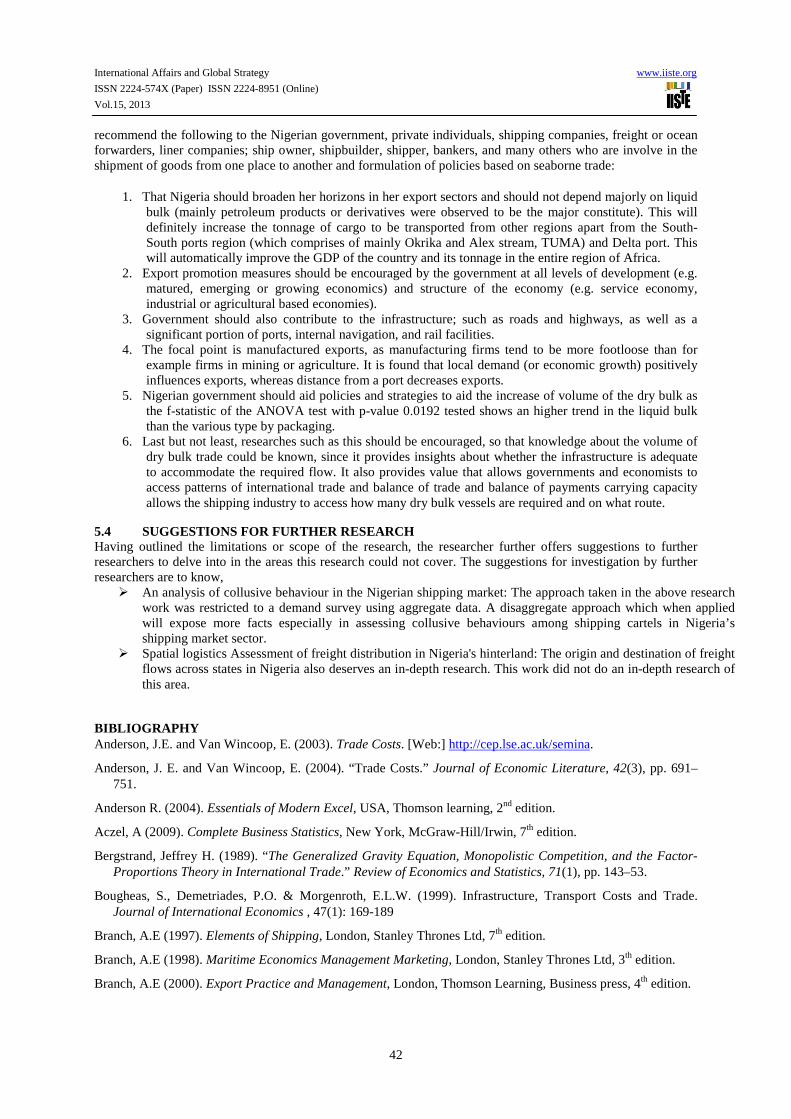
International Affairs and Global Strategy www.iiste.org
ISSN 2224-574X (Paper) ISSN 2224-8951 (Online)
Vol.15, 2013
42
recommend the following to the Nigerian government, private individuals, shipping companies, freight or ocean forwarders, liner companies; ship owner, shipbuilder, shipper, bankers, and many others who are involve in the shipment of goods from one place to another and formulation of policies based on seaborne trade:
1. That Nigeria should broaden her horizons in her export sectors and should not depend majorly on liquid bulk (mainly petroleum products or derivatives were observed to be the major constitute). This will definitely increase the tonnage of cargo to be transported from other regions apart from the South-South ports region (which comprises of mainly Okrika and Alex stream, TUMA) and Delta port. This will automatically improve the GDP of the country and its tonnage in the entire region of Africa.
2. Export promotion measures should be encouraged by the government at all levels of development (e.g. matured, emerging or growing economics) and structure of the economy (e.g. service economy, industrial or agricultural based economies).
3. Government should also contribute to the infrastructure; such as roads and highways, as well as a significant portion of ports, internal navigation, and rail facilities.
4. The focal point is manufactured exports, as manufacturing firms tend to be more footloose than for example firms in mining or agriculture. It is found that local demand (or economic growth) positively influences exports, whereas distance from a port decreases exports.
5. Nigerian government should aid policies and strategies to aid the increase of volume of the dry bulk as the f-statistic of the ANOVA test with p-value 0.0192 tested shows an higher trend in the liquid bulk than the various type by packaging.
6. Last but not least, researches such as this should be encouraged, so that knowledge about the volume of dry bulk trade could be known, since it provides insights about whether the infrastructure is adequate to accommodate the required flow. It also provides value that allows governments and economists to access patterns of international trade and balance of trade and balance of payments carrying capacity allows the shipping industry to access how many dry bulk vessels are required and on what route.
5.4 SUGGESTIONS FOR FURTHER RESEARCH Having outlined the limitations or scope of the research, the researcher further offers suggestions to further researchers to delve into in the areas this research could not cover. The suggestions for investigation by further researchers are to know,
� An analysis of collusive behaviour in the Nigerian shipping market: The approach taken in the above research work was restricted to a demand survey using aggregate data. A disaggregate approach which when applied will expose more facts especially in assessing collusive behaviours among shipping cartels in Nigeria’s shipping market sector.
� Spatial logistics Assessment of freight distribution in Nigeria's hinterland: The origin and destination of freight flows across states in Nigeria also deserves an in-depth research. This work did not do an in-depth research of this area.
BIBLIOGRAPHY Anderson, J.E. and Van Wincoop, E. (2003). Trade Costs. [Web:] http://cep.lse.ac.uk/semina.
Anderson, J. E. and Van Wincoop, E. (2004). “Trade Costs.” Journal of Economic Literature, 42(3), pp. 691–751.
Anderson R. (2004). Essentials of Modern Excel, USA, Thomson learning, 2nd edition.
Aczel, A (2009). Complete Business Statistics, New York, McGraw-Hill/Irwin, 7th edition.
Bergstrand, Jeffrey H. (1989). “The Generalized Gravity Equation, Monopolistic Competition, and the Factor-Proportions Theory in International Trade.” Review of Economics and Statistics, 71(1), pp. 143–53.
Bougheas, S., Demetriades, P.O. & Morgenroth, E.L.W. (1999). Infrastructure, Transport Costs and Trade. Journal of International Economics , 47(1): 169-189
Branch, A.E (1997). Elements of Shipping, London, Stanley Thrones Ltd, 7th edition.
Branch, A.E (1998). Maritime Economics Management Marketing, London, Stanley Thrones Ltd, 3th edition.
Branch, A.E (2000). Export Practice and Management, London, Thomson Learning, Business press, 4th edition.

International Affairs and Global Strategy www.iiste.org
ISSN 2224-574X (Paper) ISSN 2224-8951 (Online)
Vol.15, 2013
43
Buhari, C.M. (2010). An analysis of Nigerian Seaborne trade. Unpublished B.Tech project, Department of Maritime Technology, Federal University of Technology, Imo, Nigeria.
Busse, M. (2003). Tariffs, Transport Costs and the WTO Doha Round: The Case of Developing Countries. The Estey Centre Journal of International Law and Trade Policy, 4(1): 15-31.
Clark, X., Dollar, D. and Micco, A. (2004). Port Efficiency, Maritime Transport Costs, and Bilateral Trade. Journal of Development Economics, 75(2): 417-450.
Clarkson Research Studies Limited (http://www.clarksons.netlimited access).
Coetzee, Z.R., et al (1997). Currency Depreciation, Trade Liberalization and Economic Development. The South African Journal of Economics, 65(2): 165-190.
Cook, R.D and Weisberg (1999). Applied Regression including Computing and Graphics, New York, John Wiley and son’s publishers, 2nd edition.
Coutinho, J.D (2006). Transportation: A Services. A special publication of the New York Academy Services, New York.
Crainic, T.G. and Laporte, G. (1997). Planning Models for Freight Transportation. European Journal of Operational Research, 97(3):409—438.
Damachi,B.B.and Zhaosheng,Y.(2005). The Nigerian Shipping Industry and Indigenous Shipping Companies. Maritime Policy and Management Vol 32 No 1 pp 31-38(8) Routledge, Taylor & Francis Group.
Deardorff, A.V. (1995). Determinants of Bilateral Trade: does Gravity Work in a Neoclassical World? NBER Working Paper no.5377.
Dykstra D (2005). Commercial Management in Shipping. London, Published by the Nautical Institute.
Encarta (2007). World Map.
Eriksen, I.E (1982). The Demand for Bulk Ship Services. New York: Menbra Hill Inc; 2nd edition.
Farlex Free Library (2008). Review of Maritime Transport.
Fearnresearch (2004) Dry Bulk Market (http://www.fearnresearch.com).
Financial Nigerian News (2007).
Foster, N. (2006). Exports, Growth and Threshold Effects in Africa, Journal of Development Studies, 42(6): 1056 -1074.
Fosu, A.K. (1990a). Exports and Economic Growth: The African Case. World Development, 18(6): 831-835.
Fosu, A.K. (1990b). Export Composition and the Impact of Exports on Economic Growth of Developing Countries. Economic Letters, 34(1): 67-71.
Genco Shipping and Trading Limited
Gopal R.C. (2006). Export-Import Procedures Document and Logistics. New age International publishers 1st edition.
Hans J.F (2001) ‘‘Developments in Global Seaborne and Container Shipping Markets; Their Effects on Port Industry and Private Sector Involvement’’ Palgrave Macmillan Journal International Journal of Maritime Economics.
Hoffmann, J. (2002). The Cost of International Transport, and Integration and Competitiveness in Latin America and the Caribbean. FAL Bulletin, 191, July.
Hummels, D. (1999). “Toward a Geography of Trade Costs” Purdue University, Center for Global Trade Analysis (GTAP) Working Paper: No. 17.
IMF, Global Economic Outlook, September 2004 (http://www.imf.org/external/tr/2004/tr040929.htm).
International Maritime Organisation. (2002b). Safer shipping demands a safety culture. Paper presented at the World Maritime Day.

International Affairs and Global Strategy www.iiste.org
ISSN 2224-574X (Paper) ISSN 2224-8951 (Online)
Vol.15, 2013
44
Kavussanos, M.G. (1996). "Comparisons of volatility in the dry cargo ship sector. Spot versus time-charters, and smaller versus larger vessels, "Journal of Transport Economics & Policy, January 1996, Vol. XXX, No. 1 pp (67-82).
Kavussanos, M.G. and Alizadeh, A. (2001). "Seasonality pattern in dry bulk shipping spot and time charier freight rates', Transport Research Part E, Logistics and Transportation review, Vol. 37, No 6, pp 443-367,2001.
Khalid, N (2OO8). Trade with thy Neighbors: growth and trade in South East Asia, Singapore 9-10 April.
Klovland, J.T. (2003). Business Cycles, commodity price and Shipping Freight rate: some evidence from pre-WWI period.
Kyoungwha I. (2010). Chinese Bulk Demand to Drive Advance in Baltic Dry Index, Cosco forecast. Journal of Economic Perspectives 10.
Limăo, N. and Venables, A.J. (2001). Infrastructure, Geographical Distance, Transport Costs and Trade. World Bank Economic Review. 15(3): 451-479.
Limăo, N. and Venables, A.J. (2002). Geographical Disadvantage: A Hecksher-Ohlin-von Thünen Model of International Specialisation. Journal of International Economics, 58: 239-263.
Makkar, J. (2008). Tutorship material adopted with permission from Director, Institute of Chartered Shipbrokers column.
McCarthy, P. S. (2001). Transportation Economics-Theory and Practice: A Case Study Approach. Blackwell Publishers Inc.: Malden, Massachusetts.
Ndikom, O.B.(2006). The Kernel Concept of Shipping Operations, Policies and Strategies: The industry overview. Lagos; Bunmico Publishers.
Nick C. and Edge A. (2007). Dry Bulk Demand, Rates solid in Rod-TBS CEO. New York March, 23.
Nie, N. et al, (1975). SPSS: Statistical Package for the Social Sciences, New York: Menbra Hill Inc; 2nd edition.
Norusis, M. J, (1987). The SPSS Guide to Data Analysis, Chicago SPSS Inc; 1st edition.
Okon, R.N (2004). Global Integration and the Growth of Nigeria’s non-oil Exports. A paper presented at the African conference 20-21 March, 2004, Oxford, UK.
Oladokun, S. (2009). Ship Building Trend. Lagos; Bunmico Publishers.
Onyemaechi, C (2010). Demand Analysis of Nigerian Shipping Market. Unpublished PhD Thesis, Department of Maritime Management Technology, Federal University of Technology, Imo, Nigeria.
Osuagwu, L.C (2001). Business Research Method: Principles and Practice. Lagos: Grey Resource Ltd, 2nd edition.
Oum,T.H (1979). A cross sectional Study of Freight Transport Demand and Rail Truck Competition in Canada. The Bell Journal of Economics, 10(3), pp 463-482.
Oum, T. H., Waters II, W.G., and Jong-Say Y. (1992). “Concepts of Price Elasticities of Transport Demand and Recent Empirical Estimates: An Interpretative Survey.” Journal of Transport Economics and Policy, 26(2), 139-69.
Oum, T. H. (1989). “Alternative Demand Models and Their Elasticity Estimates.” Journal ofTransport Economics and Policy, 5, 163-87.
Radelet, S. and Sachs, J. (1998). Shipping Costs, Manufactured Exports and Eonomic Growth. [Web:]http://www.earthinstitute.columbia.edu/about/director/pubs/shipcost.pdf [Date of access: 9 June 2005].
Schmitthoff et al (1990). Schmitth off’s Export Trade, London, Thomson learning Business press, 9th edition.
Small, K. and Winton, C. (1998). The Demand Transportation: Models and Application. New York: Menbra Hill Inc; 2nd edition.
International Affairs and Global Strategy www.iiste.org
ISSN 2224-574X (Paper) ISSN 2224-8951 (Online)
Vol.15, 2013
45
Stopford, M (1988). Maritime Economics; 1nd edition, Rutledge.
Stopford, M (1997). Maritime Economics; 2nd edition, Rutledge.
Stopford, M (2009). Maritime Economics; 3nd edition, Rutledge.
Porto, G.G. (2005). Informal Export Barriers and Poverty. Journal of International Economics, 66: 447-470.
United Nations Conference on Trade and Development (UNCTAD), (2005). Review of Maritime Transport, 2005 New York and Geneva: United Nations.
United Nations Conference on Trade and Development (UNCTAD), (2006). Review of Maritime Transport, 2006 New York and Geneva: United Nations.
Venables, A.J. (2001). Geography and International Inequalities: the Impact of New Technologies. [Web:] http://econ.lse.ac.uk/staff/ajv/abcde3.pdf [Date of access: 3 Jan. 2006].
Venables, A.J. (2005). Geographical Economics: Notes on Africa. Journal of Development Perspectives, 1(1): 63-84.
William et al (1995). World Book Atlas. World Book Inc. Chicago.
Winston,C.(1983). Exchange Rate Expectations and the Foreign Exchange Markets. Academia Economic papers, Vol II No. 1, March.
Winston, Clifford. (1983). “A Disaggregate Model of the Demand for Intercity Freight Transportation.” Econometrica, 49(4), 981-1006.
Winston, Clifford. (1983). “The Demand for Freight Transportation: Models and Applications.” Transportation Research, 17(11), 419-27.
APPENDICES APPENDIX TABLE 1 : ORIGIN OF NIGERIAN’S IMPORTS BY TYPE OF PACKAGING (1995-2005) M/T (000,000).
YEAR GENERAL CARGO DRY BULK
LIQUID BULK TOTAL
1996 7,130,955 4,543,878 19,514,271 31,189,104
1997 4,789,835 3,002,846 3,420,943 11,213,624
1998 5523477 4,316,408 4,446,979 14286864
1999 6,238,947 4479593 5,032,791 15,751,331
2000 6,880,333 6,022,251 6,327,912 19,230,496
2001 9560532 9553569 5,554,690 24668791
2002 10026567 9397988 5781825 25206380
2003 10,064,171 10,377,285 7,397,837 27,839,293
2004 8,409,610 10,368,487 8,128,978 26,907,075
2005 9,356,551 12,335,850 7,152,143 28,844,544
TOTAL 77,980,978 74,398,155 72,758,369 225,137,502 Source: NPA’s Annual Abstract of Port Statistics. Collated by the researcher

International Affairs and Global Strategy www.iiste.org
ISSN 2224-574X (Paper) ISSN 2224-8951 (Online)
Vol.15, 2013
46
APPENDIX TABLE 2 : DESTINATION OF NIGERIAN’S EXPORTS BY TYPE OF PACKAGING (1995-2005) M/T (000,000).
GENERAL CARGO
DRY BULK LIQUID BULK TOTAL
1996 1819680 558562 9234083 11612325
1997 1,160,282 513,268 3,695,631 5,369,181
1998 1,091,707 490,425 3,456,722 5,038,854
1999 1,239,096 294,362 4,948,147 6,481,605
2000 1,200,393 122,574 8,379,417 9,702,384
2001 884444 151215 9570393 10,606,052
2002 789536 173267 10818058 11,780,861
2003 768,498 186,267 10,971,887 11,926,652
2004 673,134 196,400 12,891,994
13,761,528
2005 917,029 200,386 484,137 1,601,552
TOTAL 10543799 2886726 74450469 87,880,994 Source: NPA’s Annual Abstract of Port Statistics. Collated by the researcher APPENDIX TABLE 3 : ORIGIN OF NIGERIAN’S IMPORTS BY REGION
YEAR AFRICA AUSTRALIA ASIA USA EUROPE UNSPECIFIED TOTAL
1996 1,117,674 283,465 1,039,989 2,120,386 4,260,468 45,660 8,867,642
1997 802,374 155,558 1,681,349 2,473,200 3,771,889 342,841 9,227,211
1998 1359587 82081 3860097 3581212 3999806 957393 13840176
1999 1,686,388 7,251 3,940,411 3,432,064 3,970,331 324,240 13,360,685
2000 1,282,343 42,006 5,131,395 3,385,029 5,543,418 353,850 15,738,041
2001 1509882 17729 12931149 4383777 7219227 240359 26302123
2002 2,132,404 3,959 8,882,937 4,598,957 5,461,840 742,953 21,823,050
2003 2,216,546 19295 9,969,843 3,832,896 5,857,154 1,087,384 22,983,118
2004 3,045,252 23,058 7,539,316 4,648,436 6,297,079 1,802,929 23,356,070
2005 3,393,240 19,887 8,879,465 6,350,678 6,260,802 1,162,974 26,067,046
TOTAL 18,545,690 654,289 63,855,951 38,806,635 52,642,014 7,060,583 181,565,162 Source: NPA’s Annual Abstract of Port Statistics. Collated by the researcher

International Affairs and Global Strategy www.iiste.org
ISSN 2224-574X (Paper) ISSN 2224-8951 (Online)
Vol.15, 2013
47
APPENDIX TABLE 4 : DESINATION OF NIGERIAN’S EXPORTS BY REGION
YEAR AFRICA AUSTRALIA ASIA USA EUROPE UNSPECIFIED TOTA
1996 249781 508 245419 495740 612,738 47,200 1653382
1997 206,483 31 195116 781,292 616,191 113,731 1914841
1998 176945 750 246753 1,259,749 989630 47,000 2722825
1999 503,032 5,062 3,050,651 2,810,859 743,588 56,846 7172037
2000 501,196 102 256,425 7,154,772 437,042 8,020,175 16371712
2001 371710 113 238857 7523588 427688 883097 9447054
2002 403,266 559 231,946 560,127 389,780 7,878,644 9466324
2003 486,470 297 226,717 9,672,923 378,908 133,951 10901269
2004 200,276 200 187,365 12,202,123 338,612 360,333 13290913
2005 580,880 58 259,468 4,719,686 7,746,558 331,906 13640561
TOTAL 3680039 7680 5138717 47180859 12,680,735 17,872,883 86560913 Source: NPA’s Annual Abstract of Port Statistics. Collated by the researcher APPENDIX TABLE 5 : AVERAGE HAULS BY REGIONS
WORLD REGIONS AVERAGE HAUL AFRICA (SOUTH AFRICA 3000nm ASIA (SINGAPORE) 11950nm AUSTRALIA (MELEBORE) 6100nm EUROPE (LONDON) 6500nm USA (SANFRANCISCO) 12300nm
Source: Encarta (2007) Collated by the researcher

This academic article was published by The International Institute for Science,
Technology and Education (IISTE). The IISTE is a pioneer in the Open Access
Publishing service based in the U.S. and Europe. The aim of the institute is
Accelerating Global Knowledge Sharing.
More information about the publisher can be found in the IISTE’s homepage:
http://www.iiste.org
CALL FOR JOURNAL PAPERS
The IISTE is currently hosting more than 30 peer-reviewed academic journals and
collaborating with academic institutions around the world. There’s no deadline for
submission. Prospective authors of IISTE journals can find the submission
instruction on the following page: http://www.iiste.org/journals/ The IISTE
editorial team promises to the review and publish all the qualified submissions in a
fast manner. All the journals articles are available online to the readers all over the
world without financial, legal, or technical barriers other than those inseparable from
gaining access to the internet itself. Printed version of the journals is also available
upon request of readers and authors.
MORE RESOURCES
Book publication information: http://www.iiste.org/book/
Recent conferences: http://www.iiste.org/conference/
IISTE Knowledge Sharing Partners
EBSCO, Index Copernicus, Ulrich's Periodicals Directory, JournalTOCS, PKP Open
Archives Harvester, Bielefeld Academic Search Engine, Elektronische
Zeitschriftenbibliothek EZB, Open J-Gate, OCLC WorldCat, Universe Digtial
Library , NewJour, Google Scholar