nih diversity update to the national cancer board - nci dea · nih diversity update to the national...
TRANSCRIPT
NIH Diversity Update to the National Cancer Advisory Board
Lawrence A. Tabak, DDS, PhD
Deputy Director, NIH
December 6, 2011
1
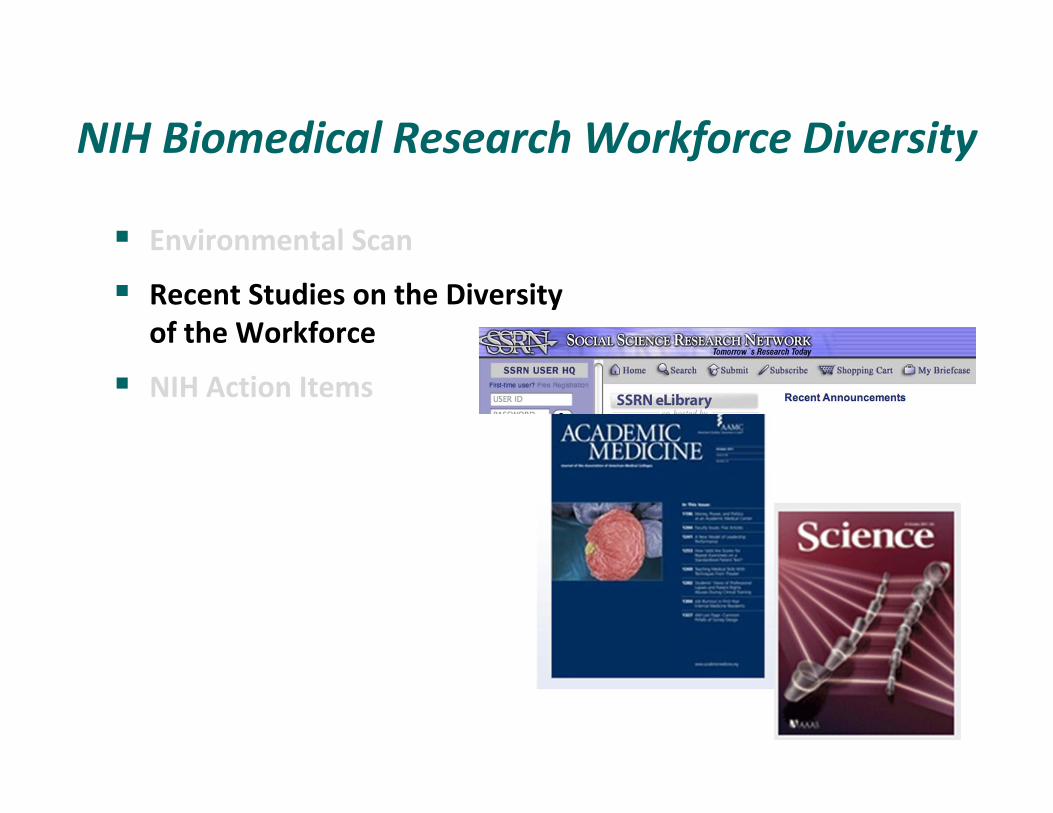
NIH Biomedical Research Workforce Diversity
Environmental Scan
Recent Studies on the Diversity of the Workforce
NIH Action Items

NIH Biomedical Research Workforce Diversity
Environmental Scan
Recent Studies on the Diversity of the Workforce
NIH Action Items

Diversity of the NIH‐Funded Workforce
4
NIH has had a less than impressive impact on the diversity of the NIH‐funded scientific workforce over the past 30+ years
2010 US Census Bureau Report
2010 NIH Principal Investigators on RPGs
2010 US Full‐Time Medical School Faculty
Sources: US Census Report 2010; IMPACII; AAMC
5
0%
5%
10%
15%
20%
25%
30%
35%
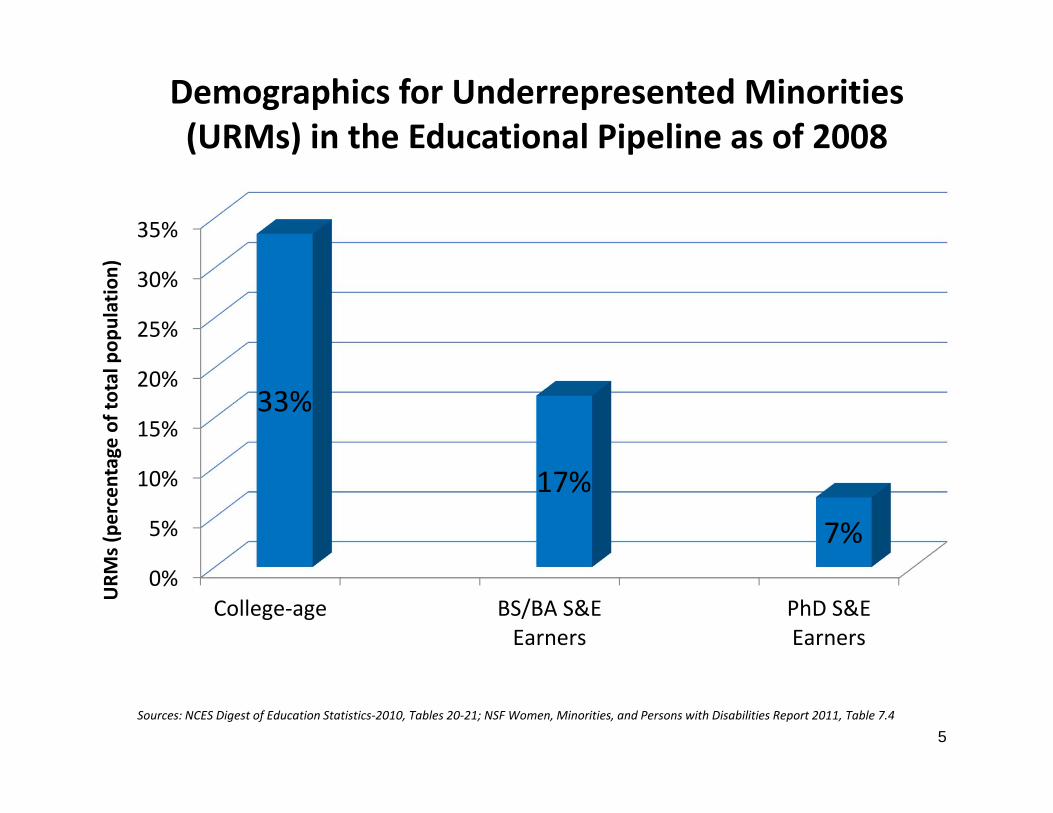
College‐age BS/BA S&EEarners
PhD S&EEarners
33%
17%
7%
URM
s (percentage of to
tal pop
ulation)
Demographics for Underrepresented Minorities (URMs) in the Educational Pipeline as of 2008
Sources: NCES Digest of Education Statistics‐2010, Tables 20‐21; NSF Women, Minorities, and Persons with Disabilities Report 2011, Table 7.4

Awarded Degrees in Biological Sciences, Chemistry and Physics to Citizens and Permanent Residents by US Institutions
(2000-2008)
6
BS/BA Total BIO (PHD) CHEM
(PHD)PHYSICS (PHD) PhD Total
BS/BA to PhD Ratio
Totals711,062 51,126 20,353 11,225 82,704 0.12
White, Non‐Hispanic489,064 27,518 9,318 4,461 41,297 0.08
Asian or Pacific Islander*93,899 14,777 1,224 493 16,494 0.18
Black, Non‐Hispanic55,040 1,315 451 146 1,912 0.03
Hispanic38,679 1,728 535 167 2,430 0.06
American Indian or Alaska Native4,803 150 53 14 217 0.05
URM BS/BA Total 98522 URM PhD Total 4559 0.05Average URM BS/BA per Year 10947 Average URM PhD per Year 507 0.05*Anyone reported as "Asian" or "Asian or Pacific Islander" is reported above in the "Asian or Pacific Islander classification. This changed after 2008, when “Native Hawaiian or Other Pacific Islander” was included as a separate racial classification.
Source: NSF Women, Minorities, and Persons with Disabilities Report 2011, Tables 5.7 and 7.4
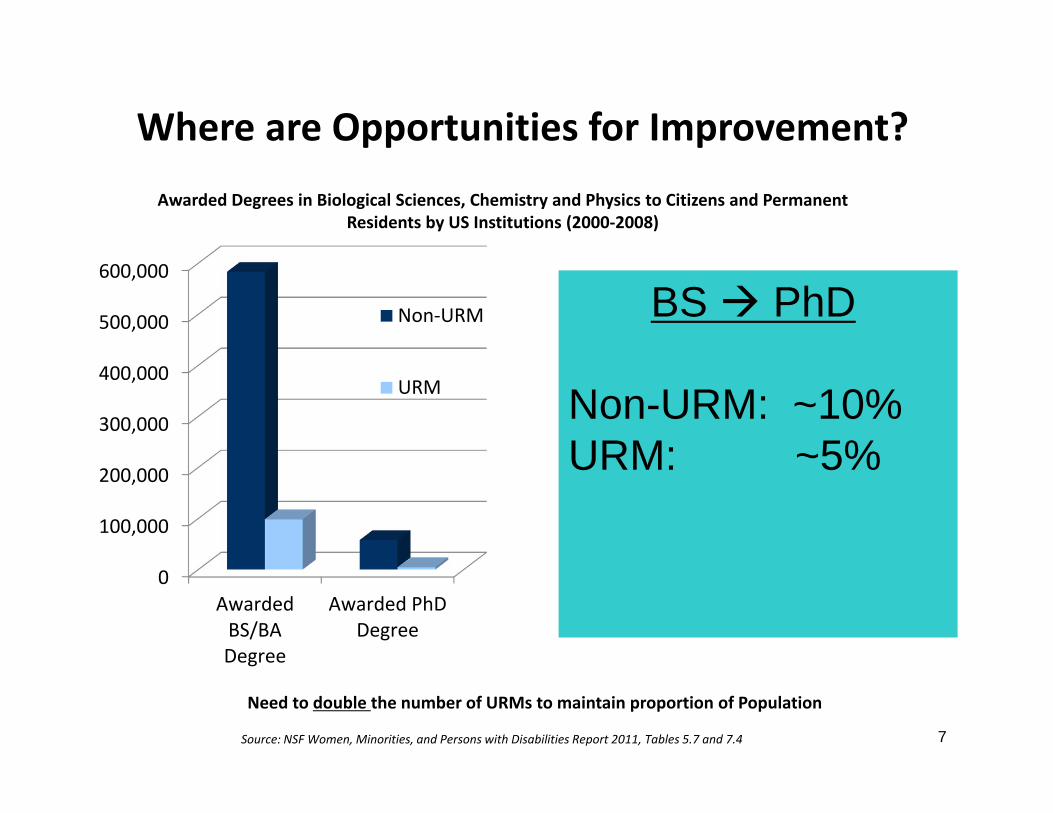
Awarded Degrees in Biological Sciences, Chemistry and Physics to Citizens and Permanent Residents by US Institutions (2000‐2008)
Need to double the number of URMs to maintain proportion of Population
BS PhD
Non-URM: ~10%URM: ~5%
Where are Opportunities for Improvement?
7Source: NSF Women, Minorities, and Persons with Disabilities Report 2011, Tables 5.7 and 7.4
0
100,000
200,000
300,000
400,000
500,000
600,000
AwardedBS/BADegree
Awarded PhDDegree
Non‐URM
URM

NIH Diversity Programs
To ensure that we continue to attract the brightest minds to biomedical research, NIH is committed to increase the diversity of its workforce
For over 30 years NIH has supported programs to achieve these goals
Institutional Programs (e.g. Minority‐Serving and Hispanic‐Serving Institutions)
Individual Programs: target individuals from underrepresented groups, including racial or ethnic minorities, persons with disabilities, or individuals from disadvantaged backgrounds
8
NIH Biomedical Research Workforce Diversity
Environmental Scan
Recent Studies on the Diversity of the Workforce
NIH Action Items

NIH‐Sponsored Studies
As part of the ongoing NIH effort to examine and improve the diversity of the scientific workforce, the Agency has commissioned several recent studies: Diversity in Academic Biomedicine: An Evaluation of Education and
Career Outcomes with Implications for Policy, Ginther et al., published on‐line, Social Science Research Network, (http://ssrn.com/abstract=1677993)
Sex Differences in Application, Success, and Funding Rates for NIH Extramural Programs, Pohlhaus et al., Acad. Med. 86:759‐767, 2011
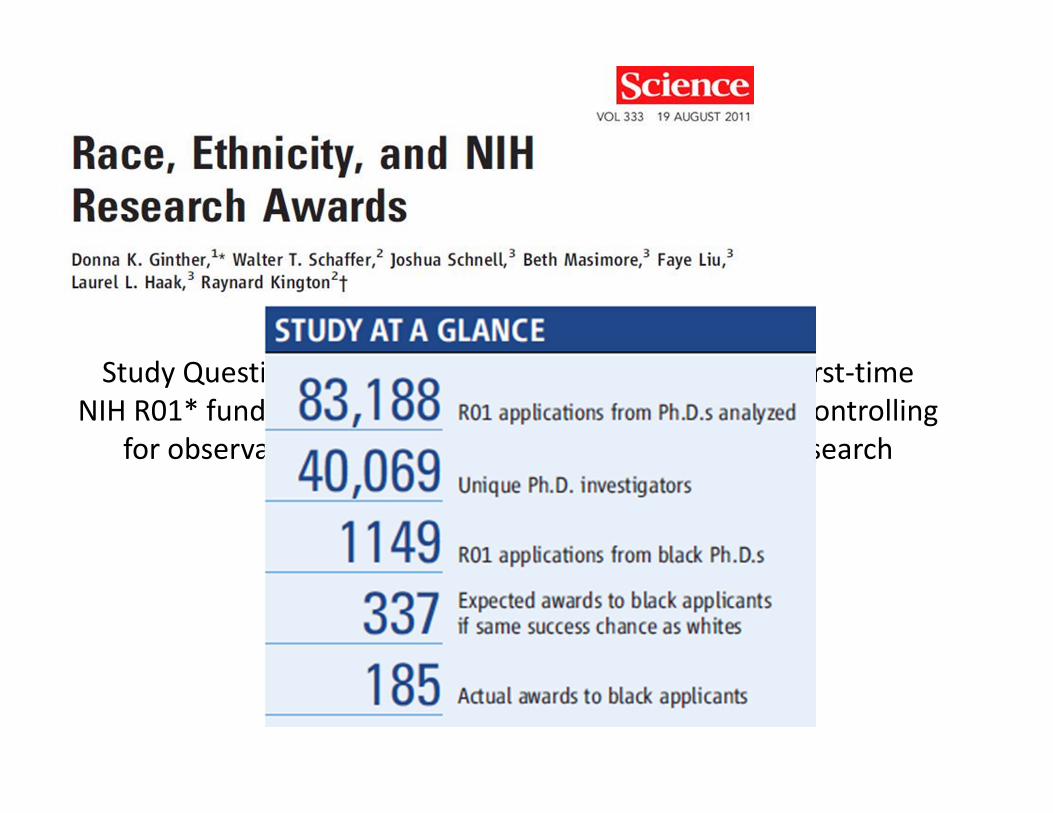
Race, Ethnicity, and NIH Research Awards, Ginther et al., Science –published online on August 18, 2011 (http://www.sciencemag.org/hottopics/race‐nihfunding/)
10
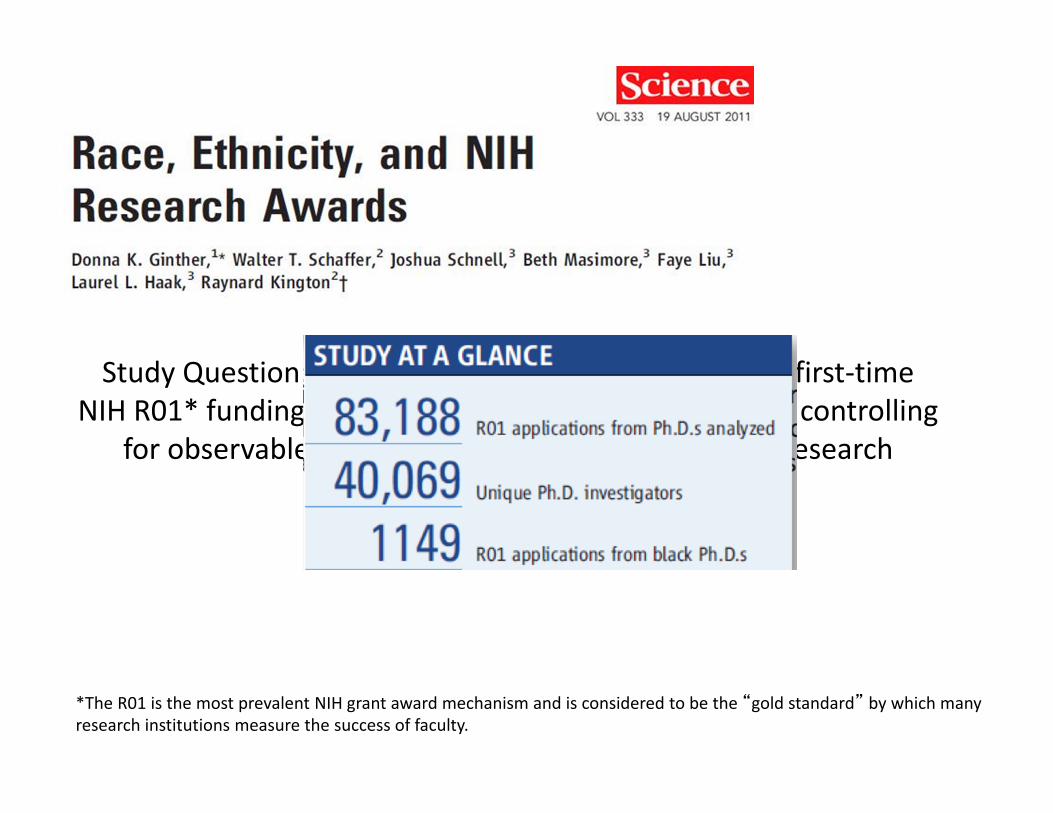
Study Question: Analyzed the probability of securing first‐time NIH R01* funding (during 2000‐2006) by race/ethnicity, controlling
for observable characteristics such as NIH training, research experience, and institution.
*The R01 is the most prevalent NIH grant award mechanism and is considered to be the “gold standard” by which many research institutions measure the success of faculty.

Study Question: Analyzed the probability of securing first‐time NIH R01* funding (during 2000‐2006) by race/ethnicity, controlling
for observable characteristics such as NIH training, research experience, and institution.
Study Question: Analyzed the probability of securing first‐time NIH R01* funding (during 2000‐2006) by race/ethnicity, controlling
for observable characteristics such as NIH training, research experience, and institution.
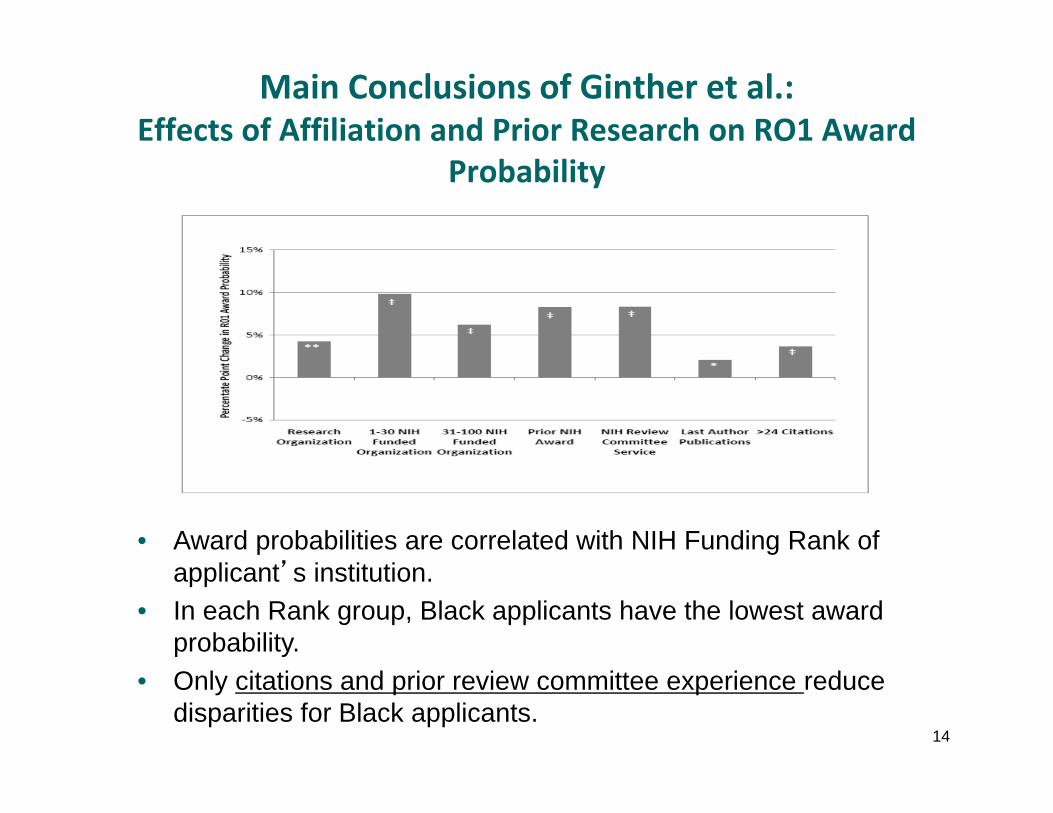
Main Conclusions of Ginther et al.: Effects of Affiliation and Prior Research on RO1 Award
Probability
14
• Award probabilities are correlated with NIH Funding Rank of applicant’s institution.
• In each Rank group, Black applicants have the lowest award probability.
• Only citations and prior review committee experience reduce disparities for Black applicants.
15
CONCLUSIONS
Black and Hispanic applicants are less likely to resubmit a revised application.
Participation in NIH supported training or career development programs has a positive effect on R01 award rates. However, this advantage appears to help White applicants more than Black and Asian applicants.
Main Conclusions of Ginther et al. (cont.)
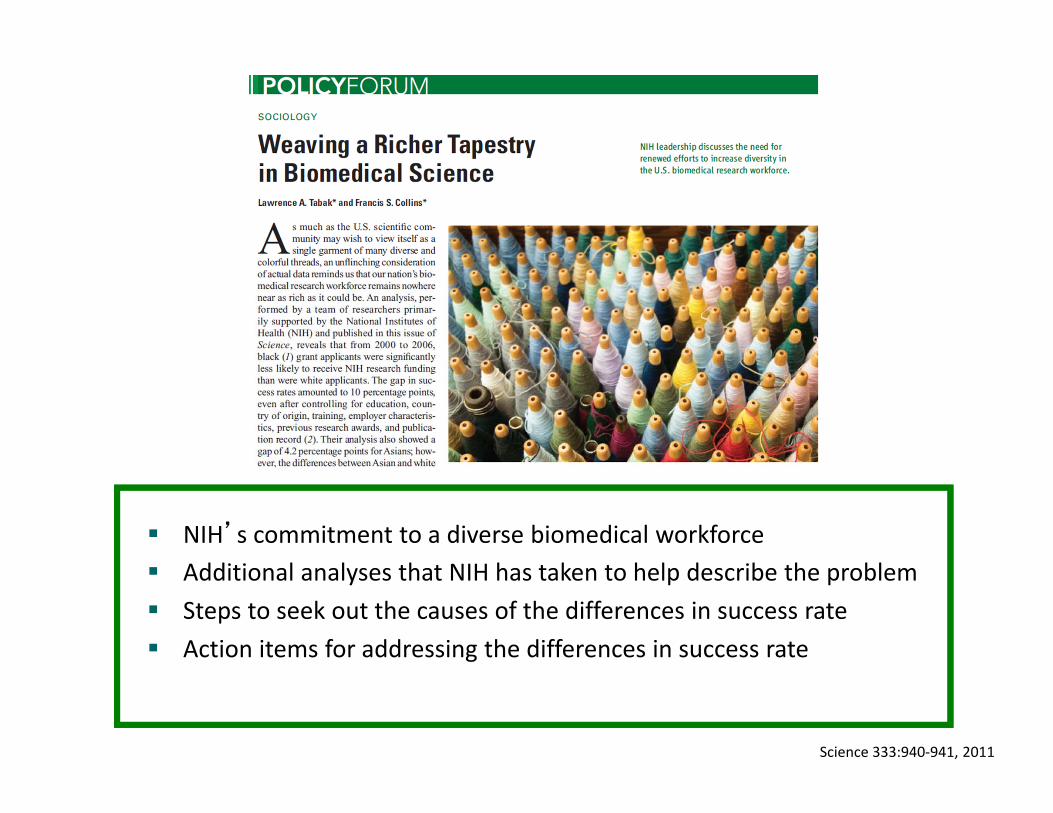
NIH’s commitment to a diverse biomedical workforce Additional analyses that NIH has taken to help describe the problem Steps to seek out the causes of the differences in success rate Action items for addressing the differences in success rate
Science 333:940‐941, 2011

NIH Biomedical Research Workforce Diversity
Environmental Scan
Recent Studies on the Diversity of the Workforce
NIH Action Items
Action Items NIH takes these data with the greatest seriousness, and we are
determined to institute vigorous actions to determine the causes of differential success rates, and to institute effective interventions
NIH is engaged in a vigorous communication outreach to all stakeholders
As review experience correlates with success, we established an “Early Career Reviewers” program to increase exposure of investigators from diverse institutions to the review process (and to increase diversity of review panels)
Self‐nominate to serve as Early Career Reviewers: [email protected]
18

Action Items (cont.) We will conduct experiments on the review process to
determine if bias exists – for example:
Illuminate possible sources of bias and intervention strategies
De‐identify applications
Test reviewer ability to determine applicant race
Assess different types & timing of training against bias using well validated programs such as Project Implicit (https://implicit.harvard.edu/implicit/)
Assess whether proportion of URM reviewers on a peer review panel affects outcome for URM applicants
19
Action Items (cont.) Working with academic institutions, we will encourage the
creation and strengthening of pre‐application mentoring programs for junior faculty
We have funded several extramural grants, including the NIH Pathfinder Award, that are designed to study different interventions that should strengthen the pipeline in a manner that will help improve workforce diversity
20
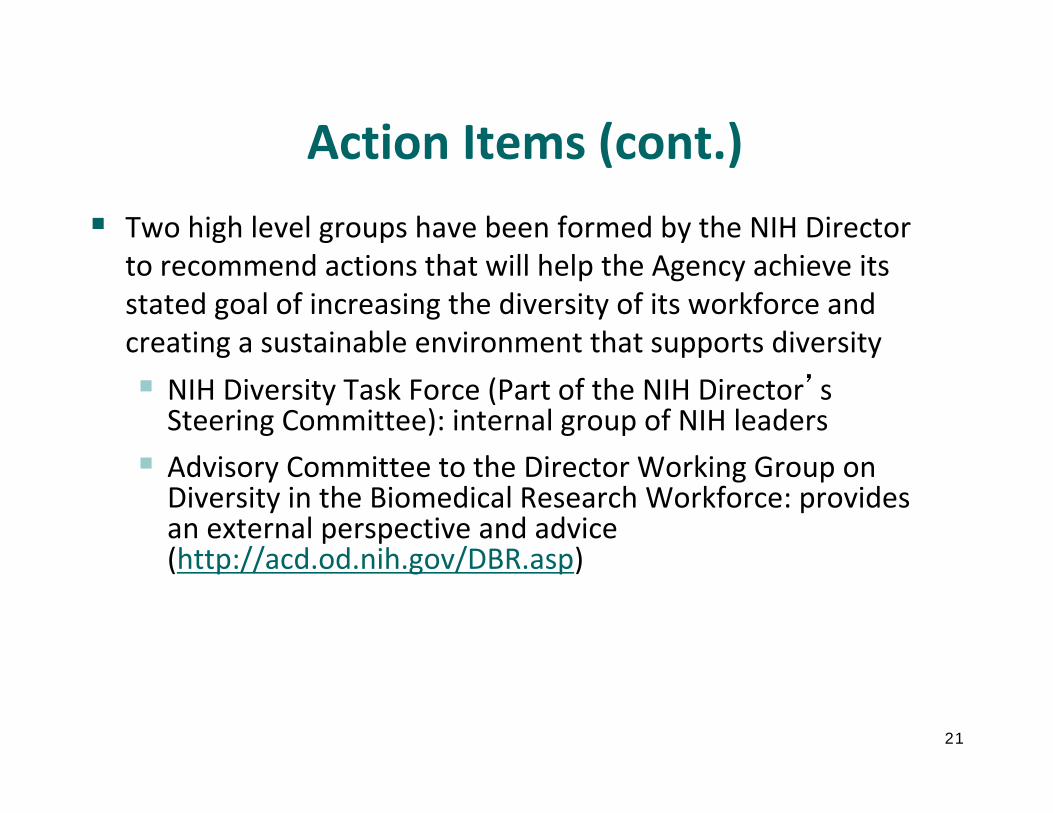
Action Items (cont.) Two high level groups have been formed by the NIH Director
to recommend actions that will help the Agency achieve its stated goal of increasing the diversity of its workforce and creating a sustainable environment that supports diversity NIH Diversity Task Force (Part of the NIH Director’s Steering Committee): internal group of NIH leaders Advisory Committee to the Director Working Group on Diversity in the Biomedical Research Workforce: provides an external perspective and advice (http://acd.od.nih.gov/DBR.asp)
21

ACD Working Group on Diversity in the Biomedical Research Workforce Ann Bonham, Ph.D., CSO, AAMC
Jordan Cohen, M.D., President Emeritus, AAMC Jose Florez, M.D. Ph.D., Asst. Professor, Harvard Medical School Gary Gibbons, M.D., Professor, Morehouse School of Medicine Renee Jenkins, M.D., Chair Emeritus, Dept of Pediatrics and Child Health, Howard University Tuajuanda Jordan, PhD, Dean, Lewis & Clark College Wayne Riley, M.D., M.P.H., M.B.A., President & CEO, Meharry Medical College; Chair,
NACMHD, NIH; Chairman, Board of Directors, AMHPS John Ruffin, Ph.D., Director, NIMHD, NIH – co‐chair Samuel Silverstein, M.D., Professor, Columbia U Medical Ctr. Lawrence Tabak, D.D.S., Ph.D., Principal Deputy Director, NIH – co‐chair Dana Yasu Takagi, Ph.D., Professor, UC Santa Cruz Reed Tuckson, M.D., Exec. VP and Chief of Med. Affairs, United Health Group – co‐chair Maria Teresa Valez, Ph.D., Ass. Dean of the Graduate College, University of Arizona M. Roy Wilson, M.D., M.S., Chair, Bd. Trustees, Charles E. Drew UMS Keith Yamamoto, Ph.D., Exec. Vice Dean, School of Medicine, UCSF Clyde Yancy, M.D., FACC, GAHA, MACP, Professor, Feinberg School of Medicine
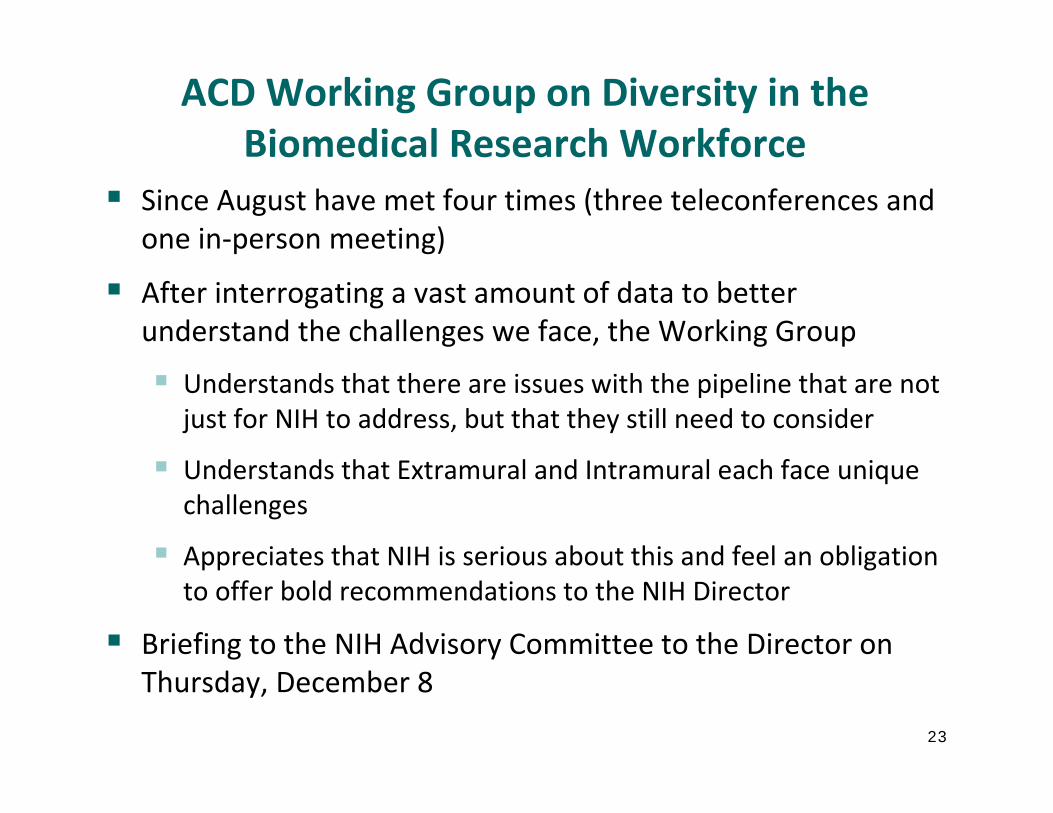
ACD Working Group on Diversity in the Biomedical Research Workforce
Since August have met four times (three teleconferences and one in‐person meeting)
After interrogating a vast amount of data to better understand the challenges we face, the Working Group
Understands that there are issues with the pipeline that are not just for NIH to address, but that they still need to consider
Understands that Extramural and Intramural each face unique challenges
Appreciates that NIH is serious about this and feel an obligation to offer bold recommendations to the NIH Director
Briefing to the NIH Advisory Committee to the Director on Thursday, December 8
23

Questions?
24