nih public access arch oral biol - dentalecm.it della riduzione del volume della...nih public access...
TRANSCRIPT

Effects of tongue volume reduction on craniofacial growth:A longitudinal study on orofacial skeletons and dental arches
Zi-Jun Liua,*, Volodymyr Shcherbatyya, Gaoman Guc, and Jonathan A. Perkinsb
aDepartment of Orthodontics, School of Dentistry, University of Washington, P.O. Box 357446, Seattle, WA98195, USA
bDepartment of Otolaryngology/Head and Neck Surgery, School of Medicine, University of Washington, P.O.Box 357446, Seattle, WA 98195, USA
cPrivate Practice, Seattle, USA
AbstractThe interaction between tongue size/volume and craniofacial skeletal growth is essential forunderstanding the mechanism of specific types of malocclusion and objectively measuring outcomesof various surgical and/or orthodontic treatments. Currently available information on this interactionis limited. This study was designed to examine how tongue body volume reduction affectscraniofacial skeleton and dental arch formation during the rapid growth period in five 12-week-oldYucatan minipig sibling pairs. One of each pair received a standardized reduction glossectomy toreduce tongue volume by 15-17% (reduction group), and the other had the reduction glossectomyincisions without tissue removal (sham group). Before surgery, five stainless steel screws wereimplanted into standardized craniofacial skeletal locations. A series of cephalograms, lateral andaxial, were obtained longitudinally at 1 week preoperative, and 2 and 4 weeks postoperative. Theseimages were traced using superimposition, and linear and angular variables were measured digitally.Upon euthanasia, direct osteometric measurements were obtained from harvested skulls. Five en-bloc bone pieces were further cut for bone mineral examination by dual photon/energy X-rayabsorptiometry (DEXA). The results indicate that: (1) while daily food consumption and weeklybody weight were not significantly affected, tongue volume reduction showed an overall negativeeffect on the linear expansion of craniofacial skeletons; (2) premaxilla and mandibular symphysislengths, and anterior dental arch width were significantly less in reduction than sham animals at 2and/or 4 weeks after the surgery; (3) both premaxilla/maxilla and mandible bone mineral density andcontent were lower in reduction than sham animals, significantly lower in anterior mandible; (4)craniofacial skeletal and dental arch size were significantly smaller in reduction than sham animals,being most significant in the mandibular anterior length and ramus height, the anterior dental archand midface width. These results suggest that reducing tongue body volume in young animals slowscraniofacial skeletal growth and anterior dental arch expansion during rapid growth. The mandible,in particular its symphysis portion, and the anterior dental arch width are most affected. These effectsmay in part contribute to the decrease of functional loads in the anterior mouth by a volume-reducedtongue.
KeywordsTongue volume reduction; Craniofacial growth; Dental arch; Cephalometrics; Pig
*Corresponding author. Tel.: +1 206 616 3870; fax: +1 206 685 8163. E-mail address: [email protected] (Z.-J. Liu).
NIH Public AccessAuthor ManuscriptArch Oral Biol. Author manuscript; available in PMC 2009 October 1.
Published in final edited form as:Arch Oral Biol. 2008 October ; 53(10): 991–1001. doi:10.1016/j.archoralbio.2008.05.010.
NIH
-PA Author Manuscript
NIH
-PA Author Manuscript
NIH
-PA Author Manuscript

1. IntroductionThe interaction between tongue size/volume and craniofacial skeletal growth is essential forunderstanding the mechanism of specific types of malocclusion and objectively measuringoutcomes of various surgical and/or orthodontic treatments. Currently available informationon this interaction is limited. Controversy as to whether the tongue adapts to existing oralmorphology, or actively molds its surrounding tissues, is longstanding.1-3 Although smallerthan the variation of body mass,4 the tongue size differences range from 15% to 29% in thenormal population.5-8 Unfortunately, no study has described a “normal tongue size or volume”or used direct measures to define a pathologically enlarged tongue.9,10 Despite this, numerousclinical studies have claimed that tongue volume is correlated with multiple factors including:dentition position,11-14 mandibular arch size and posture,15,16 maxillary expansion,17vertical facial height18 and combined horizontal and vertical location of chin and symphysis.8 Others have rejected a role for tongue volume in mandibular prognathism and cranial size.8,19 On the other hand, tongue volume is integrated functionally with tongue position.12Prolonged low tongue position from oral breathing during critical growth period in childrenmay initiate a sequence of events resulting in excessive molar eruption, causing a clockwiserotation of the growing mandible, a disproportional increase in anterior lower vertical faceheight, retrognathia, and open bite. A low tongue position may also impede lateral expansionand anterior maxillary development as the mandible rotates to a more downward position.20-22
There is limited information about the effects of altering tongue volume/position oncraniofacial growth and dental arch formation. Using rhesus monkeys, Harvold and hiscolleagues demonstrated that reducing tongue volume by partial glossectomy caused the dentalarch to collapse lingually (crowding).20,23 Artificially lowering the tongue and mandible byinserting an acrylic block into the palatal vault or by obstructing the nostrils resulted in ananterior open bite, posterior crossbite (spacing) and increased tooth extrusion and facial height.21,24,25 Another experiment on the effect of tongue volume on craniofacial morphology wasperformed in miniature pigs. They concluded that partial glossectomy in young animals causedreduction in mandibular length and width, but had no significant effect on mandibular verticalgrowth.26-29 However, only cross-sectional osteometric data of mandibular growth afteranterior regional glossectomy were obtained. No serial longitudinal cephalometric follow-ups,midfacial and cranial morphology, and bone mineralization measures were available and nofunctional consequences were reported in these studies. Therefore, using the well-establishedminiature pig model and widely used clinical approach of uniform tongue body volumereduction,30 the present study was designed to examine how the volume-reduced tongueaffects the growth of craniofacial skeletons including bone mass and mineralization, and dentalarch formation. We hypothesized that a volume-reduced tongue would lead to negative effectson skeletal growth in young animals.
2. Materials and methods2.1. Animal care
Five same-gender 12-week Yucatan miniature pigs (Sinclair Research Center, Columbia, MO)sibling pairs (three male and two female pairs), were used. Under aseptic conditions, fivestainless steel screws (0.8 mm in diameter and 4 mm in length) were implanted into thefollowing alveolar sites: one each between the upper and lower central incisors, one each nearthe roots of the left upper and lower second molars, and one above the same tooth of the rightmaxilla. Maxillary markers served as reference landmarks to ensure accurate superimpositionof serial cephalometrics. The right and left molar alveolar bone markers served as a referenceline for axial cephalograms. Each pair of sibling had the screw implantation at the same day.The tongue surgery was performed 9-10 days after the implantation. This procedure has been
Liu et al. Page 2
Arch Oral Biol. Author manuscript; available in PMC 2009 October 1.
NIH
-PA Author Manuscript
NIH
-PA Author Manuscript
NIH
-PA Author Manuscript

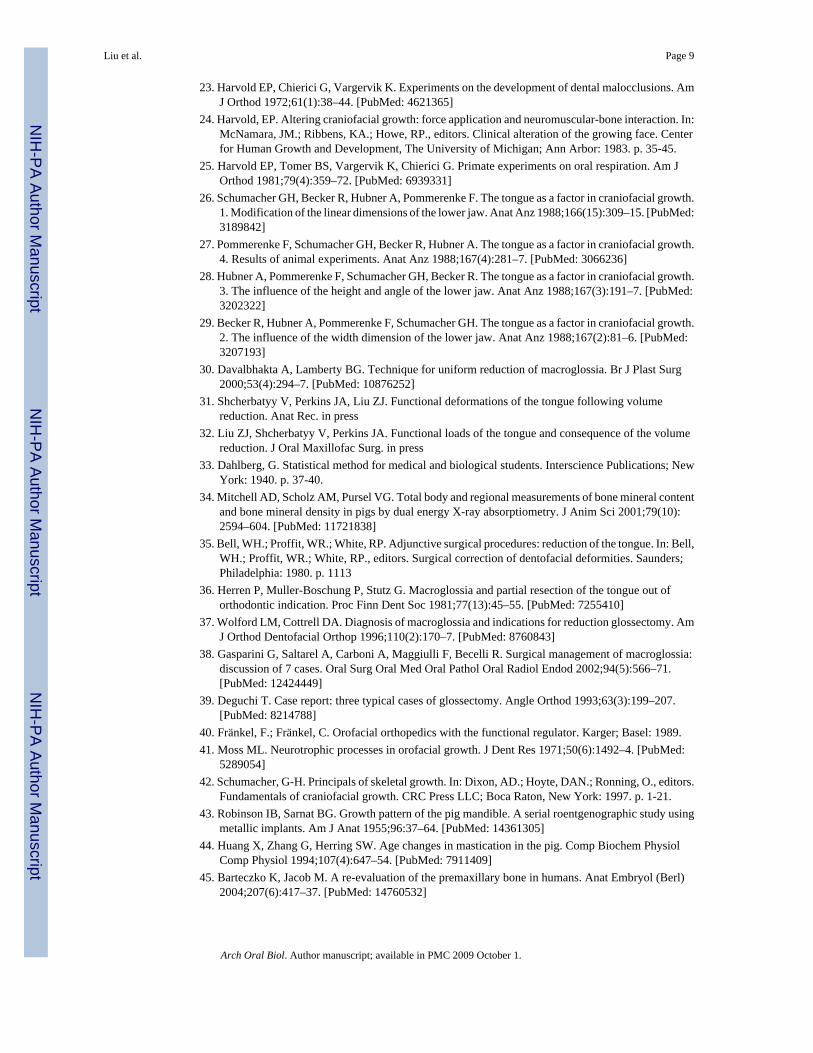
reported elsewhere.31,32 In brief, the bilateral incisions first diverged to meet the lateral marginanteriorly. Cutting diathermy was used to undermine and create lateral muco-muscular flapsand to excise a conical wedge (above the tongue neurovascular bundles) from the centraltongue. The removed tongue muscular tissue uniformly reduced tongue volume in threedimensions (length, width and thickness). After hemostasis, the incision was closed in layerswith absorbable sutures (Vicryl 4.0). The removed tongue tissue was preserved in a 50%alcohol solution. For the sham surgery, identical incisions were made and sutures placed, butwithout tissue removal (Fig. 1). Surgery was performed on each pair of sibling on the sameday, one to reduce the tongue volume by about 15% (reduction group), and the other, withincision only, without removal of tongue tissue (sham group). The actual changes of the tonguemass (volume and weight) after the surgery were measured postmortem, and the linear changesof the tongue dimensions (length, width and thickness) were measured using longitudinaltongue impressions (Table 1). Slurry food was offered for 2-3 days postoperatively, followedby regular pig chow diet. Antibiotics (Clavamox suspension, 50 mg, Bid, Pfizer Animal Health,New York, NY) was given before and after surgery for 10 days. Each pair of siblings receivedtongue surgery at the same day. Animals were raised for 4 weeks postoperatively with weeklyweighing, and were euthanized through cardiac injection of pentobarbital sodium (BeuthanasiaD, Schering-Plough Animal Health Corp. Union, NJ). All procedures were approved by theIACUC of University of Washington.
2.2. Serial cephalometric radiographs and skull harvestsThe initial caphalometric radiograph (baseline) was taken preoperatively and 2-3 days aftermetallic marker implantation (Fig. 2). This procedure was repeated 2 and 4 weeks after tonguesurgery. Pigs were mask-anaesthetized with isoflurane and placed on the X-ray table (SummitLX125V, Summit Industries Inc., Chicago, IL). The head of the pig was oriented by adjustingthe occlusal plane parallel to the X-ray cassette margin and to the X-ray table surface for lateraland axial projections, respectively. The cross of X-ray central beam was always located at themedial canthus for lateral and the intersection between the line connecting bilateral medialcanthus and the mid-sagittal lines for axial projections. A 10 × 12 inch X-ray film (Les Wilkinsand Associate, Seattle, WA) was used. Radiation settings were as follows: Kvp: 61 (lateral)and 65 (axial); Ams: 15; Exposure: 3/20 s.
After euthanasia, the heads were dissected and cleaned of all soft tissues to exposurecraniofacial sutures. The harvested skulls were stored in a freezer for further osteometricmeasurements.
3. Cephalometric, osteometric and dental measurementsThe superimposition of longitudinal tracings using implanted screws was applied tocorroborate accuracy. After film tracing, reference points were identified by one investigator(GGM) and landmark identification accuracy was confirmed by two secondary investigators(ZJL and VS). These tracings with marked reference points (Fig. 3) were digitized, and 16linear and 14 angular variables on the lateral and 13 linear variables on the axial cephalometricradiographs were calculated automatically using a Macro program written in MS Excel(Microsoft Co. Redmond, WA, Table 1).
Osteometry of harvested skulls were performed using a digital calliper and a needle compass.The 21 osteologic landmarks for craniofacial skeletons and 6 dental landmarks for dental archeswere defined which resulted in 33 linear variables (Fig. 4).
The reliability of the above measurements was examined by the following approaches. First,of 10 harvested skulls and 60 cephalometric films, 4 skulls and 10 films were randomly selectedand re-measured by a second investigator (ZJL), who was also responsible for identifying the
Liu et al. Page 3
Arch Oral Biol. Author manuscript; available in PMC 2009 October 1.
NIH
-PA Author Manuscript
NIH
-PA Author Manuscript
NIH
-PA Author Manuscript

reference points. A paired t-test showed that there were no significant differences betweenthese two measurements. Second, the skulls and traced cephalometric radiographs were re-measured and re-digitized after 2-3-week interval by the two investigators (VS and ZJL) whoperformed the primary measurements and digitization. The error was calculated as 0.050-0.065mm for the skulls, 0.05 mm and 0.30° for linear and angular variables of cephalometricradiographs using Dahlberg formula ( ).33
4. Measurements of bone mineral componentsAfter the completion of skull measurements, five en-bloc bone pieces were cut for dual photon/energy X-ray absorptiometry (DEXA) examinations: (1) left and right premaxillary/maxillaryblocs cut at the medial side of the 1st molar (Fig. 5Aa); (2) mandibular symphysis bloc cut atthe medial side of the 1st molar (Fig. 5Ab); (3) left and right mandibular corpus blocs withthree molars (Fig. 5Ac).
The DEXA scan was performed with a Norland XR-26 Mark II (Norland Inc, Fort Atkinson,WI). This instrument was calibrated daily and the setup for scanning resolution (0.5 mm × 0.5mm), scan speed (35 mm/s) and scan width (300 mm) was confirmed at each session. Eachbone piece was placed on the scan table, and the measurement was performed using small-subject software (Host Software revision, 2.5.3a) and gathered as bone mineral density (BMD,g/cm2) and bone mineral content (BMC, g) (Fig. 4B), similar to the use of DEXA for the wholebody, head and other regions of the pig.34
5. StatisticsPaired t-tests were first performed to examine the difference of measurements between left andright sides in each group. One-way ANOVA and Bonferroni post-hoc tests were used toexamine body weight changes over time, and non-paired t-tests were used to detect thedifferences of body weight at each time points and DEXA values between the two groups.Probability levels of 0.05 or less were considered to indicate statistical significance for pairedt and ANOVA tests.
Since the body weight was a covariance for cephalometric and osteometric measures, aGeneralized Estimating Equation (GEE) model with independent working correlationclustering on each individual animal ID to the data for each measurement was applied in allvariables of these two sources. The GEE was used to correct variance for repeatedmeasurements on each animal. The model for each measurement was adjusted linearly for bodyweight and for time and intervention group and their interactions as factors. Each hypothesiswas then tested through a contrast of the estimated parameters. The time trend in each groupwas examined separately, for differences between groups at each time point, and for anyevidence of a difference between groups at any time point. A Bonferroni correction was usedto account for multiple testing and the probability levels of 0.013 or less were considered toindicate statistical significance. For the measurements that were not repeated at successivetimes a linear regression of the parameter on bodyweight and intervention group with robuststandard errors was adopted to do a t-test of difference in groups.
6. Results6.1. Feeding behaviours and body weight
No noticeable feeding behaviour changes were identified in sham animals. Reduction animalswere able to eat softened pig chow after the surgery and had almost the same daily foodconsumption as sham animals. However several feeding behaviour changes were noticed.These changes included using the mandible, rather than the anterior tongue, to ingest food into
Liu et al. Page 4
Arch Oral Biol. Author manuscript; available in PMC 2009 October 1.
NIH
-PA Author Manuscript
NIH
-PA Author Manuscript
NIH
-PA Author Manuscript

the oral cavity; a slightly distorted chewing rhythm, longer feeding sessions, food leaking fromthe mouth during chewing, and an “inertial” chewing/swallowing pattern (i.e. head movingand shaking while chewing and swallowing, a way of taking the advantage of gravity effect).
Over the 6-week experimental period, body weight increased progressively and significantlyin both groups. A slight drop in body weight (∼3%) in the first postoperative week was seenin reduction animals. However, the catch-up followed from the second week (Fig. 6). Therewas no significant difference of body weight between the two groups at any time point. Thisfact indicated that the reduction surgery might not affect general health.
6.2. Craniofacial skeleton changes over timeThe longitudinal distances between the implanted screws remained stable and demonstratedno evidence of interstitial growth within the bones. As summarized in Table 3, over the periodof 5 weeks (T0-T4), increases of all linear variables were identified. Of 16 and 13 linearvariables from lateral and axial cephalometric radiographs respectively in both groups (Table2), significant increases over time (p < 0.013) were found in mandibular dorsal (Sm-Id) andventral (Gp-Id) lengths, inter-maxillary canine (Mxc-Mxc’), bi-zygomatic (Zy-Zy’) and bi-gonial (Gm-Gm’) widths. Significant increases in premaxillary palatal (Pmx-Mxp) andmandibular symphysis (Pmx-Ms) lengths were only found in sham animals, and these numberseven became smaller over time in reduction animals. Of 13 angular variables, both groupsshowed significant increases in the angles of premaxilla to cranial vault (Pr-E-In), maxillaryincisor to cranial vault (Ui-E-In), and mandibular antegonial notch (Gi-Mn-Me). Significantchanges in gonial angle (Sm-Gp/Me-Gi) were in an opposite direction for each group,decreased in sham and increased in reduction groups over time.
No statistical difference in any variables was identified between sham and reduction groups atthe initial time point (T0). Reduction animals exhibited significantly smaller values inpremaxillary angle (Pr-E-Sp) and inter-maxillary canine width (Mxc-Mxc”) at 2 weeks, andinter-mandibular 1st molar width (Md1-Md1’) at 4 weeks. Consistent with the overall growthtrend, premaxillary palatal (Pmx-Mxp) and mandibular symphysis lengths (Pmx-Ms) weresignificantly smaller in reduction animals at both 2 and 4 weeks (Table 3).
6.3. DEXA examinationsAs compared to sham animals, both BMD and BMC values of all bone blocs dropped about4.8-16.5% in reduction animals. A significant decrease was found in the BMC of mandibularsymphysis bloc (p < 0.05, Fig. 7).
6.4. Morphology of skull and dental archesPostmortem skull measurements further revealed that, compared to sham animals, skeletal sizesand dental arches were significantly smaller in reduction animals in the following variables(Fig. 4 and Table 4): mandibular ramus height (#1-2), anterior mandibular length (#4-5), themaxillary palatal length (#18-19), the posterior midfacial width (#11-11), the mandibularsymphysis length (#4-21), the dorsal width of anterior mandible (#5-5), and the mandibulardental arch at canine (#25-25′). While these seven variables involved all three dimensions ofcraniofacial skeletons (height, width and length), five of them were related to the mandiblealone (Fig. 4).
7. DiscussionAs a large muscular organ, the tongue fills the majority of the oral cavity in most mammals.The argument for tongue volume reduction is that decreasing oral cavity volume throughskeletal correction, such as mandibular set-back or maxillary Le Fort osteotomy, encroaches
Liu et al. Page 5
Arch Oral Biol. Author manuscript; available in PMC 2009 October 1.
NIH
-PA Author Manuscript
NIH
-PA Author Manuscript
NIH
-PA Author Manuscript

on the space for the tongue, thus causing relapse of the prognathism or forward positioning ofthe teeth.1 Clinically, this type of relative macroglossia (insufficient space in the oral cavity)could be responsible for speech disorders, obstructive sleeping apnoea syndrome, anddysphagia.35 Even though the diagnostic criteria for relative macroglossia and the decidingfactors for tongue volume reduction are highly subjective and its application for different typesof macroglossia30,36-38 are debated, tongue volume reduction is a relatively common part oftreatment for Class III skeletal malocclusion, severe open bite and bimaxillary dentoalveolarprotrusion.19,39
It has been generally accepted that volume increase in soft tissue induces osteogenesis at thegrowth site of the bone.40 It has been claimed that the tongue growth and size influencemidfacial control mechanism, which determines the growth of surrounding orofacial elements.41 Studies also demonstrate that tongue volume has a measurable effect on jaw growth atcertain time points.27,42 Therefore, reducing tongue volume during the period of fast growthshould lead to the serial alterations in craniofacial skeletal growth and dental arch formation.Available data on growth consequences following tongue volume reduction is extremelylimited. Only a Germany team reported that partial glossectomy in young minipigs significantlyreduced mandibular growth in length including overall and tooth-bearing portion, and in widthof the region of the first deciduous molar and canine, but mandibular vertical growth was lessaffected.26,28,29 These negative effects on the growth were identified in 12-week-old but notin 6-week-old minipigs 23 weeks after partial glossoectomy.27 Unfortunately, these findingswere determined one time at the end of experiment entirely from osteometric measurementson harvested mandibles. Longitudinal cephalometry and other changes in craniofacialstructures were not obtained and assessed.
The pig grows very rapidly in a relatively short period of time, and the age of 12 weeks fits inthis rapid growing period when the first permanent molar is erupting.43,44 It has beendemonstrated that, during rapid growth period, the pig’s mandible increases in total length atthe posterior and anterior borders, in ramus height at the condyle and inferior border, and inbody at the alveolar and inferior borders.43 Interestingly, although the overall increases inlinear distances and angular alterations over time were considerably similar between the twogroups, a volume-reduced tongue could slow down the overall lengthening of the premaxillaand mandibular symphysis region, the two osseous components composing of anterior mouth.Increasing in the gonial angle (Sm-Gp/Me-Gi, Table 3) over time in reduction animals ascompared to decreasing in sham animals further suggested that a flatten gonial angle could beinduced by a volume-reduced tongue. In addition to these findings, the present study alsodemonstrated that a volume-reduced tongue could lead to dental arch narrowing, typically inanterior dentition (Mxc-Mxc’ and Md1-Md1′, Fig. 4 and Table 3). Furthermore, a significantlydecreased premaxillary angle (Pr-E-Sp) in reduction animals might also attribute to thedecrease of premaxillary length as discussed above.
The osteometric measures at the ending-time point (T4) are consistent with the cephalometricresults in the widths of anterior mandible and dental arches (#5-5′ and #25-25′), and the lengthof anterior mandible (#4-5 and #4-21). Thus, narrowing and shortening in the anterior mandibleand dental arch after reduction surgery were confirmed by both measures. However, significantdecreases in the height of mandibular ramus (#1-2), the length of maxillary palatal process(#18-19), and the breadth of midface (#11-11′) in reduction animals were not identified incephalometric measures. These inconsistencies might be due to the following reasons. First,because the landmark for condyle could not be defined, the measure for the ramus height wasnot available in cephalometrics. Given the fact that the condyle produces 80% of total ramusheight,43 this significant difference between the two groups in osteometric measures maysuggest that a volume-reduced tongue has an negative effect on lengthening, and verticalgrowth of mandible. Second, premaxilla and the palatal process of maxilla are active growth/
Liu et al. Page 6
Arch Oral Biol. Author manuscript; available in PMC 2009 October 1.
NIH
-PA Author Manuscript
NIH
-PA Author Manuscript
NIH
-PA Author Manuscript

remodelling fronts during midfacial development,45 thus both skeletal components should beaffected by a volume-reduced tongue during growth. However, significant changes were onlyfound in cephalometrics for the premaxilla (Pmx-Mxp) and in osteometrics for the palatalprocess of maxilla (#17-18). It should be noted that despite not significant, measurements ofpremaxilla and maxilla showed smaller values in reduction than sham animals in bothcephalometrics and osteometrics (Tables 3 and 4). Considering a small sample size of thepresent study, these differences may reflect the true trend of negative effects of a volume-reduced tongue on the premaxilla/maxilla complex. Third, while measurement of the midfacialbreadth was not available in cephalometrics as measured in osteometrics (#11-11″),cephalometric measurements did demonstrate significant increases of bi-zygomatic (Zy-Zy’)and bigonial (Gp-Gp’) over time in both groups. Again, although not significant, smaller valuesof these measures were seen in reduction animals as compared to sham animals at the 4-weektime point. Therefore, a volume-reduced tongue may also have a negative effect on thetransverse expansion of the midface during growth.
Interestingly, although the above-mentioned growth effects by a volume-reduced tongue coverall three dimensions (width, height and length) in both the mandible and facial bones, themajority of these effects occurred around the anterior mouth or anterior dental arch, particularlyin the mandibular symphysis and premaxilla (Figs. 3 and 4). The volume reduction wasperformed on the anterior 2/3 of the tongue in the present study. During function, this portionof the tongue is thought to produce greater forces than does the tongue base.46 Our previousstudy of in vivo functional loads of the tongue on surrounding skeletal surfaces revealed thatthe tongue produces more load in mandibular lingual surfaces than the premaxillary andmaxillary palatal surfaces. These loads decrease in the anterior mouth (symphysis andpremaxilla) after the volume reduction, whereas loads in the posterior mouth (mandibularcorpus and posterior maxillary palatal surface) were less affected.32 Therefore, the observedslow growth in the skeletal components of the anterior mouth might be related to the changein the local mechanical environment produced by a volume-reduced tongue, i.e., decrease offunctional loads.
The present study not only reveals that the skeletal components of anterior mouth are mostlyinvolved by a volume-reduced tongue, but also demonstrates that the mandible was affectedmore than the nasomaxillary skeletons in all length, width and height. This striking differencebetween upper and lower jaws was also confirmed by DEXA examinations in which the onlysignificant decrease in bone mineral content was found in the mandibular symphysis bloc ofreduction animals (Fig. 7). Anatomically, the tongue is directly attached to the mandiblethrough its musculature. Functionally, there is an inherent linkage between the tongue andmandible.47 Furthermore, the mechanism of cranial/nasomaxillary postnatal growth is mostlyattributed to sutures, distinctively different from that of mandible which mainly depends onappositional deposition through intra-membranous ossification at the borders and alveolarridges, and on secondary cartilage through endochondrous ossification at the condyle.48,49Based on these, it is not surprising that the postnatal mandibular growth would be suppressedmore than the other portion of the craniofacial skeletons by tongue volume reduction.
Taking the present results and previous loading study32 together, on one hand it is suggestedthat the tongue volume reduction could lessen the chance of relapse after the surgicalmandibular setback for correcting mandibular prognathism through the mechanism of reducingthe functional loads, on the other hand it should be cautious that this procedure may slow thegrowth of craniofacial skeletons, both in size and mineralization, particularly in anteriormandible (symphysis region). Therefore, a long-term growth tracking is necessary for youngsubjects receiving this procedure alone for a true macroglossia or adjunctively along with otherorthopaedic procedures (mandible setback, Le Fort osteotomy, etc.) for a relative macroglossia.
Liu et al. Page 7
Arch Oral Biol. Author manuscript; available in PMC 2009 October 1.
NIH
-PA Author Manuscript
NIH
-PA Author Manuscript
NIH
-PA Author Manuscript

AcknowledgementsThe authors would like to thank Dr. Sue Herring for her critical comments and discussion, Ms. Xian-Qin Bai for herassistance with all animal experiments and recordings, and Liz Thomas for statistical analysis. This study wassupported by the grant R01DE15659 from NIDCR to ZJL.
REFERENCES1. Ingervall B, Schmoker R. Effect of surgical reduction of the tongue on oral stereognosis, oral motor
ability, and the rest position of the tongue and mandible. Am J Orthod Dentofacial Orthop 1990;97(1):58–65. [PubMed: 2296945]
2. Frohlich K, Ingervall B, Schmoker R. Influence of surgical tongue reduction on pressure from thetongue on the teeth. Angle Orthod 1993;63(3):191–8. [PubMed: 8214787]
3. Frohlich K, Thuer U, Ingervall B. Pressure from the tongue on the teeth in young adults. Angle Orthod1991;61(1):17–24. [PubMed: 2012318]
4. Bouchard C. Human variation in body mass: evidence for a role of the genes. Nutr Rev 1997;55(1 Pt2):S21–7. [PubMed: 9155223]discussion S27-S30
5. Bandy HE, Hunter WS. Tongue volume and the mandibular dentition. Am J Orthod 1969;56(2):134–42. [PubMed: 5257979]
6. Oliver RG, Evans SP. Tongue size, oral cavity size and speech. Angle Orthod 1986;56(3):234–43.[PubMed: 3461733]
7. Lauder R, Muhl ZF. Estimation of tongue volume from magnetic resonance imaging. Angle Orthod1991;61(3):175–84. [PubMed: 1928821]
8. Yoo E, Murakami S, Takada K, Fuchihata H, Sakuda M. Tongue volume in human female adults withmandibular prognathism. J Dent Res 1996;75(12):1957–62. [PubMed: 9033450]
9. Vogel JE, Mulliken JB, Kaban LB. Macroglossia: a review of the condition and a new classification.Plast Reconstr Surg 1986;78(6):715–23. [PubMed: 2947254]
10. Ueyama Y, Mano T, Nishiyama A, Tsukamoto G, Shintani S, Matsumura T. Effects of surgicalreduction of the tongue. Br J Oral Maxillofac Surg 1999;37(6):490–5. [PubMed: 10687914]
11. Lowe AA, Takada K, Yamagata Y, Sakuda M. Dentoskeletal and tongue soft-tissue correlates: acephalometric analysis of rest position. Am J Orthod 1985;88(4):333–41. [PubMed: 3863491]
12. Cohen AM, Vig PS. A serial growth study of the tongue and intermaxillary space. Angle Orthod1976;46(4):332–7. [PubMed: 1067768]
13. Vig PS, Cohen AM. The size of the tongue and the intermaxillary space. Angle Orthod 1974;44(1):25–8. [PubMed: 4520947]
14. Turner S, Nattrass C, Sandy JR. The role of soft tissues in the aetiology of malocclusion. Dent Update1997;24(5):209–14. [PubMed: 9515371]
15. Vig PS, Cohen AM. The size of the human tongue shadow in different mandibular postures. Br JOrthod 1974;1(2):41–3. [PubMed: 4522992]
16. Tamari K, Shimizu K, Ichinose M, Nakata S, Takahama Y. Relationship between tongue volume andlower dental arch sizes. Am J Orthod Dentofacial Orthop 1991;100(5):453–8. [PubMed: 1951198]
17. Enlow, DH. Handbook of facial growth. 2nd edition. WB Saunders Co.; Philadelphia: 1982.18. Doual-Bisser A, Doual JM, Crocquet M. Hyoglossal balance and vertical morphogenesis of the face.
Orthod Fr 1989;60(Pt 2):527–32. [PubMed: 2490235]19. Ruff RM. Orthodontic treatment and tongue surgery in a class III open-bite malocclusion. A case
report. Angle Orthod 1985;55(2):155–66. [PubMed: 3860027]20. Harvold EP. The role of function in the etiology and treatment of malocclusion. Am J Orthod 1968;54
(12):883–98. [PubMed: 4972421]21. Harvold EP, Vargervik K, Chierici G. Primate experiments on oral sensation and dental
malocclusions. Am J Orthod 1973;63(5):494–508. [PubMed: 4633053]22. Principato JJ. Upper airway obstruction and craniofacial morphology. Otolaryngol Head Neck Surg
1991;104(6):881–90. [PubMed: 1908986]
Liu et al. Page 8
Arch Oral Biol. Author manuscript; available in PMC 2009 October 1.
NIH
-PA Author Manuscript
NIH
-PA Author Manuscript
NIH
-PA Author Manuscript
23. Harvold EP, Chierici G, Vargervik K. Experiments on the development of dental malocclusions. AmJ Orthod 1972;61(1):38–44. [PubMed: 4621365]
24. Harvold, EP. Altering craniofacial growth: force application and neuromuscular-bone interaction. In:McNamara, JM.; Ribbens, KA.; Howe, RP., editors. Clinical alteration of the growing face. Centerfor Human Growth and Development, The University of Michigan; Ann Arbor: 1983. p. 35-45.
25. Harvold EP, Tomer BS, Vargervik K, Chierici G. Primate experiments on oral respiration. Am JOrthod 1981;79(4):359–72. [PubMed: 6939331]
26. Schumacher GH, Becker R, Hubner A, Pommerenke F. The tongue as a factor in craniofacial growth.1. Modification of the linear dimensions of the lower jaw. Anat Anz 1988;166(15):309–15. [PubMed:3189842]
27. Pommerenke F, Schumacher GH, Becker R, Hubner A. The tongue as a factor in craniofacial growth.4. Results of animal experiments. Anat Anz 1988;167(4):281–7. [PubMed: 3066236]
28. Hubner A, Pommerenke F, Schumacher GH, Becker R. The tongue as a factor in craniofacial growth.3. The influence of the height and angle of the lower jaw. Anat Anz 1988;167(3):191–7. [PubMed:3202322]
29. Becker R, Hubner A, Pommerenke F, Schumacher GH. The tongue as a factor in craniofacial growth.2. The influence of the width dimension of the lower jaw. Anat Anz 1988;167(2):81–6. [PubMed:3207193]
30. Davalbhakta A, Lamberty BG. Technique for uniform reduction of macroglossia. Br J Plast Surg2000;53(4):294–7. [PubMed: 10876252]
31. Shcherbatyy V, Perkins JA, Liu ZJ. Functional deformations of the tongue following volumereduction. Anat Rec. in press
32. Liu ZJ, Shcherbatyy V, Perkins JA. Functional loads of the tongue and consequence of the volumereduction. J Oral Maxillofac Surg. in press
33. Dahlberg, G. Statistical method for medical and biological students. Interscience Publications; NewYork: 1940. p. 37-40.
34. Mitchell AD, Scholz AM, Pursel VG. Total body and regional measurements of bone mineral contentand bone mineral density in pigs by dual energy X-ray absorptiometry. J Anim Sci 2001;79(10):2594–604. [PubMed: 11721838]
35. Bell, WH.; Proffit, WR.; White, RP. Adjunctive surgical procedures: reduction of the tongue. In: Bell,WH.; Proffit, WR.; White, RP., editors. Surgical correction of dentofacial deformities. Saunders;Philadelphia: 1980. p. 1113
36. Herren P, Muller-Boschung P, Stutz G. Macroglossia and partial resection of the tongue out oforthodontic indication. Proc Finn Dent Soc 1981;77(13):45–55. [PubMed: 7255410]
37. Wolford LM, Cottrell DA. Diagnosis of macroglossia and indications for reduction glossectomy. AmJ Orthod Dentofacial Orthop 1996;110(2):170–7. [PubMed: 8760843]
38. Gasparini G, Saltarel A, Carboni A, Maggiulli F, Becelli R. Surgical management of macroglossia:discussion of 7 cases. Oral Surg Oral Med Oral Pathol Oral Radiol Endod 2002;94(5):566–71.[PubMed: 12424449]
39. Deguchi T. Case report: three typical cases of glossectomy. Angle Orthod 1993;63(3):199–207.[PubMed: 8214788]
40. Fränkel, F.; Fränkel, C. Orofacial orthopedics with the functional regulator. Karger; Basel: 1989.41. Moss ML. Neurotrophic processes in orofacial growth. J Dent Res 1971;50(6):1492–4. [PubMed:
5289054]42. Schumacher, G-H. Principals of skeletal growth. In: Dixon, AD.; Hoyte, DAN.; Ronning, O., editors.
Fundamentals of craniofacial growth. CRC Press LLC; Boca Raton, New York: 1997. p. 1-21.43. Robinson IB, Sarnat BG. Growth pattern of the pig mandible. A serial roentgenographic study using
metallic implants. Am J Anat 1955;96:37–64. [PubMed: 14361305]44. Huang X, Zhang G, Herring SW. Age changes in mastication in the pig. Comp Biochem Physiol
Comp Physiol 1994;107(4):647–54. [PubMed: 7911409]45. Barteczko K, Jacob M. A re-evaluation of the premaxillary bone in humans. Anat Embryol (Berl)
2004;207(6):417–37. [PubMed: 14760532]
Liu et al. Page 9
Arch Oral Biol. Author manuscript; available in PMC 2009 October 1.
NIH
-PA Author Manuscript
NIH
-PA Author Manuscript
NIH
-PA Author Manuscript

46. Pouderoux P, Kahrilas PJ. Deglutitive tongue force modulation by volition, volume, and viscosity inhumans. Gastroenterology 1995;108(5):1418–26. [PubMed: 7729634]
47. Palmer JB, Hiiemae KM, Liu J. Tongue-jaw linkages in human feeding: a preliminaryvideofluorographic study. Arch Oral Biol 1997;42(6):429–41. [PubMed: 9382708]
48. Sarnat, BG. Postnatal growth of the nasomaxillary complex. In: Dixon, AD.; Hoyte, DAN.; Ronning,O., editors. Fundamentals of craniofacial growth. CRC Press LLC; Boca Raton, New York: 1997. p.205-24.
49. Kantomaa, T.; Ronning, O. Growth mechanism of the mandible. In: Dixon, AD.; Hoyte, DAN.;Ronning, O., editors. Fundamentals of craniofacial growth. CRC Press LLC; Boca Raton, New York:1997. p. 204-89.
Liu et al. Page 10
Arch Oral Biol. Author manuscript; available in PMC 2009 October 1.
NIH
-PA Author Manuscript
NIH
-PA Author Manuscript
NIH
-PA Author Manuscript
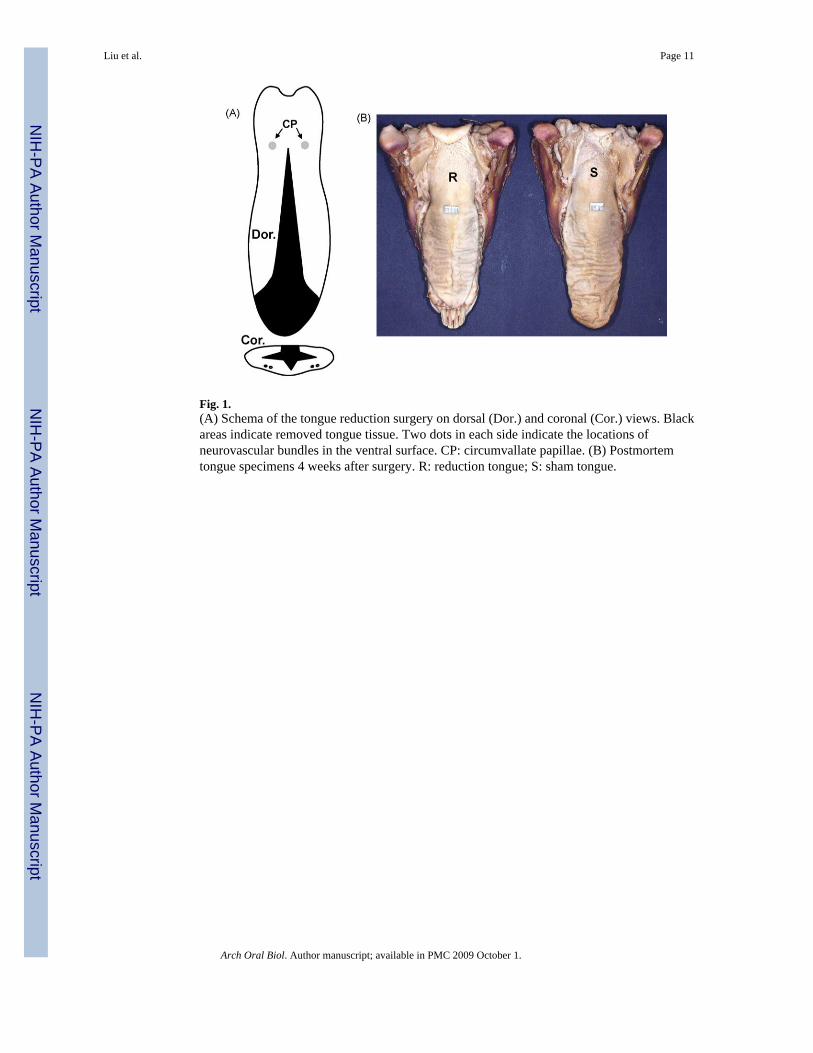
Fig. 1.(A) Schema of the tongue reduction surgery on dorsal (Dor.) and coronal (Cor.) views. Blackareas indicate removed tongue tissue. Two dots in each side indicate the locations ofneurovascular bundles in the ventral surface. CP: circumvallate papillae. (B) Postmortemtongue specimens 4 weeks after surgery. R: reduction tongue; S: sham tongue.
Liu et al. Page 11
Arch Oral Biol. Author manuscript; available in PMC 2009 October 1.
NIH
-PA Author Manuscript
NIH
-PA Author Manuscript
NIH
-PA Author Manuscript

Fig. 2.Lateral (A) and axial (B) radiocephalograms. Arrows indicate implanted stainless screws forsuperimposition.
Liu et al. Page 12
Arch Oral Biol. Author manuscript; available in PMC 2009 October 1.
NIH
-PA Author Manuscript
NIH
-PA Author Manuscript
NIH
-PA Author Manuscript

Fig. 3.Reference points of lateral and axial cephalometric measurements.(A) Lateral cephalogram. Cranial—In: the most posterior point of external occipitalprotuberance; Ba: the most antero-inferior point of occipital condyle; E: intersection betweenthe frontal bone and the most supero-anterior point of posterior limit of ethmoid bone; Sp:intersection between the body and posterior border of pterygoid process of sphenoid; N: front-nasal suture point; Na: the most anterior point of the nasal bone. Maxillary—Pr: the most infero-anterior point of the labial alveolar process of the maxillary incisor; Ui: the incisal edge of themaxillary incisor; Mx: the most convex point of the maxillary anterior limit; Pm: the mostconcave point of the anterior border of premaxilla; Ma: intersection between maxillary alveolarprocess and the mesial surface of the maxillary first molar; Mp: intersection between maxillaryalveolar process and distal surface of maxillary third molar. Mandible—Sm: intersectionbetween the pterygoid process of sphenoid and the anterior border of mandibular ramus; Gp:the most posterior point of the angular process of the mandible; Gi: the most inferior point ofthe angular process of mandible; Mn: the deepest point of the antegonial notch; Me: the mostinferior point of the mandibular symphysis; Id: the most supero-anterior point of the labialalveolar process of mandibular incisor; Li: the incisal edge of the mandibular incisor; Ma’:intersection between the mandibular alveolar process and the mesial surface of the mandibularfirst molar; Mp’: intersection between the mandibular alveolar process and the distal surfaceof mandibular third molar. (B) Axial cephalogram. Pmx: the most anterior point of themandible; Mxp: intersection of premaxilla and maxilla; Ms: the most prominent point ofmandibular symphysis; Mpa: intersection point of maxilla and palatine; Pc: intersection pointof pterygoid and occipital bones; Zy/Zy’: intersection between the line through Pc and bilateralzygomatic arches; Gp: intersection between the mid-sagittal line and the line connecting Gpand Gp’; Mdc/Mdc’: the most posteror point of the mandibular canine cusp; Mxc/Mxc’: themost posteror point of the maxillary canine cusp; Md1/Md1′: the most prominent point of themandibular 1st molar; Mx1/Mx1′: the most prominent point of the maxillary 1st molar; Md2/Md2′: contact point of mandibular 2nd and 3rd molars; Md3/Md3′: the most posterior point ofthe mandibular 3rd molar; Mx3/Mx3′: central fossa of maxillary 3rd molar. Dotted and dashedlines indicate the significant decrease of linear distances and angulation (α) at 2 and/or 4 weeksafter the surgery respectively in reduction as compared to sham animals.
Liu et al. Page 13
Arch Oral Biol. Author manuscript; available in PMC 2009 October 1.
NIH
-PA Author Manuscript
NIH
-PA Author Manuscript
NIH
-PA Author Manuscript

Fig. 4.Osteometric and dental landmarks for the measurements of postmortem skulls. Red and blackdots indicate landmarks on the skeletons and teeth, and red and black dashed lines representsignificantly changed variables between the two groups in skeletons and dental arches,respectively. (A) Lateral view; (B) parietal view; (C) palatal view; (D) occlusal view, mandible.(#1-2) Mandibular ramus height; (#1-4) mandibular total length; (#2-3) mandibular borderlength; (#3-5) mandibular body height; (#4-5) mandibular anterior length; (#4-21:) mandibularsymphysis length; (#6-7) maxillary buccal length; (#7-10) maxillary height; (#8-9) mid-premaxillary length; (#11-12) zygomatico-lacrimal suture length; (#13-14) nasal bone length;(#14-15) frontal bone length; (#15-16) bregma-lambda length; (#17-18) premaxillary palatallength; (#18-19) maxillary palatal length; (#19-20) palatine bone length; (#1-1′ and #2-2′)mandibular widths at condyle and angle; (#3-3′ and #5-5′) ventral and dorsal widths of anteriormandible; (#6-6′) premaxillary width; (#7-7′) maxillary posterior width; (#8-8′ and #9-9′)anterior and posterior nasal widths; (10-10′) front width of brain case; (#11-11′ and #12-12′)posterior and anterior midfacial widths; (#22-22′, #23-23′ and #24-24′) maxillary dental archwidths at canine, the 1st and 3rd deciduous molars; (#25-25′, #26-26′ and #27-27′) mandibulardental arch widths at canine, the 1st and 3rd molars. (For interpretation of the references tocolour in this figure legend, the reader is referred to the web version of the article.)
Liu et al. Page 14
Arch Oral Biol. Author manuscript; available in PMC 2009 October 1.
NIH
-PA Author Manuscript
NIH
-PA Author Manuscript
NIH
-PA Author Manuscript

Fig. 5.En-bloc bone pieces (A) and bone mineral density measurement by DEXA (B). a, b and cindicate premaxillary/maxillary bone blocs (left and right), mandibular symphysis bloc, andmandibular corpus blocs (left and right). Asterisk indicates statistical significance by non-paired t-test.
Liu et al. Page 15
Arch Oral Biol. Author manuscript; available in PMC 2009 October 1.
NIH
-PA Author Manuscript
NIH
-PA Author Manuscript
NIH
-PA Author Manuscript

Fig. 6.Body weight curve over the 6-week experimental period. T-1: 1 week before the surgery; T0:day of surgery; T1, T2, T3 and T4: 1, 2, 3 and 4 weeks after the surgery. Asterisks indicatestatistical significance by ANOVA (superscripted at F values) and Bonferroni post-hoc (abovethe dots) tests. *p < 0.05; **p < 0.01.
Liu et al. Page 16
Arch Oral Biol. Author manuscript; available in PMC 2009 October 1.
NIH
-PA Author Manuscript
NIH
-PA Author Manuscript
NIH
-PA Author Manuscript

Fig. 7.The comparisons of bone mineral density (BMD, A) and bone mineral content (BMC, B)between sham and reduction groups. Max/Prem: maxillary/premaxillary bloc; Man.corp:mandibular corpus bloc; Man.symp: mandibular symphysis bloc. Measurements from left andright maxillary/premaxillary and mandibular corpus blocs were combined in each group.Asterisk indicates statistical significance between the two groups.
Liu et al. Page 17
Arch Oral Biol. Author manuscript; available in PMC 2009 October 1.
NIH
-PA Author Manuscript
NIH
-PA Author Manuscript
NIH
-PA Author Manuscript

NIH
-PA Author Manuscript
NIH
-PA Author Manuscript
NIH
-PA Author Manuscript
Liu et al. Page 18Ta
ble
1C
hang
es o
f ton
gue
dim
ensi
ons a
nd m
ass a
fter s
urge
ry
Dim
ensi
ons
Mas
s
Len
gth
Wid
thT
hick
ness
Vol
ume(
ml)
Los
s(%
)W
eigh
t(g)
Los
s(%
)
Sham
Bef
ore
103.
45±4
.90
60.1
5±2.
247.
91±0
.33
n/a
n/a
n/a
n/a
Afte
r11
3.05
±5.2
1*67
.76±
0.61
*9.
16±0
.58*
71.4
5±2.
20n/
a71
.43±
1.52
n/a
Red
uctio
nB
efor
e10
4.52
±3.6
857
.88±
2.26
8.03
±0.3
3n/
an/
an/
an/
aA
fter
82.9
9±4.
69*
50.6
6±2.
41*
10.4
9±0.
27*
60.6
2±0.
91#
15.2
1±0.
7859
.42±
1.33
#15
.18±
0.19
Not
e: D
imen
sion
mea
sure
s on
tong
ue c
asts
(bod
y on
ly, a
nter
ior 2
/3),
and
mas
s mea
sure
s on
post
mor
tem
tong
ue sp
ecim
ens.
% o
f los
s cal
cula
ted
by sp
ecim
en v
olum
e (w
eigh
t)/re
mov
ed p
art v
olum
e(w
eigh
t) ×
100%
.
* p <
0.05
bef
ore
and
4 w
eeks
afte
r sur
gery
in e
ach
grou
p.
# p <
0.05
bet
wee
n th
e tw
o gr
oups
4 w
eeks
afte
r sur
gery
.
Arch Oral Biol. Author manuscript; available in PMC 2009 October 1.

NIH
-PA Author Manuscript
NIH
-PA Author Manuscript
NIH
-PA Author Manuscript
Liu et al. Page 19
Table 2Linear and angular variables of craniofacial skeletons and dental arches from cephalograms
Lateral-linear Lateral-angular Axial-linear
Na-In: superior cranial length Ba-In-E: neurocranial height to cranial vault Mdc-Mdc’: inter-mandibular canine widthPr-Ba: inferior cranial length In-Ba-Sp: neurocranial height to posterior
cranial baseMxc-Mxc’: inter-maxillary canine width
Sp-E: anterior cranial base length In-E-Sp: cranial vault angle Md1-Md1′: inter-mandibular 1st molarwidth
Sp-Ba: posterior cranial base length Na-N/Sp-E: nasal bone angle Mx1-Mx1′: inter-maxillary 1st molar widthE-In: neurocranial length Pr-E-In: premaxilla to cranial vault Md2-Md2′: inter-mandibular 2nd molar
widthBa-In: neurocranial height Pr-E-Sp: premaxillary angle Md3-Md3′: inter-mandibular 3rd molar
widthPr-E: exterior viscerocranial length Ui-E-In: maxillary incisor to cranial vault Mx3-Mx3′: inter-maxillary 3rd molar
widthMa-E: anterior viscerocranial height Ui-E-Sp: maxillary incisor angle Zy-Zy’: bi-zygomatic widthMp-E: posterior viscerocranial height Ui-Pr-Ma: maxillary incisor inclination Gp-Gp’: bi-gonial widthNa-N: nasal bone length Ma-Mp/E-Sp: palatal angle Pmx-Mxp: premaxillary palatal lengthMx-Pm: mid-premaxillary length Li-Id-Ma’: mandibular incisor inclination Mxp-Mpa: maxillary palatal lengthPr-Ma: maxillary incisor-molar distance Gi-Mn-Me: ante gonial notch angle Pmx-Ms: mandibular symphysis lengthId-Ma’: mandibular incisor-molar distance Me-Gi/E-Sp: mandibular plane angle Pmx-Gpi: Mandibular total lengthSm-Id: mandibular dorsal length Gp-Sm/Me-Gi: gonial angleGp-Id: mandibular ventral lengthGp-Sm: height of mandibular angle
Arch Oral Biol. Author manuscript; available in PMC 2009 October 1.

NIH
-PA Author Manuscript
NIH
-PA Author Manuscript
NIH
-PA Author Manuscript
Liu et al. Page 20Ta
ble
3C
ompa
rison
s of l
inea
r (m
m) a
nd a
ngul
ar (°
) mea
sure
men
ts o
ver t
ime
betw
een
the
two
grou
ps
LA
Lin
ear
Sham
Red
uctio
nL
A A
ngul
arSh
amR
educ
tion
AX
Lin
ear
Sham
Red
uctio
n
TM
ean
SDM
ean
SDM
ean
SDM
ean
SDM
ean
SDM
ean
SD
Na-
In0
145.
44.
7314
3.9
1.56
Ba-
In-E
62.3
1.67
61.8
2.44
Mdc
-Mdc
’36
.12.
3935
.61.
642
144.
02.
5114
3.7
1.46
60.6
2.52
61.5
2.04
36.8
2.86
35.6
1.54
414
8.0
2.56
146.
51.
9460
.32.
2960
.42.
7538
.11.
8837
.12.
06Pr
-Ba
013
3.4
3.60
126.
01.
28In
-Ba-
Sp78
.63.
6980
.23.
87M
xc-M
xc’S.
R29
.03.
2730
.11.
462
132.
04.
5312
8.1
4.53
79.1
2.67
81.2
2.67
31.8
2.43
*30
.11.
054
136.
76.
1713
3.1
6.17
79.6
3.78
81.1
2.79
32.7
3.30
30.9
0.49
Sp-E
045
.91.
9246
.21.
92In
-E-S
p65
.62.
5864
.72.
11M
d1-M
d1′
36.7
2.15
36.1
1.84
245
.52.
3846
.52.
3866
.12.
1566
.42.
6037
.42.
3735
.91.
344
46.0
3.62
47.5
3.62
67.2
2.15
67.4
2.87
38.6
1.94
*35
.81.
05Sp
-Ba
030
.91.
4729
.41.
47N
a-N
/Sp-
E11
7.1
1.86
112.
83.
38M
x1-M
x1′
31.8
0.96
33.3
1.88
230
.31.
5730
.21.
5711
7.0
2.10
113.
23.
4132
.01.
0932
.51.
834
31.4
3.06
30.2
3.06
117.
92.
1511
4.4
4.04
33.4
0.36
33.1
2.62
E-In
075
.13.
8375
.03.
83Pr
-E-I
nS.R
173.
03.
1616
9.7
1.31
Md2
-Md2′
35.4
1.38
35.3
1.06
275
.92.
3975
.82.
3917
4.8
3.11
171.
03.
3535
.71.
0235
.41.
614
77.5
2.90
77.2
2.90
174.
92.
0117
3.4
1.26
37.5
0.96
35.1
2.51
Ba-
In0
69.2
1.58
68.0
1.58
Pr-E
-Sp
153.
53.
9415
3.3
4.75
Md3
-Md3′
36.7
1.20
36.4
2.44
270
.21.
9069
.51.
9015
4.3
1.75
*15
0.9
1.74
37.4
1.51
37.1
2.38
472
.22.
9671
.42.
5615
2.9
4.13
150.
92.
3139
.41.
7136
.42.
60Pr
-E0
80.6
3.26
75.0
1.30
Ui-E
-InS.
R16
7.2
2.60
163.
70.
43M
x3-M
x3′
35.5
1.30
34.3
3.03
279
.43.
1476
.73.
1416
8.9
2.43
164.
83.
2936
.11.
4735
.31.
384
82.4
2.73
79.3
2.73
170.
52.
7116
8.5
4.39
36.9
0.64
35.3
1.83
Ma-
E0
52.5
2.42
48.8
2.42
Ui-E
-Sp
101.
62.
0898
.92.
43Z
y-Z
y’S.
R94
.81.
6993
.23.
402
51.3
3.42
51.0
3.42
102.
82.
2998
.43.
2797
.32.
6595
.43.
104
52.7
3.23
52.8
3.23
103.
32.
9910
0.8
4.82
101.
62.
0998
.24.
33M
p-E
042
.42.
1043
.62.
10U
i-Pr-
Ma
94.1
3.62
93.9
6.22
Gp-
Gp’
S.R
84.3
1.50
82.2
4.07
242
.31.
7144
.31.
7195
.36.
1792
.53.
4086
.65.
5685
.83.
294
43.8
2.32
44.9
2.32
93.0
5.97
90.0
4.69
91.3
4.17
88.0
3.41
Na-
N0
53.6
2.77
51.4
2.77
Ma-
Mp/
E-Sp
40.2
2.19
38.0
3.68
Pmx-
Mxp
S23
.02.
1422
.71.
812
53.4
3.05
53.8
3.05
38.4
2.12
39.9
6.26
26.0
2.36
*21
.41.
264
52.4
5.21
55.9
5.21
37.4
2.87
38.3
7.29
26.3
1.30
*23
.51.
97M
x-Pm
013
.51.
0612
.31.
06Li
-Id-
Ma’
118.
64.
4411
2.6
6.34
Mxp
-Mpa
34.0
4.17
31.2
4.63
214
.21.
6912
.71.
6911
5.5
8.39
111.
94.
8733
.75.
0032
.83.
274
14.6
2.30
13.6
2.30
116.
06.
3211
4.3
7.32
35.3
4.48
32.3
5.71
Pr-M
a0
37.2
4.10
34.5
4.10
Gi-M
n-M
eS.R
168.
84.
5416
7.4
6.67
Pmx-
MsS
35.0
2.89
32.6
2.88
237
.63.
5136
.23.
5117
1.9
5.64
171.
27.
8835
.92.
76 *
31.4
2.03
439
.53.
1437
.13.
1417
3.4
2.71
172.
13.
4736
.52.
42 *
32.0
3.10
Id-M
a’0
29.4
2.21
26.3
2.21
Me-
Gi/E
-Sp
35.0
3.87
35.2
3.35
Pmx-
Gpi
80.6
4.85
78.4
3.30
228
.21.
8827
.31.
8834
.03.
7635
.86.
2582
.84.
3683
.42.
564
31.6
2.28
29.1
2.28
32.0
2.89
35.6
6.42
87.1
5.62
85.8
1.92
Sm-I
dR0
99.5
3.75
97.2
1.54
Sm-G
p/M
e-G
iS.R
48.3
5.95
46.3
7.90
298
.82.
8795
.02.
8750
.56.
3349
.47.
804
101.
10.
9210
2.4
0.92
42.7
5.34
47.5
7.85
Gp-
IdS.
R0
122.
63.
5311
7.5
3.12
212
1.9
4.96
117.
54.
964
130.
84.
6512
6.7
4.65
Gp-
Sm0
43.7
2.30
42.3
2.30
247
.13.
0144
.33.
014
50.2
3.90
44.1
3.90
Not
e: L
A: l
ater
al; A
X: a
xial
; T: w
eek
afte
r the
surg
ery;
S.D
.: st
anda
rd d
evia
tion.
See
Tab
le 2
for v
aria
bles
. Bol
ded/
unde
rline
d va
riabl
es: p
< 0
.05
over
thre
e tim
e po
ints
. The
subs
crib
ed le
tters
indi
cate
the
grou
p, S
: sha
m; R
: red
uctio
n. B
olde
d/ita
lic n
umbe
rs a
nd a
ster
isks
: p <
0.0
13 b
etw
een
sham
and
redu
ctio
n an
imal
s at e
ach
time
poin
t.
Arch Oral Biol. Author manuscript; available in PMC 2009 October 1.

NIH
-PA Author Manuscript
NIH
-PA Author Manuscript
NIH
-PA Author Manuscript
Liu et al. Page 21Ta
ble
4C
ompa
rison
s of m
easu
rem
ents
from
skel
eton
s and
den
tal a
rche
s
Sham
Red
uctio
nSh
amR
educ
tion
Sham
Red
uctio
n
LA
Mea
nSD
Mea
nSD
P-P
Mea
nSD
Mea
nSD
O-M
Mea
nSD
Mea
nSD
1-2
69.7
02.
80 *
65.8
01.
3513
-14
55.0
47.
8651
.15
9.41
4-21
35.8
11.
65 *
33.4
31.
701-
413
1.11
5.39
129.
322.
0314
-15
49.4
57.
6350
.07
8.31
1-1′
77.9
32.
1677
.08
3.26
2-3
73.7
33.
8374
.30
2.64
15-1
626
.73
1.46
26.8
82.
682-
2′82
.93
6.43
80.9
04.
933-
528
.47
1.33
27.7
52.
6617
-18
21.9
11.
2420
.56
1.23
3-3′
17.0
32.
0616
.30
1.67
4-5
33.9
11.
20 *
31.6
61.
2818
-19
43.3
92.
86 *
40.3
32.
455-
5′32
.66
2.39
*30
.10
1.10
6-7
38.4
40.
6139
.04
2.59
19-2
022
.68
1.55
22.7
02.
6125
-25′
32.6
92.
78 *
30.1
40.
997-
1040
.73
2.62
40.4
32.
076-
6′31
.09
1.92
30.5
10.
7426
-26′
34.5
32.
8331
.57
2.65
8-9
12.7
71.
4712
.49
1.29
7-7′
45.4
00.
4044
.26
2.02
27-2
7′37
.38
1.66
36.7
31.
7811
-12
8.92
1.46
8.40
0.24
8-8′
24.6
11.
0723
.53
0.53
9-9′
23.7
61.
4522
.97
0.98
10-1
0′36
.03
1.40
36.9
21.
2711
-11′
70.1
41.
62 *
66.2
70.
5412
-12′
57.0
32.
7454
.34
2.36
22-2
2′34
.13
2.66
32.9
33.
1923
-23′
32.2
21.
1833
.79
1.57
24-2
4′37
.50
0.77
36.4
01.
23
Not
e: L
A: l
ater
al; P
-P: p
arie
tal-p
alat
al; O
-M: o
cclu
sal-m
andi
ble;
S.D
.: st
anda
rd d
evia
tion.
Bol
ded/
italic
var
iabl
es a
nd a
ster
isks
indi
cate
stat
istic
al si
gnifi
canc
e be
twee
n th
e tw
o gr
oups
(p <
0.0
5).
Ref
er to
the
lege
nd o
f Fig
. 2 fo
r the
abb
revi
atio
ns o
f var
iabl
es.
Arch Oral Biol. Author manuscript; available in PMC 2009 October 1.