nike, inc.d18rn0p25nwr6d.cloudfront.net/cik-0000320187/6cd81397-8784-4e2d... · nike, inc. (exact...
TRANSCRIPT
UNITED STATESSECURITIES AND EXCHANGE COMMISSION
WASHINGTON, D.C. 20549
FORM 10-Q(Mark One)
☑ QUARTERLY REPORT PURSUANT TO SECTION 13 OR 15(d) OF THE SECURITIES EXCHANGE ACT OF 1934For the Quarterly Period Ended November 30, 2016
☐ TRANSITION REPORT PURSUANT TO SECTION 13 OR 15(d) OF THE SECURITIES EXCHANGE ACT OF 1934For the transition period from to
Commission file number-001-10635
NIKE, Inc.(Exact name of registrant as specified in its charter)
OREGON 93-0584541
(State or other jurisdiction ofincorporation or organization) (I.R.S. Employer
Identification No.)
One Bowerman Drive,Beaverton, Oregon 97005-6453
(Address of principal executive offices) (Zip Code)
Registrant’s telephone number, including area code: (503) 671-6453
Indicate by check mark whether the registrant (1) has filed all reports required to be filed by Section 13 or 15(d) of the Securities Exchange Act of 1934 during the preceding 12 months (or forsuch shorter period that the registrant was required to file such reports), and (2) has been subject to such filing requirements for the past 90 days. Yes ☑ No ☐
Indicate by check mark whether the registrant has submitted electronically and posted on its corporate Web site, if any, every Interactive Data File required to be submitted and posted pursuantto Rule 405 of Regulation S-T (§ 232.405 of this chapter) during the preceding 12 months (or for such shorter period that the registrant was required to submit and post such files). Yes ☑ No ☐
Indicate by check mark whether the registrant is a large accelerated filer, an accelerated filer, a non-accelerated filer, or a smaller reporting company. See the definitions of “large accelerated
filer,” “accelerated filer” and “smaller reporting company” in Rule 12b-2 of the Exchange Act.
Large accelerated filer ☑ Accelerated filer☐
Non-accelerated filer ☐ (Do not check if a smaller reporting company) Smaller Reporting Company ☐
Indicate by check mark whether the registrant is a shell company (as defined in Rule 12b-2 of the Exchange Act). Yes ☐ No ☑
Shares of Common Stock outstanding as of January 3, 2017 were:
Class A 329,251,752Class B 1,325,225,378 1,654,477,130

Table of Contents
NIKE, INC.FORM 10-QTable of Contents
PART I - FINANCIAL INFORMATION PageITEM 1. Financial Statements 3 Unaudited Condensed Consolidated Balance Sheets 3 Unaudited Condensed Consolidated Statements of Income 4 Unaudited Condensed Consolidated Statements of Comprehensive Income 5 Unaudited Condensed Consolidated Statements of Cash Flows 6 Notes to the Unaudited Condensed Consolidated Financial Statements 7ITEM 2. Management's Discussion and Analysis of Financial Condition and Results of Operations 23ITEM 3. Quantitative and Qualitative Disclosures about Market Risk 41ITEM 4. Controls and Procedures 41 PART II - OTHER INFORMATION ITEM 1. Legal Proceedings 43ITEM 1A. Risk Factors 43ITEM 2. Unregistered Sales of Equity Securities and Use of Proceeds 43ITEM 6. Exhibits 43 Signatures 44
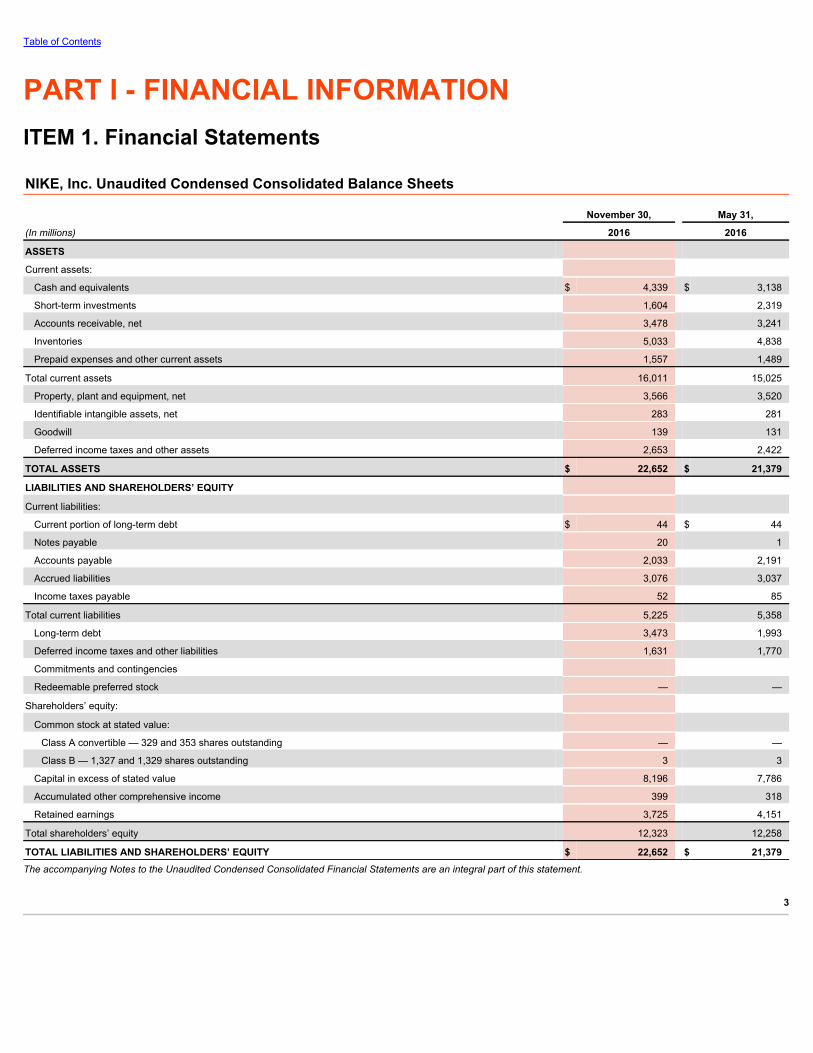
Table of Contents
PART I - FINANCIAL INFORMATIONITEM 1. Financial Statements
NIKE, Inc. Unaudited Condensed Consolidated Balance Sheets
November 30, May 31,
(In millions) 2016 2016
ASSETS
Current assets:
Cash and equivalents $ 4,339 $ 3,138
Short-term investments 1,604 2,319
Accounts receivable, net 3,478 3,241
Inventories 5,033 4,838
Prepaid expenses and other current assets 1,557 1,489
Total current assets 16,011 15,025
Property, plant and equipment, net 3,566 3,520
Identifiable intangible assets, net 283 281
Goodwill 139 131
Deferred income taxes and other assets 2,653 2,422
TOTAL ASSETS $ 22,652 $ 21,379
LIABILITIES AND SHAREHOLDERS’ EQUITY
Current liabilities:
Current portion of long-term debt $ 44 $ 44
Notes payable 20 1
Accounts payable 2,033 2,191
Accrued liabilities 3,076 3,037
Income taxes payable 52 85
Total current liabilities 5,225 5,358
Long-term debt 3,473 1,993
Deferred income taxes and other liabilities 1,631 1,770
Commitments and contingencies
Redeemable preferred stock — —
Shareholders’ equity:
Common stock at stated value:
Class A convertible — 329 and 353 shares outstanding — —
Class B — 1,327 and 1,329 shares outstanding 3 3
Capital in excess of stated value 8,196 7,786
Accumulated other comprehensive income 399 318
Retained earnings 3,725 4,151
Total shareholders’ equity 12,323 12,258
TOTAL LIABILITIES AND SHAREHOLDERS’ EQUITY $ 22,652 $ 21,379The accompanying Notes to the Unaudited Condensed Consolidated Financial Statements are an integral part of this statement.
3

Table of Contents
NIKE, Inc. Unaudited Condensed Consolidated Statements of Income
Three Months Ended November 30, Six Months Ended November 30,
(In millions, except per share data) 2016 2015 2016 2015
Revenues $ 8,180 $ 7,686 $ 17,241 $ 16,100
Cost of sales 4,564 4,185 9,502 8,604
Gross profit 3,616 3,501 7,739 7,496
Demand creation expense 762 769 1,803 1,601
Operating overhead expense 1,743 1,791 3,599 3,536
Total selling and administrative expense 2,505 2,560 5,402 5,137
Interest expense (income), net 15 5 22 9
Other (income) expense, net (18) (34) (80) (65)
Income before income taxes 1,114 970 2,395 2,415
Income tax expense 272 185 304 451
NET INCOME $ 842 $ 785 $ 2,091 $ 1,964
Earnings per common share:
Basic $ 0.51 $ 0.46 $ 1.26 $ 1.15
Diluted $ 0.50 $ 0.45 $ 1.23 $ 1.12
Dividends declared per common share $ 0.18 $ 0.16 $ 0.34 $ 0.30
The accompanying Notes to the Unaudited Condensed Consolidated Financial Statements are an integral part of this statement.
4

Table of Contents
NIKE, Inc. Unaudited Condensed Consolidated Statements of Comprehensive Income
Three Months Ended November 30, Six Months Ended November 30,
(In millions) 2016 2015 2016 2015
Net income $ 842 $ 785 $ 2,091 $ 1,964
Other comprehensive income (loss), net of tax:
Change in net foreign currency translation adjustment (14) (29) (11) (110)
Change in net gains (losses) on cash flow hedges 323 290 83 (39)
Change in net gains (losses) on other 5 13 9 10
Total other comprehensive income (loss), net of tax 314 274 81 (139)
TOTAL COMPREHENSIVE INCOME $ 1,156 $ 1,059 $ 2,172 $ 1,825The accompanying Notes to the Unaudited Condensed Consolidated Financial Statements are an integral part of this statement.
5

Table of Contents
NIKE, Inc. Unaudited Condensed Consolidated Statements of Cash Flows
Six Months Ended November 30,
(In millions) 2016 2015
Cash provided by operations:
Net income $ 2,091 $ 1,964
Income charges (credits) not affecting cash:
Depreciation 346 314
Deferred income taxes (70) (39)
Stock-based compensation 111 116
Amortization and other 12 8
Net foreign currency adjustments (34) 74
Changes in certain working capital components and other assets and liabilities:
(Increase) in accounts receivable (318) (139)
(Increase) in inventories (300) (354)
(Increase) in prepaid expenses and other current assets (85) (114)
(Decrease) in accounts payable, accrued liabilities and income taxes payable (69) (794)
Cash provided by operations 1,684 1,036
Cash provided (used) by investing activities:
Purchases of short-term investments (2,358) (2,851)
Maturities of short-term investments 1,743 1,510
Sales of short-term investments 1,404 1,250
Additions to property, plant and equipment (512) (615)
Disposals of property, plant and equipment 12 9
Other investing activities (53) —
Cash provided (used) by investing activities 236 (697)
Cash used by financing activities:
Net proceeds from long-term debt issuance 1,482 981
Long-term debt payments, including current portion (3) (103)
Increase in notes payable 21 33
Payments on capital lease obligations (6) (3)
Proceeds from exercise of stock options and other stock issuances 238 328
Excess tax benefits from share-based payment arrangements 78 201
Repurchase of common stock (1,954) (1,240)
Dividends — common and preferred (536) (479)
Cash used by financing activities (680) (282)
Effect of exchange rate changes on cash and equivalents (39) (58)
Net increase (decrease) in cash and equivalents 1,201 (1)
Cash and equivalents, beginning of period 3,138 3,852
CASH AND EQUIVALENTS, END OF PERIOD $ 4,339 $ 3,851
Supplemental disclosure of cash flow information:
Non-cash additions to property, plant and equipment $ 120 $ 201
Dividends declared and not paid 304 273
The accompanying Notes to the Unaudited Condensed Consolidated Financial Statements are an integral part of this statement.
6

Table of Contents
Notes to the Unaudited Condensed Consolidated Financial Statements
Note 1 Summary of Significant Accounting Policies 8Note 2 Inventories 9Note 3 Accrued Liabilities 9Note 4 Fair Value Measurements 9Note 5 Long-Term Debt 12Note 6 Income Taxes 12Note 7 Common Stock and Stock-Based Compensation 13Note 8 Earnings Per Share 14Note 9 Risk Management and Derivatives 14Note 10 Accumulated Other Comprehensive Income 18Note 11 Operating Segments 20Note 12 Commitments and Contingencies 22
7
Table of Contents
Note 1 — Summary of Significant Accounting Policies
B asis of PresentationThe Unaudited Condensed Consolidated Financial Statements include the accounts of NIKE, Inc. and its subsidiaries (the “Company”) and reflect all normal adjustments whichare, in the opinion of management, necessary for a fair statement of the results of operations for the interim period. The year-end Condensed Consolidated Balance Sheet dataas of May 31, 2016 was derived from audited financial statements, but does not include all disclosures required by accounting principles generally accepted in the UnitedStates of America (“U.S. GAAP”). The interim financial information and notes thereto should be read in conjunction with the Company’s latest Annual Report on Form 10-K.The results of operations for the three and six months ended November 30, 2016 are not necessarily indicative of results to be expected for the entire year.
ReclassificationsCertain prior year amounts have been reclassified to conform to fiscal 2017 presentation.
Recently Adopted Accounting StandardsIn April 2015, the Financial Accounting Standards Board (FASB) issued Accounting Standards Update (ASU) No. 2015-03, Interest — Imputation of Interest (Subtopic 835-30):Simplifying the Presentation of Debt Issuance Costs. The updated guidance requires debt issuance costs to be presented as a direct deduction from the carrying amount of thecorresponding debt liability on the balance sheet. The Company adopted the standard on a retrospective basis in the first quarter of fiscal 2017. The adoption of this standardreduced both Deferred income taxes and other assets and Long-term debt by $17 million on the Unaudited Condensed Consolidated Balance Sheet as of May 31, 2016 .
Recently Issued Accounting StandardsIn October 2016, the FASB issued ASU No. 2016-16, Income Taxes (Topic 740): Intra-Entity Transfers of Assets Other Than Inventory . The updated guidance requirescompanies to recognize the income tax consequences of an intra-entity transfer of an asset other than inventory when the transfer occurs. Income tax effects of intra-entitytransfers of inventory will continue to be deferred until the inventory has been sold to a third party. The ASU is effective for the Company beginning June 1, 2018, using amodified retrospective approach, with the cumulative effect recognized through retained earnings at the date of adoption. Early adoption is permitted. The Company isevaluating the impact this update will have on its existing accounting policies and the Consolidated Financial Statements. The Company anticipates the updated guidancecould have a material impact on the Consolidated Financial Statements at adoption through the recognition of a cumulative-effect adjustment to retained earnings of previouslydeferred charges.
In March 2016, the FASB issued ASU No. 2016-09, Compensation — Stock Compensation (Topic 718): Improvements to Employee Share-Based Payment Accounting , whichchanges how companies account for certain aspects of share-based payment awards to employees. The updated guidance requires excess tax benefits and deficiencies fromshare-based payment awards to be recorded in income tax expense in the income statement. Currently, excess tax benefits and deficiencies are recognized in shareholders’equity on the balance sheet. In addition, the updated guidance also changes the accounting for forfeitures and statutory tax withholding requirements, as well as theclassification in the statement of cash flows. The Company will adopt the standard on June 1, 2017. The Company continues to evaluate the impact this update will have on itsexisting accounting policies and the Consolidated Financial Statements. Based on a preliminary assessment, the ASU is expected to result in increased volatility to theCompany’s income tax expense in future periods dependent upon, among other variables, the price of its common stock and the timing and volume of share-based paymentaward activity, such as employee exercises of stock options and vesting of restricted stock awards.
In February 2016, the FASB issued ASU No. 2016-02, Leases (Topic 842) , that replaces existing lease accounting guidance. The new standard is intended to provideenhanced transparency and comparability by requiring lessees to record right-of-use assets and corresponding lease liabilities on the balance sheet. The new guidance willcontinue to classify leases as either finance or operating, with classification affecting the pattern of expense recognition in the income statement. The Company will adopt thestandard on June 1, 2019. The ASU is required to be applied using a modified retrospective approach at the beginning of the earliest period presented, with optional practicalexpedients. The Company is in the preliminary stages of the assessment of the effect the guidance will have on its existing accounting policies and the Consolidated FinancialStatements, but expects there will be an increase in assets and liabilities on the Consolidated Balance Sheets at adoption due to the recording of right-of-use assets andcorresponding lease liabilities, which may be material. Refer to Note 15 — Commitments and Contingencies of the Annual Report on Form 10-K for the fiscal year ended May31, 2016 for information about the Company’s lease obligations.
In January 2016, the FASB issued ASU No. 2016-01, Financial Instruments — Overall (Subtopic 825-10): Recognition and Measurement of Financial Assets and FinancialLiabilities . The updated guidance enhances the reporting model for financial instruments, which includes amendments to address aspects of recognition, measurement,presentation and disclosure. The update to the standard is effective for the Company beginning June 1, 2018. The Company does not expect the adoption to have a materialimpact on the Consolidated Financial Statements.
In May 2014, the FASB issued ASU No. 2014-09, Revenue from Contracts with Customers (Topic 606) , that replaces existing revenue recognition guidance. The updatedguidance requires companies to recognize revenue in a way that depicts the transfer of promised goods or services to customers in an amount that reflects the consideration towhich the entity expects to be entitled in exchange for those goods or services. In addition, the new standard requires that reporting companies disclose the nature, amount,timing and uncertainty of revenue and cash flows arising from contracts with customers. The Company expects to adopt the standard on June 1, 2018. The new standard isrequired to be applied retrospectively to each prior reporting period presented or retrospectively with the cumulative effect of initially applying it recognized at the date of initialapplication. The Company has not yet selected a transition method. The Company is in the process of evaluating the new standard against its existing accounting policies,including the timing of revenue recognition, and its contracts with customers, to determine the effect the guidance will have on the Consolidated Financial Statements.
8
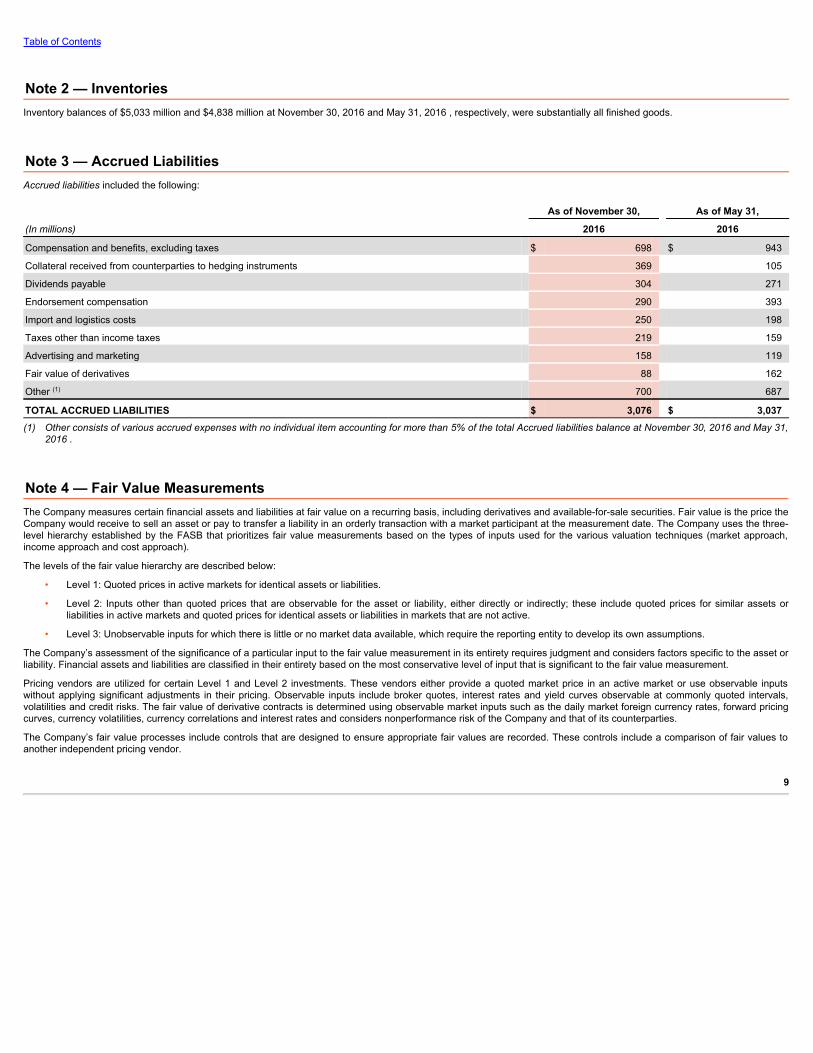
Table of Contents
Note 2 — InventoriesInventory balances of $5,033 million and $4,838 million at November 30, 2016 and May 31, 2016 , respectively, were substantially all finished goods.
Note 3 — Accrued LiabilitiesAccrued liabilities included the following:
As of November 30, As of May 31,
(In millions) 2016 2016
Compensation and benefits, excluding taxes $ 698 $ 943
Collateral received from counterparties to hedging instruments 369 105
Dividends payable 304 271
Endorsement compensation 290 393
Import and logistics costs 250 198
Taxes other than income taxes 219 159
Advertising and marketing 158 119
Fair value of derivatives 88 162
Other (1) 700 687
TOTAL ACCRUED LIABILITIES $ 3,076 $ 3,037(1) Other consists of various accrued expenses with no individual item accounting for more than 5% of the total Accrued liabilities balance at November 30, 2016 and May 31,
2016 .
Note 4 — Fair Value MeasurementsThe Company measures certain financial assets and liabilities at fair value on a recurring basis, including derivatives and available-for-sale securities. Fair value is the price theCompany would receive to sell an asset or pay to transfer a liability in an orderly transaction with a market participant at the measurement date. The Company uses the three-level hierarchy established by the FASB that prioritizes fair value measurements based on the types of inputs used for the various valuation techniques (market approach,income approach and cost approach).
The levels of the fair value hierarchy are described below:
• Level 1: Quoted prices in active markets for identical assets or liabilities.
• Level 2: Inputs other than quoted prices that are observable for the asset or liability, either directly or indirectly; these include quoted prices for similar assets orliabilities in active markets and quoted prices for identical assets or liabilities in markets that are not active.
• Level 3: Unobservable inputs for which there is little or no market data available, which require the reporting entity to develop its own assumptions.
The Company’s assessment of the significance of a particular input to the fair value measurement in its entirety requires judgment and considers factors specific to the asset orliability. Financial assets and liabilities are classified in their entirety based on the most conservative level of input that is significant to the fair value measurement.
Pricing vendors are utilized for certain Level 1 and Level 2 investments. These vendors either provide a quoted market price in an active market or use observable inputswithout applying significant adjustments in their pricing. Observable inputs include broker quotes, interest rates and yield curves observable at commonly quoted intervals,volatilities and credit risks. The fair value of derivative contracts is determined using observable market inputs such as the daily market foreign currency rates, forward pricingcurves, currency volatilities, currency correlations and interest rates and considers nonperformance risk of the Company and that of its counterparties.
The Company’s fair value processes include controls that are designed to ensure appropriate fair values are recorded. These controls include a comparison of fair values toanother independent pricing vendor.
9

Table of Contents
The following tables present information about the Company’s financial assets measured at fair value on a recurring basis as of November 30, 2016 and May 31, 2016 , andindicate the level in the fair value hierarchy in which the Company classifies the fair value measurement.
As of November 30, 2016
(In millions) Assets at Fair Value Cash and
Equivalents Short-term
Investments Other Long-term
Assets
Cash $ 681 $ 681 $ — $ —
Level 1:
U.S. Treasury securities 1,256 350 906 —
Level 2:
Time deposits 820 781 39 —
U.S. Agency securities 628 335 293 —
Commercial paper and bonds 647 281 366 —
Money market funds 1,911 1,911 — —
Total Level 2: 4,006 3,308 698 —
Level 3:
Non-marketable preferred stock 10 — — 10
TOTAL $ 5,953 $ 4,339 $ 1,604 $ 10
As of May 31, 2016
(In millions) Assets at Fair Value Cash and
Equivalents Short-term
Investments Other Long-term
Assets
Cash $ 774 $ 774 $ — $ —
Level 1:
U.S. Treasury securities 1,265 100 1,165 —
Level 2:
Time deposits 831 827 4 —
U.S. Agency securities 679 — 679 —
Commercial paper and bonds 733 262 471 —
Money market funds 1,175 1,175 — —
Total Level 2: 3,418 2,264 1,154 —
Level 3:
Non-marketable preferred stock 10 — — 10
TOTAL $ 5,467 $ 3,138 $ 2,319 $ 10
The Company elects to record the gross assets and liabilities of its derivative financial instruments on the Unaudited Condensed Consolidated Balance Sheets. TheCompany’s derivative financial instruments are subject to master netting arrangements that allow for the offset of assets and liabilities in the event of default or earlytermination of the contract. Any amounts of cash collateral received related to these instruments associated with the Company's credit-related contingent features are recordedin Cash and equivalents and Accrued liabilities , the latter of which would further offset against the Company’s derivative asset balance (refer to Note 9 — Risk Managementand Derivatives ). Any amounts of cash collateral posted related to these instruments associated with the Company's credit-related contingent features are recorded in Prepaidand other current assets , which would offset against the Company’s derivative liability balance (refer to Note 9 — Risk Management and Derivatives ). Cash collateral receivedor posted related to the Company's credit-related contingent features is presented in the Cash provided by operations component of the Unaudited Condensed ConsolidatedStatements of Cash Flows. Any amounts of non-cash collateral received, such as securities, are not recorded on the Unaudited Condensed Consolidated Balance Sheetspursuant to U.S. GAAP.
10

Table of Contents
The following tables present information about the Company’s derivative assets and liabilities measured at fair value on a recurring basis as of November 30, 2016 andMay 31, 2016 , and indicate the level in the fair value hierarchy in which the Company classifies the fair value measurement.
As of November 30, 2016 Derivative Assets Derivative Liabilities
(In millions) Assets at Fair
Value Other Current
Assets Other Long-term Assets
Liabilities atFair Value
AccruedLiabilities
Other Long-term Liabilities
Level 2:
Foreign exchange forwards and options (1) $ 844 $ 657 $ 187 $ 92 $ 86 $ 6
Embedded derivatives 10 4 6 9 2 7
TOTAL $ 854 $ 661 $ 193 $ 101 $ 88 $ 13(1) If the foreign exchange derivative instruments had been netted on the Unaudited Condensed Consolidated Balance Sheets, the asset and liability positions each would
have been reduced by $92 million as of November 30, 2016 . As of that date, the Company had received $369 million of cash collateral from various counterpartiesrelated to these foreign exchange derivative instruments. No amount of collateral was posted on the Company's derivative liability balance as of November 30, 2016 .
As of May 31, 2016 Derivative Assets Derivative Liabilities
(In millions) Assets at Fair
Value Other Current
Assets Other Long-term Assets
Liabilities atFair Value
AccruedLiabilities
Other Long-term Liabilities
Level 2:
Foreign exchange forwards and options (1) $ 603 $ 487 $ 116 $ 145 $ 115 $ 30
Embedded derivatives 7 2 5 9 2 7
Interest rate swaps (2) 7 7 — 45 45 —
TOTAL $ 617 $ 496 $ 121 $ 199 $ 162 $ 37(1) If the foreign exchange derivative instruments had been netted on the Condensed Consolidated Balance Sheets, the asset and liability positions each would have been
reduced by $136 million as of May 31, 2016 . As of that date, the Company had received $105 million of cash collateral from various counterparties related to theseforeign exchange derivative instruments. No amount of collateral was posted on the Company’s derivative liability balance as of May 31, 2016 .
(2) As of May 31, 2016 , no amount of cash collateral had been received or posted on the derivative asset or liability balance related to the Company's interest rate swaps.
Available-for-sale securities comprise investments in U.S. Treasury and Agency securities, time deposits, money market funds, corporate commercial paper and bonds. Thesesecurities are valued using market prices in both active markets (Level 1) and less active markets (Level 2). As of November 30, 2016 , the Company held $1,369 million ofavailable-for-sale securities with maturity dates within one year and $235 million with maturity dates over one year and less than five years within Short-term investments onthe Unaudited Condensed Consolidated Balance Sheets . The gross realized gains and losses on sales of available-for-sale securities were immaterial for the three and sixmonths ended November 30, 2016 and 2015 . Unrealized gains and losses on available-for-sale securities included in Accumulated other comprehensive income wereimmaterial as of November 30, 2016 and May 31, 2016 . The Company regularly reviews its available-for-sale securities for other-than-temporary impairment. For the sixmonths ended November 30, 2016 and 2015 , the Company did not consider any of its securities to be other-than-temporarily impaired and, accordingly, did not recognize anyimpairment losses.
Included in Interest expense (income), net for the three months ended November 30, 2016 and 2015 was interest income related to the Company's available-for-sale securitiesof $5 million and $2 million , respectively, and $9 million and $4 million for the six months ended November 30, 2016 and 2015 , respectively.
The Company’s Level 3 assets comprise investments in certain non-marketable preferred stock. These Level 3 investments are an immaterial portion of the Company'sportfolio. Changes in Level 3 investment assets were immaterial during the six months ended November 30, 2016 and the fiscal year ended May 31, 2016 .
No transfers among levels within the fair value hierarchy occurred during the six months ended November 30, 2016 and the fiscal year ended May 31, 2016 .
Derivative financial instruments include foreign exchange forwards and options, embedded derivatives and interest rate swaps. Refer to Note 9 — Risk Management andDerivatives for additional detail.
As of November 30, 2016 and May 31, 2016 , assets or liabilities that were required to be measured at fair value on a non-recurring basis were immaterial .
Financial Assets and Liabilities Not Recorded at Fair ValueFor fair value information regarding Long-term debt , refer to Note 5 — Long-Term Debt .
The carrying amounts reflected on the Unaudited Condensed Consolidated Balance Sheets for Notes payable approximate fair value.
11

Table of Contents
Note 5 — Long-Term DebtLong-term debt , net of unamortized premiums, discounts and debt issuance costs, comprises the following :
OriginalPrincipal
Interest
Rate
Interest
Payments
Book Value Outstanding as of
Scheduled Maturity (Dollars and Yen in millions) November 30, 2016 May 31, 2016
Corporate Bond Payables: (1)
May 1, 2023 (2) $ 500 2.25% Semi-Annually $ 497 $ 497
November 1, 2026 (3) $ 1,000 2.38% Semi-Annually 993 —
May 1, 2043 (2) $ 500 3.63% Semi-Annually 495 494
November 1, 2045 (4) $ 1,000 3.88% Semi-Annually 981 981
November 1, 2046 (3) $ 500 3.38% Semi-Annually 490 —
Promissory Notes:
April 1, 2017 (5) $ 40 6.20% Monthly 38 38
Japanese Yen Notes:
August 20, 2001 through November 20, 2020 (6) ¥ 9,000 2.60% Quarterly 16 18
August 20, 2001 through November 20, 2020 (6) ¥ 4,000 2.00% Quarterly 7 9
Total 3,517 2,037
Less current maturities 44 44
TOTAL LONG-TERM DEBT $ 3,473 $ 1,993(1) These senior unsecured obligations rank equally with the Company's other unsecured and unsubordinated indebtedness.(2) The bonds are redeemable at the Company's option prior to February 1, 2023 and November 1, 2042, respectively, at a price equal to the greater of (i) 100% of the
aggregate principal amount of the notes to be redeemed or (ii) the sum of the present values of the remaining scheduled payments, plus in each case, accrued andunpaid interest. Subsequent to February 1, 2023 and November 1, 2042, respectively, the bonds also feature a par call provision, which allows for the bonds to beredeemed at a price equal to 100% of the aggregate principal amount of the notes being redeemed, plus accrued and unpaid interest.
(3) The bonds are redeemable at the Company's option prior to August 1, 2026 and May 1, 2046, respectively, at a price equal to the greater of (i) 100% of the aggregateprincipal amount of the notes to be redeemed or (ii) the sum of the present values of the remaining scheduled payments, plus in each case, accrued and unpaid interest.Subsequent to August 1, 2026 and May 1, 2046, respectively, the bonds also feature a par call provision, which allows for the bonds to be redeemed at a price equal to100% of the aggregate principal amount of the notes being redeemed, plus accrued and unpaid interest.
(4) The bonds are redeemable at the Company's option prior to May 1, 2045, at a price equal to the greater of (i) 100% of the aggregate principal amount of the notes to beredeemed or (ii) the sum of the present values of the remaining scheduled payments, plus in each case, accrued and unpaid interest. Subsequent to May 1, 2045, thebonds also feature a par call provision, which allows for the bonds to be redeemed at a price equal to 100% of the aggregate principal amount of the notes beingredeemed, plus accrued and unpaid interest.
(5) The Company assumed a total of $59 million in bonds payable as part of its agreement to purchase certain Corporate properties; this was treated as a non-cash financingtransaction. The property serves as collateral for the debt. The purchase of these properties was accounted for as a business combination where the total consideration of$85 million was allocated to the land and buildings acquired; no other tangible or intangible assets or liabilities resulted from the purchase. During the year ended May 31,2016 , th e notes due January 1, 2018 were legally defeased and an insignificant loss on defeasance was recognized. The remaining bonds mature in 2017 and theCompany does not have the ability to re-negotiate the terms of the debt agreement .
(6) NIKE Logistics YK assumed a total of ¥13 billion in loans as part of its agreement to purchase a distribution center in Japan, which serves as collateral for the loans.These loans mature in equal quarterly installments during the period August 20, 2001 through November 20, 2020.
The scheduled maturity of Long-term debt in each of th e twelve month periods ending November 30, 2017 thro ugh 2021 are $44 million , $6 million , $6 million , $6 millionand $0 million , respectively, at face value.
The Company’s Long-term debt is recorded at adjusted cost, net of unamortized premiums, discounts and debt issuance costs. The fair value of Long-term debt is estimatedbased upon quoted prices for similar instruments or quoted prices for identical instruments in inactive markets (Level 2). The fair value of the Company’s Long-term debt ,including the current portion, was approximately $3,374 million at November 30, 2016 and $2,125 million at May 31, 2016 .
Note 6 — Income TaxesThe effective tax rate was 12.7% and 18.7% for the six months ended November 30, 2016 and 2015 , respectively. The decrease in the Company's effective tax rate wasprimarily due to a discrete benefit related to the resolution of a foreign tax credit matter with the U.S. Internal Revenue Service (IRS). The Company also benefited from a one-time adjustment to a deferred tax asset related to the nonqualified deferred compensation plan.
As of November 30, 2016 , total gross unrecognized tax benefits, excluding related interest and penalties, were $397 million , $174 million of which would affect the Company’seffective tax rate if recognized in future periods. As of May 31, 2016 , total gross unrecognized tax benefits, excluding related interest and penalties, were $506 million . Theliability for payment of interest and penalties increased $ 11 million during the six months ended November 30, 2016 . As of November 30, 2016 and May 31, 2016 , accruedinterest and penalties related to uncertain tax positions were $220 million and $209 million , respectively (excluding federal benefit).
12

Table of Contents
The Company incurs tax liabilities primarily in the United States, China and the Netherlands, as well as various state and other foreign jurisdictions. The Company is currentlyunder audit by the IRS for fiscal years 2013 through 2016. As previously disclosed, the Company received statutory notices of deficiency for fiscal 2011 and fiscal 2012proposing a total increase in tax of $254 million , subject to interest, related to a foreign tax credit matter. The Company contested these deficiencies by filing petitions with theU.S. Tax Court. During the three months ended August 31, 2016, the Company reached a resolution with the IRS on this matter. Decisions were subsequently filed in U.S.District Tax Court stating there is no deficiency in income tax due from the Company. The Company has now resolved all U.S. federal income tax matters through fiscal 2012.
T he Company’s major foreign jurisdictions, China and the Netherlands, have concluded substantially all income tax matters through calendar 2005 and fiscal 2010,respectively. Although the timing of resolution of audits is not certain, the Company evaluates all domestic and foreign audit issues in the aggregate, along with the expirationof applicable statutes of limitations, and estimates that it is reasonably possible the total gross unrecognized tax benefits could decrease by up to $170 million within the next12 months.
Note 7 — Common Stock and Stock-Based CompensationThe authorized number of shares of Class A Common Stock, no par value, and Class B Common Stock, no par value, are 400 million and 2,400 million , respectively. Eachshare of Class A Common Stock is convertible into one share of Class B Common Stock. Voting rights of Class B Common Stock are limited in certain circumstances withrespect to the election of directors. There are no differences in the dividend and liquidation preferences or participation rights of the holders of Class A and Class B CommonStock.
The NIKE, Inc. Stock Incentive Plan (the “Stock Incentive Plan”) provides for the issuance of up to 718 million previously unissued shares of Class B Common Stock inconnection with stock options and other awards granted under the Stock Incentive Plan. The Stock Incentive Plan authorizes the grant of non-statutory stock options, incentivestock options, stock appreciation rights, restricted stock, restricted stock units and performance-based awards. The exercise price for stock options and stock appreciationrights may not be less than the fair market value of the underlying shares on the date of grant. A committee of the Board of Directors administers the Stock Incentive Plan. Thecommittee has the authority to determine the employees to whom awards will be made, the amount of the awards and the other terms and conditions of the awards.Substantially all stock option grants outstanding under the Stock Incentive Plan are granted in the first quarter of each fiscal year, vest ratably over four years and expire tenyears from the date of grant.
In addition to the Stock Incentive Plan, the Company gives employees the right to purchase shares at a discount to the market price under employee stock purchase plans(ESPPs). Employees are eligible to participate through payroll deductions of up to 10% of their compensation. At the end of each six month offering period, shares arepurchased by the participants at 85% of the lower of the fair market value at the beginning or the end of the offering period.
The Company accounts for stock-based compensation by estimating the fair value of options granted under the Stock Incentive Plan and employees’ purchase rights under theESPPs using the Black-Scholes option pricing model. The Company recognizes this fair value as Operating overhead expense over the vesting period using the straight-linemethod.
The following table summarizes the Company’s total stock-based compensation expense recognized in Operating overhead expense :
Three Months Ended November 30, Six Months Ended November 30,
(In millions) 2016 2015 2016 2015
Stock options (1) $ 36 $ 45 $ 75 $ 84
ESPPs 11 8 20 15
Restricted stock 7 9 16 17
TOTAL STOCK-BASED COMPENSATION EXPENSE $ 54 $ 62 $ 111 $ 116(1) Expense for stock options includes the expense associated with stock appreciation rights. Accelerated stock option expense is recorded for employees eligible for
accelerated stock option vesting upon retirement. Accelerated stock option expense was $3 million and $8 million for the three months ended November 30, 2016 and2015 , respectively, and $8 million and $14 million for the six months ended November 30, 2016 and 2015 , respectively.
As of November 30, 2016 , the Company had $271 million of unrecognized compensation costs from stock options, net of estimated forfeitures, to be recognized in Operatingoverhead expense over a weighted average remaining period of 2.4 years.
The weighted average fair value per share of the options granted during the six months ended November 30, 2016 and 2015 , computed as of the grant date using the Black-Scholes pricing model, was $9.38 and $12.67 , respectively. The weighted average assumptions used to estimate these fair values were as follows:
Six Months Ended November 30, 2016 2015
Dividend yield 1.1% 1.0%
Expected volatility 17.4% 23.6%
Weighted average expected life (in years) 6.0 5.8
Risk-free interest rate 1.3% 1.7%
The Company estimates the expected volatility based on the implied volatility in market traded options on the Company’s common stock with a term greater than one year,along with other factors. The weighted average expected life of options is based on an analysis of historical and expected future exercise patterns. The interest rate is basedon the U.S. Treasury (constant maturity) risk-free rate in effect at the date of grant for periods corresponding with the expected term of the options.
13
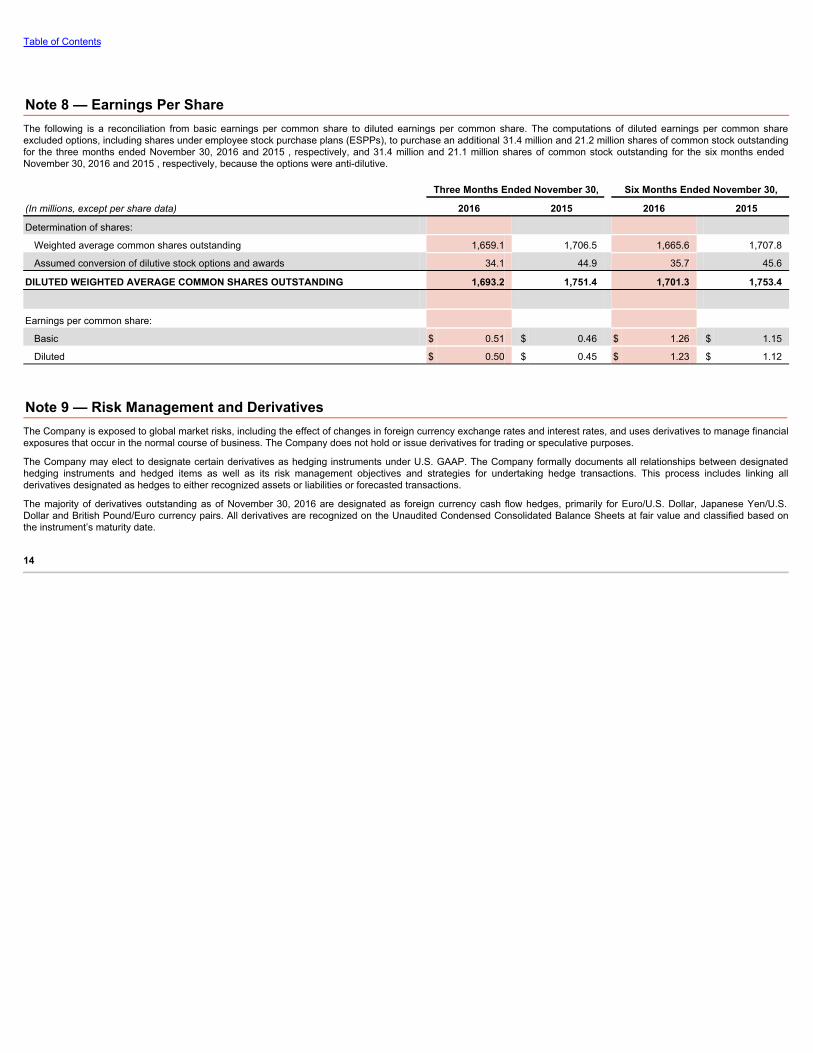
Table of Contents
Note 8 — Earnings Per ShareThe following is a reconciliation from basic earnings per common share to diluted earnings per common share. The computations of diluted earnings per common shareexcluded options, including shares under employee stock purchase plans (ESPPs), to purchase an additional 31.4 million and 21.2 million shares of common stock outstandingfor the three months ended November 30, 2016 and 2015 , respectively, and 31.4 million and 21.1 million shares of common stock outstanding for the six months endedNovember 30, 2016 and 2015 , respectively, because the options were anti-dilutive.
Three Months Ended November 30, Six Months Ended November 30,
(In millions, except per share data) 2016 2015 2016 2015
Determination of shares:
Weighted average common shares outstanding 1,659.1 1,706.5 1,665.6 1,707.8
Assumed conversion of dilutive stock options and awards 34.1 44.9 35.7 45.6
DILUTED WEIGHTED AVERAGE COMMON SHARES OUTSTANDING 1,693.2 1,751.4 1,701.3 1,753.4
Earnings per common share:
Basic $ 0.51 $ 0.46 $ 1.26 $ 1.15
Diluted $ 0.50 $ 0.45 $ 1.23 $ 1.12
Note 9 — Risk Management and DerivativesThe Company is exposed to global market risks, including the effect of changes in foreign currency exchange rates and interest rates, and uses derivatives to manage financialexposures that occur in the normal course of business. The Company does not hold or issue derivatives for trading or speculative purposes.
The Company may elect to designate certain derivatives as hedging instruments under U.S. GAAP. The Company formally documents all relationships between designatedhedging instruments and hedged items as well as its risk management objectives and strategies for undertaking hedge transactions. This process includes linking allderivatives designated as hedges to either recognized assets or liabilities or forecasted transactions.
The majority of derivatives outstanding as of November 30, 2016 are designated as foreign currency cash flow hedges, primarily for Euro/U.S. Dollar, Japanese Yen/U.S.Dollar and British Pound/Euro currency pairs. All derivatives are recognized on the Unaudited Condensed Consolidated Balance Sheets at fair value and classified based onthe instrument’s maturity date.
14

Table of Contents
The following table presents the fair values of derivative instruments included within the Unaudited Condensed Consolidated Balance Sheets as of November 30, 2016 andMay 31, 2016 :
Derivative Assets Derivative Liabilities
(In millions) Balance Sheet
Location November 30,
2016 May 31,
2016 Balance Sheet
Location November 30,
2016 May 31,
2016Derivatives formallydesignated as hedginginstruments:
Foreign exchangeforwards and options
Prepaid expenses andother current assets $ 490 $ 447 Accrued liabilities $ 26 $ 38
Interest rate swaps Prepaid expenses and
other current assets — 7 Accrued liabilities — 45
Foreign exchangeforwards and options
Deferred incometaxes and other
assets 165
90
Deferred income taxes
and other liabilities 3
12
Total derivatives formallydesignated as hedginginstruments
655
544
29
95
Derivatives not designatedas hedging instruments:
Foreign exchangeforwards and options
Prepaid expenses andother current assets 167 40 Accrued liabilities 60 76
Embedded derivatives Prepaid expenses and
other current assets 4 2 Accrued liabilities 2 2
Foreign exchangeforwards and options
Deferred incometaxes and other
assets 22
26
Deferred income taxes
and other liabilities 3
19
Embedded derivatives
Deferred incometaxes and other
assets 6
5
Deferred income taxes
and other liabilities 7
7
Total derivatives notdesignated as hedginginstruments
199
73
72
104
TOTAL DERIVATIVES $ 854 $ 617 $ 101 $ 199
The following tables present the amounts affecting the Unaudited Condensed Consolidated Statements of Income for the three and six months ended November 30, 2016 and2015 :
(In millions)
Amount of Gain (Loss)Recognized in Other
Comprehensive Income onDerivatives (1)
Amount of Gain (Loss) Reclassified From Accumulated Other ComprehensiveIncome into Income (1)
Three Months Ended November30, Location of Gain (Loss)
Reclassified From Accumulated OtherComprehensive Income into Income
Three Months Ended
November 30,
2016 2015 2016 2015
Derivatives designated as cash flow hedges: Foreign exchange forwards and options $ (13) $ (39) Revenues $ 39 $ (29)
Foreign exchange forwards and options 302 309 Cost of sales 69 125
Foreign exchange forwards and options 2 — Total selling and administrative expense — —
Foreign exchange forwards and options 160 187 Other (income) expense, net 31 39
Interest rate swaps 37 (50) Interest expense (income), net — —
Total designated cash flow hedges $ 488 $ 407 $ 139 $ 135(1) For the three months ended November 30, 2016 and 2015 , the amounts recorded in Other (income) expense, net as a result of hedge ineffectiveness and the
discontinuance of cash flow hedges because the forecasted transactions were no longer probable of occurring were immaterial.
15

Table of Contents
(In millions)
Amount of Gain (Loss)Recognized in Other
Comprehensive Income onDerivatives (1)
Amount of Gain (Loss) Reclassified From Accumulated Other ComprehensiveIncome into Income (1)
Six Months Ended November 30, Location of Gain (Loss)Reclassified From Accumulated OtherComprehensive Income into Income
Six Months Ended November
30,
2016 2015 2016 2015Derivatives designated as cash flow hedges:
Foreign exchange forwards and options $ 40 $ (10) Revenues $ 72 $ (75)Foreign exchange forwards and options 250 205 Cost of sales 173 298Foreign exchange forwards and options 2 — Total selling and administrative expense — —Foreign exchange forwards and options 144 122 Other (income) expense, net 74 100Interest rate swaps (54) (50) Interest expense (income), net — —
Total designated cash flow hedges $ 382 $ 267 $ 319 $ 323(1) For the six months ended November 30, 2016 and 2015 , the amounts recorded in Other (income) expense, net as a result of hedge ineffectiveness and the
discontinuance of cash flow hedges because the forecasted transactions were no longer probable of occurring were immaterial.
Amount of Gain (Loss) Recognized in Income on Derivatives
Location of Gain (Loss) Recognized in Income on Derivatives
Three Months Ended November
30, Six Months Ended November
30,
(In millions) 2016 2015 2016 2015
Derivatives designated as fair value hedges:
Interest rate swaps (1) $ — $ 1 $ — $ 2 Interest expense (income), net
Derivatives not designated as hedging instruments:
Foreign exchange forwards and options 202 63 167 34 Other (income) expense, net
Embedded derivatives 2 — (1) — Other (income) expense, net
(1) All interest rate swaps designated as fair value hedges meet the shortcut method requirements under U.S. GAAP. Accordingly, changes in the fair values of the interestrate swaps are considered to exactly offset changes in the fair value of the underlying long-term debt. Refer to “Fair Value Hedges” in this note for additional detail.
Refer to Note 3 — Accrued Liabilities for derivative instruments recorded in Accrued liabilities , Note 4 — Fair Value Measurements for a description of how the above financialinstruments are valued and Note 10 — Accumulated Other Comprehensive Income for additional information on changes in Accumulated other comprehensive income for thethree and six months ended November 30, 2016 and 2015 .
Cash Flow HedgesThe purpose of the Company's foreign exchange risk management program is to lessen both the positive and negative effects of currency fluctuations on the Company'sconsolidated results of operations, financial position and cash flows. Foreign currency exposures that the Company may elect to hedge in this manner include product costexposures, non-functional currency denominated external and intercompany revenues, selling and administrative expenses, investments in U.S. Dollar-denominated available-for-sale debt securities and certain other intercompany transactions.
Product cost exposures are primarily generated through non-functional currency denominated product purchases and the foreign currency adjustment program describedbelow. NIKE entities primarily purchase product in two ways: (1) Certain NIKE entities purchase product from the NIKE Trading Company (NTC), a wholly-owned sourcing hubthat buys NIKE branded product from third-party factories, predominantly in U.S. Dollars. The NTC, whose functional currency is the U.S. Dollar, then sells the product to NIKEentities in their respective functional currencies. When the NTC sells to a NIKE entity with a different functional currency, the result is a foreign currency exposure for the NTC.(2) Other NIKE entities purchase product directly from third-party factories in U.S. Dollars. These purchases generate a foreign currency exposure for those NIKE entities witha functional currency other than the U.S. Dollar.
The Company operates a foreign currency adjustment program with certain factories. The program is designed to more effectively manage foreign currency risk by assumingcertain of the factories’ foreign currency exposures, some of which are natural offsets to the Company's existing foreign currency exposures. Under this program, theCompany’s payments to these factories are adjusted for rate fluctuations in the basket of currencies (“factory currency exposure index”) in which the labor, materials andoverhead costs incurred by the factories in the production of NIKE branded products (“factory input costs”) are denominated. For the portion of the indices denominated in thelocal or functional currency of the factory, the Company may elect to enter into derivative contracts formally designated as cash flow hedges. For all currencies within theindices, excluding the U.S. Dollar and the local or functional currency of the factory, an embedded derivative contract is created upon the factory’s acceptance of NIKE’spurchase order. Embedded derivative contracts are separated from the related purchase order, as further described within the Embedded Derivatives section below.
The Company’s policy permits the utilization of derivatives to reduce its foreign currency exposures where internal netting or other strategies cannot be effectively employed.Typically, the Company may enter into hedge contracts starting up to 12 to 24 months in advance of the forecasted transaction and may place incremental hedges up to 100%of the exposure by the time the forecasted transaction occurs. The total notional amount of outstanding foreign currency derivatives designated as cash flow hedges was $10.2billion as of November 30, 2016 .
16

Table of Contents
During the three months ended November 30, 2016 , the Company terminated all forward-starting interest rate swap agreements with a total notional amount of $1.5 billion inconnection with the October 21, 2016 debt issuance (refer to Note 5 — Long-Term Debt ). Upon termination of these forward-starting swaps, the Company made cashpayments to the related counterparties of $92 million , which was recorded in Accumulated other comprehensive income and will be released through Interest expense(income), net as interest expense is incurred over the term of the issued debt.
All changes in fair value of derivatives designated as cash flow hedges, excluding any ineffective portion, are recorded in Accumulated other comprehensive income until Netincome is affected by the variability of cash flows of the hedged transaction. In most cases, amounts recorded in Accumulated other comprehensive income will be released toNet income in periods following the maturity of the related derivative, rather than at maturity. Effective hedge results are classified within the Unaudited CondensedConsolidated Statements of Income in the same manner as the underlying exposure. The results of hedges of non-functional currency denominated revenues and product costexposures, excluding embedded derivatives, are recorded in Revenues or Cost of sales when the underlying hedged transaction affects consolidated Net income. Results ofhedges of selling and administrative expense are recorded together with those costs when the related expense is recorded. Amounts recorded in Accumulated othercomprehensive income related to forward-starting interest rate swaps will be released through Interest expense (income), net as interest expense is incurred over the term ofthe issued debt. Results of hedges of anticipated purchases of U.S. Dollar-denominated available-for-sale securities are recorded in Other (income) expense, net when thesecurities are sold. Results of hedges of certain anticipated intercompany transactions are recorded in Other (income) expense, net when the transaction occurs. TheCompany classifies the cash flows at settlement from these designated cash flow hedge derivatives in the same category as the cash flows from the related hedged items,primarily within the Cash provided by operations component of the Unaudited Condensed Consolidated Statements of Cash Flows.
Premiums paid or received on options are initially recorded as deferred charges or deferred credits, respectively. The Company assesses the effectiveness of options based onthe total cash flows method and records total changes in the options’ fair value to Accumulated other comprehensive income to the degree they are effective.
The Company formally assesses, both at a hedge’s inception and on an ongoing basis, whether the derivatives that are used in the hedging transaction have been highlyeffective in offsetting changes in the cash flows of hedged items and whether those derivatives may be expected to remain highly effective in future periods. Effectiveness forcash flow hedges is assessed based on changes in forward rates. Ineffectiveness was immaterial for the three and six months ended November 30, 2016 and 2015 .
The Company discontinues hedge accounting prospectively when: (1) it determines that the derivative is no longer highly effective in offsetting changes in the cash flows of ahedged item (including hedged items such as firm commitments or forecasted transactions); (2) the derivative expires or is sold, terminated or exercised; (3) it is no longerprobable that the forecasted transaction will occur; or (4) management determines that designating the derivative as a hedging instrument is no longer appropriate.
When the Company discontinues hedge accounting because it is no longer probable that the forecasted transaction will occur in the originally expected period, but is expectedto occur within an additional two-month period of time thereafter, the gain or loss on the derivative remains in Accumulated other comprehensive income and is reclassified toNet income when the forecasted transaction affects consolidated Net income . However, if it is probable that a forecasted transaction will not occur by the end of the originallyspecified time period or within an additional two-month period of time thereafter, the gains and losses that were in Accumulated other comprehensive income will be recognizedimmediately in Other (income) expense, net . In all situations in which hedge accounting is discontinued and the derivative remains outstanding, the Company will carry thederivative at its fair value on the Unaudited Condensed Consolidated Balance Sheets, recognizing future changes in the fair value in Other (income) expense, net . For thethree and six months ended November 30, 2016 and 2015 , the amounts recorded in Other (income) expense, net as a result of the discontinuance of cash flow hedgingbecause the forecasted transactions were no longer probable of occurring were immaterial .
As of November 30, 2016 , $454 million of deferred net gains (net of tax) on both outstanding and matured derivatives in Accumulated other comprehensive income wereexpected to be reclassified to Net income during the next 12 months concurrent with the underlying hedged transactions also being recorded in Net income . Actual amountsultimately reclassified to Net income are dependent on the exchange rates in effect when derivative contracts that are currently outstanding mature. As of November 30, 2016 ,the maximum term over which the Company was hedging exposures to the variability of cash flows for its forecasted transactions was 24 months.
Fair Value HedgesThe Company has, in the past, been exposed to the risk of changes in the fair value of certain fixed-rate debt attributable to changes in interest rates. Derivatives used by theCompany to hedge this risk are receive-fixed, pay-variable interest rate swaps. All interest rate swaps designated as fair value hedges of the related long-term debt meet theshortcut method requirements under U.S. GAAP. Accordingly, changes in the fair values of the interest rate swaps are considered to exactly offset changes in the fair value ofthe underlying long-term debt. The cash flows associated with the Company’s fair value hedges are periodic interest payments while the swaps are outstanding, which arereflected within the Cash provided by operations component of the Unaudited Condensed Consolidated Statements of Cash Flows. The Company recorded no ineffectivenessfrom its interest rate swaps designated as fair value hedges for the three and six months ended November 30, 2016 or 2015 . On October 15, 2015, the Company repaid thelong-term debt which had previously been hedged with these interest rate swaps. Accordingly, as of November 30, 2016 , the Company had no interest rate swaps designatedas fair value hedges.
Net Investment HedgesThe Company has, in the past, hedged and may, in the future, hedge the risk of variability in foreign-currency-denominated net investments in wholly-owned internationaloperations. All changes in fair value of the derivatives designated as net investment hedges, except ineffective portions, are reported in Accumulated other comprehensiveincome along with the foreign currency translation adjustments on those investments. The Company classifies the cash flows at settlement of its net investment hedges withinthe Cash provided (used) by investing activities component of the Unaudited Condensed Consolidated Statements of Cash Flows. The Company assesses hedgeeffectiveness based on changes in forward rates. The Company recorded no ineffectiveness from its net investment hedges for the three and six months ended November 30,2016 or 2015 . The Company had no outstanding net investment hedges as of November 30, 2016 .
17

Table of Contents
Undesignated Derivative InstrumentsThe Company may elect to enter into foreign exchange forwards to mitigate the change in fair value of specific assets and liabilities on the Unaudited Condensed ConsolidatedBalance Sheets and/or embedded derivative contracts. These forwards are not designated as hedging instruments under U.S. GAAP. Accordingly, these undesignatedinstruments are recorded at fair value as a derivative asset or liability on the Unaudited Condensed Consolidated Balance Sheets with their corresponding change in fair valuerecognized in Other (income) expense, net , together with the re-measurement gain or loss from the hedged balance sheet position or embedded derivative contract. TheCompany classifies the cash flows at settlement from undesignated instruments in the same category as the cash flows from the related hedged items, generally within theCash provided by operations component of the Unaudited Condensed Consolidated Statements of Cash Flows. The total notional amount of outstanding undesignatedderivative instruments was $7.2 billion as of November 30, 2016 .
Embedded DerivativesAs part of the foreign currency adjustment program described above, an embedded derivative contract is created upon the factory’s acceptance of NIKE’s purchase order forcurrencies within the factory currency exposure indices that are neither the U.S. Dollar nor the local or functional currency of the factory. Embedded derivative contracts aretreated as foreign currency forward contracts that are bifurcated from the related purchase order and recorded at fair value as a derivative asset or liability on the UnauditedCondensed Consolidated Balance Sheets with their corresponding change in fair value recognized in Other (income) expense, net from the date a purchase order is acceptedby a factory through the date the purchase price is no longer subject to foreign currency fluctuations.
In addition, the Company has entered into certain other contractual agreements which have payments that are indexed to currencies that are not the functional currency ofeither substantial party to the contracts. These payment terms expose NIKE to variability in foreign exchange rates and create embedded derivative contracts that must bebifurcated from the related contract and recorded at fair value as derivative assets or liabilities on the Unaudited Condensed Consolidated Balance Sheets with theircorresponding changes in fair value recognized in Other (income) expense, net until each payment is settled.
At November 30, 2016 , the total notional amount of embedded derivatives outstanding was approximately $248 million .
Credit RiskThe Company is exposed to credit-related losses in the event of nonperformance by counterparties to hedging instruments. The counterparties to all derivative transactions aremajor financial institutions with investment grade credit ratings. However, this does not eliminate the Company’s exposure to credit risk with these institutions. This credit risk islimited to the unrealized gains in such contracts should any of these counterparties fail to perform as contracted. To manage this risk, the Company has established strictcounterparty credit guidelines that are continually monitored.
The Company’s derivative contracts contain credit risk-related contingent features designed to protect against significant deterioration in counterparties’ creditworthiness andtheir ultimate ability to settle outstanding derivative contracts in the normal course of business. The Company’s bilateral credit-related contingent features generally require theowing entity, either the Company or the derivative counterparty, to post collateral for the portion of the fair value in excess of $50 million should the fair value of outstandingderivatives per counterparty be greater than $50 million . Additionally, a certain level of decline in credit rating of either the Company or the counterparty could also triggercollateral requirements. As of November 30, 2016 , the Company was in compliance with all credit risk-related contingent features and derivative instruments with credit risk-related contingent features in a net liability position were insignificant. Accordingly, the Company was not required to post any collateral as a result of these contingentfeatures. Further, as of November 30, 2016, the Company had received $369 million of cash collateral from various counterparties to its derivative contracts (refer to Note 4 —Fair Value Measurements ). The Company considers the impact of the risk of counterparty default to be immaterial .
Note 10 — Accumulated Other Comprehensive IncomeThe changes in Accumulated other comprehensive income , net of tax, for the three and six months ended November 30, 2016 were as follows:
(In millions)
Foreign CurrencyTranslation
Adjustment (1) Cash Flow Hedges Net Investment
Hedges (1) Other Total
Balance at August 31, 2016 $ (204) $ 223 $ 115 $ (49) $ 85Other comprehensive gains (losses) beforereclassifications (2) (14) 464 — 5 455Reclassifications to net income of previously deferred(gains) losses (3) — (141) — — (141)
Other comprehensive income (loss) (14) 323 — 5 314
Balance at November 30, 2016 $ (218) $ 546 $ 115 $ (44) $ 399(1) The accumulated foreign currency translation adjustment and net investment hedge gains/losses related to an investment in a foreign subsidiary are reclassified to Net
income upon sale or upon complete or substantially complete liquidation of the respective entity.(2) Net of tax benefit (expense) of $0 million , $(24) million , $0 million , $0 million and $(24) million , respectively.(3) Net of tax (benefit) expense of $0 million , $(2) million , $0 million , $0 million and $(2) million , respectively.
18

Table of Contents
(In millions)
Foreign CurrencyTranslation
Adjustment (1) Cash Flow Hedges Net Investment
Hedges (1) Other Total
Balance at May 31, 2016 $ (207) $ 463 $ 115 $ (53) $ 318Other comprehensive gains (losses) beforereclassifications (2) (11) 404 — 18 411Reclassifications to net income of previously deferred(gains) losses (3) — (321) — (9) (330)
Other comprehensive income (loss) (11) 83 — 9 81
Balance at November 30, 2016 $ (218) $ 546 $ 115 $ (44) $ 399(1) The accumulated foreign currency translation adjustment and net investment hedge gains/losses related to an investment in a foreign subsidiary are reclassified to Net
income upon sale or upon complete or substantially complete liquidation of the respective entity.(2) Net of tax benefit (expense) of $0 million , $22 million , $0 million , $1 million and $23 million , respectively.(3) Net of tax (benefit) expense of $0 million , $(2) million , $0 million , $(1) million and $(3) million , respectively.
The changes in Accumulated other comprehensive income , net of tax, for the three and six months ended November 30, 2015 were as follows:
(In millions)
Foreign CurrencyTranslation
Adjustment (1) Cash Flow
Hedges Net Investment
Hedges (1) Other Total
Balance at August 31, 2015 $ (112) $ 891 $ 115 $ (61) $ 833Other comprehensive gains (losses) beforereclassifications (2) (29) 425 — 11 407Reclassifications to net income of previously deferred(gains) losses (3) — (135) — 2 (133)
Other comprehensive income (loss) (29) 290 — 13 274
Balance at November 30, 2015 $ (141) $ 1,181 $ 115 $ (48) $ 1,107(1) The accumulated foreign currency translation adjustment and net investment hedge gains/losses related to an investment in a foreign subsidiary are reclassified to Net
income upon sale or upon complete or substantially complete liquidation of the respective entity.(2) Net of tax benefit (expense) of $ 0 million , $ 18 million , $ 0 million , $ (2) million and $ 16 million , respectively.(3) Net of tax (benefit) expense of $ 0 million , $ 0 million , $ 0 million , $ 0 million and $ 0 million , respectively.
(In millions)
Foreign CurrencyTranslation
Adjustment (1) Cash Flow
Hedges Net Investment
Hedges (1) Other Total
Balance at May 31, 2015 $ (31) $ 1,220 $ 115 $ (58) $ 1,246Other comprehensive gains (losses) beforereclassifications (2) (110) 283 — 11 184Reclassifications to net income of previously deferred(gains) losses (3) — (322) — (1) (323)
Other comprehensive income (loss) (110) (39) — 10 (139)
Balance at November 30, 2015 $ (141) $ 1,181 $ 115 $ (48) $ 1,107(1) The accumulated foreign currency translation adjustment and net investment hedge gains/losses related to an investment in a foreign subsidiary are reclassified to Net
income upon sale or upon complete or substantially complete liquidation of the respective entity.(2) Net of tax benefit (expense) of $0 million , $16 million , $0 million , $(2) million and $14 million , respectively.(3) Net of tax (benefit) expense of $0 million , $1 million , $0 million , $0 million and $1 million , respectively.
19
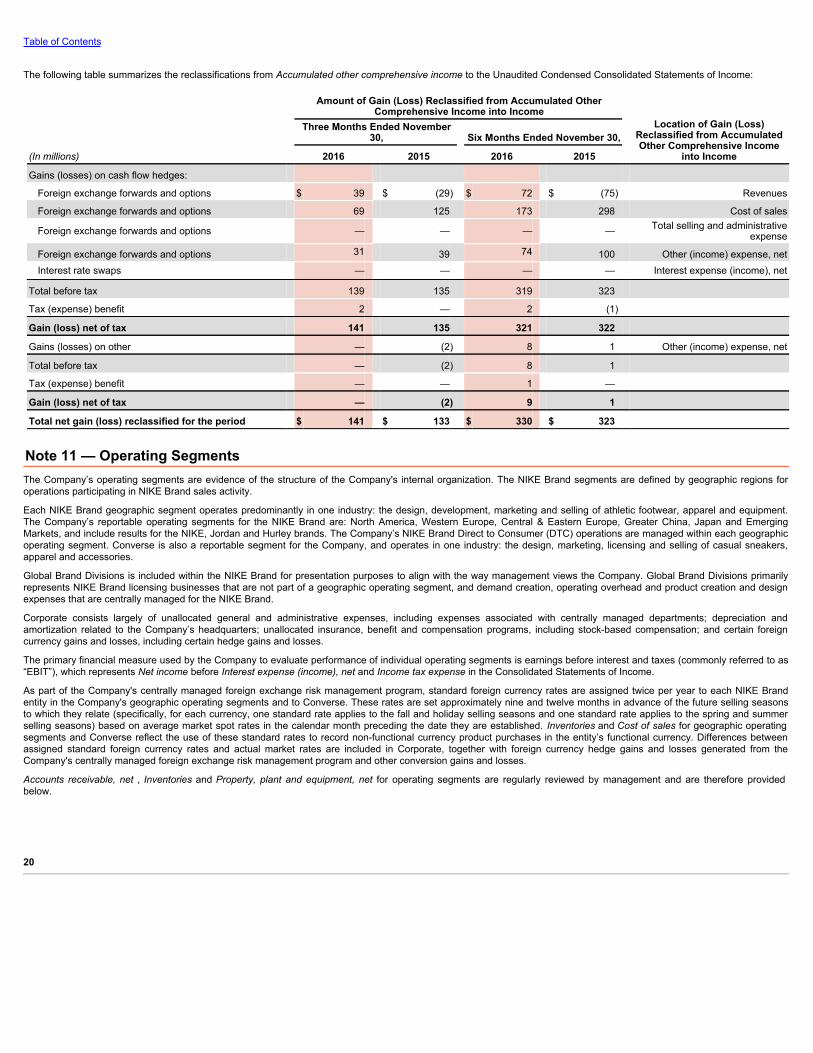
Table of Contents
The following table summarizes the reclassifications from Accumulated other comprehensive income to the Unaudited Condensed Consolidated Statements of Income:
Amount of Gain (Loss) Reclassified from Accumulated Other
Comprehensive Income into Income Location of Gain (Loss)
Reclassified from AccumulatedOther Comprehensive Income
into Income
Three Months Ended November
30, Six Months Ended November 30,
(In millions) 2016 2015 2016 2015
Gains (losses) on cash flow hedges:
Foreign exchange forwards and options $ 39 $ (29) $ 72 $ (75) Revenues
Foreign exchange forwards and options 69 125 173 298 Cost of sales
Foreign exchange forwards and options — — — — Total selling and administrative
expense
Foreign exchange forwards and options 31 39 74 100 Other (income) expense, netInterest rate swaps — — — — Interest expense (income), net
Total before tax 139 135 319 323
Tax (expense) benefit 2 — 2 (1)
Gain (loss) net of tax 141 135 321 322
Gains (losses) on other — (2) 8 1 Other (income) expense, net
Total before tax — (2) 8 1
Tax (expense) benefit — — 1 —
Gain (loss) net of tax — (2) 9 1
Total net gain (loss) reclassified for the period $ 141 $ 133 $ 330 $ 323
Note 11 — Operating SegmentsThe Company’s operating segments are evidence of the structure of the Company's internal organization. The NIKE Brand segments are defined by geographic regions foroperations participating in NIKE Brand sales activity.
Each NIKE Brand geographic segment operates predominantly in one industry: the design, development, marketing and selling of athletic footwear, apparel and equipment.The Company’s reportable operating segments for the NIKE Brand are: North America, Western Europe, Central & Eastern Europe, Greater China, Japan and EmergingMarkets, and include results for the NIKE, Jordan and Hurley brands. The Company’s NIKE Brand Direct to Consumer (DTC) operations are managed within each geographicoperating segment. Converse is also a reportable segment for the Company, and operates in one industry: the design, marketing, licensing and selling of casual sneakers,apparel and accessories.
Global Brand Divisions is included within the NIKE Brand for presentation purposes to align with the way management views the Company. Global Brand Divisions primarilyrepresents NIKE Brand licensing businesses that are not part of a geographic operating segment, and demand creation, operating overhead and product creation and designexpenses that are centrally managed for the NIKE Brand.
Corporate consists largely of unallocated general and administrative expenses, including expenses associated with centrally managed departments; depreciation andamortization related to the Company’s headquarters; unallocated insurance, benefit and compensation programs, including stock-based compensation; and certain foreigncurrency gains and losses, including certain hedge gains and losses.
The primary financial measure used by the Company to evaluate performance of individual operating segments is earnings before interest and taxes (commonly referred to as“EBIT”), which represents Net income before Interest expense (income), net and Income tax expense in the Consolidated Statements of Income.
As part of the Company's centrally managed foreign exchange risk management program, standard foreign currency rates are assigned twice per year to each NIKE Brandentity in the Company's geographic operating segments and to Converse. These rates are set approximately nine and twelve months in advance of the future selling seasonsto which they relate (specifically, for each currency, one standard rate applies to the fall and holiday selling seasons and one standard rate applies to the spring and summerselling seasons) based on average market spot rates in the calendar month preceding the date they are established. Inventories and Cost of sales for geographic operatingsegments and Converse reflect the use of these standard rates to record non-functional currency product purchases in the entity’s functional currency. Differences betweenassigned standard foreign currency rates and actual market rates are included in Corporate, together with foreign currency hedge gains and losses generated from theCompany's centrally managed foreign exchange risk management program and other conversion gains and losses.
Accounts receivable, net , Inventories and Property, plant and equipment, net for operating segments are regularly reviewed by management and are therefore providedbelow.
20

Table of Contents
Three Months Ended November 30, Six Months Ended November 30,
(In millions) 2016 2015 2016 2015
REVENUES
North America $ 3,650 $ 3,547 $ 7,681 $ 7,346
Western Europe 1,385 1,299 3,148 2,940
Central & Eastern Europe 328 326 768 727
Greater China 1,055 938 2,075 1,824
Japan 238 205 483 384
Emerging Markets 1,047 984 1,992 1,950
Global Brand Divisions 21 18 36 44
Total NIKE Brand 7,724 7,317 16,183 15,215
Converse 416 398 990 953
Corporate 40 (29) 68 (68)
TOTAL NIKE, INC. REVENUES $ 8,180 $ 7,686 $ 17,241 $ 16,100
EARNINGS BEFORE INTEREST AND TAXES
North America $ 912 $ 882 $ 1,916 $ 1,924
Western Europe 236 307 628 792
Central & Eastern Europe 58 76 139 174
Greater China 375 327 746 657
Japan 48 47 98 83
Emerging Markets 237 241 408 499
Global Brand Divisions (619) (625) (1,390) (1,249)
Total NIKE Brand 1,247 1,255 2,545 2,880
Converse 78 85 231 232
Corporate (196) (365) (359) (688)
Total NIKE, Inc. Earnings Before Interest and Taxes 1,129 975 2,417 2,424
Interest expense (income), net 15 5 22 9
TOTAL NIKE, INC. INCOME BEFORE INCOME TAXES $ 1,114 $ 970 $ 2,395 $ 2,415
21
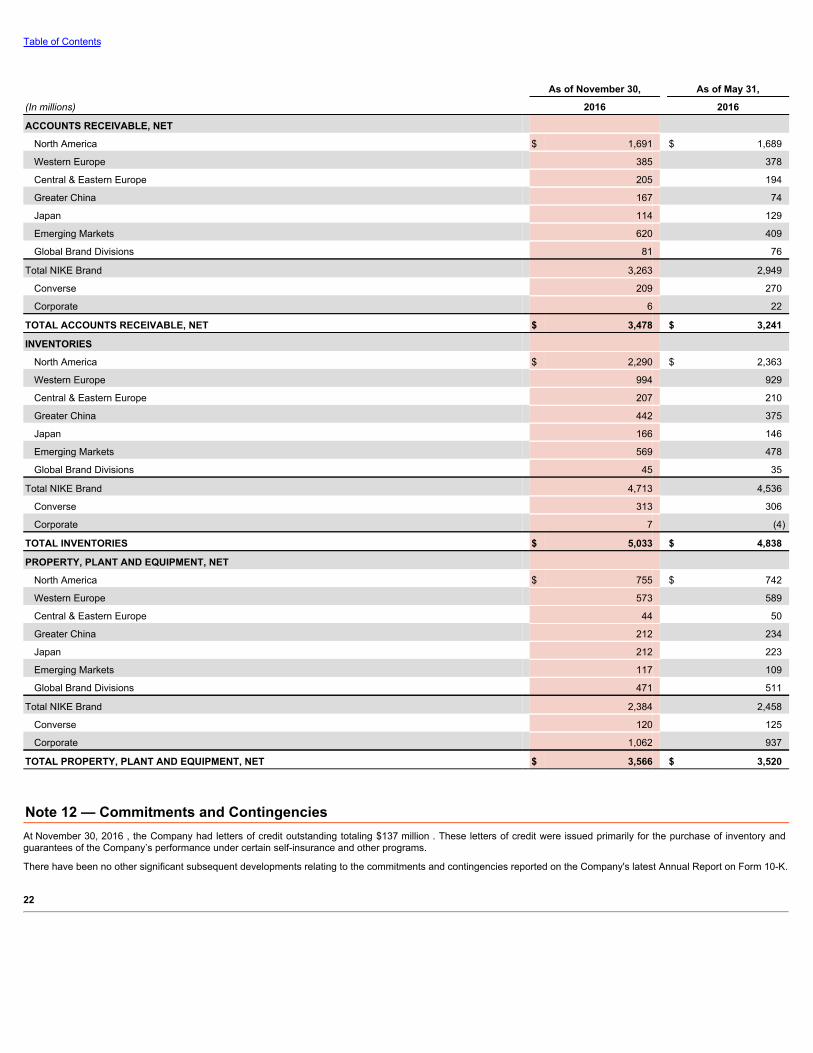
Table of Contents
As of November 30, As of May 31,
(In millions) 2016 2016
ACCOUNTS RECEIVABLE, NET
North America $ 1,691 $ 1,689
Western Europe 385 378
Central & Eastern Europe 205 194
Greater China 167 74
Japan 114 129
Emerging Markets 620 409
Global Brand Divisions 81 76
Total NIKE Brand 3,263 2,949
Converse 209 270
Corporate 6 22
TOTAL ACCOUNTS RECEIVABLE, NET $ 3,478 $ 3,241
INVENTORIES
North America $ 2,290 $ 2,363
Western Europe 994 929
Central & Eastern Europe 207 210
Greater China 442 375
Japan 166 146
Emerging Markets 569 478
Global Brand Divisions 45 35
Total NIKE Brand 4,713 4,536
Converse 313 306
Corporate 7 (4)
TOTAL INVENTORIES $ 5,033 $ 4,838
PROPERTY, PLANT AND EQUIPMENT, NET
North America $ 755 $ 742
Western Europe 573 589
Central & Eastern Europe 44 50
Greater China 212 234
Japan 212 223
Emerging Markets 117 109
Global Brand Divisions 471 511
Total NIKE Brand 2,384 2,458
Converse 120 125
Corporate 1,062 937
TOTAL PROPERTY, PLANT AND EQUIPMENT, NET $ 3,566 $ 3,520
Note 12 — Commitments and ContingenciesAt November 30, 2016 , the Company had letters of credit outstanding totaling $137 million . These letters of credit were issued primarily for the purchase of inventory andguarantees of the Company’s performance under certain self-insurance and other programs.
There have been no other significant subsequent developments relating to the commitments and contingencies reported on the Company's latest Annual Report on Form 10-K.
22

Table of Contents
ITEM 2. Management’s Discussion and Analysis of Financial Conditionand Results of OperationsNIKE, Inc. Revenues for the second quarter of fiscal 2017 increased 6% to $8.2 billion. On a currency-neutral basis, Revenues increased 8%. Net income for the secondquarter of fiscal 2017 was $842 million and diluted earnings per common share was $0.50, 7% and 11% higher, respectively, than the second quarter of fiscal 2016.
Income before income taxes increased 15% compared to the second quarter of fiscal 2016 as revenue growth and a decrease in selling and administrative expense waspartially offset by lower gross margin. The NIKE Brand, which represents over 90% of NIKE, Inc. Revenues , delivered 6% revenue growth. On a currency-neutral basis, NIKEBrand revenues grew 8%, driven by higher revenues across nearly all geographies, all product engines and our Sportswear, Running, Jordan Brand and Men's Trainingcategories. Revenues for Converse increased 5% on both a reported and constant currency basis primarily due to revenue growth in direct distribution markets, most notablythe United States.
Our effective tax rate was 24.4% for the second quarter of fiscal 2017 compared to 19.1% for the second quarter of fiscal 2016. The change was primarily due to an increase inthe mix of earnings from the United States, which are generally subject to a higher tax rate.
Diluted earnings per common share benefited from a 3% decline in the diluted weighted average common shares outstanding, driven by our share repurchase program.
Results of Operations
Three Months Ended November 30, Six Months Ended November 30,
(Dollars in millions, except per share data) 2016 2015 % Change 2016 2015 % Change
Revenues $ 8,180 $ 7,686 6% $ 17,241 $ 16,100 7%
Cost of sales 4,564 4,185 9% 9,502 8,604 10%
Gross profit 3,616 3,501 3% 7,739 7,496 3%
Gross margin % 44.2% 45.6% 44.9% 46.6%
Demand creation expense 762 769 -1% 1,803 1,601 13%
Operating overhead expense 1,743 1,791 -3% 3,599 3,536 2%
Total selling and administrative expense 2,505 2,560 -2% 5,402 5,137 5%
% of Revenues 30.6% 33.3% 31.3% 31.9%
Interest expense (income), net 15 5 — 22 9 —
Other (income) expense, net (18) (34) — (80) (65) —
Income before income taxes 1,114 970 15% 2,395 2,415 -1%
Income tax expense 272 185 47% 304 451 -33%
Effective tax rate 24.4% 19.1% 12.7% 18.7%
NET INCOME $ 842 $ 785 7% $ 2,091 $ 1,964 6%
Diluted earnings per common share $ 0.50 $ 0.45 11% $ 1.23 $ 1.12 10%
23
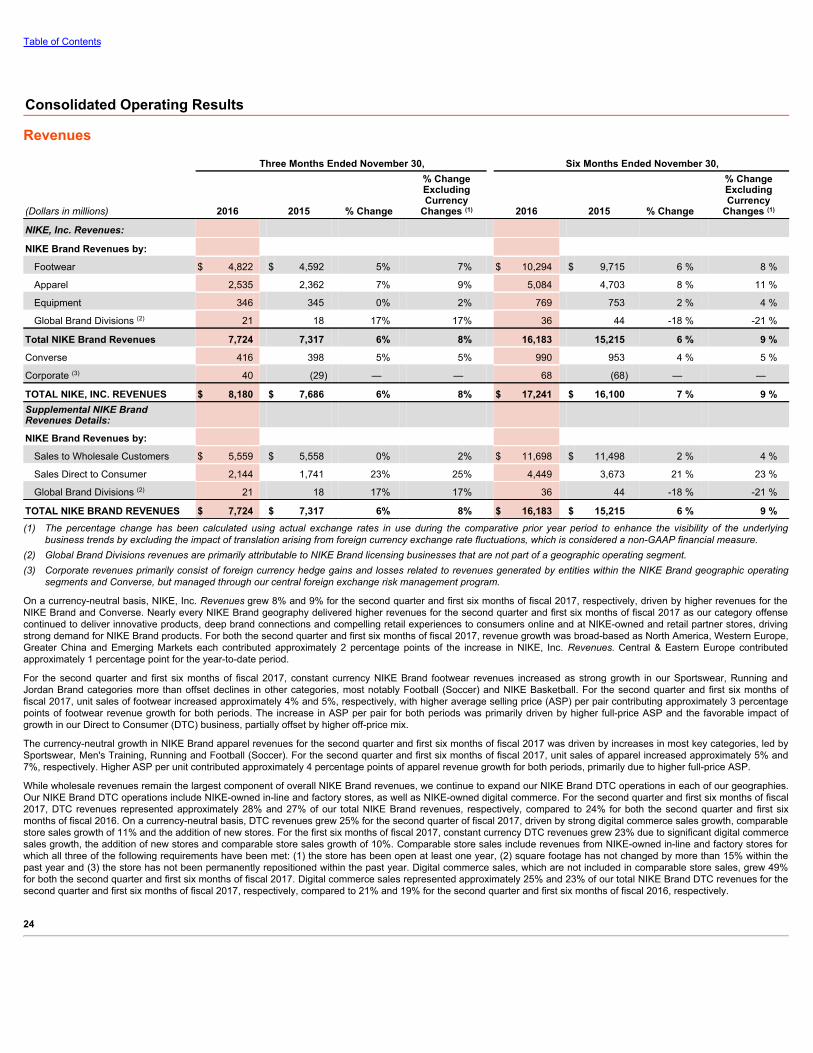
Table of Contents
Consolidated Operating Results
Revenues Three Months Ended November 30, Six Months Ended November 30,
(Dollars in millions) 2016 2015 % Change
% ChangeExcludingCurrency
Changes (1) 2016 2015 % Change
% ChangeExcludingCurrency
Changes (1)
NIKE, Inc. Revenues:
NIKE Brand Revenues by:
Footwear $ 4,822 $ 4,592 5% 7% $ 10,294 $ 9,715 6 % 8 %
Apparel 2,535 2,362 7% 9% 5,084 4,703 8 % 11 %
Equipment 346 345 0% 2% 769 753 2 % 4 %
Global Brand Divisions (2) 21 18 17% 17% 36 44 -18 % -21 %
Total NIKE Brand Revenues 7,724 7,317 6% 8% 16,183 15,215 6 % 9 %
Converse 416 398 5% 5% 990 953 4 % 5 %
Corporate (3) 40 (29) — — 68 (68) — —
TOTAL NIKE, INC. REVENUES $ 8,180 $ 7,686 6% 8% $ 17,241 $ 16,100 7 % 9 %Supplemental NIKE BrandRevenues Details:
NIKE Brand Revenues by:
Sales to Wholesale Customers $ 5,559 $ 5,558 0% 2% $ 11,698 $ 11,498 2 % 4 %
Sales Direct to Consumer 2,144 1,741 23% 25% 4,449 3,673 21 % 23 %
Global Brand Divisions (2) 21 18 17% 17% 36 44 -18 % -21 %
TOTAL NIKE BRAND REVENUES $ 7,724 $ 7,317 6% 8% $ 16,183 $ 15,215 6 % 9 %(1) The percentage change has been calculated using actual exchange rates in use during the comparative prior year period to enhance the visibility of the underlying
business trends by excluding the impact of translation arising from foreign currency exchange rate fluctuations, which is considered a non-GAAP financial measure.(2) Global Brand Divisions revenues are primarily attributable to NIKE Brand licensing businesses that are not part of a geographic operating segment.(3) Corporate revenues primarily consist of foreign currency hedge gains and losses related to revenues generated by entities within the NIKE Brand geographic operating
segments and Converse, but managed through our central foreign exchange risk management program.
On a currency-neutral basis, NIKE, Inc. Revenues grew 8% and 9% for the second quarter and first six months of fiscal 2017, respectively, driven by higher revenues for theNIKE Brand and Converse. Nearly every NIKE Brand geography delivered higher revenues for the second quarter and first six months of fiscal 2017 as our category offensecontinued to deliver innovative products, deep brand connections and compelling retail experiences to consumers online and at NIKE-owned and retail partner stores, drivingstrong demand for NIKE Brand products. For both the second quarter and first six months of fiscal 2017, revenue growth was broad-based as North America, Western Europe,Greater China and Emerging Markets each contributed approximately 2 percentage points of the increase in NIKE, Inc. Revenues. Central & Eastern Europe contributedapproximately 1 percentage point for the year-to-date period.
For the second quarter and first six months of fiscal 2017, constant currency NIKE Brand footwear revenues increased as strong growth in our Sportswear, Running andJordan Brand categories more than offset declines in other categories, most notably Football (Soccer) and NIKE Basketball. For the second quarter and first six months offiscal 2017, unit sales of footwear increased approximately 4% and 5%, respectively, with higher average selling price (ASP) per pair contributing approximately 3 percentagepoints of footwear revenue growth for both periods. The increase in ASP per pair for both periods was primarily driven by higher full-price ASP and the favorable impact ofgrowth in our Direct to Consumer (DTC) business, partially offset by higher off-price mix.
The currency-neutral growth in NIKE Brand apparel revenues for the second quarter and first six months of fiscal 2017 was driven by increases in most key categories, led bySportswear, Men's Training, Running and Football (Soccer). For the second quarter and first six months of fiscal 2017, unit sales of apparel increased approximately 5% and7%, respectively. Higher ASP per unit contributed approximately 4 percentage points of apparel revenue growth for both periods, primarily due to higher full-price ASP.
While wholesale revenues remain the largest component of overall NIKE Brand revenues, we continue to expand our NIKE Brand DTC operations in each of our geographies.Our NIKE Brand DTC operations include NIKE-owned in-line and factory stores, as well as NIKE-owned digital commerce. For the second quarter and first six months of fiscal2017, DTC revenues represented approximately 28% and 27% of our total NIKE Brand revenues, respectively, compared to 24% for both the second quarter and first sixmonths of fiscal 2016. On a currency-neutral basis, DTC revenues grew 25% for the second quarter of fiscal 2017, driven by strong digital commerce sales growth, comparablestore sales growth of 11% and the addition of new stores. For the first six months of fiscal 2017, constant currency DTC revenues grew 23% due to significant digital commercesales growth, the addition of new stores and comparable store sales growth of 10%. Comparable store sales include revenues from NIKE-owned in-line and factory stores forwhich all three of the following requirements have been met: (1) the store has been open at least one year, (2) square footage has not changed by more than 15% within thepast year and (3) the store has not been permanently repositioned within the past year. Digital commerce sales, which are not included in comparable store sales, grew 49%for both the second quarter and first six months of fiscal 2017. Digital commerce sales represented approximately 25% and 23% of our total NIKE Brand DTC revenues for thesecond quarter and first six months of fiscal 2017, respectively, compared to 21% and 19% for the second quarter and first six months of fiscal 2016, respectively.
24
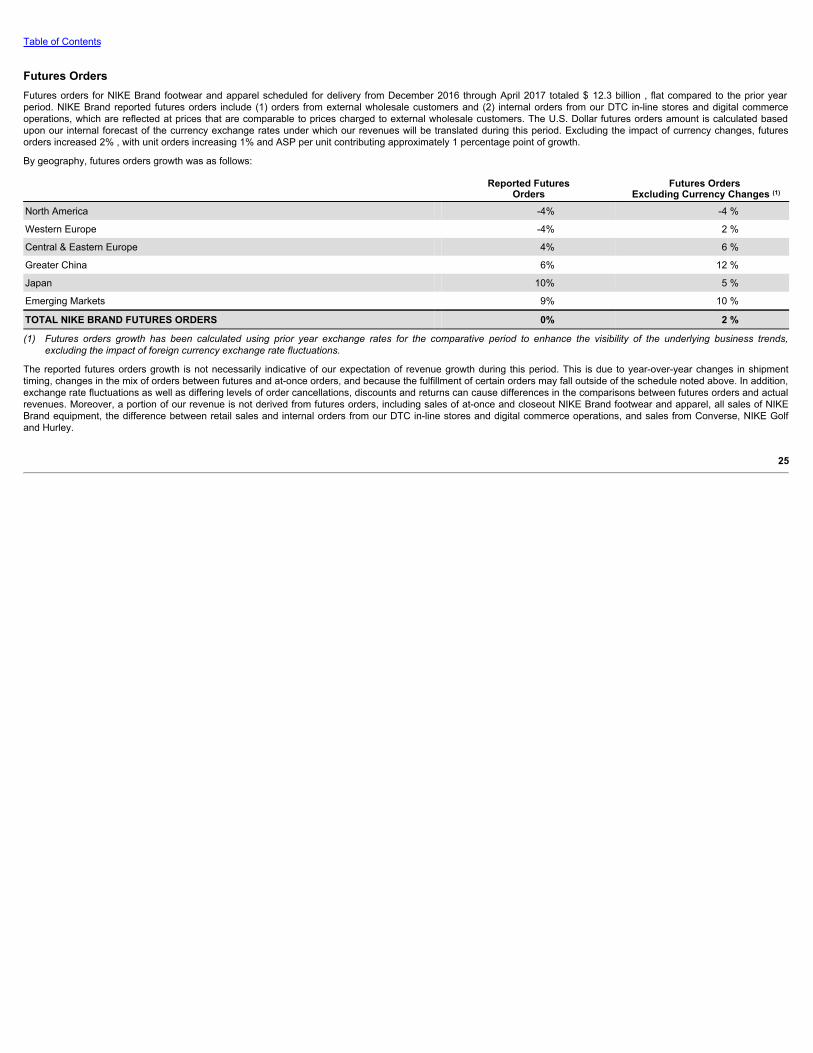
Table of Contents
Futures OrdersFutures orders for NIKE Brand footwear and apparel scheduled for delivery from December 2016 through April 2017 totaled $ 12.3 billion , flat compared to the prior yearperiod. NIKE Brand reported futures orders include (1) orders from external wholesale customers and (2) internal orders from our DTC in-line stores and digital commerceoperations, which are reflected at prices that are comparable to prices charged to external wholesale customers. The U.S. Dollar futures orders amount is calculated basedupon our internal forecast of the currency exchange rates under which our revenues will be translated during this period. Excluding the impact of currency changes, futuresorders increased 2% , with unit orders increasing 1% and ASP per unit contributing approximately 1 percentage point of growth.
By geography, futures orders growth was as follows:
Reported Futures
Orders Futures Orders
Excluding Currency Changes (1)
North America -4% -4 %
Western Europe -4% 2 %
Central & Eastern Europe 4% 6 %
Greater China 6% 12 %
Japan 10% 5 %
Emerging Markets 9% 10 %
TOTAL NIKE BRAND FUTURES ORDERS 0% 2 %
(1) Futures orders growth has been calculated using prior year exchange rates for the comparative period to enhance the visibility of the underlying business trends,excluding the impact of foreign currency exchange rate fluctuations.
The reported futures orders growth is not necessarily indicative of our expectation of revenue growth during this period. This is due to year-over-year changes in shipmenttiming, changes in the mix of orders between futures and at-once orders, and because the fulfillment of certain orders may fall outside of the schedule noted above. In addition,exchange rate fluctuations as well as differing levels of order cancellations, discounts and returns can cause differences in the comparisons between futures orders and actualrevenues. Moreover, a portion of our revenue is not derived from futures orders, including sales of at-once and closeout NIKE Brand footwear and apparel, all sales of NIKEBrand equipment, the difference between retail sales and internal orders from our DTC in-line stores and digital commerce operations, and sales from Converse, NIKE Golfand Hurley.
25

Table of Contents
Gross Margin Three Months Ended November 30, Six Months Ended November 30,
(Dollars in millions) 2016 2015 % Change 2016 2015 % Change
Gross profit $ 3,616 $ 3,501 3% $ 7,739 $ 7,496 3%
Gross margin % 44.2% 45.6% (140) bps 44.9% 46.6% (170) bps
For the second quarter and first six months of fiscal 2017, our consolidated gross margin was 140 and 170 basis points lower than the respective prior year periods, primarilydriven by the following factors:
• Higher NIKE Brand full-price ASP, net of discounts (increasing gross margin approximately 80 basis points for the second quarter and 70 basis points for the first sixmonths) aligned with our strategy to deliver innovative, premium products to the consumer;
• Higher NIKE Brand product costs (decreasing gross margin approximately 80 basis points for the second quarter and 60 basis points for the first six months) as laborinput cost inflation more than offset lower material input costs;
• Unfavorable changes in foreign currency exchange rates, net of hedges (decreasing gross margin approximately 70 basis points for the second quarter and 50 basispoints for the first six months);
• Unfavorable impact of increased off-price sales (decreasing gross margin approximately 30 basis points for both the second quarter and first six months);
• Lower gross margin from Converse for the second quarter (decreasing gross margin approximately 20 basis points) primarily due to the negative impact of lowerlicensing revenues and increased off-price sales; for the first six months, Converse gross margin was lower (decreasing gross margin approximately 20 basis points)primarily due to higher product costs, increased off-price sales and lower licensing revenues; and
• Higher other costs (having an insignificant impact on gross margin for the second quarter and decreasing gross margin approximately 40 basis points for the first sixmonths) primarily driven by investments in sourcing and manufacturing resources as well as warehousing and logistics costs.
Total Selling and Administrative Expense Three Months Ended November 30, Six Months Ended November 30,
(Dollars in millions) 2016 2015 % Change 2016 2015 % Change
Demand creation expense (1) $ 762 $ 769 -1% $ 1,803 $ 1,601 13%
Operating overhead expense 1,743 1,791 -3% 3,599 3,536 2%
Total selling and administrative expense $ 2,505 $ 2,560 -2% $ 5,402 $ 5,137 5%
% of Revenues 30.6% 33.3% (270) bps 31.3% 31.9% (60) bps
(1) Demand creation expense consists of advertising and promotion costs, including costs of endorsement contracts, television, digital and print advertising, brand events andretail brand presentation.
Demand creation expense decreased 1% for the second quarter of fiscal 2017 primarily due to lower advertising and retail brand presentation costs, partially offset by anincrease in marketing support for brand events. For the first six months of fiscal 2017, Demand creation expense increased 13% driven by higher marketing, digital brandmarketing and advertising costs, primarily to support key sporting events, including the Rio Olympics and European Football Championship in the first quarter. Demandcreation expense also increased for the first six months of fiscal 2017 due to higher sports marketing costs. Changes in foreign currency exchange rates reduced Demandcreation expense by approximately 1 percentage point for both the second quarter and first six months of fiscal 2017.
Operating overhead expense decreased 3% for the second quarter of fiscal 2017 as efficiencies in variable compensation and administrative costs more than offset continuedinvestments in our growing DTC business and operational infrastructure. For the first six months of fiscal 2017, O perating overhead expense increased 2% due toinvestments in our DTC business and operational infrastructure, partially offset by efficiencies in administrative costs and variable compensation. Changes in foreign currencyexchange rates reduced Operating overhead expense by approximately 1 percentage point for both the second quarter and first six months of fiscal 2017.
Other (Income) Expense, Net Three Months Ended November 30, Six Months Ended November 30,
(In millions) 2016 2015 2016 2015
Other (income) expense, net $ (18) $ (34) $ (80) $ (65)
Other (income) expense, net comprises foreign currency conversion gains and losses from the re-measurement of monetary assets and liabilities denominated in non-functional currencies and the impact of certain foreign currency derivative instruments, as well as unusual or non-operating transactions that are outside the normal course ofbusiness.
For the second quarter of fiscal 2017, Other (income) expense, net decreased from $34 million of other income, net in the prior year, to $18 million of other income, net in thecurrent year, primarily due to a $7 million detrimental net change in foreign currency conversion gains and losses, as well as other non-operating items .
For the first six months of fiscal 2017, Other (income) expense, net increased from $65 million of other income, net in the prior year, to $80 million of other income, net in thecurrent year, primarily due to a $22 million net beneficial change in foreign currency conversion gains and losses .
26

Table of Contents
We estimate the combination of the translation of foreign currency-denominated profits from our international businesses and the year-over-year change in foreign currencyrelated gains and losses included in Other (income) expense, net had unfavorable impacts of approximately $29 million and $26 million on our Income before income taxes forthe second quarter and first six months of fiscal 2017, respectively.
Income Taxes Three Months Ended November 30, Six Months Ended November 30, 2016 2015 % Change 2016 2015 % Change
Effective tax rate 24.4% 19.1% 530 bps 12.7% 18.7% (600) bps
Our effective tax rate for the second quarter of fiscal 2017 was 24.4%, compared to 19.1% for the second quarter of fiscal 2016. The change was primarily due to an increasein the mix of earnings from the United States, which are generally subject to a higher tax rate.
Our effective tax rate for the first six months of fiscal 2017 was 12.7% compared to 18.7% for the first six months of fiscal 2016. The decrease was primarily due to a one-timebenefit related to the resolution with the U.S. Internal Revenue Service (IRS) of a foreign tax credit matter. We also benefited from a one-time adjustment to our deferred taxasset related to our nonqualified deferred compensation plan.
We continue to expect our effective tax rate for the full fiscal year will be approximately 17.0%.
27

Table of Contents
Operating SegmentsOur operating segments are evidence of the structure of the Company's internal organization. The NIKE Brand segments are defined by geographic regions for operationsparticipating in NIKE Brand sales activity.
Each NIKE Brand geographic segment operates predominantly in one industry: the design, development, marketing and selling of athletic footwear, apparel and equipment.The Company’s reportable operating segments for the NIKE Brand are: North America, Western Europe, Central & Eastern Europe, Greater China, Japan and EmergingMarkets, and include results for the NIKE, Jordan and Hurley brands. The Company’s NIKE Brand DTC operations are managed within each geographic operating segment.Converse is also a reportable segment for the Company and operates in one industry: the design, marketing, licensing and selling of casual sneakers, apparel andaccessories.
As part of our centrally managed foreign exchange risk management program, standard foreign currency rates are assigned twice per year to each NIKE Brand entity in ourgeographic operating segments and Converse. These rates are set approximately nine and twelve months in advance of the future selling seasons to which they relate(specifically, for each currency, one standard rate applies to the fall and holiday selling seasons and one standard rate applies to the spring and summer selling seasons)based on average market spot rates in the calendar month preceding the date they are established. Inventories and Cost of sales for geographic operating segments andConverse reflect the use of these standard rates to record non-functional currency product purchases into the entity’s functional currency. Differences between assignedstandard foreign currency rates and actual market rates are included in Corporate, together with foreign currency hedge gains and losses generated from our centrallymanaged foreign exchange risk management program and other conversion gains and losses.
28
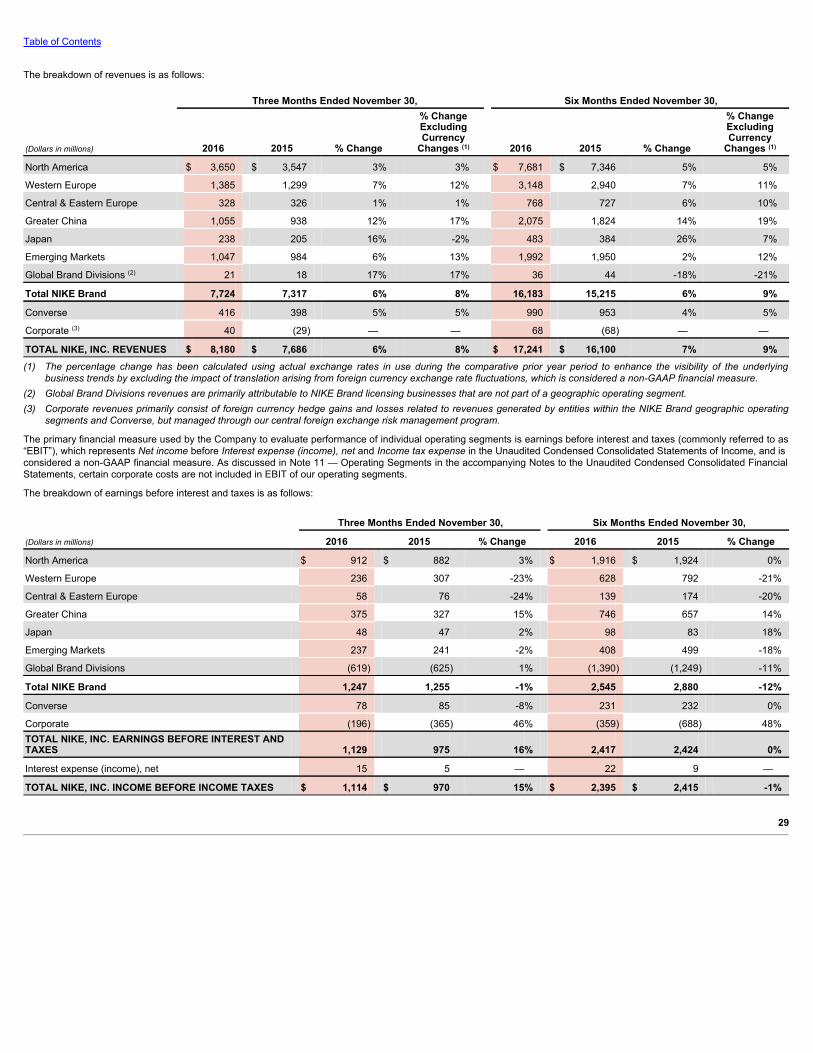
Table of Contents
The breakdown of revenues is as follows:
Three Months Ended November 30, Six Months Ended November 30,
(Dollars in millions) 2016 2015 % Change
% ChangeExcludingCurrency
Changes (1) 2016 2015 % Change
% ChangeExcludingCurrency
Changes (1)
North America $ 3,650 $ 3,547 3% 3% $ 7,681 $ 7,346 5% 5%
Western Europe 1,385 1,299 7% 12% 3,148 2,940 7% 11%
Central & Eastern Europe 328 326 1% 1% 768 727 6% 10%
Greater China 1,055 938 12% 17% 2,075 1,824 14% 19%
Japan 238 205 16% -2% 483 384 26% 7%
Emerging Markets 1,047 984 6% 13% 1,992 1,950 2% 12%
Global Brand Divisions (2) 21 18 17% 17% 36 44 -18% -21%
Total NIKE Brand 7,724 7,317 6% 8% 16,183 15,215 6% 9%
Converse 416 398 5% 5% 990 953 4% 5%
Corporate (3) 40 (29) — — 68 (68) — —
TOTAL NIKE, INC. REVENUES $ 8,180 $ 7,686 6% 8% $ 17,241 $ 16,100 7% 9%(1) The percentage change has been calculated using actual exchange rates in use during the comparative prior year period to enhance the visibility of the underlying
business trends by excluding the impact of translation arising from foreign currency exchange rate fluctuations, which is considered a non-GAAP financial measure.(2) Global Brand Divisions revenues are primarily attributable to NIKE Brand licensing businesses that are not part of a geographic operating segment.(3) Corporate revenues primarily consist of foreign currency hedge gains and losses related to revenues generated by entities within the NIKE Brand geographic operating
segments and Converse, but managed through our central foreign exchange risk management program.
The primary financial measure used by the Company to evaluate performance of individual operating segments is earnings before interest and taxes (commonly referred to as“EBIT”), which represents Net income before Interest expense (income), net and Income tax expense in the Unaudited Condensed Consolidated Statements of Income, and isconsidered a non-GAAP financial measure. As discussed in Note 11 — Operating Segments in the accompanying Notes to the Unaudited Condensed Consolidated FinancialStatements, certain corporate costs are not included in EBIT of our operating segments.
The breakdown of earnings before interest and taxes is as follows:
Three Months Ended November 30, Six Months Ended November 30,
(Dollars in millions) 2016 2015 % Change 2016 2015 % Change
North America $ 912 $ 882 3% $ 1,916 $ 1,924 0%
Western Europe 236 307 -23% 628 792 -21%
Central & Eastern Europe 58 76 -24% 139 174 -20%
Greater China 375 327 15% 746 657 14%
Japan 48 47 2% 98 83 18%
Emerging Markets 237 241 -2% 408 499 -18%
Global Brand Divisions (619) (625) 1% (1,390) (1,249) -11%
Total NIKE Brand 1,247 1,255 -1% 2,545 2,880 -12%
Converse 78 85 -8% 231 232 0%
Corporate (196) (365) 46% (359) (688) 48%TOTAL NIKE, INC. EARNINGS BEFORE INTEREST ANDTAXES 1,129 975 16% 2,417 2,424 0%
Interest expense (income), net 15 5 — 22 9 —
TOTAL NIKE, INC. INCOME BEFORE INCOME TAXES $ 1,114 $ 970 15% $ 2,395 $ 2,415 -1%
29
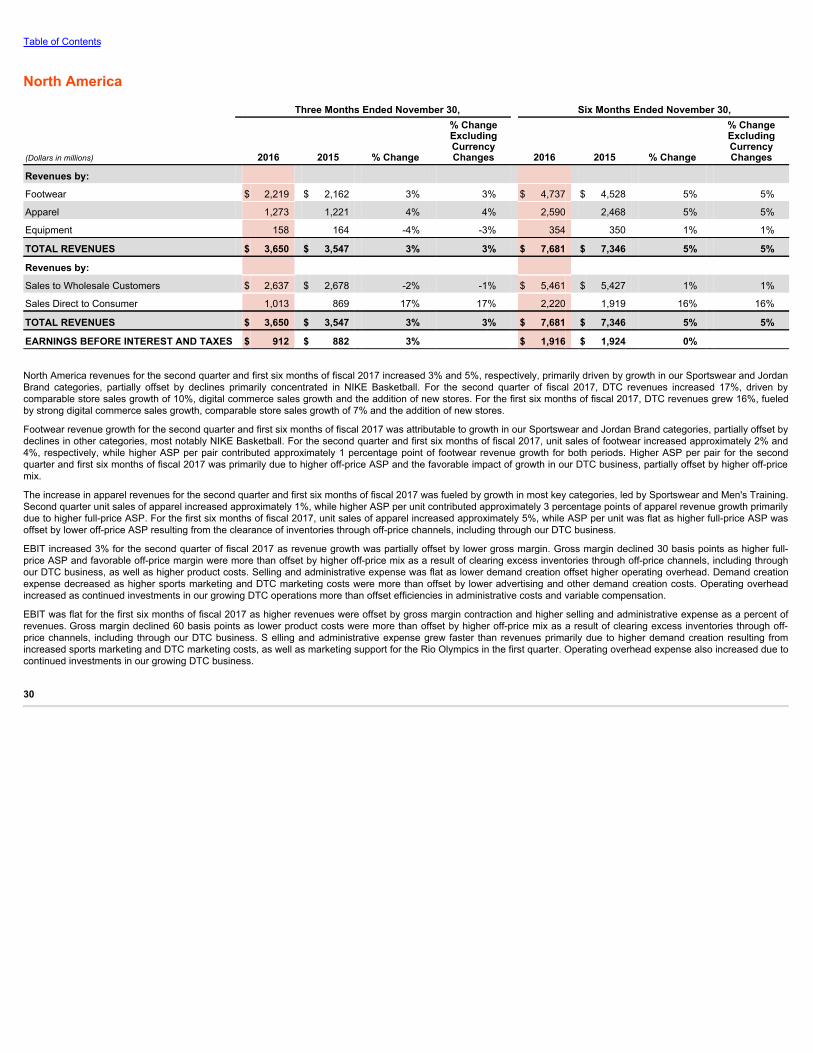
Table of Contents
North America Three Months Ended November 30, Six Months Ended November 30,
(Dollars in millions) 2016 2015 % Change
% ChangeExcludingCurrencyChanges 2016 2015 % Change
% ChangeExcludingCurrencyChanges
Revenues by:
Footwear $ 2,219 $ 2,162 3% 3% $ 4,737 $ 4,528 5% 5%
Apparel 1,273 1,221 4% 4% 2,590 2,468 5% 5%
Equipment 158 164 -4% -3% 354 350 1% 1%
TOTAL REVENUES $ 3,650 $ 3,547 3% 3% $ 7,681 $ 7,346 5% 5%
Revenues by:
Sales to Wholesale Customers $ 2,637 $ 2,678 -2% -1% $ 5,461 $ 5,427 1% 1%
Sales Direct to Consumer 1,013 869 17% 17% 2,220 1,919 16% 16%
TOTAL REVENUES $ 3,650 $ 3,547 3% 3% $ 7,681 $ 7,346 5% 5%
EARNINGS BEFORE INTEREST AND TAXES $ 912 $ 882 3% $ 1,916 $ 1,924 0%
North America revenues for the second quarter and first six months of fiscal 2017 increased 3% and 5%, respectively, primarily driven by growth in our Sportswear and JordanBrand categories, partially offset by declines primarily concentrated in NIKE Basketball. For the second quarter of fiscal 2017, DTC revenues increased 17%, driven bycomparable store sales growth of 10%, digital commerce sales growth and the addition of new stores. For the first six months of fiscal 2017, DTC revenues grew 16%, fueledby strong digital commerce sales growth, comparable store sales growth of 7% and the addition of new stores.
Footwear revenue growth for the second quarter and first six months of fiscal 2017 was attributable to growth in our Sportswear and Jordan Brand categories, partially offset bydeclines in other categories, most notably NIKE Basketball. For the second quarter and first six months of fiscal 2017, unit sales of footwear increased approximately 2% and4%, respectively, while higher ASP per pair contributed approximately 1 percentage point of footwear revenue growth for both periods. Higher ASP per pair for the secondquarter and first six months of fiscal 2017 was primarily due to higher off-price ASP and the favorable impact of growth in our DTC business, partially offset by higher off-pricemix.
The increase in apparel revenues for the second quarter and first six months of fiscal 2017 was fueled by growth in most key categories, led by Sportswear and Men's Training.Second quarter unit sales of apparel increased approximately 1%, while higher ASP per unit contributed approximately 3 percentage points of apparel revenue growth primarilydue to higher full-price ASP. For the first six months of fiscal 2017, unit sales of apparel increased approximately 5%, while ASP per unit was flat as higher full-price ASP wasoffset by lower off-price ASP resulting from the clearance of inventories through off-price channels, including through our DTC business.
EBIT increased 3% for the second quarter of fiscal 2017 as revenue growth was partially offset by lower gross margin. Gross margin declined 30 basis points as higher full-price ASP and favorable off-price margin were more than offset by higher off-price mix as a result of clearing excess inventories through off-price channels, including throughour DTC business, as well as higher product costs. Selling and administrative expense was flat as lower demand creation offset higher operating overhead. Demand creationexpense decreased as higher sports marketing and DTC marketing costs were more than offset by lower advertising and other demand creation costs. Operating overheadincreased as continued investments in our growing DTC operations more than offset efficiencies in administrative costs and variable compensation.
EBIT was flat for the first six months of fiscal 2017 as higher revenues were offset by gross margin contraction and higher selling and administrative expense as a percent ofrevenues. Gross margin declined 60 basis points as lower product costs were more than offset by higher off-price mix as a result of clearing excess inventories through off-price channels, including through our DTC business. S elling and administrative expense grew faster than revenues primarily due to higher demand creation resulting fromincreased sports marketing and DTC marketing costs, as well as marketing support for the Rio Olympics in the first quarter. Operating overhead expense also increased due tocontinued investments in our growing DTC business.
30
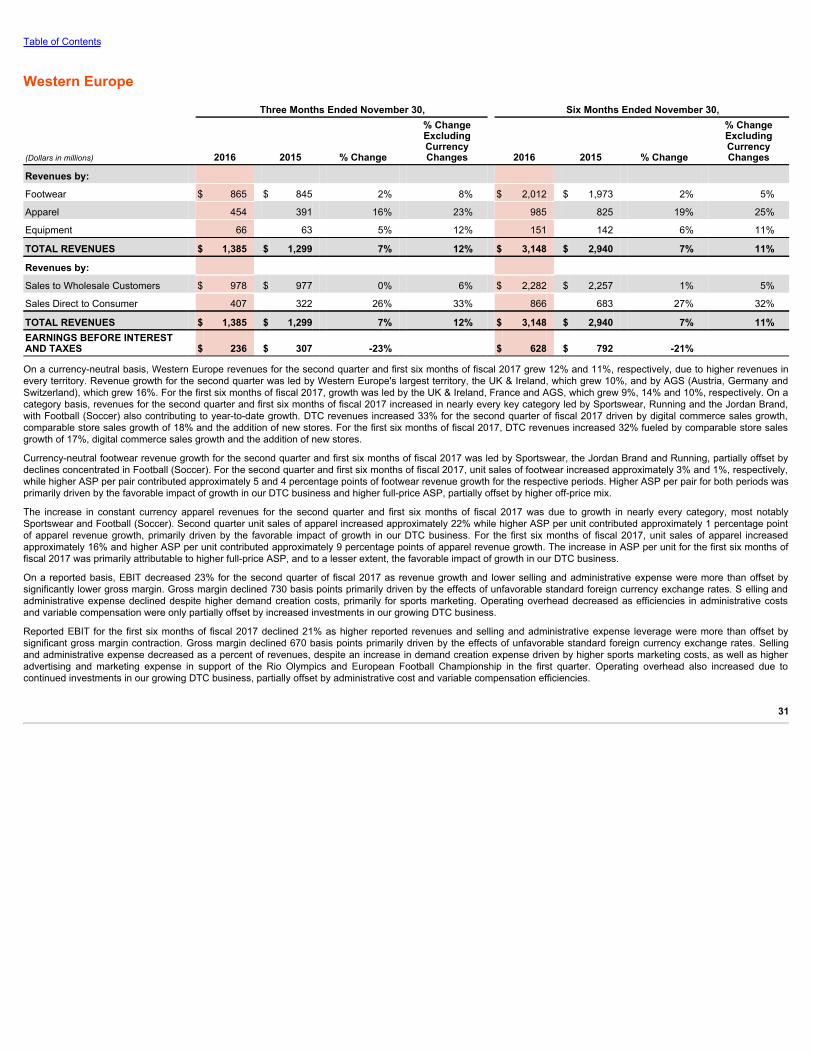
Table of Contents
Western Europe Three Months Ended November 30, Six Months Ended November 30,
(Dollars in millions) 2016 2015 % Change
% ChangeExcludingCurrencyChanges 2016 2015 % Change
% ChangeExcludingCurrencyChanges
Revenues by:
Footwear $ 865 $ 845 2% 8% $ 2,012 $ 1,973 2% 5%
Apparel 454 391 16% 23% 985 825 19% 25%
Equipment 66 63 5% 12% 151 142 6% 11%
TOTAL REVENUES $ 1,385 $ 1,299 7% 12% $ 3,148 $ 2,940 7% 11%
Revenues by:
Sales to Wholesale Customers $ 978 $ 977 0% 6% $ 2,282 $ 2,257 1% 5%
Sales Direct to Consumer 407 322 26% 33% 866 683 27% 32%
TOTAL REVENUES $ 1,385 $ 1,299 7% 12% $ 3,148 $ 2,940 7% 11%EARNINGS BEFORE INTERESTAND TAXES $ 236 $ 307 -23% $ 628 $ 792 -21%
On a currency-neutral basis, Western Europe revenues for the second quarter and first six months of fiscal 2017 grew 12% and 11%, respectively, due to higher revenues inevery territory. Revenue growth for the second quarter was led by Western Europe's largest territory, the UK & Ireland, which grew 10%, and by AGS (Austria, Germany andSwitzerland), which grew 16%. For the first six months of fiscal 2017, growth was led by the UK & Ireland, France and AGS, which grew 9%, 14% and 10%, respectively. On acategory basis, revenues for the second quarter and first six months of fiscal 2017 increased in nearly every key category led by Sportswear, Running and the Jordan Brand,with Football (Soccer) also contributing to year-to-date growth. DTC revenues increased 33% for the second quarter of fiscal 2017 driven by digital commerce sales growth,comparable store sales growth of 18% and the addition of new stores. For the first six months of fiscal 2017, DTC revenues increased 32% fueled by comparable store salesgrowth of 17%, digital commerce sales growth and the addition of new stores.
Currency-neutral footwear revenue growth for the second quarter and first six months of fiscal 2017 was led by Sportswear, the Jordan Brand and Running, partially offset bydeclines concentrated in Football (Soccer). For the second quarter and first six months of fiscal 2017, unit sales of footwear increased approximately 3% and 1%, respectively,while higher ASP per pair contributed approximately 5 and 4 percentage points of footwear revenue growth for the respective periods. Higher ASP per pair for both periods wasprimarily driven by the favorable impact of growth in our DTC business and higher full-price ASP, partially offset by higher off-price mix.
The increase in constant currency apparel revenues for the second quarter and first six months of fiscal 2017 was due to growth in nearly every category, most notablySportswear and Football (Soccer). Second quarter unit sales of apparel increased approximately 22% while higher ASP per unit contributed approximately 1 percentage pointof apparel revenue growth, primarily driven by the favorable impact of growth in our DTC business. For the first six months of fiscal 2017, unit sales of apparel increasedapproximately 16% and higher ASP per unit contributed approximately 9 percentage points of apparel revenue growth. The increase in ASP per unit for the first six months offiscal 2017 was primarily attributable to higher full-price ASP, and to a lesser extent, the favorable impact of growth in our DTC business.
On a reported basis, EBIT decreased 23% for the second quarter of fiscal 2017 as revenue growth and lower selling and administrative expense were more than offset bysignificantly lower gross margin. Gross margin declined 730 basis points primarily driven by the effects of unfavorable standard foreign currency exchange rates. S elling andadministrative expense declined despite higher demand creation costs, primarily for sports marketing. Operating overhead decreased as efficiencies in administrative costsand variable compensation were only partially offset by increased investments in our growing DTC business.
Reported EBIT for the first six months of fiscal 2017 declined 21% as higher reported revenues and selling and administrative expense leverage were more than offset bysignificant gross margin contraction. Gross margin declined 670 basis points primarily driven by the effects of unfavorable standard foreign currency exchange rates. Sellingand administrative expense decreased as a percent of revenues, despite an increase in demand creation expense driven by higher sports marketing costs, as well as higheradvertising and marketing expense in support of the Rio Olympics and European Football Championship in the first quarter. Operating overhead also increased due tocontinued investments in our growing DTC business, partially offset by administrative cost and variable compensation efficiencies.
31

Table of Contents
Central & Eastern Europe Three Months Ended November 30, Six Months Ended November 30,
(Dollars in millions) 2016 2015 % Change
% ChangeExcludingCurrencyChanges 2016 2015 % Change
% ChangeExcludingCurrencyChanges
Revenues by:
Footwear $ 192 $ 183 5% 6% $ 462 $ 421 10% 13%
Apparel 120 126 -5% -4% 258 259 0% 4%
Equipment 16 17 -6% -6% 48 47 2% 6%
TOTAL REVENUES $ 328 $ 326 1% 1% $ 768 $ 727 6% 10%
Revenues by:
Sales to Wholesale Customers $ 266 $ 277 -4% -3% $ 644 $ 627 3% 7%
Sales Direct to Consumer 62 49 27% 26% 124 100 24% 28%
TOTAL REVENUES $ 328 $ 326 1% 1% $ 768 $ 727 6% 10%EARNINGS BEFORE INTERESTAND TAXES $ 58 $ 76 -24% $ 139 $ 174 -20%
On a currency-neutral basis, Central & Eastern Europe revenues increased 1% and 10% for the second quarter and first six months of fiscal 2017, respectively, with stronggrowth in nearly every territory, partially offset by lower revenues for our distributors business. Territory revenue growth was led by Central & Eastern Europe's two largestterritories, Russia and Turkey, which grew 11% and 9%, respectively, for the second quarter of fiscal 2017, and 25% and 14%, respectively, for the first six months of fiscal2017. For the second quarter and first six months of fiscal 2017, revenues for our distributors business decreased 15% and 10%, respectively. On a category basis, revenuegrowth for the second quarter and first six months of fiscal 2017 was fueled by growth in Sportswear, which more than offset declines in most other categories. For the secondquarter and first six months of fiscal 2017, DTC revenues increased 26% and 28%, respectively, fueled by comparable store sales growth of 14% and 17%, respectively, andthe addition of new stores.
Constant currency footwear revenue growth for the second quarter and first six months of fiscal 2017 was primarily attributable to growth in Sportswear, partially offset bydeclines concentrated in Football (Soccer). Unit sales of footwear for the second quarter and first six months of fiscal 2017 increased approximately 5% and 11%, respectively,while higher ASP per pair contributed approximately 1 and 2 percentage points, respectively, of footwear revenue growth. The increase in ASP per pair for the second quarterof fiscal 2017 was driven by lower off-price mix and higher off-price ASP. For the first six months of fiscal 2017, higher ASP per pair was driven by higher full-price and off-priceASP.
The constant currency decrease in apparel revenues for the second quarter of fiscal 2017 was due to declines in several key categories, most notably Running, partially offsetby growth in Men's Training. For the first six months of fiscal 2017, revenue growth was driven by increases in our Sportswear and Men's Training categories, while most othercategories declined. Unit sales of apparel for the second quarter of fiscal 2017 decreased approximately 6%, but increased 2% for the first six months, while increases in ASPper unit contributed approximately 2 percentage points of apparel revenue growth for both periods. Higher ASP per unit for the second quarter of fiscal 2017 was driven bylower off-price mix, the favorable impact of growth in our DTC business and higher full-price ASP. For the first six months of fiscal 2017, higher ASP per unit was primarily dueto the favorable impact of growth in our DTC business and lower off-price mix, partially offset by lower full-price ASP.
Reported EBIT for the second quarter of fiscal 2017 decreased 24% as modest revenue growth and significantly lower selling and administrative expense were more thanoffset by gross margin contraction. Gross margin declined 620 basis points driven by significant unfavorable standard foreign currency exchange rates, partially offset by lowerproduct costs and higher full-price ASP. For the second quarter of fiscal 2017, selling and administrative expense decreased due to lower operating overhead expenseresulting from efficiencies in administrative costs and variable compensation, partially offset by ongoing investments in our growing DTC business. Demand creation expensealso decreased as higher advertising expense was more than offset by lower retail brand presentation costs.
On a reported basis, EBIT for the first six months of fiscal 2017 decreased 20%, in part reflecting the negative impact of weakening foreign currency exchange rates. Reportedrevenue growth and lower selling and administrative expense were more than offset by a decrease in gross margin. Gross margin declined 770 basis points due to significantunfavorable standard foreign currency exchange rates, which were only partially offset by higher full-price ASP. Selling and administrative expense decreased as loweroperating overhead costs were only partially offset by higher demand creation expense. Operating overhead expense decreased due to efficiencies in administrative costs andvariable compensation, partially offset by continued investments in DTC. Demand creation expense increased primarily due to higher advertising and sports marketing costs,partially offset by lower retail brand presentation costs.
32
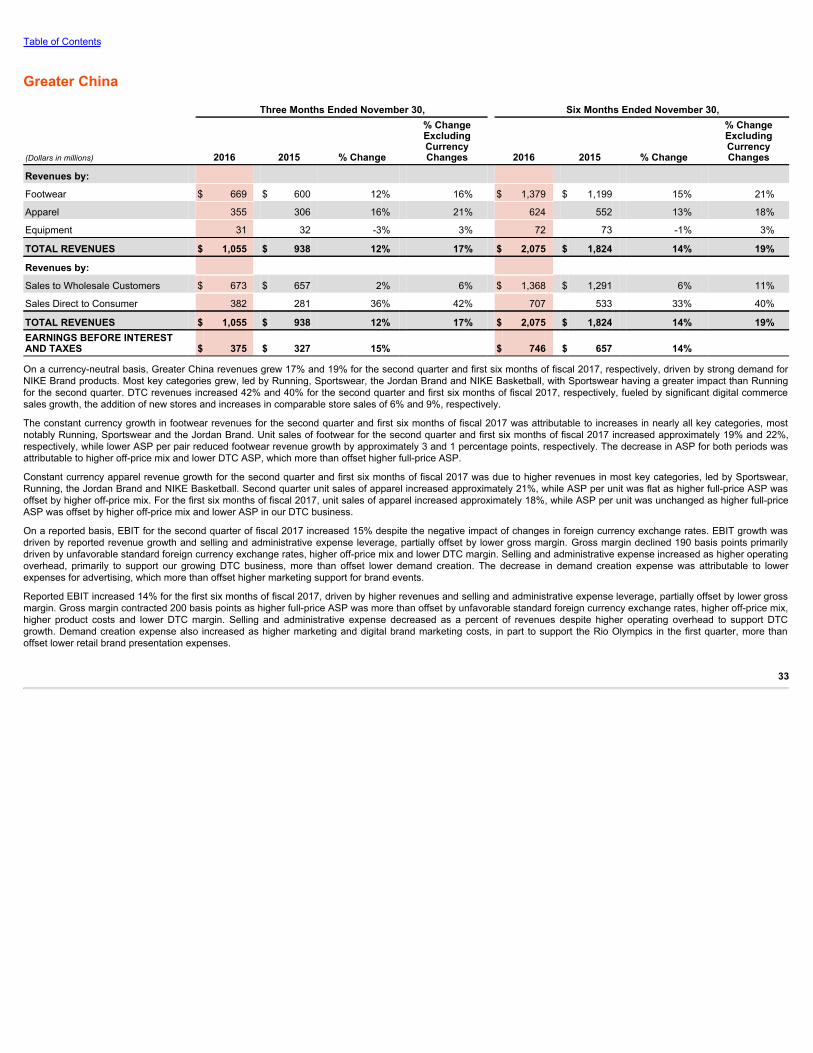
Table of Contents
Greater China Three Months Ended November 30, Six Months Ended November 30,
(Dollars in millions) 2016 2015 % Change
% ChangeExcludingCurrencyChanges 2016 2015 % Change
% ChangeExcludingCurrencyChanges
Revenues by:
Footwear $ 669 $ 600 12% 16% $ 1,379 $ 1,199 15% 21%
Apparel 355 306 16% 21% 624 552 13% 18%
Equipment 31 32 -3% 3% 72 73 -1% 3%
TOTAL REVENUES $ 1,055 $ 938 12% 17% $ 2,075 $ 1,824 14% 19%
Revenues by:
Sales to Wholesale Customers $ 673 $ 657 2% 6% $ 1,368 $ 1,291 6% 11%
Sales Direct to Consumer 382 281 36% 42% 707 533 33% 40%
TOTAL REVENUES $ 1,055 $ 938 12% 17% $ 2,075 $ 1,824 14% 19%EARNINGS BEFORE INTERESTAND TAXES $ 375 $ 327 15% $ 746 $ 657 14%
On a currency-neutral basis, Greater China revenues grew 17% and 19% for the second quarter and first six months of fiscal 2017, respectively, driven by strong demand forNIKE Brand products. Most key categories grew, led by Running, Sportswear, the Jordan Brand and NIKE Basketball, with Sportswear having a greater impact than Runningfor the second quarter. DTC revenues increased 42% and 40% for the second quarter and first six months of fiscal 2017, respectively, fueled by significant digital commercesales growth, the addition of new stores and increases in comparable store sales of 6% and 9%, respectively.
The constant currency growth in footwear revenues for the second quarter and first six months of fiscal 2017 was attributable to increases in nearly all key categories, mostnotably Running, Sportswear and the Jordan Brand. Unit sales of footwear for the second quarter and first six months of fiscal 2017 increased approximately 19% and 22%,respectively, while lower ASP per pair reduced footwear revenue growth by approximately 3 and 1 percentage points, respectively. The decrease in ASP for both periods wasattributable to higher off-price mix and lower DTC ASP, which more than offset higher full-price ASP.
Constant currency apparel revenue growth for the second quarter and first six months of fiscal 2017 was due to higher revenues in most key categories, led by Sportswear,Running, the Jordan Brand and NIKE Basketball. Second quarter unit sales of apparel increased approximately 21%, while ASP per unit was flat as higher full-price ASP wasoffset by higher off-price mix. For the first six months of fiscal 2017, unit sales of apparel increased approximately 18%, while ASP per unit was unchanged as higher full-priceASP was offset by higher off-price mix and lower ASP in our DTC business.
On a reported basis, EBIT for the second quarter of fiscal 2017 increased 15% despite the negative impact of changes in foreign currency exchange rates. EBIT growth wasdriven by reported revenue growth and selling and administrative expense leverage, partially offset by lower gross margin. Gross margin declined 190 basis points primarilydriven by unfavorable standard foreign currency exchange rates, higher off-price mix and lower DTC margin. Selling and administrative expense increased as higher operatingoverhead, primarily to support our growing DTC business, more than offset lower demand creation. The decrease in demand creation expense was attributable to lowerexpenses for advertising, which more than offset higher marketing support for brand events.
Reported EBIT increased 14% for the first six months of fiscal 2017, driven by higher revenues and selling and administrative expense leverage, partially offset by lower grossmargin. Gross margin contracted 200 basis points as higher full-price ASP was more than offset by unfavorable standard foreign currency exchange rates, higher off-price mix,higher product costs and lower DTC margin. Selling and administrative expense decreased as a percent of revenues despite higher operating overhead to support DTCgrowth. Demand creation expense also increased as higher marketing and digital brand marketing costs, in part to support the Rio Olympics in the first quarter, more thanoffset lower retail brand presentation expenses.
33

Table of Contents
Japan Three Months Ended November 30, Six Months Ended November 30,
(Dollars in millions) 2016 2015 % Change
% ChangeExcludingCurrencyChanges 2016 2015 % Change
% ChangeExcludingCurrencyChanges
Revenues by:
Footwear $ 151 $ 128 18% 0% $ 317 $ 250 27% 8%
Apparel 70 63 11% -6% 130 106 23% 5%
Equipment 17 14 21% 9% 36 28 29% 11%
TOTAL REVENUES $ 238 $ 205 16% -2% $ 483 $ 384 26% 7%
Revenues by:
Sales to Wholesale Customers $ 160 $ 144 11% -6% $ 321 $ 258 24% 6%
Sales Direct to Consumer 78 61 28% 7% 162 126 29% 10%
TOTAL REVENUES $ 238 $ 205 16% -2% $ 483 $ 384 26% 7%EARNINGS BEFORE INTERESTAND TAXES $ 48 $ 47 2% $ 98 $ 83 18%
On a constant currency basis, revenues for Japan decreased 2% for the second quarter of fiscal 2017 as declines concentrated in Football (Soccer) were only partially offsetby growth in other categories, primarily Running. Revenues for the first six months of fiscal 2017 increased 7%, primarily driven by growth in several key categories, mostnotably Sportswear and Running. DTC revenues grew 7% and 10% for the second quarter and first six months of fiscal 2017, respectively, due to increases in digitalcommerce sales and comparable store sales growth of 7% and 6%, respectively, with comparable store sales growth having a greater impact than digital commerce sales forthe second quarter.
Reported EBIT for the second quarter increased 2% driven by higher reported revenues, in part reflecting the impact of the stronger Yen, and selling and administrativeexpense leverage, partially offset by lower gross margin. Gross margin declined 500 basis points as lower product costs were more than offset by the significant impact ofunfavorable standard foreign currency exchange rates, as well as lower full-price ASP and unfavorable off-price margin. Reported s elling and administrative expense wasleveraged despite higher operating overhead and demand creation expenses. Operating overhead increased as efficiencies in variable compensation and operationalinfrastructure were more than offset by the impact of changes in foreign currency exchange rates. Demand creation expense also increased as reduced marketing support forbrand events was more than offset by higher retail brand presentation costs and the impact of changes in foreign currency exchange rates.
For the first six months of fiscal 2017, reported EBIT increased 18% compared to the prior year period, also reflecting the impact of the stronger Yen. Gross margin declined370 basis points as lower product costs were more than offset by the impact of unfavorable standard foreign currency exchange rates, unfavorable off-price margin, lower DTCmargin and lower full-price ASP. S elling and administrative expense increased on a reported basis, but was lower as a percent of revenues. Operating overhead increased asefficiencies in variable compensation and operational infrastructure were more than offset by the impact of changes in foreign currency exchange rates. Demand creationexpense also increased as reduced marketing support for brand events was more than offset by higher digital demand creation and retail brand presentation costs, as well asthe impact of changes in foreign currency exchange rates.
Emerging Markets Three Months Ended November 30, Six Months Ended November 30,
(Dollars in millions) 2016 2015 % Change
% ChangeExcludingCurrencyChanges 2016 2015 % Change
% ChangeExcludingCurrencyChanges
Revenues by:
Footwear $ 726 $ 674 8% 15% $ 1,387 $ 1,344 3% 14%
Apparel 263 255 3% 9% 497 493 1% 11%
Equipment 58 55 5% 10% 108 113 -4% 4%
TOTAL REVENUES $ 1,047 $ 984 6% 13% $ 1,992 $ 1,950 2% 12%
Revenues by:
Sales to Wholesale Customers $ 845 $ 825 2% 10% $ 1,622 $ 1,638 -1% 9%
Sales Direct to Consumer 202 159 27% 30% 370 312 19% 28%
TOTAL REVENUES $ 1,047 $ 984 6% 13% $ 1,992 $ 1,950 2% 12%EARNINGS BEFORE INTERESTAND TAXES $ 237 $ 241 -2% $ 408 $ 499 -18%
On a currency-neutral basis, Emerging Markets revenues for the second quarter and first six months of fiscal 2017 increased 13% and 12%, respectively, driven by higherrevenues in most territories. Revenues for three of Emerging Market's largest territories, SOCO (which includes Argentina, Uruguay and Chile), Korea and Mexico, grew44%,14% and 14%, respectively, for the second quarter of fiscal 2017 and 45%, 10% and 12%, respectively, for the first six months of fiscal 2017. On a category basis,revenues for the second quarter and first six months of fiscal 2017 increased in most key categories, led by Sportswear and Running. DTC revenues increased 30% and 28%for the second quarter and first six months of fiscal 2017, respectively, fueled by the addition of new stores, comparable store sales growth of 13% and 10%, respectively, andhigher digital commerce sales.
34
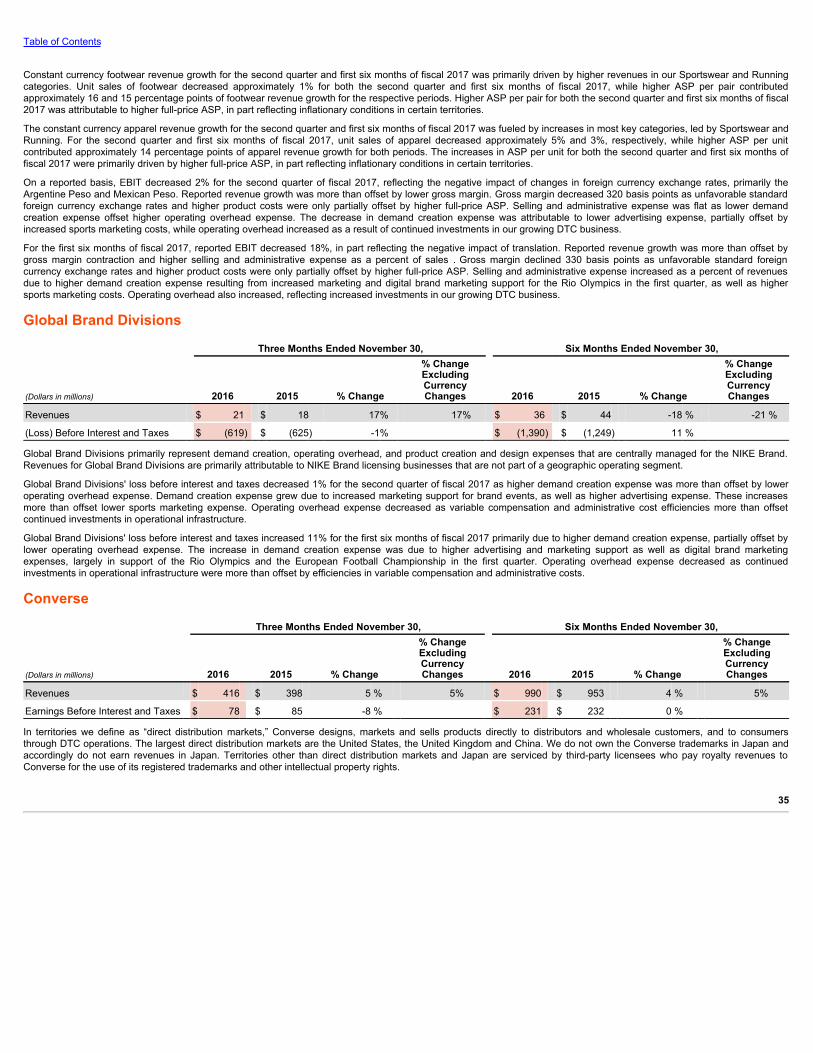
Table of Contents
Constant currency footwear revenue growth for the second quarter and first six months of fiscal 2017 was primarily driven by higher revenues in our Sportswear and Runningcategories. Unit sales of footwear decreased approximately 1% for both the second quarter and first six months of fiscal 2017, while higher ASP per pair contributedapproximately 16 and 15 percentage points of footwear revenue growth for the respective periods. Higher ASP per pair for both the second quarter and first six months of fiscal2017 was attributable to higher full-price ASP, in part reflecting inflationary conditions in certain territories.
The constant currency apparel revenue growth for the second quarter and first six months of fiscal 2017 was fueled by increases in most key categories, led by Sportswear andRunning. For the second quarter and first six months of fiscal 2017, unit sales of apparel decreased approximately 5% and 3%, respectively, while higher ASP per unitcontributed approximately 14 percentage points of apparel revenue growth for both periods. The increases in ASP per unit for both the second quarter and first six months offiscal 2017 were primarily driven by higher full-price ASP, in part reflecting inflationary conditions in certain territories.
On a reported basis, EBIT decreased 2% for the second quarter of fiscal 2017, reflecting the negative impact of changes in foreign currency exchange rates, primarily theArgentine Peso and Mexican Peso. Reported revenue growth was more than offset by lower gross margin. Gross margin decreased 320 basis points as unfavorable standardforeign currency exchange rates and higher product costs were only partially offset by higher full-price ASP. Selling and administrative expense was flat as lower demandcreation expense offset higher operating overhead expense. The decrease in demand creation expense was attributable to lower advertising expense, partially offset byincreased sports marketing costs, while operating overhead increased as a result of continued investments in our growing DTC business.
For the first six months of fiscal 2017, reported EBIT decreased 18%, in part reflecting the negative impact of translation. Reported revenue growth was more than offset bygross margin contraction and higher selling and administrative expense as a percent of sales . Gross margin declined 330 basis points as unfavorable standard foreigncurrency exchange rates and higher product costs were only partially offset by higher full-price ASP. Selling and administrative expense increased as a percent of revenuesdue to higher demand creation expense resulting from increased marketing and digital brand marketing support for the Rio Olympics in the first quarter, as well as highersports marketing costs. Operating overhead also increased, reflecting increased investments in our growing DTC business.
Global Brand Divisions Three Months Ended November 30, Six Months Ended November 30,
(Dollars in millions) 2016 2015 % Change
% ChangeExcludingCurrencyChanges 2016 2015 % Change
% ChangeExcludingCurrencyChanges
Revenues $ 21 $ 18 17% 17% $ 36 $ 44 -18 % -21 %
(Loss) Before Interest and Taxes $ (619) $ (625) -1% $ (1,390) $ (1,249) 11 %
Global Brand Divisions primarily represent demand creation, operating overhead, and product creation and design expenses that are centrally managed for the NIKE Brand.Revenues for Global Brand Divisions are primarily attributable to NIKE Brand licensing businesses that are not part of a geographic operating segment.
Global Brand Divisions' loss before interest and taxes decreased 1% for the second quarter of fiscal 2017 as higher demand creation expense was more than offset by loweroperating overhead expense. Demand creation expense grew due to increased marketing support for brand events, as well as higher advertising expense. These increasesmore than offset lower sports marketing expense. Operating overhead expense decreased as variable compensation and administrative cost efficiencies more than offsetcontinued investments in operational infrastructure.
Global Brand Divisions' loss before interest and taxes increased 11% for the first six months of fiscal 2017 primarily due to higher demand creation expense, partially offset bylower operating overhead expense. The increase in demand creation expense was due to higher advertising and marketing support as well as digital brand marketingexpenses, largely in support of the Rio Olympics and the European Football Championship in the first quarter. Operating overhead expense decreased as continuedinvestments in operational infrastructure were more than offset by efficiencies in variable compensation and administrative costs.
Converse Three Months Ended November 30, Six Months Ended November 30,
(Dollars in millions) 2016 2015 % Change
% ChangeExcludingCurrencyChanges 2016 2015 % Change
% ChangeExcludingCurrencyChanges
Revenues $ 416 $ 398 5 % 5% $ 990 $ 953 4 % 5%
Earnings Before Interest and Taxes $ 78 $ 85 -8 % $ 231 $ 232 0 %
In territories we define as “direct distribution markets,” Converse designs, markets and sells products directly to distributors and wholesale customers, and to consumersthrough DTC operations. The largest direct distribution markets are the United States, the United Kingdom and China. We do not own the Converse trademarks in Japan andaccordingly do not earn revenues in Japan. Territories other than direct distribution markets and Japan are serviced by third-party licensees who pay royalty revenues toConverse for the use of its registered trademarks and other intellectual property rights.
35

Table of Contents
On a currency-neutral basis, revenues for Converse increased 5% for both the second quarter and first six months of fiscal 2017. Comparable direct distribution markets (i.e.,markets served under a direct distribution model for comparable periods in the current and prior fiscal years) grew 8% for the second quarter of fiscal 2017, contributingapproximately 7 percentage points of total Converse revenue growth. For the first six months of fiscal 2017, comparable direct distribution markets grew 5%, contributingapproximately 5 percentage points of total Converse revenue growth. Comparable direct distribution market unit sales increased approximately 7% and 3% for the secondquarter and first six months of fiscal 2017, respectively, while higher ASP per unit contributed approximately 1 and 2 percentage points, respectively, of direct distributionmarkets revenue growth. On a territory basis, the increase in comparable direct distribution markets revenues for the second quarter was primarily attributable to growth in theUnited States, while the increase for the first six months of fiscal 2017 was primarily due to growth in the United States, partially offset by lower revenues in Europe.Conversion of markets from licensed to direct distribution had no impact for the second quarter and increased total Converse revenues by approximately 1 percentage point forthe first six months of fiscal 2017. Revenues from comparable licensed markets decreased 20% and 12% for the second quarter and first six months of fiscal 2017,respectively, reducing total Converse revenue growth by approximately 2 and 1 percentage points for the respective periods. The decrease in comparable licensed marketsrevenues is due primarily to lower revenues in Brazil and Italy.
Reported EBIT for Converse decreased 8% for the second quarter as higher revenues and lower selling and administrative expense were more than offset by lower grossmargin. For the second quarter of fiscal 2017, gross margin decreased 470 basis points primarily due to unfavorable standard foreign currency exchange rates, the impact oflower licensing revenues and unfavorable off-price sales, which more than offset lower product costs. Selling and administrative expense was lower for the second quarter offiscal 2017 due to lower demand creation expense driven by lower retail brand presentation and advertising costs. The decrease in demand creation was partially offset by anincrease in operating overhead, as lower variable compensation was more than offset by investments in operational infrastructure and higher administrative costs.
EBIT was flat for the first six months of fiscal 2017 as revenue growth and lower selling and administrative expense were offset by gross margin contraction. Gross margindecreased 410 basis points for the first six months of fiscal 2017 as unfavorable standard foreign currency exchange rates, higher product costs, unfavorable off-price salesand the impact of lower licensing revenues more than offset higher full-price ASP. Selling and administrative expense decreased due to lower demand creation expense,primarily as a result of lower retail brand presentation costs and a decrease in marketing support for brand events. Operating overhead also declined as investments inoperational infrastructure were more than offset by efficiencies in administrative costs and variable compensation.
Corporate Three Months Ended November 30, Six Months Ended November 30,
(Dollars in millions) 2016 2015 % Change 2016 2015 % Change
Revenues $ 40 $ (29) — $ 68 $ (68) —
(Loss) Before Interest and Taxes $ (196) $ (365) -46 % $ (359) $ (688) -48 %
Corporate revenues primarily consist of foreign currency hedge gains and losses related to revenues generated by entities within the NIKE Brand geographic operatingsegments and Converse, but managed through our central foreign exchange risk management program.
The Corporate loss before interest and taxes consists largely of unallocated general and administrative expenses, including expenses associated with centrally manageddepartments; depreciation and amortization related to our corporate headquarters; unallocated insurance, benefit and compensation programs, including stock-basedcompensation; and certain foreign currency gains and losses.
In addition to the foreign currency gains and losses recognized in Corporate revenues, foreign currency results in Corporate include gains and losses resulting from thedifference between actual foreign currency rates and standard rates used to record non-functional currency denominated product purchases within the NIKE Brand geographicoperating segments and Converse; related foreign currency hedge results; conversion gains and losses arising from re-measurement of monetary assets and liabilities in non-functional currencies; and certain other foreign currency derivative instruments.
Corporate's loss before interest and taxes decreased $169 million and $329 million for the second quarter and first six months of fiscal 2017, respectively. The decreases weredue to the following:
• a beneficial change of $125 million and $263 million for the second quarter and first six months of fiscal 2017, respectively, from net foreign currency losses to netforeign currency gains related to the difference between actual foreign currency exchange rates and standard foreign currency exchange rates assigned to the NIKEBrand geographic operating segments and Converse, net of hedge gains and losses; these results are reported as a component of consolidated gross margin;
• an increase in net foreign currency gains of $4 million and $27 million for the second quarter and first six months of fiscal 2017, respectively, related to the re-measurement of monetary assets and liabilities denominated in non-functional currencies and the impact of certain foreign currency derivative instruments , reportedas a component of consolidated Other (income) expense, net ; and
• a beneficial change of $40 million and $39 million for the second quarter and first six months of fiscal 2017, respectively, primarily driven by the impact of lowervariable compensation on operating overhead expense.
36
Table of Contents
Foreign Currency Exposures and Hedging Practices
OverviewAs a global company with significant operations outside the United States, in the normal course of business we are exposed to risk arising from changes in currency exchangerates. Our primary foreign currency exposures arise from the recording of transactions denominated in non-functional currencies and the translation of foreign currencydenominated results of operations, financial position and cash flows into U.S. Dollars.
Our foreign exchange risk management program is intended to lessen both the positive and negative effects of currency fluctuations on our consolidated results of operations,financial position and cash flows. We manage global foreign exchange risk centrally on a portfolio basis to address those risks that are material to NIKE, Inc. We manage theseexposures by taking advantage of natural offsets and currency correlations that exist within the portfolio and, where practical and material, by hedging a portion of theremaining exposures using derivative instruments such as forward contracts and options. As described below, the implementation of the NIKE Trading Company (NTC) andour foreign currency adjustment program enhanced our ability to manage our foreign exchange risk by increasing the natural offsets and currency correlation benefits that existwithin our portfolio of foreign exchange exposures. Our hedging policy is designed to partially or entirely offset the impact of exchange rate changes on the underlying netexposures being hedged. Where exposures are hedged, our program has the effect of delaying the impact of exchange rate movements on our Unaudited CondensedConsolidated Financial Statements; the length of the delay is dependent upon hedge horizons. We do not hold or issue derivative instruments for trading or speculativepurposes.
Transactional ExposuresWe conduct business in various currencies and have transactions which subject us to foreign currency risk. Our most significant transactional foreign currency exposures are:
• Product Costs — NIKE’s product costs are exposed to fluctuations in foreign currencies in the following ways:
1. Product purchases denominated in currencies other than the functional currency of the transacting entity:
a. Certain NIKE entities purchase product from the NTC, a wholly-owned sourcing hub that buys NIKE branded products from third-party factories,predominantly in U.S. Dollars. The NTC, whose functional currency is the U.S. Dollar, then sells the products to NIKE entities in their respective functionalcurrencies. When the NTC sells to a NIKE entity with a different functional currency, the result is a foreign currency exposure for the NTC.
b. Other NIKE entities purchase product directly from third-party factories in U.S. Dollars. These purchases generate a foreign currency exposure for thoseNIKE entities with a functional currency other than the U.S. Dollar.
In both purchasing scenarios, a weaker U.S. Dollar reduces the inventory cost incurred by NIKE whereas a stronger U.S. Dollar increases its cost.
2. Factory input costs: NIKE operates a foreign currency adjustment program with certain factories. The program is designed to more effectively manage foreigncurrency risk by assuming certain of the factories’ foreign currency exposures, some of which are natural offsets to our existing foreign currency exposures.Under this program, our payments to these factories are adjusted for rate fluctuations in the basket of currencies (“factory currency exposure index”) in which thelabor, materials and overhead costs incurred by the factories in the production of NIKE branded products (“factory input costs”) are denominated.
For the currency within the factory currency exposure indices that is the local or functional currency of the factory, the currency rate fluctuation affecting theproduct cost is recorded within Inventories and is recognized in Cost of sales when the related product is sold to a third-party. All currencies within the indices,excluding the U.S. Dollar and the local or functional currency of the factory, are recognized as embedded derivative contracts and are recorded at fair valuethrough Other (income) expense, net . Refer to Note 9 — Risk Management and Derivatives in the accompanying Notes to the Unaudited CondensedConsolidated Financial Statements for additional detail.
As an offset to the impacts of the fluctuating U.S. Dollar on our non-functional currency denominated product purchases described above, a strengtheningU.S. Dollar against the foreign currencies within the factory currency exposure indices decreases NIKE’s U.S. Dollar inventory cost. Conversely, a weakeningU.S. Dollar against the indexed foreign currencies increases our inventory cost.
• Non-Functional Currency Denominated External Sales — A portion of our Western Europe and Central & Eastern Europe geography revenues, as well as a portionof our Converse European operations revenues, are earned in currencies other than the Euro (e.g. the British Pound) but are recognized at a subsidiary that uses theEuro as its functional currency. These sales generate a foreign currency exposure.
• Other Costs — Non-functional currency denominated costs, such as endorsement contracts, also generate foreign currency risk, though to a lesser extent. In certaincases, the Company has also entered into other contractual agreements which have payments that are indexed to foreign currencies and create embeddedderivative contracts that are recorded at fair value through Other (income) expense, net . Refer to Note 9 — Risk Management and Derivatives in the accompanyingNotes to the Unaudited Condensed Consolidated Financial Statements for additional detail.
• Non-Functional Currency Denominated Monetary Assets and Liabilities — Our global subsidiaries have various assets and liabilities, primarily receivables andpayables, including intercompany receivables and payables, denominated in currencies other than their functional currencies. These balance sheet items are subjectto re-measurement which may create fluctuations in Other (income) expense, net within our consolidated results of operations.
37
Table of Contents
Managing Transactional ExposuresTransactional exposures are managed on a portfolio basis within our foreign currency risk management program. We manage these exposures by taking advantage of naturaloffsets and currency correlations that exist within the portfolio and may also elect to use currency forward and option contracts to hedge the remaining effect of exchange ratefluctuations on probable forecasted future cash flows, including certain product cost exposures, non-functional currency denominated external sales and other costs describedabove. Generally, these are accounted for as cash flow hedges in accordance with U.S. GAAP, except for hedges of the embedded derivative components of the product costexposures and other contractual agreements as discussed above.
Certain currency forward contracts used to manage the foreign exchange exposure of non-functional currency denominated monetary assets and liabilities subject to re-measurement and embedded derivative contracts are not formally designated as hedging instruments under U.S. GAAP. Accordingly, changes in fair value of theseinstruments are immediately recognized in Other (income) expense, net and are intended to offset the foreign currency impact of the re-measurement of the related non-functional currency denominated asset or liability or the embedded derivative contract being hedged.
Refer to Note 4 — Fair Value Measurements and Note 9 — Risk Management and Derivatives in the accompanying Notes to the Unaudited Condensed Consolidated FinancialStatements for additional description of how the above financial instruments are valued and recorded, as well as the fair value of outstanding derivatives at each reportedperiod end.
Translational ExposuresMany of our foreign subsidiaries operate in functional currencies other than the U.S. Dollar. Fluctuations in currency exchange rates create volatility in our reported results aswe are required to translate the balance sheets, operational results and cash flows of these subsidiaries into U.S. Dollars for consolidated reporting. The translation of foreignsubsidiaries’ non-U.S. Dollar denominated balance sheets into U.S. Dollars for consolidated reporting results in a cumulative translation adjustment to Accumulated othercomprehensive income within Shareholders’ equity . In the translation of our Unaudited Condensed Consolidated Statements of Income, a weaker U.S. Dollar in relation toforeign functional currencies benefits our consolidated earnings whereas a stronger U.S. Dollar reduces our consolidated earnings. The impact of foreign exchange ratefluctuations on the translation of our consolidated Revenues was a detriment of approximately $95 million and $586 million for the three months ended November 30, 2016 and2015, respectively. The impact of foreign exchange rate fluctuations on the translation of our Income before income taxes was a detriment of approximately $22 million and$130 million for the three months ended November 30, 2016 and 2015, respectively. The impact of foreign exchange rate fluctuations on the translation of our consolidatedRevenues was a detriment of approximately $280 million and $1,287 million for the six months ended November 30, 2016 and 2015, respectively. The impact of foreignexchange rate fluctuations on the translation of our Income before income taxes was a detriment of approximately $48 million and $303 million for the six months endedNovember 30, 2016 and 2015, respectively.
Managing Translational ExposuresTo minimize the impact of translating foreign currency denominated revenues and expenses into U.S. Dollars for consolidated reporting, certain foreign subsidiaries use excesscash to purchase U.S. Dollar denominated available-for-sale investments. The variable future cash flows associated with the purchase and subsequent sale of theseU.S. Dollar denominated investments at non-U.S. Dollar functional currency subsidiaries creates a foreign currency exposure that qualifies for hedge accounting under U.S.GAAP. We utilize forward contracts and/or options to mitigate the variability of the forecasted future purchases and sales of these U.S. Dollar investments. The combination ofthe purchase and sale of the U.S. Dollar investment and the hedging instrument has the effect of partially offsetting the year-over-year foreign currency translation impact onnet earnings in the period the investments are sold. Hedges of the purchase of U.S. Dollar denominated available-for-sale investments are accounted for as cash flow hedges.
Refer to Note 4 — Fair Value Measurements and Note 9 — Risk Management and Derivatives in the accompanying Notes to the Unaudited Condensed Consolidated FinancialStatements for additional description of how the above financial instruments are valued and recorded as well as the fair value of outstanding derivatives at each reportedperiod end.
We estimate the combination of translation of foreign currency-denominated profits from our international businesses and the year-over-year change in foreign currency relatedgains and losses included in Other (income) expense, net had an unfavorable impact of approximately $29 million and $26 million on our Income before income taxes for thethree and six months ended November 30, 2016 , respectively.
Net Investments in Foreign SubsidiariesWe are also exposed to the impact of foreign exchange fluctuations on our investments in wholly-owned foreign subsidiaries denominated in a currency other than theU.S. Dollar, which could adversely impact the U.S. Dollar value of these investments, and therefore the value of future repatriated earnings. We have, in the past, hedged andmay, in the future, hedge net investment positions in certain foreign subsidiaries to mitigate the effects of foreign exchange fluctuations on these net investments. Thesehedges are accounted for in accordance with U.S. GAAP. There were no outstanding net investment hedges as of November 30, 2016 and 2015 . There were no cash flowsfrom net investment hedge settlements for the three and six months ended November 30, 2016 and 2015 .
Liquidity and Capital Resources
Cash Flow ActivityCash provided by operations was $1,684 million for the first six months of fiscal 2017 compared to $1,036 million for the first six months of fiscal 2016. Our primary source ofoperating cash flows for the first six months of fiscal 2017 was Net income of $2,091 million compared to $1,964 million for the first six months of fiscal 2016. Operating cashflows also increased due to changes in working capital, which resulted in a cash outflow of $772 million for the first six months of fiscal 2017 compared to an outflow of $1,401million for the first six months of fiscal 2016. The change in working capital was primarily due to the amount of posted cash collateral with derivative counterparties as a resultof hedging activities. For the first six months of fiscal 2017, cash collateral received from counterparties increased $264 million as compared to a decrease of $243 millionduring the first six months of fiscal 2016. Refer to the Credit Risk section of Note 9 — Risk Management and Derivatives in the accompanying Notes to the UnauditedCondensed Consolidated Financial Statements for additional detail.
38

Table of Contents
Cash provided (used) by investing activities was a source of cash of $236 million for the first six months of fiscal 2017 compared to a use of cash of $697 million for the first sixmonths of fiscal 2016. The primary driver of the increase in Cash provided (used) by investing activities was the net change in short-term investments (including sales,maturities and purchases) from net purchases to net sales/maturities. For the first six months of fiscal 2017, there were $789 million of net sales/maturities compared to $91million of net purchases for the first six months of fiscal 2016.
Cash used by financing activities was $680 million for the first six months of fiscal 2017 compared to $282 million for the first six months of fiscal 2016, as increased proceedsfrom the issuance of debt were more than offset by higher share repurchases and dividends paid. Cash used by financing activities also increased due to lower excess taxbenefits from share-based payment arrangements and decreases in proceeds from the exercise of stock options and other stock issuances during the first six months of fiscal2017 compared to the first six months of fiscal 2016.
During the first six months of fiscal 2017, we purchased 35.9 million shares of NIKE's Class B Common Stock for $1,954 million (an average price of $54.39 per share) underthe four-year, $12 billion share repurchase program approved by the Board of Directors in November 2015. As of November 30, 2016 , we had repurchased 56.0 million sharesat a cost of approximately $3,143 million (an average price of $56.12 per share) under this program. We continue to expect funding of share repurchases will come fromoperating cash flows, excess cash and/or proceeds from debt. The timing and the amount of shares purchased will be dictated by our capital needs and stock marketconditions.
Capital ResourcesOn July 21, 2016, we filed a shelf registration statement (the “Shelf”) with the SEC which permits us to issue an unlimited amount of debt securities. The Shelf expires on July21, 2019. On October 21, 2016, we issued $1.5 billion of senior notes with tranches maturing in 2026 and 2046. The 2026 senior notes were issued in an initial aggregateprincipal amount of $1.0 billion at a 2.375% fixed, annual interest rate and will mature on November 1, 2026. The 2046 senior notes were issued in an initial aggregate principalamount of $500 million at a 3.375% fixed, annual interest rate and will mature on November 1, 2046. Interest on the senior notes is payable semi-annually on May 1 andNovember 1 of each year. The issuance resulted in proceeds before expenses of $1,493 million. Refer to Note 5 — Long-Term Debt in the accompanying Notes to theUnaudited Condensed Consolidated Financial Statements for additional detail on Long-term debt .
On August 28, 2015, we entered into a committed credit facility agreement with a syndicate of banks, which provides for up to $2 billion of borrowings. The facility maturesAugust 28, 2020, with a one year extension option prior to any anniversary of the closing date, provided that in no event shall it extend beyond August 28, 2022. As of and forthe six month period ended November 30, 2016 , we had no amounts outstanding under the committed credit facility.
We currently have long-term debt ratings of AA- and A1 from Standard and Poor's Corporation and Moody's Investor Services, respectively. If our long-term debt rating were todecline, the facility fee and interest rate under our committed credit facility would increase. Conversely, if our long-term debt rating were to improve, the facility fee and interestrate would decrease. Changes in our long-term debt rating would not trigger acceleration of maturity of any then-outstanding borrowings or any future borrowings under thecommitted credit facility. Under this committed revolving credit facility, we have agreed to various covenants. These covenants include limits on our disposal of fixed assets andthe amount of debt secured by liens we may incur, as well as limits on the indebtedness we can incur relative to our net worth. In the event we were to have any borrowingsoutstanding under this facility and failed to meet any covenant, and were unable to obtain a waiver from a majority of the banks in the syndicate, any borrowings would becomeimmediately due and payable. As of November 30, 2016 , we were in full compliance with each of these covenants and believe it is unlikely we will fail to meet any of thesecovenants in the foreseeable future.
Liquidity is also provided by our $2 billion commercial paper program. During the three months ended November 30, 2016 , the maximum amount of commercial paperborrowings outstanding at any point was $919 million. As of November 30, 2016 , there were no outstanding borrowings under this program. We may continue to issuecommercial paper or other debt securities during fiscal 2017 depending on general corporate needs. We currently have short-term debt ratings of A1+ and P1 from Standardand Poor's Corporation and Moody's Investor Services, respectively.
As of November 30, 2016 , we had cash, cash equivalents and short-term investments totaling $5.9 billion , of which $5.3 billion was held by our foreign subsidiaries. Cashequivalents and short-term investments consist primarily of deposits held at major banks, money market funds, commercial paper, corporate notes, U.S. Treasury obligations,U.S. government sponsored enterprise obligations and other investment grade fixed-income securities. Our fixed-income investments are exposed to both credit and interestrate risk. All of our investments are investment grade to minimize our credit risk. While individual securities have varying durations, as of November 30, 2016 , the averageduration of our cash equivalents and short-term investments portfolio was 67 days.
To date we have not experienced difficulty accessing the credit markets or incurred higher interest costs. Future volatility in the capital markets, however, may increase costsassociated with issuing commercial paper or other debt instruments or affect our ability to access those markets. We believe that existing cash, cash equivalents, short-terminvestments and cash generated by operations, together with access to external sources of funds as described above, will be sufficient to meet our domestic andforeign capital needs in the foreseeable future.
We utilize a variety of tax planning and financing strategies to manage our worldwide cash and deploy funds to locations where they are needed. We routinely repatriate aportion of our foreign earnings for which U.S. taxes have previously been provided. We also indefinitely reinvest a significant portion of our foreign earnings, and our currentplans do not demonstrate a need to repatriate these earnings. Should we require additional capital in the United States, we may elect to repatriate indefinitely reinvestedforeign funds or raise capital in the United States through debt. If we were to repatriate indefinitely reinvested foreign funds, we would be required to accrue and pay additionalU.S. taxes less applicable foreign tax credits. If we elect to raise capital in the United States through debt, we would incur additional interest expense .
Contractual ObligationsAs a result of our October 2016 debt issuance, cash payments due on long-term debt have increased from what was reported in our Annual Report on Form 10-K for the fiscalyear ended May 31, 2016 .
39

Table of Contents
Long-term debt obligations as of November 30, 2016 are as follows:
Description of Commitment Cash Payments Due During the Year Ending May 31,
(In millions) Remainder of
2017 2018 2019 2020 2021 Thereafter TotalLong-Term Debt (1) $ 96 $ 115 $ 115 $ 115 $ 112 $ 5,422 $ 5,975
(1) The cash payments due for long-term debt include estimated interest payments. Estimates of interest payments are based on outstanding principal amounts, applicablefixed interest rates or currently effective interest rates as of November 30, 2016 (if variable), timing of scheduled payments and the term of the debt obligations.
Other than the changes reported above, there have been no significant changes to the contractual obligations reported in our Annual Report on Form 10-K for the fiscal yearended May 31, 2016 .
Off-Balance Sheet ArrangementsAs of November 30, 2016 , we did not have any off-balance sheet arrangements that have, or are reasonably likely to have, a current or future effect on our financial condition,results of operations, liquidity, capital expenditures or capital resources.
New Accounting PronouncementsRefer to Note 1 — Summary of Significant Accounting Policies in the accompanying Notes to the Unaudited Condensed Consolidated Financial Statements for recentlyadopted and recently issued accounting standards.
Critical Accounting PoliciesOur discussion and analysis of our financial condition and results of operations are based upon our Unaudited Condensed Consolidated Financial Statements, which havebeen prepared in accordance with U.S. GAAP. The preparation of these financial statements requires us to make estimates and judgments that affect the reported amounts ofassets, liabilities, revenues and expenses and related disclosure of contingent assets and liabilities.
We believe that the estimates, assumptions and judgments involved in the accounting policies described in the “Management’s Discussion and Analysis of Financial Conditionand Results of Operations” section of our most recent Annual Report on Form 10-K have the greatest potential impact on our financial statements, so we consider these to beour critical accounting policies. Actual results could differ from the estimates we use in applying our critical accounting policies. We are not currently aware of any reasonablylikely events or circumstances that would result in materially different amounts being reported.
40

Table of Contents
ITEM 3. Quantitative and Qualitative Disclosures about Market RiskOther than the items noted below, as well as the termination of our forward-starting interest rate swaps, there have been no material changes from the information previouslyreported under Part II, Item 7A of our Annual Report on Form 10-K for the fiscal year ended May 31, 2016 .
We use the Value-at-Risk (“VaR”) model to monitor the foreign exchange risk of our foreign currency forward and foreign currency option derivative instruments. The VaRmodel determines the maximum potential one-day loss in the fair value of these foreign exchange rate-sensitive financial instruments assuming normal market conditions and a95% confidence level. Since May 31, 2016, decreases in the total notional amount and increases in foreign currency volatilities have resulted in a decreased estimatedmaximum one-day loss in fair value of $75 million as of November 30, 2016, as compared to $109 million as of May 31, 2016. This hypothetical loss in fair value of ourderivatives would be offset by increases in the value of the underlying transactions being hedged. The average monthly change in the net fair values of foreign currencyforward and foreign currency option derivatives instruments was $178 million for the six months ended November 30, 2016, compared with $209 million for the fiscal yearended May 31, 2016. The VaR model is a risk analysis tool and does not purport to represent actual losses in fair value that we will incur nor does it consider the potentialeffect of favorable changes in market rates. Actual future gains and losses will differ from and could exceed those estimates because of changes or differences in market ratesand interrelationships, hedging instruments and hedge percentages, timing and other factors.
Changes regarding interest rate risk from the information previously reported under Part II, Item 7A of our Annual Report on Form 10-K for the fiscal year ended May 31, 2016are as follows:
Expected Maturity Date
Year Ending May 31,
(Dollars in millions) Remainder of
2017 2018 2019 2020 2021 Thereafter Total Fair Value
Interest Rate Risk
Long-term U.S. Dollar debt — Fixed rate
Principal payments $ 38 $ — $ — $ — $ — $ 3,500 $ 3,538 $ 3,350
Weighted-average interest rate 6.2% 0.0% 0.0% 0.0% 0.0% 3.1% 3.1%
ITEM 4. Controls and ProceduresWe maintain disclosure controls and procedures that are designed to ensure that information required to be disclosed in our Securities Exchange Act of 1934, as amended(“the Exchange Act”) reports is recorded, processed, summarized and reported within the time periods specified in the Securities and Exchange Commission’s rules and formsand that such information is accumulated and communicated to our management, including our Chief Executive Officer and Chief Financial Officer, as appropriate, to allow fortimely decisions regarding required disclosure. In designing and evaluating the disclosure controls and procedures, management recognizes that any controls and procedures,no matter how well designed and operated, can provide only reasonable assurance of achieving the desired control objectives, and management is required to apply itsjudgment in evaluating the cost-benefit relationship of possible controls and procedures.
We carry out a variety of ongoing procedures under the supervision and with the participation of our management, including our Chief Executive Officer and Chief FinancialOfficer, to evaluate the effectiveness of the design and operation of our disclosure controls and procedures. Based on the foregoing, our Chief Executive Officer and ChiefFinancial Officer concluded that our disclosure controls and procedures were effective at the reasonable assurance level as of November 30, 2016 .
We have continued several transformation initiatives to centralize and simplify our business processes and systems. These are long-term initiatives, which we believe willenhance our internal control over financial reporting due to increased automation and further integration of related processes. We will continue to monitor our internal controlover financial reporting for effectiveness throughout the transformation.
There have not been any other changes in our internal control over financial reporting during our most recent fiscal quarter that have materially affected, or are reasonablylikely to materially affect, our internal control over financial reporting.
41

Table of Contents
Special Note Regarding Forward-LookingStatements and Analyst Reports
Certain written and oral statements, other than purely historic information, including estimates, projections, statements relating to NIKE’s business plans, objectives andexpected operating results and the assumptions upon which those statements are based, made or incorporated by reference from time to time by NIKE or its representatives inthis report, other reports, filings with the Securities and Exchange Commission, press releases, conferences or otherwise, are “forward-looking statements” within the meaningof the Private Securities Litigation Reform Act of 1995 and Section 21E of the Securities Exchange Act of 1934, as amended. Forward-looking statements include, withoutlimitation, any statement that may predict, forecast, indicate, or imply future results, performance or achievements, and may contain the words “believe,” “anticipate,” “expect,”“estimate,” “project,” “will be,” “will continue,” “will likely result,” or words or phrases of similar meaning. Forward-looking statements involve risks and uncertainties which maycause actual results to differ materially from the forward-looking statements. The risks and uncertainties are detailed from time to time in reports filed by NIKE with theSecurities and Exchange Commission, including reports filed on Forms 8-K, 10-Q and 10-K, and include, among others, the following: international, national and local generaleconomic and market conditions; the size and growth of the overall athletic footwear, apparel and equipment markets; intense competition among designers, marketers,distributors and sellers of athletic footwear, apparel and equipment for consumers and endorsers; demographic changes; changes in consumer preferences; popularity ofparticular designs, categories of products and sports; seasonal and geographic demand for NIKE products; difficulties in anticipating or forecasting changes in consumerpreferences, consumer demand for NIKE products and the various market factors described above; difficulties in implementing, operating and maintaining NIKE’s increasinglycomplex information systems and controls, including, without limitation, the systems related to demand and supply planning and inventory control; interruptions in data andinformation technology systems; consumer data security; fluctuations and difficulty in forecasting operating results, including, without limitation, the fact that advance futuresorders may not be indicative of future revenues due to changes in shipment timing, the changing mix of futures and at-once orders and discounts, order cancellations andreturns; the ability of NIKE to sustain, manage or forecast its growth and inventories; the size, timing and mix of purchases of NIKE’s products; increases in the cost ofmaterials, labor and energy used to manufacture products, new product development and introduction; the ability to secure and protect trademarks, patents and otherintellectual property; product performance and quality; customer service; adverse publicity; the loss of significant customers or suppliers; dependence on distributors andlicensees; business disruptions; increased costs of freight and transportation to meet delivery deadlines; increases in borrowing costs due to any decline in NIKE's debt ratings;changes in business strategy or development plans; general risks associated with doing business outside the United States, including, without limitation, exchange ratefluctuations, import duties, tariffs, quotas, political and economic instability and terrorism; changes in government regulations; the impact of, including business and legaldevelopments relating to, climate change; natural disasters; liability and other claims asserted against NIKE; the ability to attract and retain qualified personnel; the effects ofNIKE's decision to invest in or divest of businesses; and other factors referenced or incorporated by reference in this report and other reports.
The risks included here are not exhaustive. Other sections of this report may include additional factors which could adversely affect NIKE’s business and financial performance.Moreover, NIKE operates in a very competitive and rapidly changing environment. New risks emerge from time to time and it is not possible for management to predict all suchrisks, nor can it assess the impact of all such risks on NIKE’s business or the extent to which any risk, or combination of risks, may cause actual results to differ materially fromthose contained in any forward-looking statements. Given these risks and uncertainties, investors should not place undue reliance on forward-looking statements as aprediction of actual results.
Investors should also be aware that while NIKE does, from time to time, communicate with securities analysts, it is against NIKE’s policy to disclose to them any material non-public information or other confidential commercial information. Accordingly, shareholders should not assume that NIKE agrees with any statement or report issued by anyanalyst irrespective of the content of the statement or report. Furthermore, NIKE has a policy against issuing or confirming financial forecasts or projections issued by others.Thus, to the extent that reports issued by securities analysts contain any projections, forecasts or opinions, such reports are not the responsibility of NIKE.
42
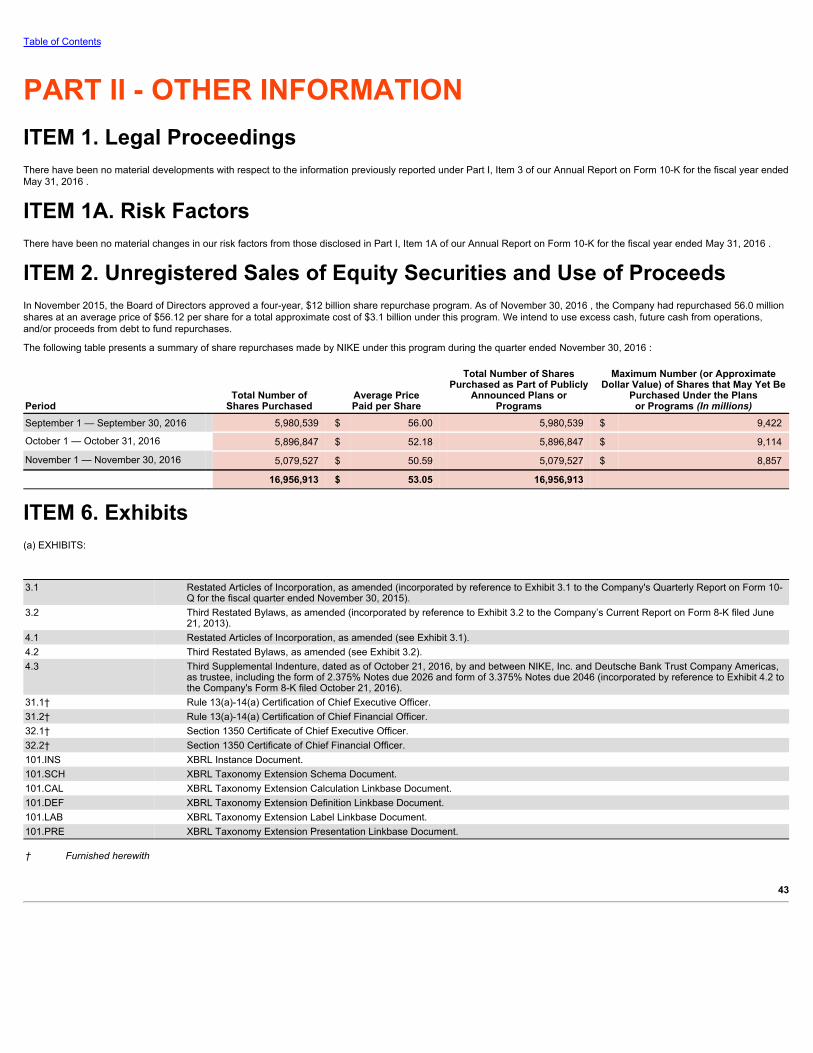
Table of Contents
PART II - OTHER INFORMATIONITEM 1. Legal ProceedingsThere have been no material developments with respect to the information previously reported under Part I, Item 3 of our Annual Report on Form 10-K for the fiscal year endedMay 31, 2016 .
ITEM 1A. Risk FactorsThere have been no material changes in our risk factors from those disclosed in Part I, Item 1A of our Annual Report on Form 10-K for the fiscal year ended May 31, 2016 .
ITEM 2. Unregistered Sales of Equity Securities and Use of ProceedsIn November 2015, the Board of Directors approved a four-year, $12 billion share repurchase program. As of November 30, 2016 , the Company had repurchased 56.0 millionshares at an average price of $56.12 per share for a total approximate cost of $3.1 billion under this program. We intend to use excess cash, future cash from operations,and/or proceeds from debt to fund repurchases.
The following table presents a summary of share repurchases made by NIKE under this program during the quarter ended November 30, 2016 :
Period Total Number of
Shares Purchased Average PricePaid per Share
Total Number of SharesPurchased as Part of Publicly
Announced Plans orPrograms
Maximum Number (or ApproximateDollar Value) of Shares that May Yet Be
Purchased Under the Plansor Programs (In millions)
September 1 — September 30, 2016 5,980,539 $ 56.00 5,980,539 $ 9,422
October 1 — October 31, 2016 5,896,847 $ 52.18 5,896,847 $ 9,114
November 1 — November 30, 2016 5,079,527 $ 50.59 5,079,527 $ 8,857
16,956,913 $ 53.05 16,956,913
ITEM 6. Exhibits(a) EXHIBITS:
3.1 Restated Articles of Incorporation, as amended (incorporated by reference to Exhibit 3.1 to the Company's Quarterly Report on Form 10-
Q for the fiscal quarter ended November 30, 2015).3.2
Third Restated Bylaws, as amended (incorporated by reference to Exhibit 3.2 to the Company’s Current Report on Form 8-K filed June21, 2013).
4.1 Restated Articles of Incorporation, as amended (see Exhibit 3.1).4.2 Third Restated Bylaws, as amended (see Exhibit 3.2).4.3
Third Supplemental Indenture, dated as of October 21, 2016, by and between NIKE, Inc. and Deutsche Bank Trust Company Americas,as trustee, including the form of 2.375% Notes due 2026 and form of 3.375% Notes due 2046 (incorporated by reference to Exhibit 4.2 tothe Company's Form 8-K filed October 21, 2016).
31.1† Rule 13(a)-14(a) Certification of Chief Executive Officer.31.2† Rule 13(a)-14(a) Certification of Chief Financial Officer.32.1† Section 1350 Certificate of Chief Executive Officer.32.2† Section 1350 Certificate of Chief Financial Officer.101.INS XBRL Instance Document.101.SCH XBRL Taxonomy Extension Schema Document.101.CAL XBRL Taxonomy Extension Calculation Linkbase Document.101.DEF XBRL Taxonomy Extension Definition Linkbase Document.101.LAB XBRL Taxonomy Extension Label Linkbase Document.101.PRE XBRL Taxonomy Extension Presentation Linkbase Document.
† Furnished herewith
43

Table of Contents
SignaturesPursuant to the requirements of the Securities Exchange Act of 1934, the registrant has duly caused this report to be signed on its behalf by the undersigned thereunto dulyauthorized.
NIKE, Inc.
an Oregon Corporation
/S/ ANDREW CAMPION
Andrew CampionChief Financial Officer and Authorized
Officer
DATED: January 5, 2017
44

Table of Contents
EXHIBIT INDEX
3.1 Restated Articles of Incorporation, as amended (incorporated by reference to Exhibit 3.1 to the Company's Quarterly Report on Form 10-
Q for the fiscal quarter ended November 30, 2015).3.2
Third Restated Bylaws, as amended (incorporated by reference to Exhibit 3.2 to the Company’s Current Report on Form 8-K filed June21, 2013).
4.1 Restated Articles of Incorporation, as amended (see Exhibit 3.1).4.2 Third Restated Bylaws, as amended (see Exhibit 3.2).4.3
Third Supplemental Indenture, dated as of October 21, 2016, by and between NIKE, Inc. and Deutsche Bank Trust Company Americas,as trustee, including the form of 2.375% Notes due 2026 and form of 3.375% Notes due 2046 (incorporated by reference to Exhibit 4.2 tothe Company's Form 8-K filed October 21, 2016).
31.1† Rule 13(a)-14(a) Certification of Chief Executive Officer.31.2† Rule 13(a)-14(a) Certification of Chief Financial Officer.32.1† Section 1350 Certificate of Chief Executive Officer.32.2† Section 1350 Certificate of Chief Financial Officer.101.INS XBRL Instance Document.101.SCH XBRL Taxonomy Extension Schema Document.101.CAL XBRL Taxonomy Extension Calculation Linkbase Document.101.DEF XBRL Taxonomy Extension Definition Linkbase Document.101.LAB XBRL Taxonomy Extension Label Linkbase Document.101.PRE XBRL Taxonomy Extension Presentation Linkbase Document.
† Furnished herewith
45
Exhibit 31.1
Certification of Chief Executive OfficerPursuant to Section 302 of the Sarbanes-Oxley Act of 2002
I, Mark G. Parker, certify that:
1. I have reviewed this quarterly report on Form 10-Q for the quarter ended November 30, 2016 of NIKE, Inc.;
2. Based on my knowledge, this report does not contain any untrue statement of a material fact or omit to state a material fact necessary to make thestatements made, in light of the circumstances under which such statements were made, not misleading with respect to the period covered by this report;
3. Based on my knowledge, the financial statements, and other financial information included in this report, fairly present in all material respects thefinancial condition, results of operations and cash flows of the registrant as of, and for, the periods presented in this report;
4. The registrant’s other certifying officer and I are responsible for establishing and maintaining disclosure controls and procedures (as defined inExchange Act Rules 13a-15(e) and 15d-15(e)) and internal control over financial reporting (as defined in Exchange Act Rules 13a-15(f) and 15d-15(f)) for theregistrant and have:
a) designed such disclosure controls and procedures, or caused such disclosure controls and procedures to be designed under our supervision, toensure that material information relating to the registrant, including its consolidated subsidiaries, is made known to us by others within those entities, particularlyduring the period in which this report is being prepared;
b) designed such internal control over financial reporting, or caused such internal control over financial reporting to be designed under oursupervision, to provide reasonable assurance regarding the reliability of financial reporting and the preparation of financial statements for external purposes inaccordance with generally accepted accounting principles;
c) evaluated the effectiveness of the registrant’s disclosure controls and procedures and presented in this report our conclusions about theeffectiveness of the disclosure controls and procedures, as of the end of the period covered by this report based on such evaluation; and
d) disclosed in this report any change in the registrant’s internal control over financial reporting that occurred during the registrant’s most recentfiscal quarter (the registrant’s fourth fiscal quarter in the case of an annual report) that has materially affected, or is reasonably likely to materially affect, theregistrant’s internal control over financial reporting; and
5. The registrant’s other certifying officer and I have disclosed, based on our most recent evaluation of internal control over financial reporting, to theregistrant’s auditors and the audit committee of the registrant’s board of directors (or persons performing the equivalent functions):
a) all significant deficiencies and material weaknesses in the design or operation of internal control over financial reporting which are reasonablylikely to adversely affect the registrant’s ability to record, process, summarize and report financial information; and
b) any fraud, whether or not material, that involves management or other employees who have a significant role in the registrant’s internalcontrol over financial reporting.
Dated: January 5, 2017 /s/ Mark G. Parker Mark G. Parker Chief Executive Officer

Exhibit 31.2
Certification of Chief Financial OfficerPursuant to Section 302 of the Sarbanes-Oxley Act of 2002
I, Andrew Campion, certify that:
1. I have reviewed this quarterly report on Form 10-Q for the quarter ended November 30, 2016 of NIKE, Inc.;
2. Based on my knowledge, this report does not contain any untrue statement of a material fact or omit to state a material fact necessary to make thestatements made, in light of the circumstances under which such statements were made, not misleading with respect to the period covered by this report;
3. Based on my knowledge, the financial statements, and other financial information included in this report, fairly present in all material respects thefinancial condition, results of operations and cash flows of the registrant as of, and for, the periods presented in this report;
4. The registrant’s other certifying officer and I are responsible for establishing and maintaining disclosure controls and procedures (as defined inExchange Act Rules 13a-15(e) and 15d-15(e)) and internal control over financial reporting (as defined in Exchange Act Rules 13a-15(f) and 15d-15(f)) for theregistrant and have:
a) designed such disclosure controls and procedures, or caused such disclosure controls and procedures to be designed under our supervision, toensure that material information relating to the registrant, including its consolidated subsidiaries, is made known to us by others within those entities, particularlyduring the period in which this report is being prepared;
b) designed such internal control over financial reporting, or caused such internal control over financial reporting to be designed under oursupervision, to provide reasonable assurance regarding the reliability of financial reporting and the preparation of financial statements for external purposes inaccordance with generally accepted accounting principles;
c) evaluated the effectiveness of the registrant’s disclosure controls and procedures and presented in this report our conclusions about theeffectiveness of the disclosure controls and procedures, as of the end of the period covered by this report based on such evaluation; and
d) disclosed in this report any change in the registrant’s internal control over financial reporting that occurred during the registrant’s most recentfiscal quarter (the registrant’s fourth fiscal quarter in the case of an annual report) that has materially affected, or is reasonably likely to materially affect, theregistrant’s internal control over financial reporting; and
5. The registrant’s other certifying officer and I have disclosed, based on our most recent evaluation of internal control over financial reporting, to theregistrant’s auditors and the audit committee of the registrant’s board of directors (or persons performing the equivalent functions):
a) all significant deficiencies and material weaknesses in the design or operation of internal control over financial reporting which are reasonablylikely to adversely affect the registrant’s ability to record, process, summarize and report financial information; and
b) any fraud, whether or not material, that involves management or other employees who have a significant role in the registrant’s internalcontrol over financial reporting.
Dated: January 5, 2017 /s/ Andrew Campion
Andrew CampionChief Financial Officer
Exhibit 32
Pursuant to 18 U.S.C. Section 1350, as adopted pursuant to Section 906 of the Sarbanes-Oxley Act of 2002, the following certifications are being made toaccompany the Registrant’s quarterly report on Form 10-Q for the fiscal quarter ended November 30, 2016 .
Certification of Chief Executive Officer
Pursuant to 18 U.S.C. Section 1350, as adopted pursuant to Section 906 of the Sarbanes-Oxley Act of 2002, the undersigned officer of NIKE, Inc. (the“Company”) hereby certifies, to such officer’s knowledge, that:
(i) the Quarterly Report on Form 10-Q of the Company for the fiscal quarter ended November 30, 2016 (the “Report”) fully complies with the requirementsof Section 13(a) or Section 15(d), as applicable, of the Securities Exchange Act of 1934, as amended; and
(ii) the information contained in the Report fairly presents, in all material respects, the financial condition and results of operations of the Company.
Dated: January 5, 2017 /s/ Mark G. Parker Mark G. Parker Chief Executive Officer

Pursuant to 18 U.S.C. Section 1350, as adopted pursuant to Section 906 of the Sarbanes-Oxley Act of 2002, the following certifications are being made toaccompany the Registrant’s quarterly report on Form 10-Q for the fiscal quarter ended November 30, 2016 .
Certification of Chief Financial Officer
Pursuant to 18 U.S.C. Section 1350, as adopted pursuant to Section 906 of the Sarbanes-Oxley Act of 2002, the undersigned officer of NIKE, Inc. (the“Company”) hereby certifies, to such officer’s knowledge, that:
(i) the Quarterly Report on Form 10-Q of the Company for the fiscal quarter ended November 30, 2016 (the “Report”) fully complies with the requirementsof Section 13(a) or Section 15(d), as applicable, of the Securities Exchange Act of 1934, as amended; and
(ii) the information contained in the Report fairly presents, in all material respects, the financial condition and results of operations of the Company.
Dated: January 5, 2017 /s/ Andrew Campion
Andrew CampionChief Financial Officer