nimsoft monitor xendesktop guidedocs.nimsoft.com/prodhelp/zh/probes/catalog/xendesktop/2.0/...6...
TRANSCRIPT
xendesktop Guide v2.0 series
Nimsoft® Monitor™
Legal Notices Copyright © 2013, CA. All rights reserved.
Warranty
The material contained in this document is provided "as is," and is subject to being changed, without notice, in future editions. Further, to the maximum extent permitted by applicable law, Nimsoft LLC disclaims all warranties, either express or implied, with regard to this manual and any information contained herein, including but not limited to the implied warranties of merchantability and fitness for a particular purpose. Nimsoft LLC shall not be liable for errors or for incidental or consequential damages in connection with the furnishing, use, or performance of this document or of any information contained herein. Should Nimsoft LLC and the user have a separate written agreement with warranty terms covering the material in this document that conflict with these terms, the warranty terms in the separate agreement shall control.
Technology Licenses
The hardware and/or software described in this document are furnished under a license and may be used or copied only in accordance with the terms of such license.
No part of this manual may be reproduced in any form or by any means (including electronic storage and retrieval or translation into a foreign language) without prior agreement and written consent from Nimsoft LLC as governed by United States and international copyright laws.
Restricted Rights Legend
If software is for use in the performance of a U.S. Government prime contract or subcontract, Software is delivered and licensed as "Commercial computer software" as defined in DFAR 252.227-7014 (June 1995), or as a "commercial item" as defined in FAR 2.101(a) or as "Restricted computer software" as defined in FAR 52.227-19 (June 1987) or any equivalent agency regulation or contract clause. Use, duplication or disclosure of Software is subject to Nimsoft LLC’s standard commercial license terms, and non-DOD Departments and Agencies of the U.S. Government will receive no greater than Restricted Rights as defined in FAR 52.227-19(c)(1-2) (June 1987). U.S. Government users will receive no greater than Limited Rights as defined in FAR 52.227-14 (June 1987) or DFAR 252.227-7015 (b)(2) (November 1995), as applicable in any technical data.
Trademarks
Nimsoft is a trademark of CA.
Adobe®, Acrobat®, Acrobat Reader®, and Acrobat Exchange® are registered trademarks of Adobe Systems Incorporated.
Intel® and Pentium® are U.S. registered trademarks of Intel Corporation.
Java(TM) is a U.S. trademark of Sun Microsystems, Inc.
Microsoft® and Windows® are U.S. registered trademarks of Microsoft Corporation.
Netscape(TM) is a U.S. trademark of Netscape Communications Corporation.
Oracle® is a U.S. registered trademark of Oracle Corporation, Redwood City, California.
UNIX® is a registered trademark of the Open Group.
ITIL® is a Registered Trade Mark of the Office of Government Commerce in the United Kingdom and other countries.
All other trademarks, trade names, service marks and logos referenced herein belong to their respective companies.
For information on licensed and public domain software, see the Nimsoft Monitor Third-Party Licenses and Terms of Use document at: http://docs.nimsoft.com/prodhelp/en_US/Library/index.htm?toc.htm?1981724.html.
Contact CA Nimsoft
Contact CA Support
For your convenience, CA Technologies provides one site where you can access the information that you need for your Home Office, Small Business, and Enterprise CA Technologies products. At http://ca.com/support, you can access the following resources:
■ Online and telephone contact information for technical assistance and customer services
■ Information about user communities and forums
■ Product and documentation downloads
■ CA Support policies and guidelines
■ Other helpful resources appropriate for your product
Providing Feedback About Product Documentation
Send comments or questions about CA Technologies Nimsoft product documentation to [email protected].
To provide feedback about general CA Technologies product documentation, complete our short customer survey which is available on the CA Support website at http://ca.com/docs.

Contents 5
Contents
Chapter 1: xendesktop 2.0 7
Overview ...................................................................................................................................................................... 7
Document History [2.0] ................................................................................................................................................ 7
Chapter 2: xendesktop Probe Deployment 9
Requirements ............................................................................................................................................................... 9
Prerequisites ......................................................................................................................................................... 9
Hardware Requirements ....................................................................................................................................... 9
Software Requirements ...................................................................................................................................... 10
Supported Platforms ........................................................................................................................................... 10
Probe Deployment Information ................................................................................................................................. 10
Chapter 3: xendesktop Probe Configuration 11
Probe Configuration Interface Installation ................................................................................................................. 11
Monitoring Capabilities .............................................................................................................................................. 12
Templates ................................................................................................................................................................... 12
Probe GUI ................................................................................................................................................................... 12
Configuration Interface Navigation ..................................................................................................................... 13
The Toolbar Buttons ............................................................................................................................................ 13
The Navigation (Left) Pane .................................................................................................................................. 13
The Content (Right) Pane .................................................................................................................................... 15
Probe Configuration ................................................................................................................................................... 16
Connecting to the XenDesktop Environment ...................................................................................................... 16
General Setup ..................................................................................................................................................... 26
Create a New Resource ....................................................................................................................................... 26
Message Pool Manager ....................................................................................................................................... 28
Create New Template ......................................................................................................................................... 29
Advanced Configuration ...................................................................................................................................... 30
Chapter 4: Adding Monitors 33
Manually Selecting Monitors to be Measured .................................................................................................... 33
Using Templates .................................................................................................................................................. 36
Using Automatic Configurations ......................................................................................................................... 37
6 xendesktop Guide
Appendix A: Troubleshooting 41
Probe is Not Collecting Data ...................................................................................................................................... 41
Out of Memory Errors ................................................................................................................................................ 42
Chapter 1: xendesktop 2.0 7
Chapter 1: xendesktop 2.0
This description applies to the xendesktop probe version 2.0.
This section contains the following topics:
Overview (see page 7) Document History [2.0] (see page 7)
Overview
The CA Nimsoft xendesktop monitoring probe automates all common monitoring and data collection tasks in the Citrix XenDesktop virtual desktop environment.
The xendesktop probe collects and stores data about desktop groups, desktop catalogs, and the hypervisor hosts and virtual machines that power the desktop, along with their relationships. Within a XenDesktop environment you can monitor multiple desktop delivery controllers (DDCs). This can be either multiple DDCs that you have access permissions for or multiple DDCs with a common access in a high availability configuration.
The probe collects QoS metrics for real-time status and for display in charts, dashboards, and historical reports. You can define alarms to be issued and propagated to the Alarm Console when specified thresholds are breached.
Document History [2.0]
This table describes the version history for this document.
Version Date What's New?
2.0 Beta September 2013
Updated documentation to reflect monitoring of clustered XenDesktop environments and support for additional virtual desktop and usage metrics.
1.0 December 2012 Initial Release
Note: Serial releases within a version do not affect the documentation for the series. For example, v1.0 documentation would apply to release 1.01.

Document History [2.0]
8 xendesktop Guide
Related Documentation
Documentation for other versions of the xendesktop probe
The Release Notes for the xendesktop probe
Monitor Metrics Reference Information for CA Nimsoft Probes (http://docs.nimsoft.com/prodhelp/en_US/Probes/ProbeReference/index.htm)
Chapter 2: xendesktop Probe Deployment 9
Chapter 2: xendesktop Probe Deployment
This section contains information about deploying the xendesktop probe.
This section contains the following topics:
Requirements (see page 9) Probe Deployment Information (see page 10)
Requirements
This section describes prerequisites, hardware requirements, and software requirements for the xendesktop probe.
Prerequisites
This section describes the prerequisites for this probe:
■ XenDesktop version 5.6 or later environment.
■ Windows PowerShell command line interface on the XenDesktop Delivery Controller (DDC) server. The latest version of PowerShell that comes with Windows Server 2008R2 or later is required. For information on configuring PowerShell for use with the xendesktop probe, see the xendesktop Guide.
■ Windows Remote Management (WinRM) enabled on the DDC server. For instructions on enabling WinRM, see the xendesktop Guide.
Hardware Requirements
The xendesktop probe should be installed on a system with the following minimum resources:
■ Memory: 2-4 GB of RAM
■ CPU: 3 GHz dual-core processor, 32-bit or 64-bit
Probe Deployment Information
10 xendesktop Guide
Software Requirements
The xendesktop probe requires the following software environment:
■ Nimsoft Monitor Server 5.1.1 or later
■ Nimsoft Robot 5.23 or later
■ Java Virtual Machine 1.6 or later (typically installed with NMS 5.0 and later)
■ Infrastructure Manager 4.02 or later
■ Microsoft .NET Framework 3.5 on the system where the Infrastructure Manager application is running
Important!: On 64-bit Linux systems, the Java jre included in the xendesktop probe package does not install successfully when you deploy the xendesktop probe on a CA Nimsoft robot. You must manually install the glibc.i686 library or compatible 32-bit libraries on 64-bit Linux systems where you deploy the xendesktop probe.
Supported Platforms
The xendesktop probe supports the same set of operating systems and databases as supported by the Nimsoft Server solution. Please refer to the Nimsoft Compatibility Support Matrix for the latest information on supported platforms.
See also the Support Matrix for Nimsoft Probes, for additional specific information on the xendesktop probe.
Probe Deployment Information
There are two ways to distribute the probe archive packages. You can distribute the package within Infrastructure Manager or use the standalone Nimsoft Distribution application.
Chapter 3: xendesktop Probe Configuration 11
Chapter 3: xendesktop Probe Configuration
This section describes the configuration concepts and procedures for setting up the xendesktop probe.
After installing the xendesktop probe, you must define what to monitor. At a high level there are three steps:
1. Connect to the XenDesktop DDC server environment.
2. Add monitors (checkpoints). See the description in the section Adding Monitors (see page 33).
3. Configure the properties for the checkpoints, in which you define QoS data, and define alarms to be sent if specified thresholds are breached.
Note: You must click the Apply button to activate any configuration changes made in the xendesktop Probe Configuration Window.
This section contains the following topics:
Probe Configuration Interface Installation (see page 11) Monitoring Capabilities (see page 12) Templates (see page 12) Probe GUI (see page 12) Probe Configuration (see page 16) Adding Monitors (see page 33)
Probe Configuration Interface Installation
The probe configuration interface is automatically downloaded and installed by the Nimsoft Infrastructure Manager when the probe is deployed on a robot.
Monitoring Capabilities
12 xendesktop Guide
Monitoring Capabilities
The following XenDesktop components can be monitored:
■ Sites
■ Administrators
■ Controllers
■ Desktop Catalogs
■ Desktop Groups
■ Desktops
■ Hypervisors
■ Machines (VMs)
■ Health Info of Controllers
■ License Server
Templates
Templates allow you to define reusable sets of monitors to apply to XenDesktop components. After you create a template and add monitors (checkpoints) to the template, do one of the following:
■ Drag-and-drop the template onto the XenDesktop component you want to apply the template to. This creates a static monitor for that component and its children (recursively) based on the template contents at the time the static monitor is created.
■ Drag-and-drop the template into the Auto Configuration node to add the template contents to the list of auto configuration monitors.
See the section Using Templates (see page 36) for details.
Probe GUI
This section contains the basic GUI information for the xendesktop probe.
The xendesktop probe collects and stores data and information from the monitored components with a XenDesktop DDC server environment about all virtual desktops.
Double-click the line representing the xendesktop probe in the Infrastructure Manager to launch the xendesktop probe configuration interface. It initially appears with the Resources hierarchy empty.
Probe GUI
Chapter 3: xendesktop Probe Configuration 13
Configuration Interface Navigation
The configuration interface consists of a row of tool buttons above a window split into two parts:
■ The Navigation pane
■ The Content pane
In addition, a status bar at the bottom of the window shows version information and date and time when the probe was last started.
The Toolbar Buttons
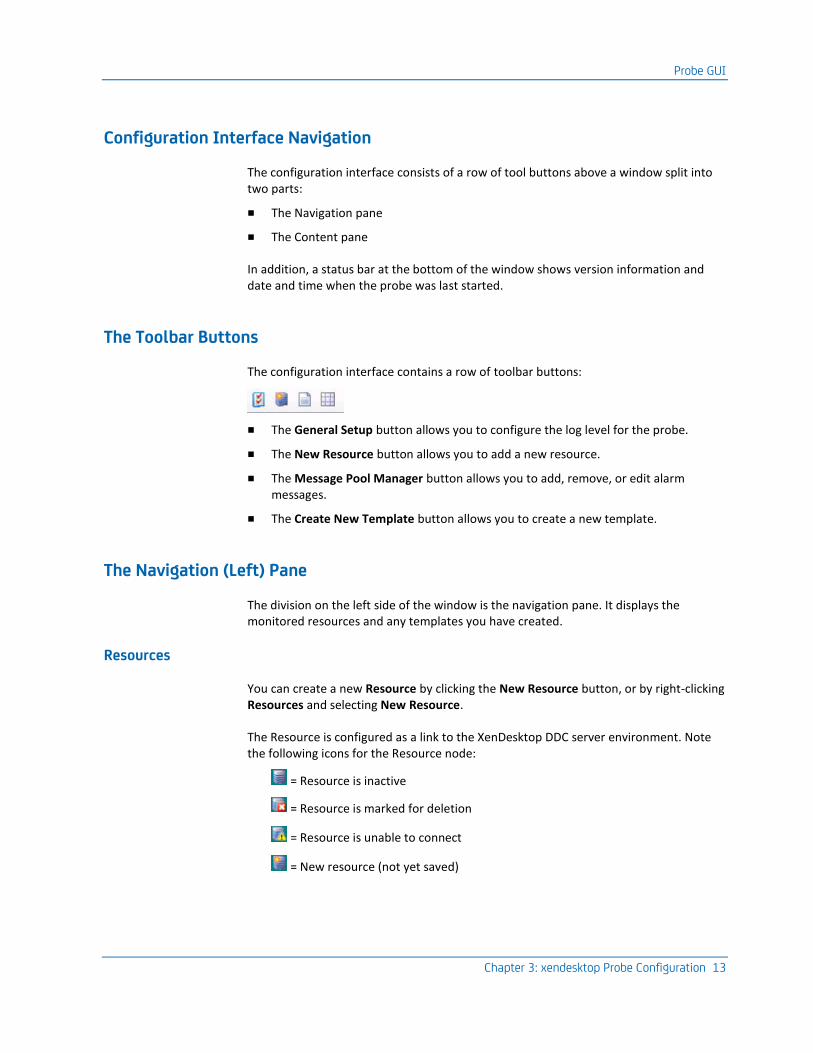
The configuration interface contains a row of toolbar buttons:
■ The General Setup button allows you to configure the log level for the probe.
■ The New Resource button allows you to add a new resource.
■ The Message Pool Manager button allows you to add, remove, or edit alarm messages.
■ The Create New Template button allows you to create a new template.
The Navigation (Left) Pane
The division on the left side of the window is the navigation pane. It displays the monitored resources and any templates you have created.
Resources
You can create a new Resource by clicking the New Resource button, or by right-clicking Resources and selecting New Resource.
The Resource is configured as a link to the XenDesktop DDC server environment. Note the following icons for the Resource node:
= Resource is inactive
= Resource is marked for deletion
= Resource is unable to connect
= New resource (not yet saved)
Probe GUI
14 xendesktop Guide
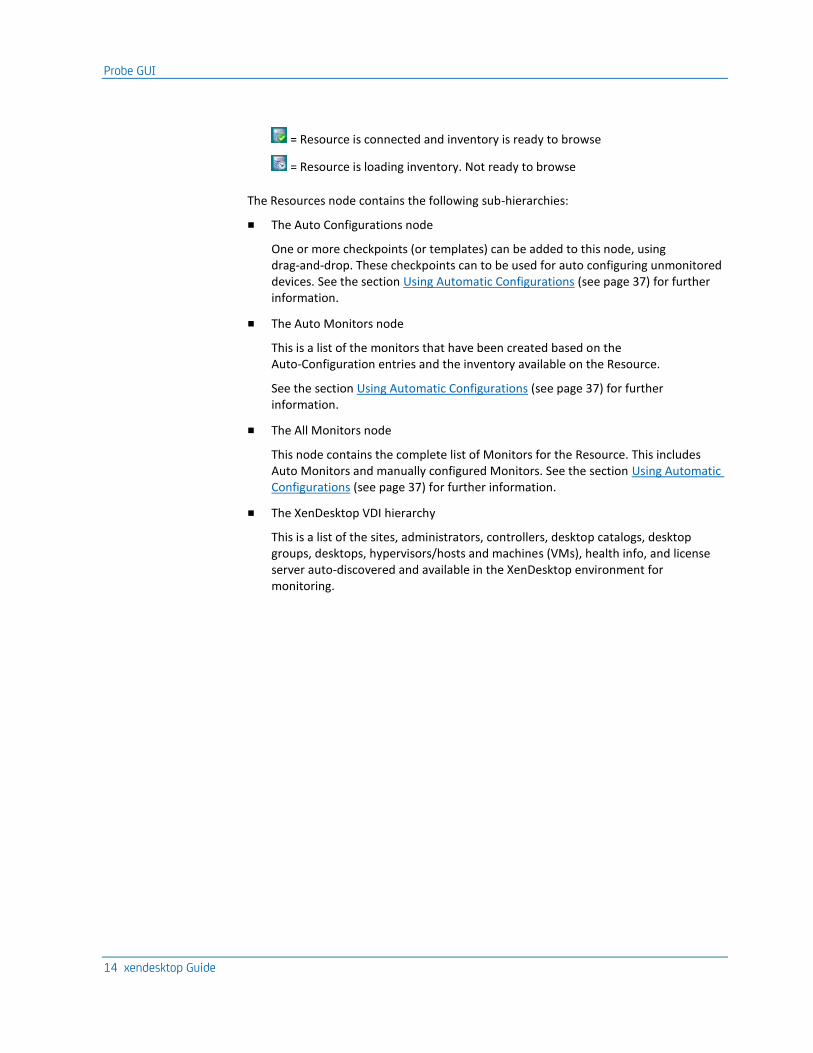
= Resource is connected and inventory is ready to browse
= Resource is loading inventory. Not ready to browse
The Resources node contains the following sub-hierarchies:
■ The Auto Configurations node
One or more checkpoints (or templates) can be added to this node, using drag-and-drop. These checkpoints can to be used for auto configuring unmonitored devices. See the section Using Automatic Configurations (see page 37) for further information.
■ The Auto Monitors node
This is a list of the monitors that have been created based on the Auto-Configuration entries and the inventory available on the Resource.
See the section Using Automatic Configurations (see page 37) for further information.
■ The All Monitors node
This node contains the complete list of Monitors for the Resource. This includes Auto Monitors and manually configured Monitors. See the section Using Automatic Configurations (see page 37) for further information.
■ The XenDesktop VDI hierarchy
This is a list of the sites, administrators, controllers, desktop catalogs, desktop groups, desktops, hypervisors/hosts and machines (VMs), health info, and license server auto-discovered and available in the XenDesktop environment for monitoring.
Probe GUI
Chapter 3: xendesktop Probe Configuration 15
Templates
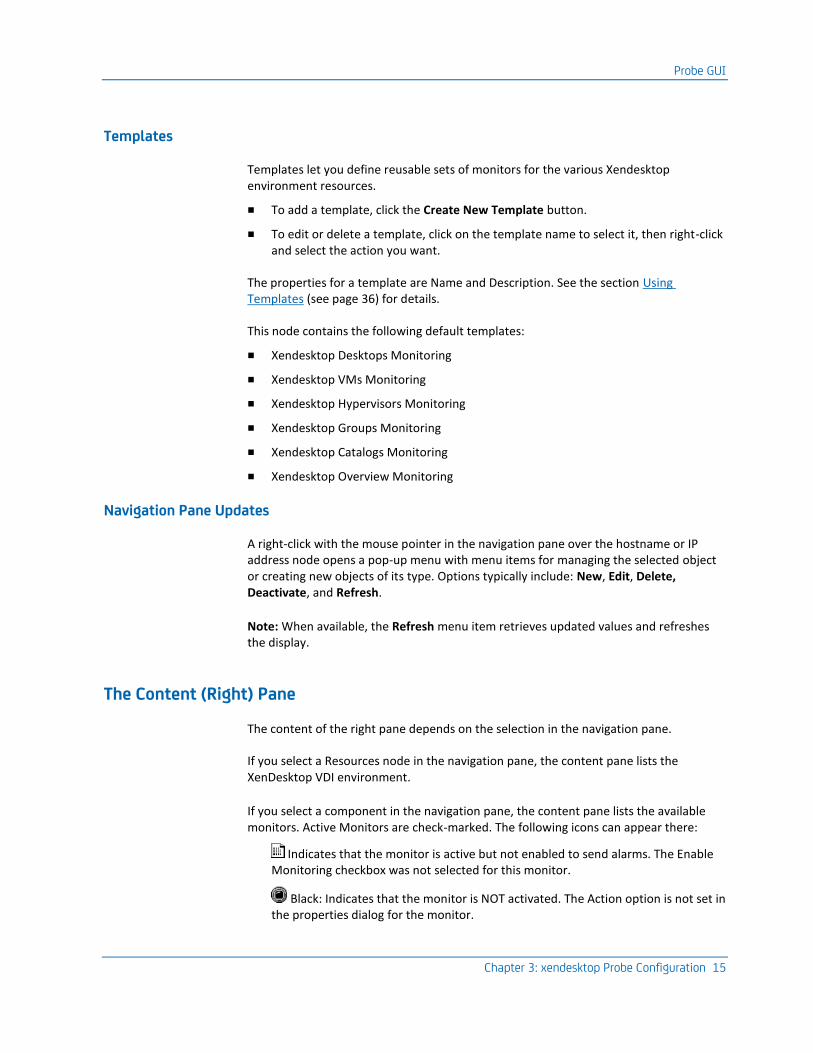
Templates let you define reusable sets of monitors for the various Xendesktop environment resources.
■ To add a template, click the Create New Template button.
■ To edit or delete a template, click on the template name to select it, then right-click and select the action you want.
The properties for a template are Name and Description. See the section Using Templates (see page 36) for details.
This node contains the following default templates:
■ Xendesktop Desktops Monitoring
■ Xendesktop VMs Monitoring
■ Xendesktop Hypervisors Monitoring
■ Xendesktop Groups Monitoring
■ Xendesktop Catalogs Monitoring
■ Xendesktop Overview Monitoring
Navigation Pane Updates
A right-click with the mouse pointer in the navigation pane over the hostname or IP address node opens a pop-up menu with menu items for managing the selected object or creating new objects of its type. Options typically include: New, Edit, Delete, Deactivate, and Refresh.
Note: When available, the Refresh menu item retrieves updated values and refreshes the display.
The Content (Right) Pane
The content of the right pane depends on the selection in the navigation pane.
If you select a Resources node in the navigation pane, the content pane lists the XenDesktop VDI environment.
If you select a component in the navigation pane, the content pane lists the available monitors. Active Monitors are check-marked. The following icons can appear there:
Indicates that the monitor is active but not enabled to send alarms. The Enable Monitoring checkbox was not selected for this monitor.
Black: Indicates that the monitor is NOT activated. The Action option is not set in the properties dialog for the monitor.
Probe Configuration
16 xendesktop Guide
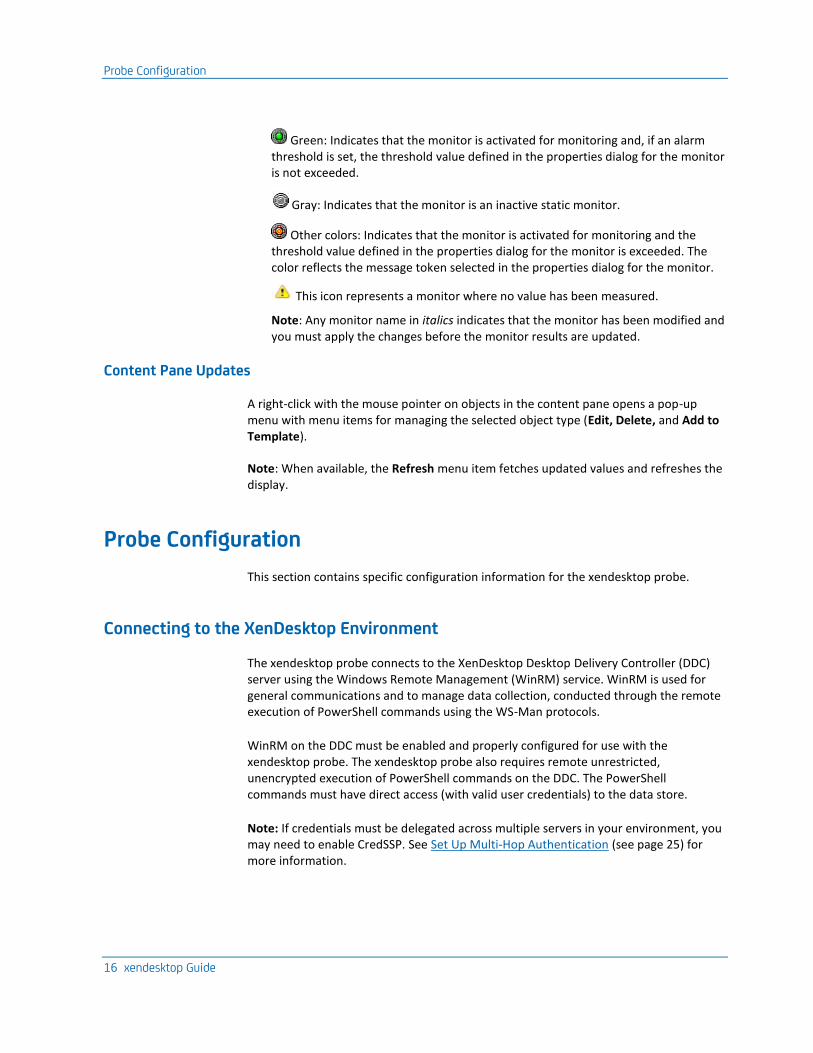
Green: Indicates that the monitor is activated for monitoring and, if an alarm threshold is set, the threshold value defined in the properties dialog for the monitor is not exceeded.
Gray: Indicates that the monitor is an inactive static monitor.
Other colors: Indicates that the monitor is activated for monitoring and the threshold value defined in the properties dialog for the monitor is exceeded. The color reflects the message token selected in the properties dialog for the monitor.
This icon represents a monitor where no value has been measured.
Note: Any monitor name in italics indicates that the monitor has been modified and you must apply the changes before the monitor results are updated.
Content Pane Updates
A right-click with the mouse pointer on objects in the content pane opens a pop-up menu with menu items for managing the selected object type (Edit, Delete, and Add to Template).
Note: When available, the Refresh menu item fetches updated values and refreshes the display.
Probe Configuration
This section contains specific configuration information for the xendesktop probe.
Connecting to the XenDesktop Environment
The xendesktop probe connects to the XenDesktop Desktop Delivery Controller (DDC) server using the Windows Remote Management (WinRM) service. WinRM is used for general communications and to manage data collection, conducted through the remote execution of PowerShell commands using the WS-Man protocols.
WinRM on the DDC must be enabled and properly configured for use with the xendesktop probe. The xendesktop probe also requires remote unrestricted, unencrypted execution of PowerShell commands on the DDC. The PowerShell commands must have direct access (with valid user credentials) to the data store.
Note: If credentials must be delegated across multiple servers in your environment, you may need to enable CredSSP. See Set Up Multi-Hop Authentication (see page 25) for more information.
Probe Configuration
Chapter 3: xendesktop Probe Configuration 17
PowerShell must also be installed on the system where the xendesktop probe is running (not the system running the probe configuration GUI, which typically talks to the head-less probe remotely).
The xendesktop probe requires account access to the following applications/databases:
■ Local Administrator user access to the DDC server remotely over the port specified for WinRM (the default is 5985). Ensure that you use the local Administrator account and not the domain administrator account because the system where the xendesktop probe is deployed may be in a different domain.
■ One of the following:
■ Configuration of WinRM on the DDC to allow remote access via a WinRM listener on HTTP.
■ If SSL is used for communication between the robot system and the DDC, configuration of WinRM on the DDC to use the HTTPS connection type. You will need the keystore location and keystore password to enter in the xendesktop probe Edit Resource dialog.
The following sections provide more details on how to set up the connection from the xendesktop probe system to the DDC, and how to troubleshoot connection issues.
Probe Configuration
18 xendesktop Guide
Install the PowerShell Snap-In
Install the PowerShell Snap-In (McliPSSnapIn.dll) using the DDC console installer.
If the Snap-In later needs to be registered in PowerShell, run one of the following commands at the DOS command prompt:
Note: Modify these commands to refer to the location of the Installutil.exe file in .NET Framework on your system.
For 32-bit
%systemroot%\Microsoft.NET\Framework\v2.0.50727\installutil.exe McliPSSnapIn.dll
For 64-bit
%systemroot%\Microsoft.NET\Framework64\v2.0.50727\installutil.exe
McliPSSnapIn.dll
You can also register the Snap-In by running one of the following commands at the PowerShell command prompt:
For 32-bit
$installutil = $env:systemroot +
'\Microsoft.NET\Framework\v2.0.50727\installutil.exe'&$installutil
McliPSSnapIn.dll
For 64-bit
$installutil = $env:systemroot +
'\Microsoft.NET\Framework64\v2.0.50727\installutil.exe'&$installutil
McliPSSnapIn.dll
Probe Configuration
Chapter 3: xendesktop Probe Configuration 19
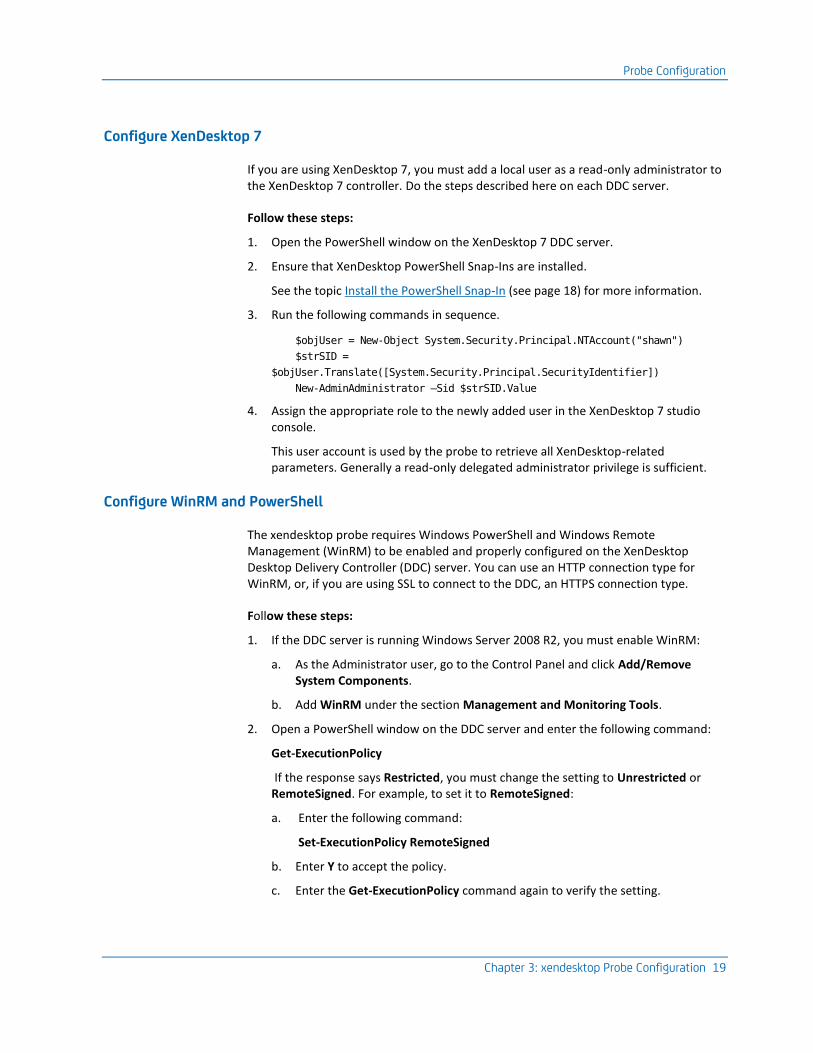
Configure XenDesktop 7
If you are using XenDesktop 7, you must add a local user as a read-only administrator to the XenDesktop 7 controller. Do the steps described here on each DDC server.
Follow these steps:
1. Open the PowerShell window on the XenDesktop 7 DDC server.
2. Ensure that XenDesktop PowerShell Snap-Ins are installed.
See the topic Install the PowerShell Snap-In (see page 18) for more information.
3. Run the following commands in sequence.
$objUser = New-Object System.Security.Principal.NTAccount("shawn")
$strSID =
$objUser.Translate([System.Security.Principal.SecurityIdentifier])
New-AdminAdministrator –Sid $strSID.Value
4. Assign the appropriate role to the newly added user in the XenDesktop 7 studio console.
This user account is used by the probe to retrieve all XenDesktop-related parameters. Generally a read-only delegated administrator privilege is sufficient.
Configure WinRM and PowerShell
The xendesktop probe requires Windows PowerShell and Windows Remote Management (WinRM) to be enabled and properly configured on the XenDesktop Desktop Delivery Controller (DDC) server. You can use an HTTP connection type for WinRM, or, if you are using SSL to connect to the DDC, an HTTPS connection type.
Follow these steps:
1. If the DDC server is running Windows Server 2008 R2, you must enable WinRM:
a. As the Administrator user, go to the Control Panel and click Add/Remove System Components.
b. Add WinRM under the section Management and Monitoring Tools.
2. Open a PowerShell window on the DDC server and enter the following command:
Get-ExecutionPolicy
If the response says Restricted, you must change the setting to Unrestricted or RemoteSigned. For example, to set it to RemoteSigned:
a. Enter the following command:
Set-ExecutionPolicy RemoteSigned
b. Enter Y to accept the policy.
c. Enter the Get-ExecutionPolicy command again to verify the setting.
Probe Configuration
20 xendesktop Guide
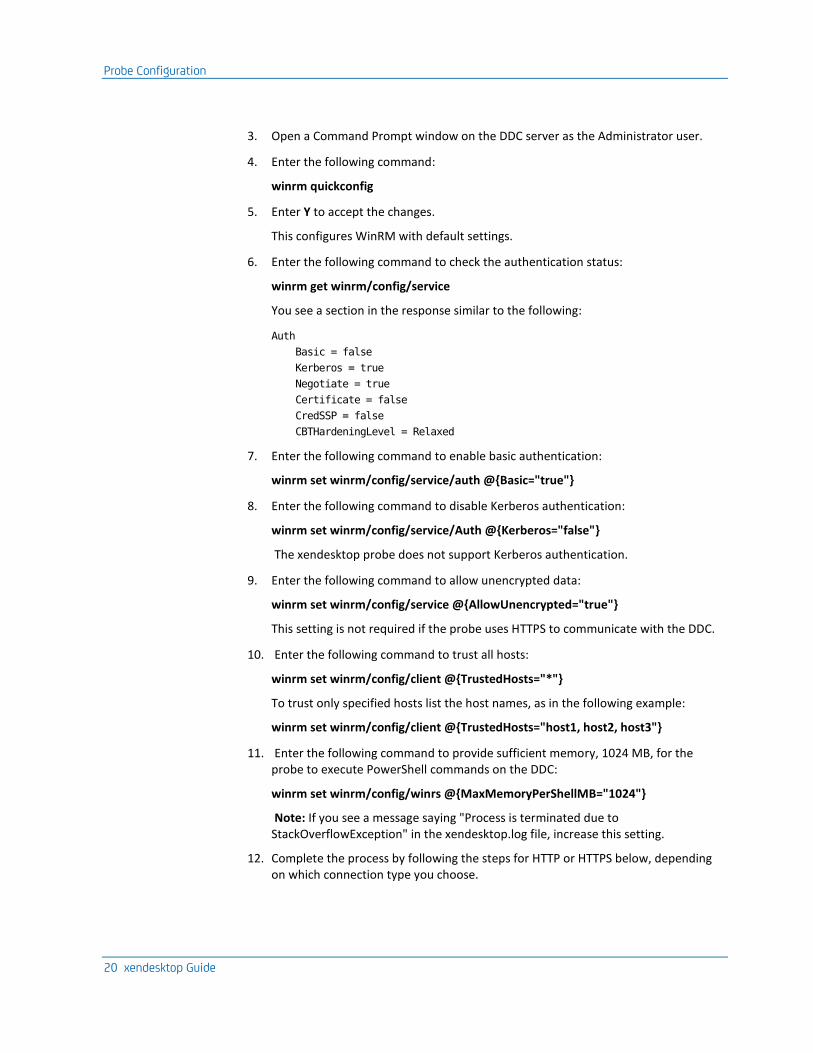
3. Open a Command Prompt window on the DDC server as the Administrator user.
4. Enter the following command:
winrm quickconfig
5. Enter Y to accept the changes.
This configures WinRM with default settings.
6. Enter the following command to check the authentication status:
winrm get winrm/config/service
You see a section in the response similar to the following:
Auth
Basic = false
Kerberos = true
Negotiate = true
Certificate = false
CredSSP = false
CBTHardeningLevel = Relaxed
7. Enter the following command to enable basic authentication:
winrm set winrm/config/service/auth @{Basic="true"}
8. Enter the following command to disable Kerberos authentication:
winrm set winrm/config/service/Auth @{Kerberos="false"}
The xendesktop probe does not support Kerberos authentication.
9. Enter the following command to allow unencrypted data:
winrm set winrm/config/service @{AllowUnencrypted="true"}
This setting is not required if the probe uses HTTPS to communicate with the DDC.
10. Enter the following command to trust all hosts:
winrm set winrm/config/client @{TrustedHosts="*"}
To trust only specified hosts list the host names, as in the following example:
winrm set winrm/config/client @{TrustedHosts="host1, host2, host3"}
11. Enter the following command to provide sufficient memory, 1024 MB, for the probe to execute PowerShell commands on the DDC:
winrm set winrm/config/winrs @{MaxMemoryPerShellMB="1024"}
Note: If you see a message saying "Process is terminated due to StackOverflowException" in the xendesktop.log file, increase this setting.
12. Complete the process by following the steps for HTTP or HTTPS below, depending on which connection type you choose.
Probe Configuration
Chapter 3: xendesktop Probe Configuration 21
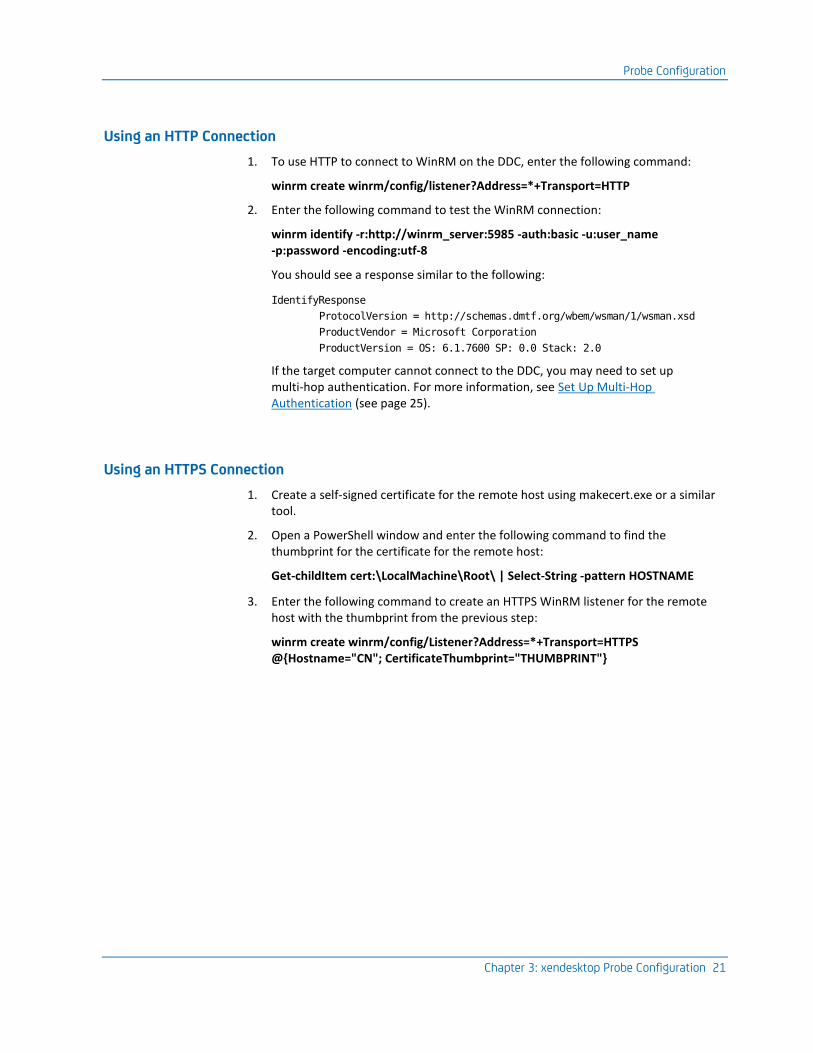
Using an HTTP Connection
1. To use HTTP to connect to WinRM on the DDC, enter the following command:
winrm create winrm/config/listener?Address=*+Transport=HTTP
2. Enter the following command to test the WinRM connection:
winrm identify -r:http://winrm_server:5985 -auth:basic -u:user_name -p:password -encoding:utf-8
You should see a response similar to the following:
IdentifyResponse
ProtocolVersion = http://schemas.dmtf.org/wbem/wsman/1/wsman.xsd
ProductVendor = Microsoft Corporation
ProductVersion = OS: 6.1.7600 SP: 0.0 Stack: 2.0
If the target computer cannot connect to the DDC, you may need to set up multi-hop authentication. For more information, see Set Up Multi-Hop Authentication (see page 25).
Using an HTTPS Connection
1. Create a self-signed certificate for the remote host using makecert.exe or a similar tool.
2. Open a PowerShell window and enter the following command to find the thumbprint for the certificate for the remote host:
Get-childItem cert:\LocalMachine\Root\ | Select-String -pattern HOSTNAME
3. Enter the following command to create an HTTPS WinRM listener for the remote host with the thumbprint from the previous step:
winrm create winrm/config/Listener?Address=*+Transport=HTTPS @{Hostname="CN"; CertificateThumbprint="THUMBPRINT"}
Probe Configuration
22 xendesktop Guide
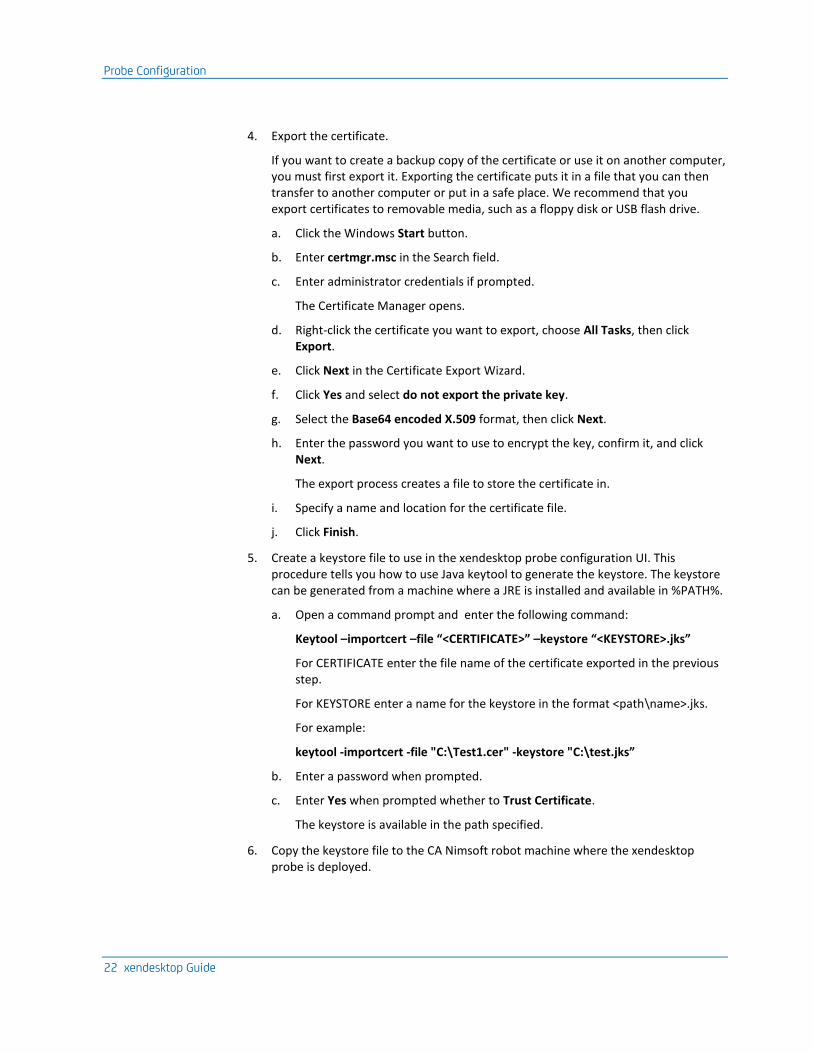
4. Export the certificate.
If you want to create a backup copy of the certificate or use it on another computer, you must first export it. Exporting the certificate puts it in a file that you can then transfer to another computer or put in a safe place. We recommend that you export certificates to removable media, such as a floppy disk or USB flash drive.
a. Click the Windows Start button.
b. Enter certmgr.msc in the Search field.
c. Enter administrator credentials if prompted.
The Certificate Manager opens.
d. Right-click the certificate you want to export, choose All Tasks, then click Export.
e. Click Next in the Certificate Export Wizard.
f. Click Yes and select do not export the private key.
g. Select the Base64 encoded X.509 format, then click Next.
h. Enter the password you want to use to encrypt the key, confirm it, and click Next.
The export process creates a file to store the certificate in.
i. Specify a name and location for the certificate file.
j. Click Finish.
5. Create a keystore file to use in the xendesktop probe configuration UI. This procedure tells you how to use Java keytool to generate the keystore. The keystore can be generated from a machine where a JRE is installed and available in %PATH%.
a. Open a command prompt and enter the following command:
Keytool –importcert –file “<CERTIFICATE>” –keystore “<KEYSTORE>.jks”
For CERTIFICATE enter the file name of the certificate exported in the previous step.
For KEYSTORE enter a name for the keystore in the format <path\name>.jks.
For example:
keytool -importcert -file "C:\Test1.cer" -keystore "C:\test.jks”
b. Enter a password when prompted.
c. Enter Yes when prompted whether to Trust Certificate.
The keystore is available in the path specified.
6. Copy the keystore file to the CA Nimsoft robot machine where the xendesktop probe is deployed.
Probe Configuration
Chapter 3: xendesktop Probe Configuration 23
7. In the xendesktop probe configuration GUI, edit (or create if necessary) the resource that represents the DDC server:
a. Double-click the line representing the xendesktop probe in Infrastructure Manager to launch the xendesktop probe configuration GUI.
b. Right-click on the resource for the DDC server and choose Edit Resource.
c. Click the Use SSL check box.
d. Enter the appropriate information in the Keystore Location and Keystore Password fields.
e. Click OK.
More information:
Create a New Resource (see page 26)
Troubleshooting Connection Issues
This section contains troubleshooting steps you can take if the xendesktop probe is unable to connect to the XenDesktop DDC server and no data is collected.
Verify the WinRM Connection
If no data is displayed in the xendesktop probe GUI, follow these steps:
1. Verify that the WinRM service is running on the XenDesktop DDC server.
2. Review the WinRM configuration details for any problems by entering the following command at the Command Prompt on the XenDesktop DDC server:
winrm get winrm/config
3. Verify that the correct port is assigned to Win RM on the XenDesktop DDC server.
The port number is listed under Default Ports in the output for the previous step. The default is 5985.
Probe Configuration
24 xendesktop Guide
Verify PowerShell Access
If the xendesktop probe cannot connect to the XenDesktop server, it may be because remote access to PowerShell on the XenDesktop DDC server is restricted. Verify that the correct access is set for PowerShell on the DDC server.
Follow these steps:
1. Open a PowerShell window on the DDC server and enter the following command:
Get-ExecutionPolicy
If the response says Restricted, you must change the setting to Unrestricted or RemoteSigned. For example, to set it to RemoteSigned:
a. Enter the following command:
Set-ExecutionPolicy RemoteSigned
b. Enter Y to accept the policy.
c. Enter the Get-ExecutionPolicy command again to verify the setting.
Probe Configuration
Chapter 3: xendesktop Probe Configuration 25
Set Up Multi-Hop Authentication
If the xendesktop probe cannot connect to the XenDesktop server, it may be because credentials must be delegated across multiple remote computers in your environment. In this case, you must configure WinRM to use Credential Security Service Provider (CredSSP) to provide multi-hop support for authentication. Kerberos delegation is not supported by the xendesktop probe.
Follow these steps:
1. Enable CredSSP on the WinRM client system, either by setting it manually or through a Group Policy setting.
To set it manually enter the following command:
winrm set winrm/config/client/auth '@{CredSSP="true"}'
To set it through a Group Policy, follow these steps:
a. Enter the following command in a Command Prompt window to open the Group Policy dialog:
gpedit.msc
b. Navigate to Computer Configuration\Administrative Templates\Windows Components\Windows Remote Management (WinRM)\WinRM Client.
c. Double-click on the Allow CredSSP authentication policy in the right pane to open its configuration dialog.
d. Edit the policy as necessary.
2. Enable CredSSP on the WinRM service, either by setting it manually or through a Group Policy setting.
To set it manually enter the following command:
winrm set winrm/config/service/auth '@{CredSSP="true"}'
To set it through a Group Policy, follow these steps:
a. Enter the following command in a Command Prompt window to open the Group Policy dialog:
gpedit.msc
b. Navigate to Computer Configuration\Administrative Templates\Windows Components\Windows Remote Management (WinRM)\WinRM Service.
c. Double-click on the Allow CredSSP authentication policy in the right pane to open its configuration dialog.
d. Edit the policy as necessary.
Probe Configuration
26 xendesktop Guide
General Setup
Click the General Setup button to set the level of details written to the log file for the xendesktop probe.
Log as little as possible during normal operation to minimize disk consumption. This is a sliding scale, with the level of information logged ranging from fatal errors only to extremely detailed information used for debugging.
Click the Apply button to implement the new log level immediately.
Note: The probe allows you to change the log level without restarting the probe.
Create a New Resource
There are two ways to create a Resource:
■ Click the New Resource button on the toolbar.
■ Right click Resources in the navigation pane and select New Resource.
The Resource (New) dialog box appears. Enter the appropriate field information:
Hostname or IP Address
The hostname or IP address of the XenDesktop DDC server system. For a clustered DDC server environment, you can specify any controller name that is part of the cluster.
Port
The port number for the XenDesktop DDC server PowerShell environment. Default is 5985.
Active
Select this checkbox to activate or deactivate monitoring of the resource.
Username
A valid user with administrative privileges that the probe will use to log on to the XenDesktop DDC server environment.
Password
Password for the specified user name.
Use SSL
Enables SSL communication between the xendesktop probe and the DDC server. Check this box if you are using the HTTPS connection type for WinRM on the DDC server. Selecting this option enables the following two fields.
Probe Configuration
Chapter 3: xendesktop Probe Configuration 27
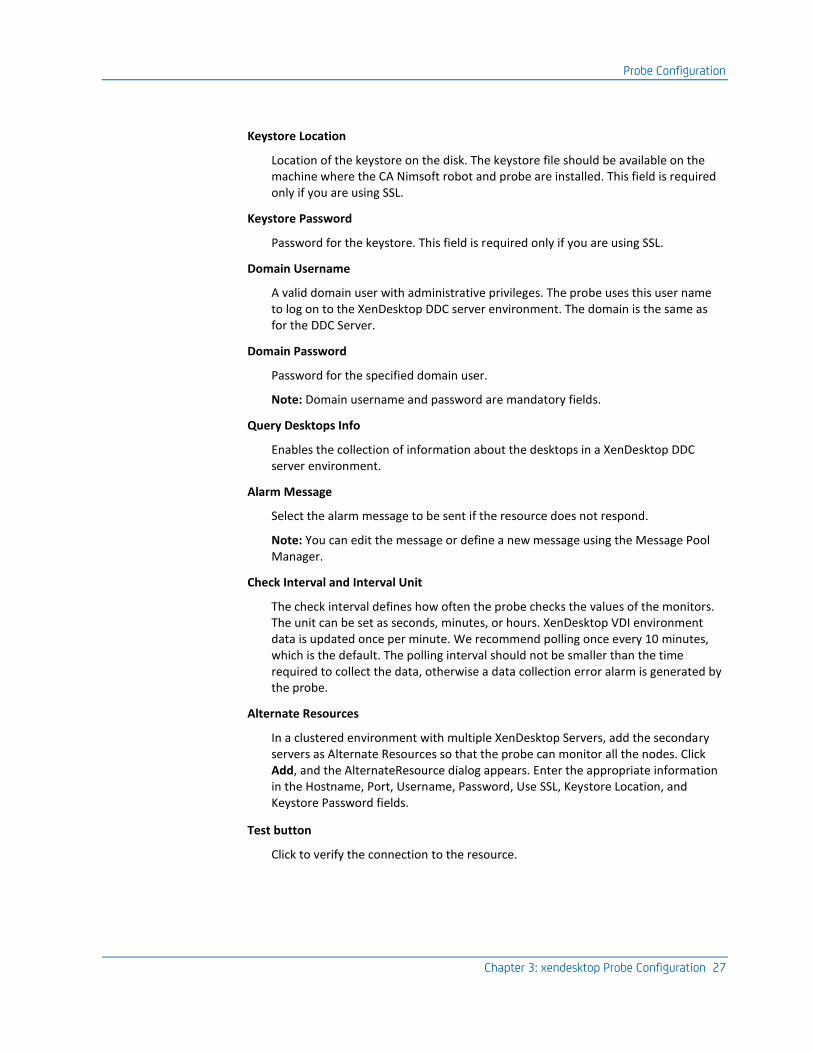
Keystore Location
Location of the keystore on the disk. The keystore file should be available on the machine where the CA Nimsoft robot and probe are installed. This field is required only if you are using SSL.
Keystore Password
Password for the keystore. This field is required only if you are using SSL.
Domain Username
A valid domain user with administrative privileges. The probe uses this user name to log on to the XenDesktop DDC server environment. The domain is the same as for the DDC Server.
Domain Password
Password for the specified domain user.
Note: Domain username and password are mandatory fields.
Query Desktops Info
Enables the collection of information about the desktops in a XenDesktop DDC server environment.
Alarm Message
Select the alarm message to be sent if the resource does not respond.
Note: You can edit the message or define a new message using the Message Pool Manager.
Check Interval and Interval Unit
The check interval defines how often the probe checks the values of the monitors. The unit can be set as seconds, minutes, or hours. XenDesktop VDI environment data is updated once per minute. We recommend polling once every 10 minutes, which is the default. The polling interval should not be smaller than the time required to collect the data, otherwise a data collection error alarm is generated by the probe.
Alternate Resources
In a clustered environment with multiple XenDesktop Servers, add the secondary servers as Alternate Resources so that the probe can monitor all the nodes. Click Add, and the AlternateResource dialog appears. Enter the appropriate information in the Hostname, Port, Username, Password, Use SSL, Keystore Location, and Keystore Password fields.
Test button
Click to verify the connection to the resource.
Probe Configuration
28 xendesktop Guide
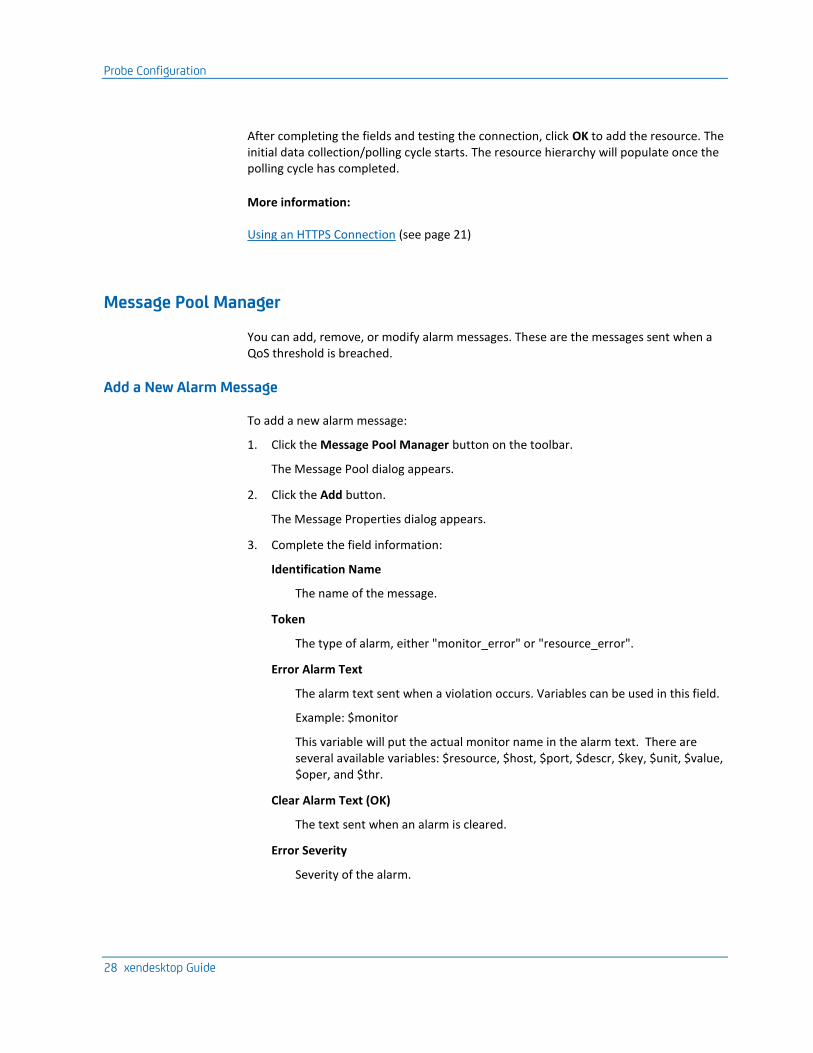
After completing the fields and testing the connection, click OK to add the resource. The initial data collection/polling cycle starts. The resource hierarchy will populate once the polling cycle has completed.
More information:
Using an HTTPS Connection (see page 21)
Message Pool Manager
You can add, remove, or modify alarm messages. These are the messages sent when a QoS threshold is breached.
Add a New Alarm Message
To add a new alarm message:
1. Click the Message Pool Manager button on the toolbar.
The Message Pool dialog appears.
2. Click the Add button.
The Message Properties dialog appears.
3. Complete the field information:
Identification Name
The name of the message.
Token
The type of alarm, either "monitor_error" or "resource_error".
Error Alarm Text
The alarm text sent when a violation occurs. Variables can be used in this field.
Example: $monitor
This variable will put the actual monitor name in the alarm text. There are several available variables: $resource, $host, $port, $descr, $key, $unit, $value, $oper, and $thr.
Clear Alarm Text (OK)
The text sent when an alarm is cleared.
Error Severity
Severity of the alarm.
Probe Configuration
Chapter 3: xendesktop Probe Configuration 29
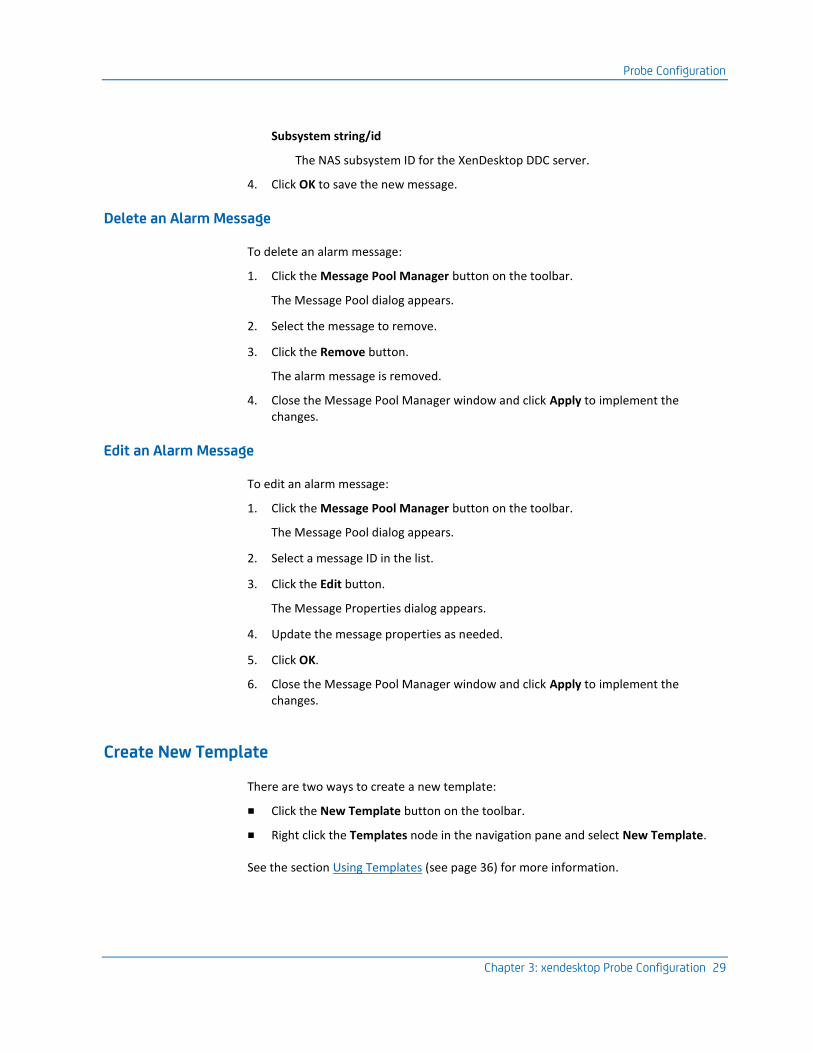
Subsystem string/id
The NAS subsystem ID for the XenDesktop DDC server.
4. Click OK to save the new message.
Delete an Alarm Message
To delete an alarm message:
1. Click the Message Pool Manager button on the toolbar.
The Message Pool dialog appears.
2. Select the message to remove.
3. Click the Remove button.
The alarm message is removed.
4. Close the Message Pool Manager window and click Apply to implement the changes.
Edit an Alarm Message
To edit an alarm message:
1. Click the Message Pool Manager button on the toolbar.
The Message Pool dialog appears.
2. Select a message ID in the list.
3. Click the Edit button.
The Message Properties dialog appears.
4. Update the message properties as needed.
5. Click OK.
6. Close the Message Pool Manager window and click Apply to implement the changes.
Create New Template
There are two ways to create a new template:
■ Click the New Template button on the toolbar.
■ Right click the Templates node in the navigation pane and select New Template.
See the section Using Templates (see page 36) for more information.
Probe Configuration
30 xendesktop Guide
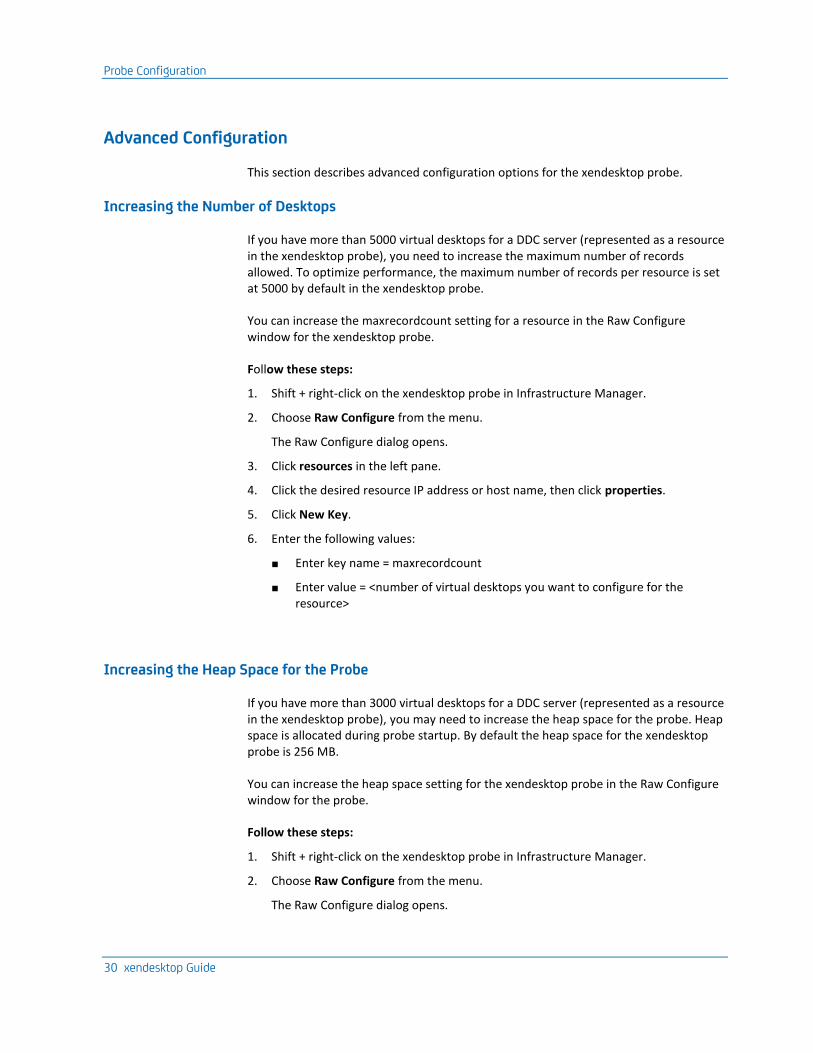
Advanced Configuration
This section describes advanced configuration options for the xendesktop probe.
Increasing the Number of Desktops
If you have more than 5000 virtual desktops for a DDC server (represented as a resource in the xendesktop probe), you need to increase the maximum number of records allowed. To optimize performance, the maximum number of records per resource is set at 5000 by default in the xendesktop probe.
You can increase the maxrecordcount setting for a resource in the Raw Configure window for the xendesktop probe.
Follow these steps:
1. Shift + right-click on the xendesktop probe in Infrastructure Manager.
2. Choose Raw Configure from the menu.
The Raw Configure dialog opens.
3. Click resources in the left pane.
4. Click the desired resource IP address or host name, then click properties.
5. Click New Key.
6. Enter the following values:
■ Enter key name = maxrecordcount
■ Enter value = <number of virtual desktops you want to configure for the resource>
Increasing the Heap Space for the Probe
If you have more than 3000 virtual desktops for a DDC server (represented as a resource in the xendesktop probe), you may need to increase the heap space for the probe. Heap space is allocated during probe startup. By default the heap space for the xendesktop probe is 256 MB.
You can increase the heap space setting for the xendesktop probe in the Raw Configure window for the probe.
Follow these steps:
1. Shift + right-click on the xendesktop probe in Infrastructure Manager.
2. Choose Raw Configure from the menu.
The Raw Configure dialog opens.
Probe Configuration
Chapter 3: xendesktop Probe Configuration 31
3. Click startup in the left pane.
4. Select the options key and open it for editing.
5. Enter a value similar to the following:
-Xms256m –Xmx<nnnn>m
where <nnnn> is heap space up to 2048 MB or greater. For example, to increase the heap space to 1024 MB, enter the following:
-Xms256m –Xmx1024m
Ensure the machine where the CA Nimsoft robot and probe are deployed has enough RAM.
6. Click OK and Apply.
Adding Servers in a Clustered Environment
The xendesktop probe can monitor all servers in a clustered XenDesktop DDC server environment with multiple DDC servers. Add one server as the primary resource and the remaining as alternate resources.
Data is collected from the primary resource. If the primary resource is down, data is collected from the next available secondary resource.
Follow these steps:
1. In the xendesktop probe GUI, click the New Resource icon on the toolbar.
2. Enter the appropriate information in each field of the New Resource dialog box.
3. Click Add in the Alternate Resources section.
This queries the controller for names of XenDesktop servers and populates the drop-down menu for the Hostname field.
4. Select a host in the Hostname field and enter appropriate information in other fields.
5. Click Test to verify that the probe can connect to the resource.
6. Click OK in the AlternateResource dialog.
7. Repeat these steps to add each secondary server as an alternate resource.

Chapter 4: Adding Monitors 33
Chapter 4: Adding Monitors
There are three different ways to add monitors to XenDesktop entities:
Manually select the monitors
To manually select and enable monitors, navigate to the target entity within the Resource. This lists its monitors in the right pane. Use the available check boxes to enable QoS monitoring for the selected metrics. To enable Alarm thresholding, you will need to launch the Edit Monitor dialog. See the section Manually Selecting Monitors to be Measured (see page 33).
Use Templates
Templates let you define reusable sets of monitors to apply to various XenDesktop monitored entities.
See the section Using Templates (see page 36) for further information.
Use Auto Configurations
Auto Configuration is a powerful way to automatically add monitors to be measured. Monitors are created for new devices (that is, ones not currently monitored) that would otherwise need manual configuration to be monitored.
Example: Auto Configuration contains an auto-monitor for VM 'Memory Used'. When a new VM is created within XenDesktop, the Auto Configuration feature creates a monitor automatically for monitoring the VM.
See the section Using Automatic Configurations (see page 37) for further information.
This section contains the following topics:
Manually Selecting Monitors to be Measured (see page 33) Using Templates (see page 36) Using Automatic Configurations (see page 37)
Manually Selecting Monitors to be Measured
To select a monitor you want to be measured for a resource, click the Resource node in the navigation pane, and navigate through the Resource hierarchy. Select a folder in the hierarchy to see the monitors for it, listed in the right pane. Click the check box beside the Monitors you want to be active.
Note: You can also add monitors using templates (see the section Using Templates (see page 36)).
Probe Configuration
34 xendesktop Guide
Select the All Monitors node to list all monitors currently being measured in the right pane. You can select or deselect monitors here as well.
■ Green icon - the monitor is configured and active
■ Gray icon - the monitor is configured but not active
■ Black icon - the monitor is not configured
Note: If a monitor name is in italics you have changed the configuration but have not applied the changes.
Enabling the Monitors for QoS and Alarming
You can now see the current values for the monitors in the Values column in the monitor list. Selecting the check box next to a monitor name only enables the monitor. To configure the probe to send QoS data and/or send alarms you must modify the properties for each monitor.
Double-click a monitor (or right-click and select Edit) to launch the monitor’s properties dialog. See To Edit Monitor Properties (see page 34) for further information.
To Edit Monitor Properties
Double-click a monitor (or right-click and select Edit) to launch the monitor’s properties dialog.
Monitors of Type Value
The properties for monitors of type value are as follows:
Name
This is the name of the monitor. The name will be inserted into this field when the monitor is retrieved from the XenDesktop environment.
Key
This is a read-only field, describing the monitor key.
Description
This is a description of the monitor. This description will be inserted into this field when the monitor is retrieved from the XenDesktop environment.
Value Definition
This drop-down list lets you select which value to be used, both for alarming and QoS:
You have the following options:
■ The current value. The most current value measured will be used.
Probe Configuration
Chapter 4: Adding Monitors 35
■ The delta value (current – previous). The delta value calculated from the current and the previous measured sample will be used.
■ Delta per second. The delta value calculated from the samples measured within a second will be used.
■ The average value of the last and current sample: (current + previous) / 2.
■ The average value last ... The user specifies a count. The value is then averaged based on the last "count" items.
Active
This activates the monitoring of the probe.
Enable Alarming
Selecting this option activates the alarming.
Note that the monitor will also be selected in the list of monitors in the right window pane when this option is selected, and that you can enable or disable monitoring of the checkpoint from that list.
This section describes the alarm properties for the monitor.
You can define both a high and a low threshold.
Initially the high threshold is set to the current value. Set this value to match your needs.
The low threshold is initially disabled. If you want to use it, you must select another operator than "disabled" from the list and configure it to match your needs.
Operator
Select from the drop-down list the operator to be used when setting the alarm threshold for the measured value.
Example:
>= 90 means the monitor is in alarm condition if the measured value is equal to or above 90.
= 90 means the monitor is in alarm condition if the measured value is exactly 90.
Threshold
The alarm threshold value. An alarm message is sent when this threshold is violated.
Unit
This field specifies the unit of the monitored value (for example %, Mbytes etc.). The field is read-only.
Probe Configuration
36 xendesktop Guide
Message ID
Select the alarm message to be issued if the specified threshold value is breached. These messages reside in the message pool. You can modify the messages in the Message Pool Manager.
Publish Quality of Service
Select this option if you want QoS messages to be issued on the monitor.
QoS Name
The unique QoS metric. This is a read-only field.
Using Templates
Templates let you define reusable sets of monitors to be measured on multiple XenDesktop Controllers, Catalogs, Groups, desktops, hypervisor hosts, and machines. Templates allow you to consistently monitor your dynamic XenDesktop environment.
You can create your own templates and define a set of monitors belonging to each. You can then apply these templates to anything in the Resources or Auto Configurations hierarchies in the navigation pane by dragging the template and dropping it on the appropriate item. This assigns the template monitors to the drop point and everything below it.
If you apply a template to the Auto Configuration, its monitors are applied to all XenDesktop monitored entities as they appear in the system. If you need a finer level of control, you can apply a template to anything in the Resources hierarchy; in this case the monitors are applied to the drop-point and everything subordinate to it. Any templates applied within the Resources hierarchy are static monitors. The static monitors override any auto monitors for that specific resource entity.
Note: You can do both, placing general-purpose templates in Auto Configuration, and applying special-purpose templates that override the Auto Configuration templates on specific nodes, for specific purposes.
See the Using Automatic Configurations (see page 37) section for details on Auto Configuration.
To Create a New Template
There are two ways to create a template:
■ Click the toolbar button for New Template ( ).
Probe Configuration
Chapter 4: Adding Monitors 37
■ Right click the Templates node in the navigation pane, and choose New Template from the menu.
In the resulting Template Properties dialog, specify a Name and a Description for the new template.
Note that you can also edit an existing template: Select one of the templates defined under the Templates node in the navigation pane, right-click it, and select Edit from the menu.
To Add Monitors to a Template
There are two ways to add a monitor to a template:
■ Drag it from the content pane and drop it on the template in the navigation pane.
■ Right-click on a monitor in the content pane and select Add to Template.
You can edit the properties for monitors in the template as described in the section To Edit Monitor Properties (see page 34).
To Apply a Template
Drag the template to the Auto Configuration node or the Resource component (Desktop Group, Desktop, Hypervisor, etc.) where you want it applied, and drop it there.
Note: You can drop the template on an object containing multiple subordinate objects. This applies the template to the entity and all its subordinate entities. A static monitor is created for this entity.
Using Automatic Configurations
Automatic configuration is an optional but powerful way to automatically add monitors to be measured. This is the preferred method for configuring your resources. When new XenDesktop monitored entities are detected, "Auto Monitors" are created for devices that are not currently monitored using a static monitor.
Probe Configuration
38 xendesktop Guide
The Auto Configuration feature consists of two sub-nodes located under the Resource node in the navigation pane:
Auto Configurations node
You can add contents from one or more templates or individual checkpoints to this node, using drag and drop. You must click the Apply button and restart the probe to activate the changes. The probe then searches through the XenDesktop environment for applicable entities. Auto Monitors representing the monitor(s) under the Auto Configuration node are created (and listed under the Auto Monitor node, see below) for applicable entities where the metric does not already have a static monitor configured against it.
Important! If you are experiencing performance problems, we recommend increasing the polling cycle and/or the memory configuration for the probe. Increase memory when the probe is running out of memory. Increase the polling cycle when the collection takes longer than the configured interval.
Auto Monitors node
This node lists Auto Monitors, created based on the contents added to the Auto Configuration node. The Auto Monitors are only created for content without a pre-existing static monitor.
Adding a Template to the Auto Configurations Node
You can add a template's content to the Auto Configurations as follows:
1. Click the Templates node in the navigation pane to list all available templates in the content pane.
2. Add a template to the Auto Configurations node by dragging the template from the list and dropping it on the Auto Configurations node in the navigation pane.
3. Click the Auto Configurations node to verify that the template's content was successfully added.
See the Using Templates (see page 36) section to learn more about templates.
Note: You must click the Apply button and restart the probe to activate configuration changes.
Probe Configuration
Chapter 4: Adding Monitors 39
Adding a Monitor to the Auto Configurations Node
You can add a single monitor (checkpoint) to the Auto Configurations node.
To list available monitors:
1. Select the Resource node in the navigation pane and navigate to the point of interest.
2. Select an object to list its monitors in the right pane.
3. Add the monitor to the Auto Configurations node by dragging the monitor to the Auto Configurations node and dropping it there.
4. Click the Auto Configurations node and verify that the monitor was successfully added.
Note: You must click the Apply button and restart the probe to activate configuration changes.
Exploring the Contents of the Auto Configurations Node
To verify that the monitors were successfully added, click the Auto Configurations node in the navigation pane.
■ To edit the properties for a monitor, right-click in the list and choose Edit from the menu. See the section To Edit Monitor Properties (see page 34) for detailed information.
■ To delete a monitor from the list, right-click in the list and choose Delete from the menu.
Note: You must click the Apply button and restart the probe to activate configuration changes.
Checking the Auto Monitors Node
Note: When monitors have been added to the Auto Configurations node, you must click the Apply button and restart the probe to activate the Auto Configuration feature.
When you restart the probe, it searches through the Resource's entities. For each one that is currently not monitored, an Auto Monitor is created for each of the monitors listed under the Auto Configurations node.
All defined Auto Monitors are listed under the Auto Monitors node.

Appendix A: Troubleshooting 41
Appendix A: Troubleshooting
This section contains troubleshooting tips for this xendesktop probe.
This section contains the following topics:
Probe is Not Collecting Data (see page 41) Out of Memory Errors (see page 42)
Probe is Not Collecting Data
Symptom:
The probe is not collecting data.
Solution 1:
The probe may not be able to connect to the XenDesktop environment. There are several issues that can cause this. See the Connecting to the XenDesktop Environment (see page 16) section of this document, including the subsection on Troubleshooting Connection Issues.
Solution 2:
You may need to allocate more memory for the probe to execute PowerShell commands on the DDC server. We recommend setting this to 1024 MB during initial configuration for the xendesktop probe. However, in some cases this may need to be increased.
Check the xendesktop.log file for the following message:
Process is terminated due to StackOverflowException
If you see this message, enter the following command on the DDC server:
winrm set winrm/config/winrs @{MaxMemoryPerShellMB="nnnn"}
where nnnn is a number greater than 1024.
Out of Memory Errors
42 xendesktop Guide
Out of Memory Errors
Symptom:
Out of memory errors.
Solution:
If you have more than 3000 virtual desktops for a DDC server (represented as a resource in the xendesktop probe), you may need to increase the heap space for the probe. For instructions, see Increasing the Heap Space for the Probe (see page 30).