nina h. fefferman eenr/dimacs rutgers university & informid tufts univ. school of medicine
DESCRIPTION
The Impact of Household Capital Models on Targeted Epidemiological Control Strategies for Diseases with Age-Based Etiologies. Nina H. Fefferman EENR/DIMACS Rutgers University & InForMID Tufts Univ. School of Medicine. - PowerPoint PPT PresentationTRANSCRIPT

The Impact of Household Capital Models on Targeted
Epidemiological Control Strategies for Diseases with
Age-Based Etiologies
Nina H. FeffermanEENR/DIMACS
Rutgers University& InForMID
Tufts Univ. School of Medicine

Integrating economics into epidemiology has led to targeted recommendations for treatment to combat epidemicsDecisions using cost-benefit analyses or
optimization techniques are based on trying to achieve particular goal:
• Minimize deaths
• Minimize economic loss (to community or individuals)
• Minimize interruption of society/service
• Minimize numbers ill (per unit time or overall)
• etc.
However, most of these have looked either at individual health choices (made only for yourself), or total communities
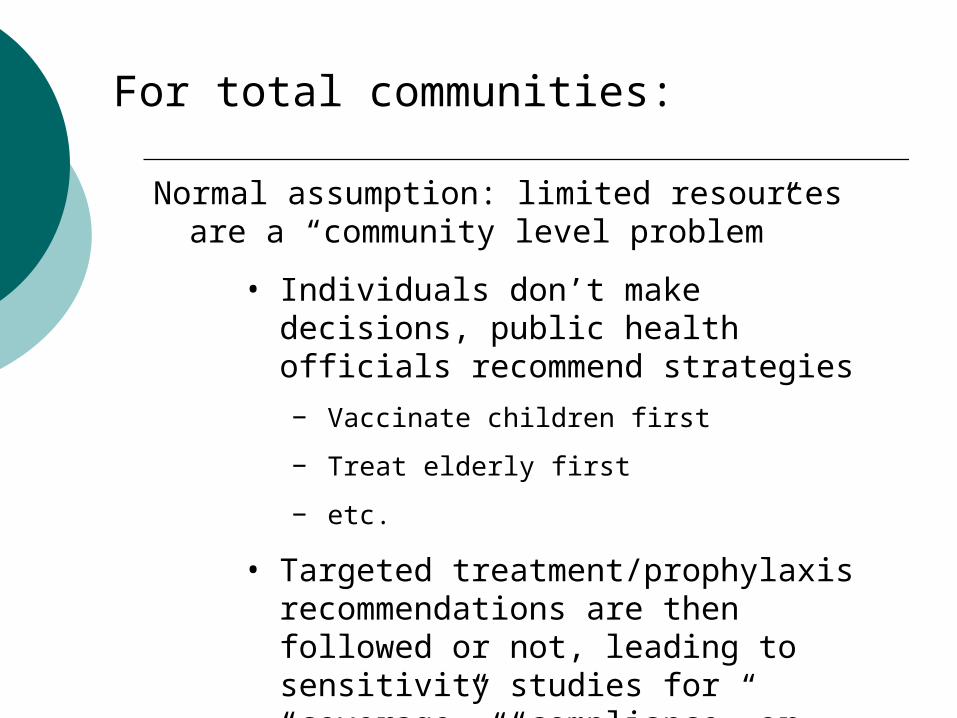
Normal assumption: limited resources are a “community level problem”
• Individuals don’t make decisions, public health officials recommend strategies
− Vaccinate children first
− Treat elderly first
− etc.
• Targeted treatment/prophylaxis recommendations are then followed or not, leading to sensitivity studies for “coverage”, “compliance” or “adherence”
For total communities:

For individuals:
Normal assumption is behavior is “selfish”, maximizing personal health outcome at a minimum of personal cost
• Individuals are usually assumed to be willing to cause public hardship in favor of personal benefit
− Tragedy of the Commons
− Lemon Paradox
− even Prisoner’s Dilemma type things
• Investigation then usually examines how the individual behaviors predicted by the models will cause community-level effects (e.g. herd immunity)

But do the same recommendations hold for “household economic” decisions?
In practice, economic resources are shared within a family
If recommendations involve “elderly” or “children”, the also involve all the other members of the family
(a little different for nursing homes and orphanages, but still…)
Also, while community-level recommendations can be made, individuals are still potentially paying the costs
If this is done via a tax or community fund, then we’re just fine, but if this is voluntary participation in a public health recommendation, there may be different trade-offs (especially if not mediated by a community physician)

What happens when households themselves have limited economic resources?
We know that, independent of disease, access to health care and monetary resources themselves increase individual health
If illness compromises an individual’s ability to earn money, their future health, independent of the particular illness could also be jeopardized.
If the same individual is responsible for supporting dependents, the health of those dependents could also be compromised

Does this “dependents” perspective alter our analysis of how best to mitigate risks?
For ease, let’s say that the dynamics of these things are a bit simple:
1. Lack of resources instantly decreases health, and thereby increases susceptibility to disease
2. There are only two types of people: producers and consumers
a. Consumers rely on producers for resources
b. Producers produce resources for themselves and others
c. For simplicity, we’ll assume Consumers are children and Producers are adults (e.g. dependent elderly are treated economically AND etiologically like children)
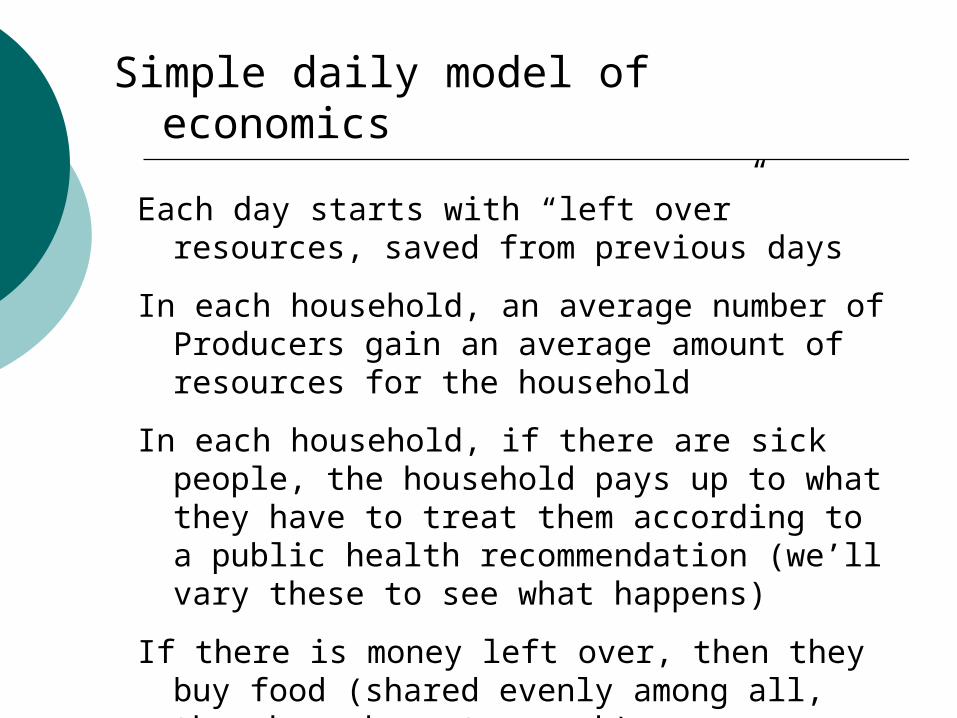
Simple daily model of economics
Each day starts with “left over” resources, saved from previous days
In each household, an average number of Producers gain an average amount of resources for the household
In each household, if there are sick people, the household pays up to what they have to treat them according to a public health recommendation (we’ll vary these to see what happens)
If there is money left over, then they buy food (shared evenly among all, though maybe not enough)

Mostly simple daily SIR disease process:
cccppp RISRIS ,,,, ,
Rates of transmission within household:
Rates of transmission within community:
When there isn’t enough food, these increase to:
p c
Natural rates of recovery:p c
.
cp II ,
cp ,
Basic household:
and
andTreatment based rates of recovery:
Basic community:
cccppp RISRIS~
,~
,~~
,~
,~
,
hAverage size of household:
Total population size: N
p and
c
ˆ,ˆ
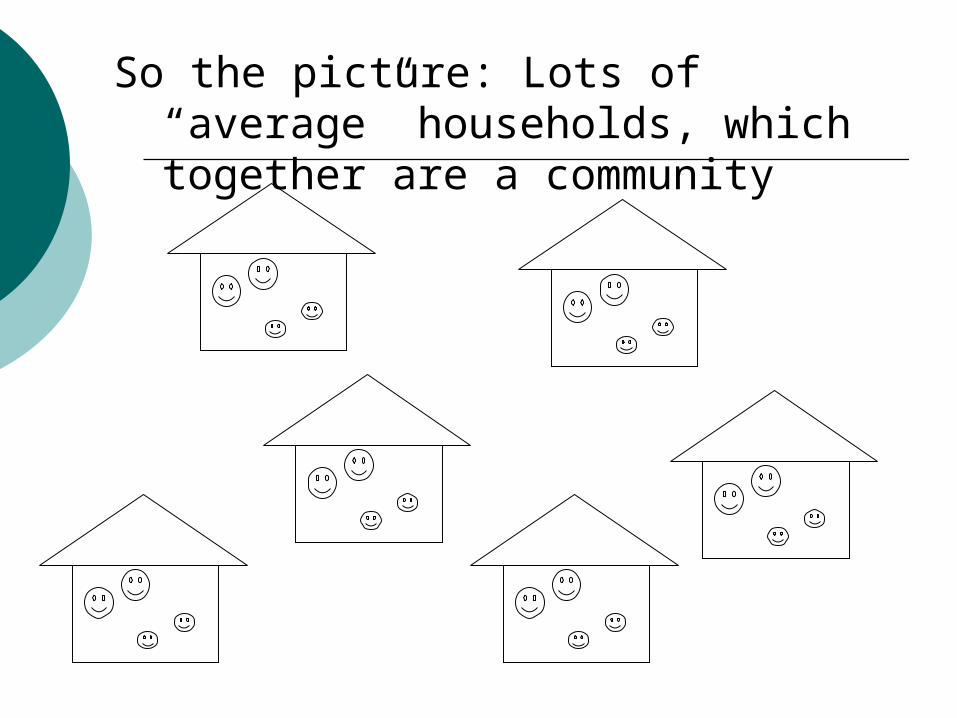
So the picture: Lots of “average” households, which together are a community
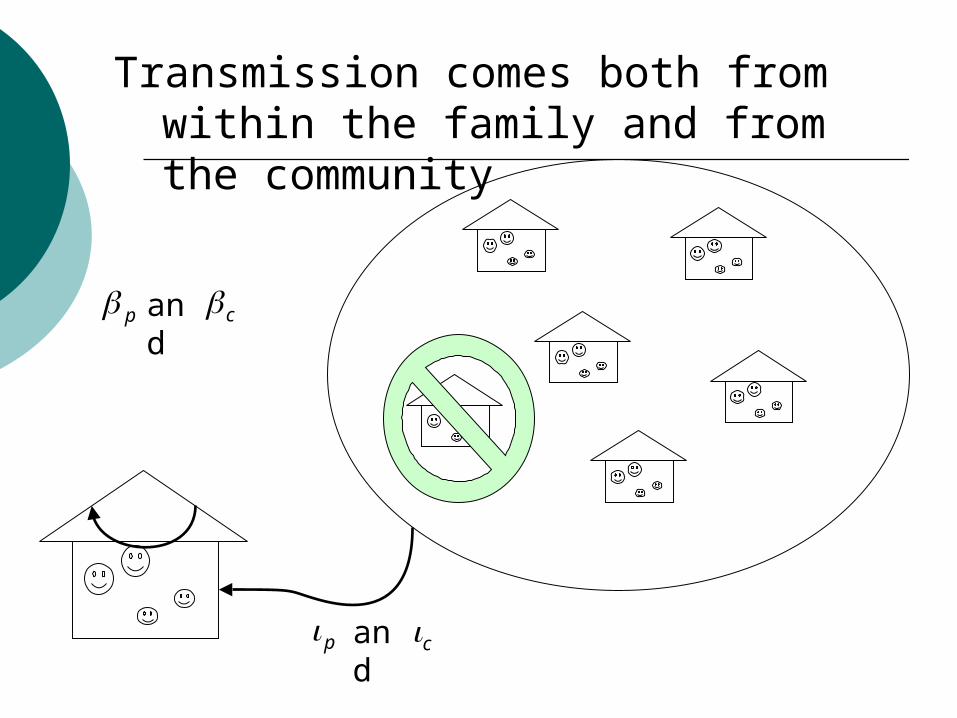
Transmission comes both from within the family and from the community
p cand
p and
c
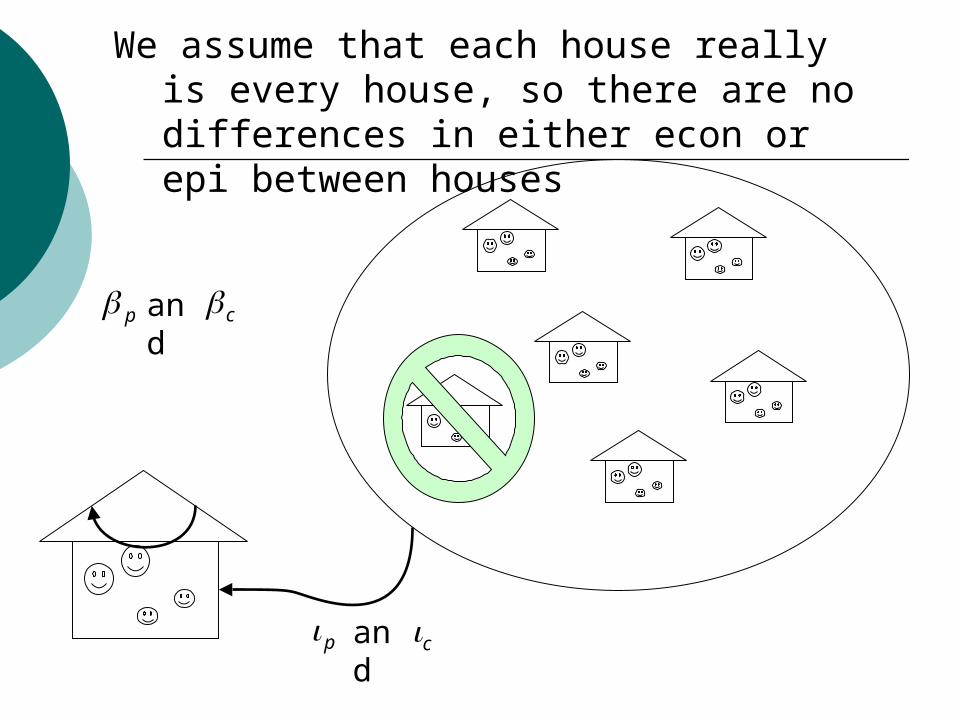
We assume that each house really is every house, so there are no differences in either econ or epi between houses
p cand
p and
c

Mathy details happen! (details available upon request, but they are somewhat involved)
h
hNSS pp
~
h
hNSS cc
~
h
hNIII ppp
~
h
hNIII ccc
~
h
hNRR pp
~
and
h
hNRR cc
~
cpppppccppppppp ISISIISIISdt
dS ~~
cccpccccccppccc ISISIISIISdt
dS ~~
pppcpppppccppppppp ITISISIISIISdt
dI 1~~
ccccccpccccccppccc ITISISIISIISdt
dI 1~~
pppcpppppccppppppp ITISISIISIISdt
dI ~~
ccccccpccccccppccc ITISISIISIISdt
dI ~~
ppppp IIdt
dR
ccccc IIdt
dR
cpppppccpppppp ISISIISIISA~~
cccpccccccppcc ISISIISIISB~~
cpppppccpppppp ISISIISIISA~ˆ~ˆˆˆˆ
cccpccccccppcc ISISIISIISB~ˆ~ˆˆˆˆ
if
ifdt
dS p ,0
,0
hM
hM
A
Aˆ
if
ifdt
dSc ,0
,0
hM
hM
B
Bˆ
if
ifdt
dI p ,0
,0
hM
hM pp
ppp
IA
ITA
ˆ1

We then model the epidemiological outcome and compare results
Next, we model the disease spread without any economic limitation (so no ), and we treat everyone our strategy says we should
ˆ,ˆ
First, we choose public health strategies: treat everyone uniformly, treat only consumers, treat only producers
Lastly, include household economic limitation and try all our strategies again this time using
ˆ,ˆ
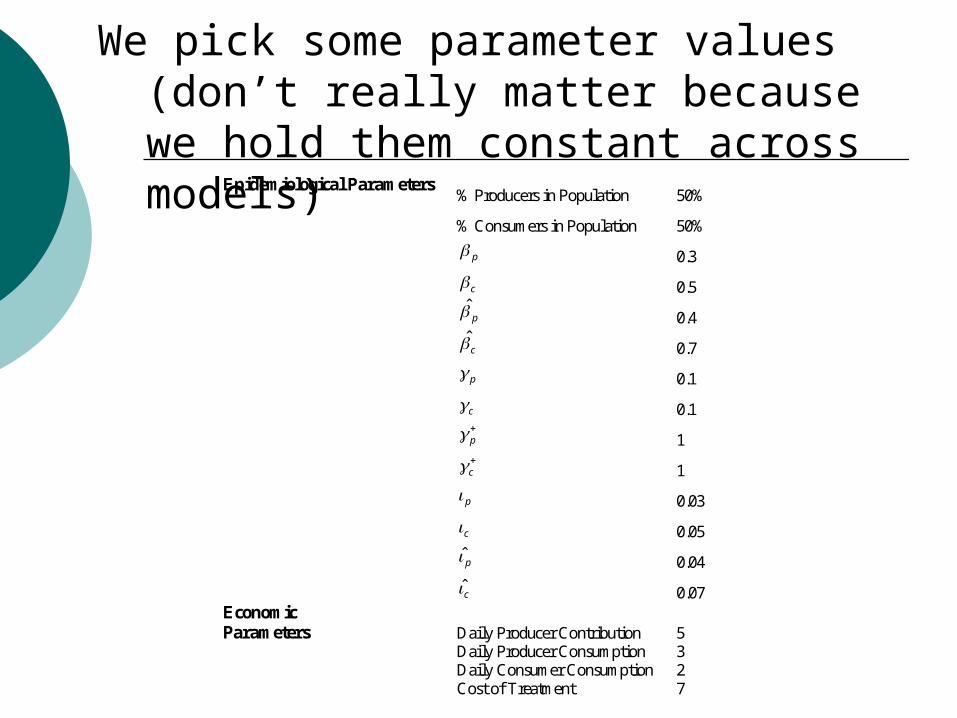
Epidemiological Parameters % Producers in Population 50%
% Consumers in Population 50%
p 0.3
c 0.5
p 0.4
c 0.7
p 0.1
c 0.1
p 1
c 1
p 0.03
c 0.05
p 0.04
c 0.07
Economic Parameters Daily Producer Contribution 5 Daily Producer Consumption 3 Daily Consumer Consumption 2 Cost of Treatment 7
We pick some parameter values (don’t really matter because we hold them constant across models)

Epidemic curves when treatment costs don’t impact household health maintenance or susceptibility.

Epidemic curves when treatment costs do impact household health maintenance and susceptibility

Without Econ Constraint
With Econ Constraint
Comparison of Outcomes:

Goal Levels of
Treatment Total % Infected
% of Consumers
Infected
% of Producers Infected
100% Treatment 8 9 8
100% Consumers Only 84 90 77
100% Producers Only 88 95 82
50% Treatment 86 93 80
No Economic Limitation on
Household Healthcare Expenditure
0% Treatment 98 100 97
100% Treatment 95 99 92
100% Consumers Only 99 100 98
100% Producers Only 89 95 83
50% Treatment 98 100 96
With Economic Limitation on
Household Healthcare Expenditure
0% Treatment 99 100 98
Comparison of Outcomes: The numbers
8
84
88
86
98
Model agrees with previous studies: recommends most effective control for whole population is children

Goal Levels of
Treatment Total % Infected
% of Consumers
Infected
% of Producers Infected
100% Treatment 8 9 8
100% Consumers Only 84 90 77
100% Producers Only 88 95 82
50% Treatment 86 93 80
No Economic Limitation on
Household Healthcare Expenditure
0% Treatment 98 100 97
100% Treatment 95 99 92
100% Consumers Only 99 100 98
100% Producers Only 89 95 83
50% Treatment 98 100 96
With Economic Limitation on
Household Healthcare Expenditure
0% Treatment 99 100 98
Comparison of Outcomes: The numbers
95
99
89
98
99
Model demonstrates economics matter! Recommends most effective control for whole population is producers!
Goal Levels of
Treatment Total % Infected
% of Consumers
Infected
% of Producers Infected
100% Treatment 8 9 8
100% Consumers Only 84 90 77
100% Producers Only 88 95 82
50% Treatment 86 93 80
No Economic Limitation on
Household Healthcare Expenditure
0% Treatment 98 100 97
100% Treatment 95 99 92
100% Consumers Only 99 100 98
100% Producers Only 89 95 83
50% Treatment 98 100 96
With Economic Limitation on
Household Healthcare Expenditure
0% Treatment 99 100 98
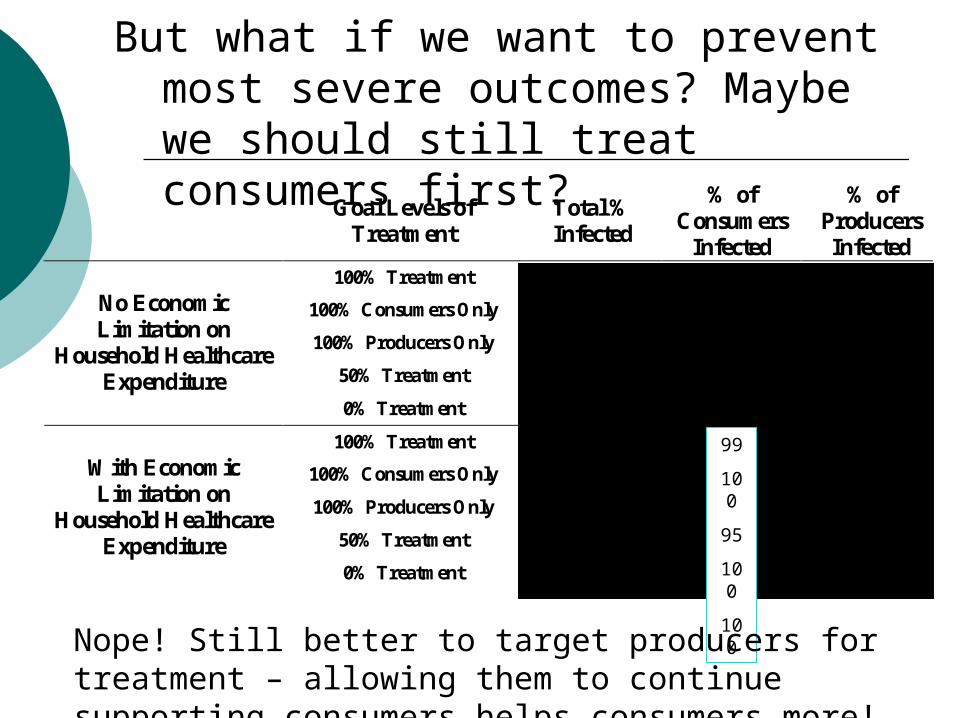
But what if we want to prevent most severe outcomes? Maybe we should still treat consumers first?
99
100
95
100
100
Nope! Still better to target producers for treatment – allowing them to continue supporting consumers helps consumers more!
Goal Levels of
Treatment Total % Infected
% of Consumers
Infected
% of Producers Infected
100% Treatment 8 9 8
100% Consumers Only 84 90 77
100% Producers Only 88 95 82
50% Treatment 86 93 80
No Economic Limitation on
Household Healthcare Expenditure
0% Treatment 98 100 97
100% Treatment 95 99 92
100% Consumers Only 99 100 98
100% Producers Only 89 95 83
50% Treatment 98 100 96
With Economic Limitation on
Household Healthcare Expenditure
0% Treatment 99 100 98
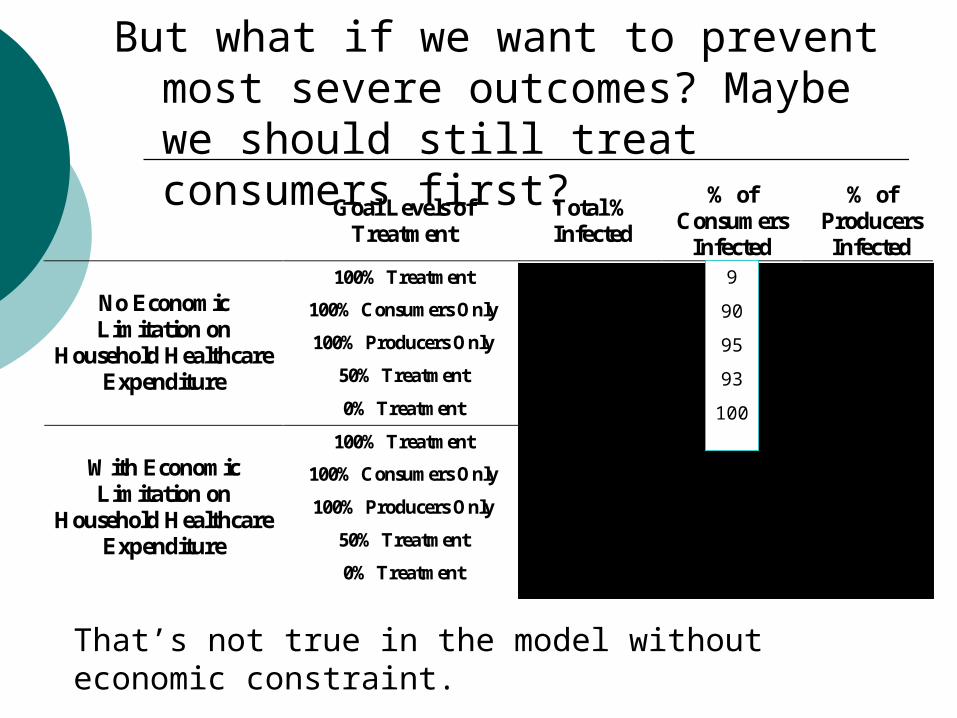
But what if we want to prevent most severe outcomes? Maybe we should still treat consumers first?
9
90
95
93
100
That’s not true in the model without economic constraint.

Moral of the story:
Economic constraints on families lead to different population-level optimal strategies for both limiting overall incidence AND limiting incidence in high-risk populations
Model agrees that, without economic constraints, preventing disease in “reservoir” populations helps curtail risks to total population, but shifts recommendation once household production constraints are included
Policy needs to be based on understanding productivity
Optimal strategies in non-resource-limited areas may be wrong for resource-limited communities

Thanks to:
Jacques Kibambe Ngoie (an economist who worked on this with me)
DIMACS
Also, Tami Carpenter and Immanuel Williams and I are working on extending these models to HIV/AIDS