nina wald - econstor.eu
TRANSCRIPT

econstorMake Your Publications Visible.
A Service of
zbwLeibniz-InformationszentrumWirtschaftLeibniz Information Centrefor Economics
Wald, Nina
Working Paper
The impact of displacement on child health: Evidencefrom Colombia's DHS 2010
DIW Discussion Papers, No. 1420
Provided in Cooperation with:German Institute for Economic Research (DIW Berlin)
Suggested Citation: Wald, Nina (2014) : The impact of displacement on child health: Evidencefrom Colombia's DHS 2010, DIW Discussion Papers, No. 1420, Deutsches Institut fürWirtschaftsforschung (DIW), Berlin
This Version is available at:http://hdl.handle.net/10419/103370
Standard-Nutzungsbedingungen:
Die Dokumente auf EconStor dürfen zu eigenen wissenschaftlichenZwecken und zum Privatgebrauch gespeichert und kopiert werden.
Sie dürfen die Dokumente nicht für öffentliche oder kommerzielleZwecke vervielfältigen, öffentlich ausstellen, öffentlich zugänglichmachen, vertreiben oder anderweitig nutzen.
Sofern die Verfasser die Dokumente unter Open-Content-Lizenzen(insbesondere CC-Lizenzen) zur Verfügung gestellt haben sollten,gelten abweichend von diesen Nutzungsbedingungen die in der dortgenannten Lizenz gewährten Nutzungsrechte.
Terms of use:
Documents in EconStor may be saved and copied for yourpersonal and scholarly purposes.
You are not to copy documents for public or commercialpurposes, to exhibit the documents publicly, to make thempublicly available on the internet, or to distribute or otherwiseuse the documents in public.
If the documents have been made available under an OpenContent Licence (especially Creative Commons Licences), youmay exercise further usage rights as specified in the indicatedlicence.
www.econstor.eu
Discussion Papers
The Impact of Displacement on Child Health:Evidence from Colombia's DHS 2010
Nina Wald
1420
Deutsches Institut für Wirtschaftsforschung 2014
Opinions expressed in this paper are those of the author(s) and do not necessarily reflect views of the institute. IMPRESSUM © DIW Berlin, 2014 DIW Berlin German Institute for Economic Research Mohrenstr. 58 10117 Berlin Tel. +49 (30) 897 89-0 Fax +49 (30) 897 89-200 http://www.diw.de ISSN electronic edition 1619-4535 Papers can be downloaded free of charge from the DIW Berlin website: http://www.diw.de/discussionpapers Discussion Papers of DIW Berlin are indexed in RePEc and SSRN: http://ideas.repec.org/s/diw/diwwpp.html http://www.ssrn.com/link/DIW-Berlin-German-Inst-Econ-Res.html

The Impact of Displacement on Child Health:
Evidence from Colombia’s DHS 2010
Nina Wald1
German Institute for Economic Research (DIW Berlin), Humboldt University Berlin and
Households in Conflict Network (HiCN)
Abstract
This paper investigates the causal impact of displacement on health outcomes for Colombian children of different age cohorts. It uses the Colombian Demographic and Health Survey 2010, which provides both a number of health outcomes and information about displacement of households. Two different empirical strategies are employed to identify the impact of displacement on child health, namely a linear regression model and propensity score matching. In order to capture different dimensions of health, four health outcomes are used as dependent variables: (i) height-for-age z-scores; (ii) subjective health status; (iii) affiliation to a health insurance; and (iv) having a health problem last month. Overall, a negative relationship between displacement and child health is documented. In line with findings from African and Asian countries, displacement increases the likelihood for malnutrition for young children and primary school children. Moreover, being displaced leads to a lower subjective health status for children from all age cohorts. Yet, displaced children are not affected by health problems significantly more often than non-displaced children. Last, but not least, displaced children from all age cohorts are significantly less likely to have health insurance.
JEL Classification Codes: C21, D19, I13, O54
Key Words: Child Health, Displacement, Armed Conflict, Colombia, Propensity Score
Matching
1 German Institute for Economic Research (DIW Berlin), Mohrenstr. 58, 10117 Berlin, Germany. Email:[email protected].
I would like to thank Tilman Brück, Adam Lederer, Sindu Workneh Kebede, Tony Muhumuza, Kristina Meier and participants of the EEA Annual Congress (Toulouse, 2014) for their constructive and valuable comments.

1
1. Introduction
Child health has a great and long lasting influence on cognitive skills and associated
socioeconomic outcomes like educational attainment, income, labor market participation
and adult health in later life (Case et al. 2002, Case et al. 2005, Currie and Stabile 2004,
Glewwe et al. 2001, Marmot et al. 2001, Almond and Currie 2010, 2011, Case and Paxson
2010, Currie and Hyson 1999, Kuh and Wadsworth 1999, Maurer 2010, Maluccio et al. 2006,
van den Berg 2006). As a consequence, children with adverse health outcomes are more
likely to leave school earlier, earn less and are more prone to certain diseases in their later
life. When they themselves have children, these children will grow up in a disadvantaged
socioeconomic environment making them more vulnerable for malnutrition and health
problems. In this way, a vicious circle is established. Breaking this vicious circle is one reason
why child health should be of great relevance for policy makers. Therefore, researchers are
analyzing the main determinants of child health. By understanding these drivers, policy
makers can design programs that improve child health leading to healthier and more capable
adults, which is beneficial for the whole country.
Until recently, the majority of research on child health determinants was conducted in
industrialized countries due to limited data availability in developing countries. Many of
these studies focus on socioeconomic determinants of child health – especially the so-called
child health / family income gradient that is extensively investigated (see for example Case
et al. 2002, Currie et al. 2007). Since 2000 a growing body of literature on child health in
developing countries has emerged. Determinants are broader than for industrialized
countries and include – in addition to socioeconomic variables and health-income gradient -
community characteristics, development program effects and certain types of shocks like
famines, crop losses, pollution, rainfall and drought (Chen et al. 2010, Chen and Zhou 2007,
Chen and Li 2009, Meng and Qian 2006, Jayachandran 2009, Maccini and Yang 2009,
Hoddinott and Kinsey 2001, Linnemayr at al. 2008, David et al. 2004, Alderman et al. 2006,
Currie and Vogl 2012, Michaelsen and Tolan 2012).
Starting in about 2008, armed conflict emerged in the economic literature as a new
exogenous shock to child health. Until now, to the best of my knowledge, research in this
2
area is mainly restricted to African (Akresh et al. 2011, 2012a and 2012b, Bundervoet et al.
2009, Bundervoet 2012, Minou and Shemyakina 2012) and Asian (Guerrero-Serdán 2009,
Valente 2001, Parlow 2012) countries, with the exception of Camacho’s work (2008) on the
impact of terrorist attacks on birth weight in Colombia. Results show unambiguously that
conflict negatively impacts child health. Most papers use a difference in difference approach
comparing nutritional status of preschool children and babies (measured as height-for-age z-
scores or birth weight) across time in conflict and peaceful areas. Few other indicators for
child health are used in the conflict setting, with the exception of Valente (2011) and Parlow
(2012).
This paper makes several contributions to the child health and conflict literature. First, it
uses multiple dimensions of child health in order to get a clearer picture on the impact of
displacement on child health. These dimensions capture different aspects of health: (i)
nutritional status; (ii) subjective health; (iii) health insurance membership; and (iv) having
health problems. As in other papers on conflict and child health, height-for-age z-scores are
used to measure children’s long-term nutritional status. One great advantage of this
measure is its objectivity since weight and height are normally recorded by the interviewers
and do not rely on respondent’s information only. A disadvantage of this measure is that is
does not include other, more subtle aspects, such as mental health, social and cognitive
development or overall wellbeing, which are quite likely to be affected by conflict. For this
reason, a subjective health measure is included. The respective variable asks parents to rate
their child’s health on a scale from one (excellent) to five (bad). A benefit of this approach is
that parents are probably the individuals who best know their child’s health. However, it
might be that their statement of their child’s subjective health is not as objective as height-
for-age z-scores, but influenced by parents’ own health and living circumstances. A
measurement in between regarding objectivity is the question about the health problems of
their child over the last month. It is less objective than height-for-age z-scores because it
relies on the respondent’s information and observations but it is more objective than the
question about subjective health because it asks for concrete health issues, which are
probably easier to answer than ranking the overall health status.

3
The last dimension tackles access to the health care system, which is an important factor for
having a healthy child. If a child is not a member of a health insurance, they are less likely to
participate in preventive programs or to receive treatment in the event of illness or accident
because the family cannot afford to pay for it. This situation is especially difficult for poor,
displaced families. As I show in section 3, access to the subsidized health care system is
linked to specific municipalities in Colombia, which makes it difficult to keep health
insurance membership after displacement.
Second, regarding the methodology, this paper deviates from most papers in this area of
research. Instead of using the difference in difference methodology, linear regression and
propensity score matching are employed in this analysis. Particularly in times of conflict,
children from peaceful and violent areas might not only differ regarding their war exposure
but in other characteristics such as socioeconomic status, ethnicity and educational
background. Hence, it is important to control for this possibility in order to get unbiased
estimates.
Third, due to the rich survey data that includes information of children’s displacement
status, this paper measures directly the exposure to conflict for each individual. Otherwise, it
would not be possible to accurately know if a family member experienced exposure to
conflict because even in areas with a high number of conflict incidents, it could be that
families are nevertheless not influenced by conflict or its consequences. Hence, this paper
resolves some issues of previous research resulting from using conflict data on municipality
or even departmental level.
Fourth, since health data is available for children of all ages, this paper analyzes how the
impact of displacement differs between age groups. It is valuable to know whether conflict
affects children differently depending on age, thus allowing for age appropriate policy
measures to be implemented. Yet the majority of research undertaken in this area so far
concentrates on the impact of conflict exposure in utero or early childhood.
4
Last, but not least, this paper contributes to the health and conflict literature on Latin
American countries, a region where empirical evidence on this topic is still scare, with the
exception of Camacho (2008).
In line with previous findings, results suggest a negative impact of conflict on child health,
with some differences between age cohorts. Displaced children less than 12 years of age
display lower height-for-age z-scores, indicating a poorer nutritional status compared to
non-displaced children of this age group. Yet, teenagers do not experience a significant
effect on displacement on height-for-age standard deviations. Exposure to displacement
leads to a lower subjective health status for children from all age cohorts. Together with the
result that being displaced does not raise the probability of suffering from health problems
significantly (except for children aged 5-12 in case of OLS estimates), this implies that bad
subjective health is not limited to acute illnesses but incorporates facets beyond physical
health. Due to the dependence of a subsidized health insurance from native municipalities,
displacement often interrupts the affiliation to a health insurance. As a consequence,
displaced children from all age cohorts are uninsured significantly more often than non-
displaced children.
The remainder of this paper is organized as follows. In the next section, I review the
literature of the impact of conflict on child health. Section three gives a brief overview about
health and access to the health care system of displaced children in Colombia. In section
four, I present the data used for the analysis. Section five introduces the empirical strategy,
with results presented in section six. Finally, section seven concludes.
2. Literature Review: Conflict and Child Health
Since 2008, in the economic and sociological literature, there is a growing interest in the
impact of conflict on child health. As noted in the introduction, the majority of studies focus
on African and Asian countries. One reason for this development might be that more of
these countries have been affected by war than countries in other regions and, thus, they
provide a “good” environment for this kind of analysis. The only known exception is
Camacho (2008) for the case of Colombia.
5
Literature in this research area can be grouped into three categories: (i) impact of conflict
experienced in utero on birth weight; (ii) influence of conflict on health in early childhood
measured as height-for-age-z-scores; and (iii) effect of exposure to conflict on child health in
later life. The majority of studies have some features in common. First, they use single and
objective measures for child health, such as birth weight or height-for-age-z-scores. To the
best of my knowledge, subjective measures or access to the health care system are not used.
Second, they combine household data (including child health) with conflict data sets. Third,
as an identification strategy, they exploit the exogenous variation of timing and location of
conflict. Fourth, they arrive at the same conclusion: conflict negatively impacts child health.
Despite the great similarities, details of the studies vary from each other depending on the
focus of the study, such as gender bias, education, household issues or crop failure.
The channels through which conflict influences child health are different for each category,
as I discuss later. This paper falls into the second category, although I will use more
measurements for child health than just height-for-age-z-scores. Moreover, I extend the
analysis to include older children. In the following, I briefly summarize the literature for each
category following the natural order of life from in utero to childhood and adolescence.
Studies of the first category highlight the impact of stress due to conflict on pregnant
mothers. This stress is passed to the embryo in utero negatively influencing his
development, which results in miscarriage or lower birth weight.
Camacho’s (2008) work on Colombia is one of the first examples for this type of research.
She investigates the impact of prenatal stress caused by conflict. She uses landmine
explosions during pregnancy as an indicator for conflict and birth weight as a measure for
child health. Her results show that, consistent with the literature on prenatal stress and birth
outcomes, babies who experienced landmine explosion in utero are born with lower birth
weight than babies in peaceful municipalities who did not experience such explosions.
The impact of exposure to violent conflict in utero, in the case of Nepali insurgency, was
examined by Valente (2011). Results indicate that women living in areas with higher levels of
violence are more likely to suffer from miscarriages or preterm births. Since the use of
6
health care services does not significantly decrease in times of conflict it is likely that these
adverse effects are due to stress triggered by the insurgency.
Mansour and Rees (2012) find the same results as Camacho (2008), but for Palestine:
children whose mothers experienced the Intifada were more likely to be born with a birth
weight less than 2500g. Like Camacho (2008) and Valente (2011), they attribute part of the
results to the psychological stress the mother underwent during the Intifada.
The impact of “milder” forms of conflict on child health is tested by Parlow (2012). He looks
at the Kashmir insurgency and concludes that experiencing the insurgency in utero indeed
decreases height-for-age-z-scores after birth, with those babies born closer to peaks of
violence more strongly affected. An additional finding is that girls are slightly more affected
by the negative consequence of violence since parents have a preference for boys, especially
in rural areas.
One of the earliest papers on conflict and child health falling into the second category is by
Bundervoet et al. (2009). They analyze the impact of conflict on child health in Burundi using
height-for-age z-scores. In addition to the negative impact of conflict on nutritional status,
they find that the impact increases with longer exposure to conflict. They suggest two
channels through which conflict can influence child health: (i) forced displacement; and (ii)
theft and burning of crops. Both lead to a decrease of food availability, which consequently
makes children more prone to disease.
Akresh et al. (2011) compare two different negative shocks, namely conflict and crop failure,
in the early life of children in Rwanda. Results show that both shocks have a negative impact
on child health – measured as height-for-age z-score – but the magnitude of the shock
depends on gender and poverty status. While children suffer equally from the negative
influence of conflict, independent of gender and poverty status, girls from poor families
suffer the most from crop failure. Crop failure has little impact on children from richer
families and boys from poor families. This finding suggests that conflict was a sudden and
unexpected shock and families could not prepare for it and protect their children. Regarding
crop failure, however, rich families are able to cushion shocks and poor families decide to
7
give more available food to boys than to girls. This clearly shows that it is not just the shock,
per se, that negatively impacts child health, but that the nature of a shock (sudden and
unexpected so that people cannot accumulate assets to protect themselves) and human
behavior (treat boys and girls unequally) also matters.
Using war exposure and displacement as conflict variable, Akresh et al. (2012a) investigate
the influence of the Eritrean-Ethiopian conflict on children in Eritrea. They sought to observe
whether there is a gender bias, such that girls are affected more negatively by conflict.
Results suggest that experiencing conflict in early childhood increases the likelihood of
malnutrition. However, as in Akresh et al. (2009) and contrary to Parlow (2012), there is no
evidence of discrimination against girls. Hence it seems that unlike other shocks, conflict is a
shock happening to all families to a similar extent.
Minoiu and Shemyakina (2012) examine the effect of conflict in Cote d’Ivoire on children,
concluding that conflict-affected children experienced significant adverse health outcomes
compared to children living in less affected areas. In line with Akresh et al. (2009, 2012a),
they find no evidence for a discrimination against girls. Additionally, they make the same
observation as Bundervoet (2009), namely that impact severity increases as the duration of
war exposure increases. They explain the negative impact of conflict by displacement, health
impairments and economic losses of households favoring adverse health outcomes.
Using Iraq, Guerrero-Serdan (2009) conducts a detailed analysis on the effects of conflict on
nutritional and health outcomes of young children. Just like Bundervoet (2012), Akresh et al.
(2009, 2012a) and Minoiu and Shemyakina (2012), her results show that children affected by
war at early age display lower height-for-age z-scores. Surprisingly, and in contrast to Parlow
(2012), girls in Iraq are less likely to be affected by stunting in conflict areas, which suggests
that they might be biologically less fragile than boys of the same age. Moreover, she finds
that children in violent areas are more likely to get diarrhea, probably due to poor sanitation
services, an outcome also found by Parlow (2012).
Research falling into the third category goes one step further by analyzing the negative
influence of conflict on child health in later life. Bundervoet (2012) finds for Burundi that

8
malnourished children at baseline were less likely to enroll in school and, if enrolled, did not
complete as much education. This impact is stronger for older children who suffered war
exposure in early childhood. His conclusion is that war exposure leads to bad health
(measured as malnutrition), which leads to low educational attainment. He suggests that this
development might be partly responsible for the long recovery after a war. Therefore,
chronic malnutrition in childhood should be considered to be a serious problem by
humanitarian and aid agencies.
Akresh et al. (2012b) identify how war exposure in childhood and adolescence affects height
of adult women in Nigeria. They conclude that the negative impact of armed conflict on child
health is greatest for teenagers aged 13 to 16. One explanation for this age-specific result is
that adolescents need more food and, thus, are very susceptible to war-related food
shortages. Another explanation for this result might be the survival selection meaning that
younger children are less likely to survive and are thus not included in the survey. Obviously,
only women surviving the war could be included in the survey so it is likely that the true
impact of war on adult height is underestimated.
To sum up the literature, conflict negatively impacts child health and child health-related
outcomes in later life, regardless of is said exposure took place in utero or after birth.
Channels are different, however. It is assumed that low birth weight of children of conflict-
affected mothers can be attributed to the stress caused by experiencing conflict. Medical
research suggests that maternal stress leads to adverse health outcomes of her baby
through changes in the release of the hormone cortisol (Seng et al. 2010). This link is also
suggested by Camacho (2008) for the case of Colombia.
In contrast, violent conflict influences babies via different channels. As pointed out by
Bundervoet et al. (2009) and Minoiu and Shemyakina (2012), war often leads to
displacement of families, economic losses, health impairment and burning of crops. As a
consequence, families run short of food, which leads to child malnutrition, which is reflected
in the low height-for-age z-scores. Additionally, some papers find that the negative impact
for girls is greater than for boys. To the best of my knowledge, there is no study of this type
on Colombia. Therefore, it is interesting to know whether results and channels are similar to
9
those found in African and Asian conflict-affected countries, even though the nature of
conflict (duration and changing location over time) and cultural conditions (there is not as
strong a preference for boys as in some African and Asian countries) are different.
Last, but not least, it is interesting to know whether there are differences in access to the
health care system for children living in conflict or peaceful areas. This topic is neglected in
the conflict literature, probably because many conflict-affected Asian and African countries
do not have a functional health care system. However, Colombia is equipped with a more or
less functional health care system and it is important that is it accessible for conflict-affected
children as well.
3. Health and Health Care System of Displaced Children in Colombia
Internally displaced people face a number of additional health issues compared to non-
displaced individuals. According to Human Rights Watch (2005), displaced families suffer
more frequently from malnutrition, mental health problems and domestic violence. Other
health problems include respiratory illnesses, skin infections, tuberculosis, sexually
transmitted diseases and a high number of teenage pregnancies. Many of these health
concerns can be attributed to the difficult living conditions of displaced people. Often,
displaced families live in extreme poverty and cannot afford to buy enough food and are left
with poor sanitation and housing facilities. Carillo (2009) notes that many displaced persons
cannot afford to regularly eat three meals per day and are not able to feed their families
adequately. As a consequence, they suffer from malnutrition, which has a lasting and
negative impact, especially on children less than five years old.
Exposure to conflict and violence in their former municipalities and the difficult living
circumstances in their new place of residence favor mental illnesses such as sadness,
depression, anxiety, despair, regression to childhood and aggressive behavior. Additionally,
many households experience domestic violence, substance abuse or divorce. Around 67% of
displaced households indicate suffering from psychosocial problems, with 24% of them
looking for help, but only 15% actually receiving some form of assistance. This is due to the
fact that Colombia lacks psychosocial services for displaced people and because many do not
10
have health insurance, resulting in the fact that they cannot afford to pay these services
(Carrillo 2009).
Officially, every Colombian citizen has access to basic healthcare services. There are three
different healthcare systems. The first one is the so-called contributory scheme that is
obligatory for formal and independent workers who earn at least twice the minimum wage.
The second system is the subsidized scheme that was introduced to provide the poor, who
cannot afford to pay for health insurance, with basic health care services. Since there is not
enough space for all poor in the subsidized scheme, there is a third scheme for the
temporarily unaffiliated – the “Vinculados.” In order to become a member of the subsidized
scheme, individuals must apply to his or her municipality, which then determines if he or she
belongs to the SISBEN level 1, 2 or 3 (which identifies them as poor). Every municipality has a
certain number of places for poor individuals. Since resources are not plentiful enough to
cover all qualified applicants, prioritizing is necessary. Those who are not able to get a place
in the subsidized scheme only have the option of joining the “Vinculados” group. After a
municipality grants access to an individual he or she has to pick his or her favored health-
promoting entity. After having done this, the individual is enrolled and receives a
membership card, which is valid for using health care services in that municipality (Cabrera
2011, 212f).
The design of the system clearly presents challenges to displaced individuals, especially
those who are members of a subsidized program. Since membership via a subsidized scheme
is only valid for a specific municipality, people who move or are forcefully displaced must
apply anew in their new municipality if they still want subsidized health insurance. There are
problems associated with this procedure. First, during the time between exiting the scheme
in the original municipality and that of entering in the new municipality, the individual might
lack any insurance. Second, before an individual can apply for health subsidies in their new
municipality, the former municipality must release an individual’s health care file, which
some municipalities refuse to do (Webster 2012, Part 2). Third, some of the displaced
choose not to enter the health care system because in the process their original municipality
would learn about their new home, which could, ultimately, put their life at risk. Fourth, if
there is no more space in the subsidized scheme, they can only participate in the

11
“Vinculados” program. In the “Vinculados” program, people receive a document indicating
their status and entitling them to emergency care. However, they must pay 30% for medical
services, which is a significant amount of money for those living in extreme poverty.
Moreover, drug costs are not covered under the subsidized scheme, meaning that it is
challenging or impossible for displaced families to afford needed medications (Human Rights
Watch 2005).
To sum up, exposure to conflict and forced displacement is likely to negatively impact
physical and mental health. Unfortunately, the displaced are also the ones least likely to be
having health insurance; hence it is more difficult for them to get needed care.
4. Data and Descriptive Statistics
The data used for this analysis come from the Demographic and Health Survey (DHS) 2010.
This survey includes information on 204,459 individuals ranging from birth to 96 years of
age, living in 258 municipalities. The majority of individual level data collected is on women
aged 13-49 and children under 5 years of age. Additionally, the survey asks for detailed
information on the households, which is useful for the subsequent analysis. Fortunately,
some variables, including health, education, age and ethnicity, are collected for each
household member, independent of sex and age.
Another useful feature of the survey concerns the questions on household migration. I not
only know whether the household has moved to a different place after 2004 (that is to say
after the last DHS survey) but we also know the reason for the movement, including those
moving due to paramilitary or guerilla group caused violence. Out of these two variables
(migrated after 2004: yes/no; why did you move: paramilitary or guerilla group violence) I
construct a displacement variable taking the value one if both questions are answered
positively. Unfortunately, we do not know the household’s previous location, which would
have given me the possibility to merge DHS data with conflict data. Therefore, I have to rely
on the household’s subjective threat of violence in the municipality of origin, which has both
advantages and disadvantages. On the one hand, we do not know anything about the
intensity of violence in the household’s former municipality because it is not possible to
measure intensity with more objective data. On the other hand, we know that the
12
household felt threatened by illegal armed groups, which is likely to indicate direct exposure
to violence, something we are not able to tell when using official data. Although a high rate
of violence within a municipality might not affect a specific household if they are far away,
there might be cases where one attack is sufficient to cause a household to move to another
municipality. For the analysis, I assume that if a household declares that it left the
municipality due to violence by illegal armed groups, it was a victim of conflict. In fact, the
number of victims from conflict might be underestimated because households were only
asked about violence if they had migrated. The predominant reasons for migration were
family reasons (34%), working opportunities (28%), seeking better conditions (17%), and
violence by paramilitary and guerilla groups (12%). Those who migrated in search of better
conditions might also be affected by violence but do not want to admit it. Other migrating
households might also have been affected by conflict but it was not the principal reason to
leave the municipalities. Overall, this variable appropriately catches the stress a household is
facing due to conflict.
For the econometric analysis, I divide the survey into three age groups because the impact of
conflict is likely to be different for infants, primary school children and teenagers. The first
group comprises babies and children less than 5 years of age, the second group includes
primary school children aged 5-12, the third group contains teenagers from 13 to 18.
I use four health variables that take the different pillars of health into account. The first
variable is height-for-age z-scores or standard deviations, respectively, to get an impression
of the individual’s nutritional status. This indicator is widely used in the child health
literature, as I noted in the introduction. Z-scores or standard deviations less than -2 indicate
moderate and less than -3 severe malnutrition.
The second variable asks parents to rate their child’s health on a scale from 1 (excellent) to
five (bad). A potential benefit of this variable is that it also tackles aspects of health that
cannot be measured directly in a short time during the survey, for example mental health or
social and cognitive development. Additionally, it might give us a more comprehensive
impression of an individual’s health status since it doesn’t look at isolated phenomena such
as diarrhea, fever or malnutrition. A disadvantage is that the “same” health status might be
13
rated differently by different individuals for various reasons. Overall, it is a valuable indicator
for an individual’s overall wellbeing, which is very likely to be negatively affected by conflict
and displacement.
The third variable asks whether the child had a health problem last month. It is a more
subjective indicator than height-for-age z-scores, where measurements are usually taken by
the interviewer, but more objective and restrictive than subjective health because it asks for
concrete health problems such as respiratory or gastrointestinal diseases.
The last health indicator regards health insurance membership. I include this variable in
order to determine the impact of displacement on the household’s health care system
access. Families not affiliated to a health insurance either do not have a formal job or were
not successful in being admitted to a subsidized health insurance by the municipality.
Additionally, displaced families might not even try to get subsidized health insurance out of
fear to reveal their new municipality. Furthermore, since membership to a subsidized health
insurance is linked to a certain municipality, insurance membership is probably disrupted by
displacement.
The independent variables comprise a variety of individual and household characteristics
differing slightly across age groups. Individual characteristics for all age groups include age,
sex, ethnicity and years of education (except for the youngest age group, where maternal
educational attainment is instead included). Additionally, for all children I include a dummy
for participating in the Conditional Cash Transfer program, Familias en Acción, which is only
accessible to poor families living in rural areas. For the youngest age group additional
variables for premature birth and birth order are included since they probably affect health
outcomes at younger age. To characterize households socioeconomically, I include the
number of household members and children less than five years old, as well as dummies for
poor, female headed and urban households plus infrastructure and consumption indices.
The infrastructure index measures the share of access to electricity, gas, piped water, sewer
and garbage collection for a household. The consumption index indicates the household’s
durable consumer goods (radio, TV, refrigerator, bike, motorcycle, car, landline and mobile
telephone). Including these two indices improves the measurement of household
socioeconomic status, beyond what is possible with only including a dummy for poverty.
14
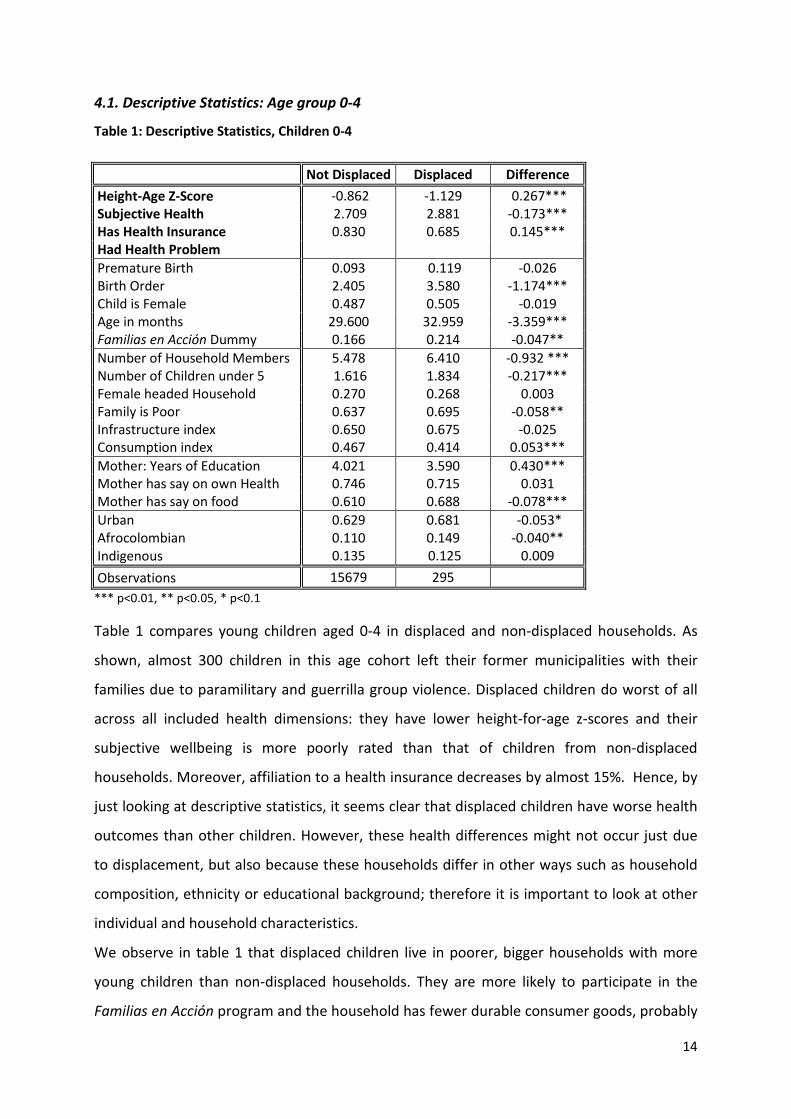
4.1. Descriptive Statistics: Age group 0-4
Table 1: Descriptive Statistics, Children 0-4
Not Displaced Displaced Difference Height-Age Z-Score -0.862 -1.129 0.267*** Subjective Health 2.709 2.881 -0.173*** Has Health Insurance 0.830 0.685 0.145*** Had Health Problem Premature Birth 0.093 0.119 -0.026 Birth Order 2.405 3.580 -1.174*** Child is Female 0.487 0.505 -0.019 Age in months 29.600 32.959 -3.359*** Familias en Acción Dummy 0.166 0.214 -0.047** Number of Household Members 5.478 6.410 -0.932 *** Number of Children under 5 1.616 1.834 -0.217*** Female headed Household 0.270 0.268 0.003 Family is Poor 0.637 0.695 -0.058** Infrastructure index 0.650 0.675 -0.025 Consumption index 0.467 0.414 0.053*** Mother: Years of Education 4.021 3.590 0.430*** Mother has say on own Health 0.746 0.715 0.031 Mother has say on food 0.610 0.688 -0.078*** Urban 0.629 0.681 -0.053* Afrocolombian 0.110 0.149 -0.040** Indigenous 0.135 0.125 0.009 Observations 15679 295
*** p<0.01, ** p<0.05, * p<0.1 Table 1 compares young children aged 0-4 in displaced and non-displaced households. As
shown, almost 300 children in this age cohort left their former municipalities with their
families due to paramilitary and guerrilla group violence. Displaced children do worst of all
across all included health dimensions: they have lower height-for-age z-scores and their
subjective wellbeing is more poorly rated than that of children from non-displaced
households. Moreover, affiliation to a health insurance decreases by almost 15%. Hence, by
just looking at descriptive statistics, it seems clear that displaced children have worse health
outcomes than other children. However, these health differences might not occur just due
to displacement, but also because these households differ in other ways such as household
composition, ethnicity or educational background; therefore it is important to look at other
individual and household characteristics.
We observe in table 1 that displaced children live in poorer, bigger households with more
young children than non-displaced households. They are more likely to participate in the
Familias en Acción program and the household has fewer durable consumer goods, probably
15
because of poverty or because assets were left behind when the family was displaced.
Interestingly, there is no significant difference in infrastructure access.
Displaced households with very young children are also not more likely to be female headed
than other households. However, the mother has the final say on the food cooked more
frequently which might be a result of changing roles in the household. In displaced
households, women often gain additional power because it is easier for them to settle in and
to find a job in urban areas (Calderón et al. 2011).
We also note from Table 1 that displaced babies more often live in urban areas and are more
likely to be of Afrocolombian origin. Both observations are in accordance with the literature:
households threatened by violence often flee from rural areas to cities and Afrocolombians
are disproportionally affected by conflict since fighting and coca cultivation often takes place
in their areas of residence.
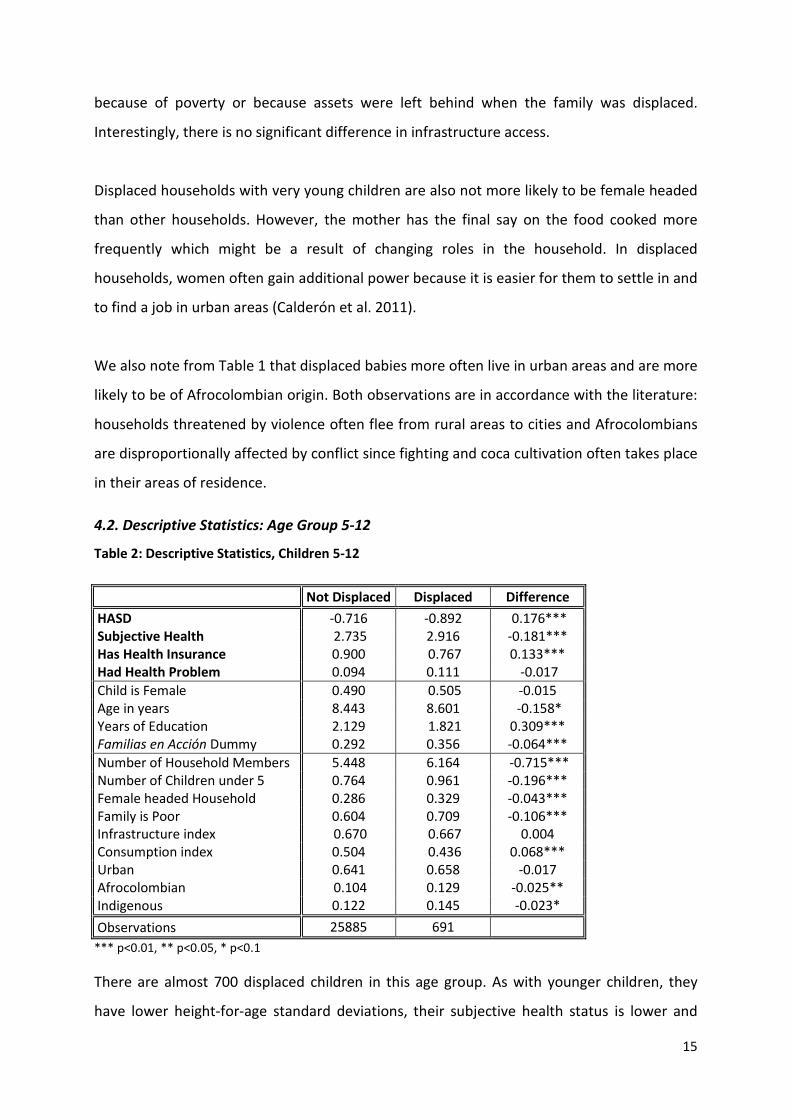
4.2. Descriptive Statistics: Age Group 5-12
Table 2: Descriptive Statistics, Children 5-12
Not Displaced Displaced Difference HASD -0.716 -0.892 0.176*** Subjective Health 2.735 2.916 -0.181*** Has Health Insurance 0.900 0.767 0.133*** Had Health Problem 0.094 0.111 -0.017 Child is Female 0.490 0.505 -0.015 Age in years 8.443 8.601 -0.158* Years of Education 2.129 1.821 0.309*** Familias en Acción Dummy 0.292 0.356 -0.064*** Number of Household Members 5.448 6.164 -0.715*** Number of Children under 5 0.764 0.961 -0.196*** Female headed Household 0.286 0.329 -0.043*** Family is Poor 0.604 0.709 -0.106*** Infrastructure index 0.670 0.667 0.004 Consumption index 0.504 0.436 0.068*** Urban 0.641 0.658 -0.017 Afrocolombian 0.104 0.129 -0.025** Indigenous 0.122 0.145 -0.023* Observations 25885 691
*** p<0.01, ** p<0.05, * p<0.1 There are almost 700 displaced children in this age group. As with younger children, they
have lower height-for-age standard deviations, their subjective health status is lower and

16
they have health insurance less frequently than non-displaced children. However, there is no
significant difference in suffering from a health problem last month for displaced and non-
displaced children. Already at this age, children from displaced families are lagging behind in
school significantly.
As above, households of displaced families are larger, poorer, have a lower consumption
index and participate in the CCT program Familias en Acción more frequently. Unlike
younger children from displaced families, older children live significantly more often in
female headed households (33% compared to 27%, the percentage has stayed almost the
same for non-displaced households). This might be a consequence of changing role models,
which the former male head of the household may not agree to in the longer term.
4.3. Descriptive Statistics: Age Group 13-18
Table 3: Descriptive Statistics, Children 13-18
Not Displaced Displaced Difference HASD -0.464 -0.713 0.249*** Subjective Health 2.801 2.976 -0.175*** Has Health Insurance 0.895 0.747 0.148*** Had Health Problem 0.078 0.074 0.004 Child is Female 0.507 0.489 0.017 Age in years 15.330 15.136 0.194** Years of Education 7.564 6.432 1.132*** Familias en Acción Dummy 0.194 0.274 -0.080*** Number of Household Members 5.424 6.160 -0.736*** Number of Children under 5 0.498 0.657 -0.159*** Female headed Household 0.319 0.423 -0.104*** Family is Poor 0.553 0.691 -0.138*** Infrastructure index 0.704 0.672 0.032** Consumption index 0.528 0.433 0.095*** Urban 0.683 0.697 -0.014 Afrocolombian 0.099 0.122 -0.023 Indigenous 0.103 0.197 -0.093*** Observations 16200 376
*** p<0.01, ** p<0.05, * p<0.1 As for younger children, we observe poorer health outcomes for displaced teenagers
compared to non-displaced ones. Moreover, displaced teenagers have more than one year
less education than their non-displaced counterparts. Differences in household
characteristics are the same as in families with small children. Additionally, the number of

17
female headed households (42%) increases dramatically compared to non-displaced
households (32%) and to displaced households with younger children (33%).
In a nutshell, we observe for all age groups that displaced households differ in various ways
from non-displaced households: in general, they are poorer, bigger, have more children less
than five years old, are more likely female headed, and disproportionally more often from
ethnic minorities. Displaced household members achieve less education and are more likely
to participate in the CCT program, Familias en Acción. Regarding health outcomes, they are
more susceptible to malnutrition (measured as height-for-age standard deviation), report
worse subjective health, and more likely to have had a health problem in the last month.
Additionally, significantly fewer of them have health insurance.
5. Empirical Strategy
The empirical strategy relies on a comparison of the differing health outcomes of displaced
and non-displaced children of similar age. The idea behind this approach is that differences
in health outcomes for otherwise similar individuals only arise due to displacement. In this
scenario, displacement is the treatment and displaced children belong to the treatment
group, while non-displaced children constitute the control group. I would like to know the
impact of treatment, i.e. displacement, on certain health outcomes. In a perfect world, one
would know the individual’s health outcomes with and without displacement in order to
determine the impact of treatment. In the real world, however, this is not possible since one
can only observe one status – displaced or not displaced – per individual at the same time.
One way to overcome this problem is to use a control group, that is to say individuals who
did not get the treatment, in this case meaning that they were not displaced. The first
thought might be to simply take differences between outcomes of treated and untreated
individuals and consider this difference as treatment impact. In most cases, however, this
procedure does not reveal the true impact of treatment because groups not only differ
regarding their treatment status but also for a variety of other characteristics that might
influence outcomes of interest or participation in treatment directly or indirectly as well.
When looking at the descriptive statistics in the previous section of this paper, I noticed that
there are not only differences in health outcomes of displaced and non-displaced children
18
but that displaced and non-displaced children are also different in multiple other aspects,
like years of education, family size, socioeconomic status and ethnicity. Ignoring these
factors would result in selection bias. Selection bias means that treated and untreated
individuals have different outcomes even without treatment. This bias can be caused by
observable or unobservable characteristics (Caliendo and Hujer 2006). It is very unlikely that
sorting into displacement is random in Colombian municipalities. Hence I must find another
way to compare the health outcomes of displaced and non-displaced children.
The first approach is to use a linear regression model of the form
ΔRegATT = E(Y1-Y0|X, D=1) = X(β1-β0) + E(U1-U0|X, D=1) (1)
Where Y1 is the outcome with treatment, Y0 is the outcome for the control group, X
represents a set of covariates, U1 and U0 are the usual error terms and D is a binary variable
taking the value one for treated individuals. This equation states that treatment effects are
calculated as the difference in outcomes after controlling for as many outcome-influencing
regressors as possible.
In this paper, Y represents the four health outcomes: (i) height-for-age standard deviation
(or z-score for the youngest group); (ii) subjective health; (iii) health problem last month; and
(iv) health insurance membership. Height-for-age standard deviation is a metric variable,
subjective health is measured on an ordinal scale with 5 categories while the outcomes
health problem last month and health insurance membership are dichotomous variables.
Independent variables include individual and household characteristics as well as dummies
for year of the interview, ethnicity, urban location, region, municipality and department. The
set of individual covariates consists of age, gender, years of education, participation in
Familias en Acción, child is twin or born premature and birth order. Independent variables
on the household level comprise number of household members, number of children under
5, female headed household, household lives in poverty, access to infrastructure and
number of durable consumer goods. Three out of the six specifications are clustered on the
household level.
19
Since the linear regression model has the serious drawback that it does not necessarily
compare only similar treatment and control groups, propensity score matching is used as a
second approach to estimate the impact of displacement on child health. Linear regression
models display estimates even without an appropriate control group because the linear
functional form assumption replaces missing data whereas propensity score matching
ensures the similarity of treatment and control group due to the common support
assumption (Caliendo and Hujer 2006).
The technique of propensity score matching was first discussed by Rosenbaum and Rubin
(1983). The idea of this method is to find for each individual from the treatment group a
perfect match in the control group when randomization across groups is not possible.
Perfect match means that these two individuals possess the same characteristics except for
the fact that one of them was treated, which in this case is to be displaced. Then it is
possible to calculate the treatment effect simply by subtracting the outcomes of treated and
untreated individuals. Often, however, there are so many characteristics that need to be
similar in order to find a suitable match that no counterfactual can be found for each treated
individual in reality. In order to increase the likelihood of finding adequate counterfactuals
for the treatment group, so-called propensity score matching is implemented. This
technique finds counterfactuals for treated individuals by relying on propensity scoring. This
score reflects the probability of belonging to the treatment group based on observable
characteristics X, which are likely to influence treatment participation. After having
calculated propensity scores for all observations, the outcomes of individuals with similar
propensity scores are compared. The treatment effect is then computed as the difference in
outcomes across treatment and control group. Treated individuals for whom no
counterfactual with similar propensity score can be found are dropped from the analysis
(Khandker et al. 2010).
There are various methods to calculate propensity scores; I highlight the three that I use for
the analysis. The first, and probably most intuitive, is nearest-neighbor matching, which
matches the counterfactual with the most similar propensity score to the treated
observation. The disadvantage of this matching method is that sometimes the closest
neighbor is far away and therefore chosen control units are bad matches for treated units.
20
The second matching technique is stratification matching. Here, the region of common
support is divided into different strata and the treatment effect is calculated within each
stratum as difference between treatment and control observations. In the end, an overall
treatment effect is computed by calculating a weighted average of these stratum treatment
effects. The share of observations per stratum is the respective weight. The last method
used in this paper is kernel matching. Compared to the other matching techniques it has the
advantage that it uses all observations within the common support. Kernel matching uses a
weighted sum of all control group members, with the greatest weight given to observations
with similar propensity scores as the treated person.
There are two main disadvantages of using propensity score matching. First, if there are
unobserved factors that influence the selection into treatment or control group, the
propensity score will be biased. Consequently, the computed treatment effect based on
biased propensity scores does not correspond to the true treatment effect. Second, if
observed characteristics from treatment and control group differ too much from each other,
the region of common support might be rather small because many observations from the
treatment or control group are dropped. This situation could lead to a sampling bias in the
treatment effect. Therefore, I use two different methods to estimate the effect of
displacement on health outcomes.
6. Results
6.1. Linear Regression Model
6.1.1. Age group 0 – 4
Table 4 (in the appendix) shows estimation results for height-for-age z-scores using OLS
regressions. We see that displacement negatively impacts nutritional status significantly, at
the 1% level, for small children and that the size of this impact is similar across all
specifications. This finding is in line with research undertaken in African and Asian countries,
which also find a negative impact of conflict on nutritional status. Malnutrition could occur
after displacement due to the limited availability of food in the new location or due to lower
quality food. It could also be that malnutrition existed before displacement due to conflict
and that scarcity of food was one reason to leave the municipality.
21
Control variables show that premature birth, being a twin, having a higher birth order
number (that is to say being among the younger children in a family) and coming from a big
and/or poor family leads to lower z-scores, as expected. Interestingly, being a female child is
associated with a higher z-score, a result also found by Guerrero-Serdán (2009). She explains
this finding with the assumption that baby girls are more robust than baby boys.
We see the impact of displacement on subjective health in table 5 in the appendix of this
paper (please note that higher values correspond to poorer health outcomes). Displaced
children are rated with a poorer health status by their parents. This means that conflict
actually leads to worse health outcomes or that displaced parents perceive their child’s
health to be worse than do non-displaced parents. As with height-for-age z-scores, children
who live in bigger, poorer or female headed households are associated with worse health
status. Findings are robust across the different specifications and coefficients sizes also do
not change.
We note in table 6 (in the appendix) that displacement decreases affiliation to a health
insurance by almost 15%. This finding is significant for all specifications on the 1% level. It is
very likely that – if they previously had insurance - displaced households lose their affiliation
to the health insurance in the course of displacement because they are changing their
location and thus the connection to the health insurance is interrupted. What we observe
from table 6 is that participating in the Familias en Acción program has a positive impact on
having health insurance probably because by participating in this program they are officially
registered as poor. The children of large and female headed households are significantly less
likely to have health insurance membership.
In contrast to other health outcomes for this age group, displacement does not affect the
incidence of health problems during the last month, as displayed in table 7 (in the appendix).
Young children from bigger families suffer significantly less often from health problems. One
reason could be that in big families less attention is given to each child and therefore health
problems are not detected as frequently as in smaller families. Alternatively, perhaps, the
parents are better able to tell what health problems are severe and worth telling to the
interviewers because they’ve had more experience.
22
6.1.2. Age group 5-12 We observe in table 8 (in the appendix) that, unlike younger children, displacement has no
significant impact on height-for-age standard deviation of primary school children. One
explanation could be that this age group is not so vulnerable to malnutrition, as opposed to
younger children. As before, being female positively impacts nutritional status, while coming
from a poor, large household increases the likelihood for malnutrition.
Being displaced has a negative and significant impact on overall health, as seen in table 9 (in
the appendix). Children from big, female headed and poor households suffer more from
poor health conditions. An interesting finding is that living with younger children has a
positive impact on children aged 5-12. One explanation could be that compared to younger
children, who are ill more often due to their developing immune system, parents consider
older children to be healthier.
Table 10 (in the appendix) indicates that displacement decreases the likelihood for children
aged 5-12 to be affiliated to a health insurance by approximately 12%. This is slightly less
compared to younger children but still a relatively large number. As for the first group,
participating in Familias en Acción positively influences health insurance enrollment.
We note in table 11 (in the appendix) that significantly more children from displaced families
suffered from a health problem last month. This could be a consequence of the difficult
living situations that displaced households face; that is to say poor quality housing, limited
access to health services and medication, low quality or limited food, or environmental
disadvantages like pollution.
6.1.3. Age Group 13-18 We observe in table 12 (in the appendix) that displacement does not significantly affect
height-for-age standard deviations. This is the same result that we found for primary school
children. As opposed to younger children, female teenagers are significantly more vulnerable
to malnutrition. One explanation for this result might be that male teenagers demand more
food because they are growing rapidly during this period of life. As a consequence, there
might be less food available for female teenagers. On the other hand, young women might
23
try to eat less in order to meet expectations of an ideal body. As with previous results,
coming from a big, poor family influences nutritional status negatively.
Being a displaced teenager affects subjective health in a negative manner, as reported in
table 13 (in the appendix). This is a similar finding to that for younger children and babies.
Female teenagers and youth from female headed and poor households also report a poorer
subjective health status.
Table 14 (in the appendix) shows that, as for younger children, being displaced reduces
health insurance membership of teenagers by 14%. Participating in Familias en Acción has a
significant and positive impact on being affiliated to a health insurance. This might be due to
the fact that these teenagers are officially registered for SISBEN 1 or 2, which is a
precondition for applying for the subsidized health care system.
Displacement does not significantly increase the risk of suffering from a health problem for
teenagers as shown in table 15 (in the appendix). Hence, the negative impact of
displacement on subjective health might not be due to obvious health problems but more a
feeling of diffuse indisposition.
6.2. Propensity Score Matching
6.2.1. Age group 0-4
Table 16 shows health outcomes using the different propensity score matching techniques,
comparing them to OLS results. We see that displacement has a negative and significant
impact on height-for-age standard deviation for all specifications except nearest neighbor
matching. The coefficients of kernel and stratification matching are slightly larger than OLS
estimates. Hence we can say that this negative impact is robust across different estimation
techniques.
In the second part of this table we see that displacement increases the likelihood of suffering
from poor subjective health for all estimations, with the only exception being, as before,
nearest neighbor matching. As with height-for-age z-scores, coefficients are smaller for OLS
24
estimates than for propensity score matching. Overall, we find robust support for the
negative impact of displacement on subjective child health.
The third part of table 16 summarizes the estimated effect of displacement on being
affiliated to a health insurance. The average treatment effects indicates that displaced
children have a lower probability of being member of a health insurance compared to the
control group, irrespective of the type of matching technique used. In this case, estimates of
propensity score matching and OLS estimates are of similar size, which is a sign for a robust
estimation result.
We observe in the last part of table 16 that displacement does not significantly increase the
likelihood of having health problems, a result we also found using linear regression models.
Therefore, we suggest that the aforementioned bad subjective health for displaced children
does not necessarily imply that they suffer from more or severe diseases but that it might
rather be a mix of malnutrition and psychosocial problems.
6.2.2. Age group 5-12 Table 17 provides results of the impact of displacement on health outcomes for primary
school children. Unlike for the younger age cohort, significance of estimates is not consistent
across propensity score matching and OLS regression for height-for-age standard deviation
and having a health problem. We observe in the first section of table 17 that, according to
propensity score matching, displacement affects nutritional status of children aged 5-12
negatively, irrespective of the matching technique used. However, OLS regression estimates
do not provide a significant result. This difference could come from the fact that in
propensity score matching just similar individuals are compared whereas with OLS this must
not be the case. In the case of having a health problem last month it is the other way round,
namely that propensity scores estimates do not show any significant effect of displacement
whereas OLS estimates suggests a negative influence of displacement on illnesses.
For the remaining two health outcomes I find significant and robust results across all
specifications; results similar in size to that one of the younger age cohort. Part 2 of table 17
suggests that parents of primary children who have been displaced in the past 5 years
indicate a lower subjective health status for their children. I find the approximately the same
25
size of this effect for propensity score matching and OLS regression models thus indicating a
robust finding. The third section of table 18 provides evidence for a significantly lower
coverage of health insurance among displaced primary school children compared to non-
displaced children. Estimates from propensity score matching are about the same size
independent of the matching technique used. Additionally, their magnitude is similar to OLS
estimates and to estimates for children aged 0-4.
6.2.3. Age group 13-18 Table 18 suggests that, when compared to younger children, displacement does not have as
strong a negative impact on teenager’s health outcomes. With the exception of kernel
matching (for height-for-age standard deviation), there is no significant impact of
displacement on nutritional status and the likelihood of suffering from a health problem.
One explanation for this finding might be that their health is more robust (partly because
due to immunization caused by illnesses in early childhood) and that for this reason they are
less prone to diseases.
The second part of table 18 displays estimates of displacement on subjective health. The size
of these estimates is significantly smaller than estimates for younger children and is only
significant at the 5% or 10% level (with the exception of kernel estimates which are
significant on the 1% level). This evidence suggests that displacement is less of a problem for
subjective health status.
Regarding health insurance membership, we find the same picture as for younger children,
namely that being displaced reduces the likelihood of being affiliated to a health insurance
due to the issues discussed in section 3. The magnitude of the coefficients is consistent
across matching techniques and displays similar estimates not only for OLS regressions but
also compared to children aged 0-12. Hence, not being affiliated to a health insurance and,
thus, having only limited access to the health care system poses a big problem for displaced
families and their children – regardless of age.
7. Conclusion
This paper investigates the causal impact of displacement on health outcomes for Colombian
children of different age cohorts. It uses the Colombian Demographic and Health Survey
26
2010, which provides both a number of health outcomes and information about
displacement. Additionally, it includes many characteristics on children and their respective
households. A novelty of this paper compared to other research on this topic is that it
employs two different empirical strategies to identify the impact of displacement on child
health. The first approach applies a linear regression model and includes displacement status
as a binary independent variable, along with many individual and household characteristics.
In order to capture different dimensions of health, four health outcomes are used as
dependent variables: (i) height-for-age standard deviation or z-scores; (ii) subjective health
status; (iii) affiliation to a health insurance; and (iv) having a health problem last month. The
validity of results is tested using six varying specifications – differences concern clustering on
the household level and including dummies on regions, department or municipalities.
However, two problems could arise using only this method. First, displacement is probably
not random across children as some are more likely to be displaced than others. Not taking
this issue into account could result in a selection bias. Second, displaced and non-displaced
children might be different in some characteristics, meaning that differences in health
outcomes are not just because of displacement but also due to other factors. In order to
overcome this problem, propensity score matching is employed as a second empirical
strategy. To get robust findings, three matching techniques are used: (i) nearest neighbor
matching; (ii) stratification matching; and (iii) kernel matching.
Overall, a negative relationship between displacement and child health is documented, with
some differences between age cohorts. In line with findings from African and Asian
countries, armed conflict – measured as displacement in this case – increases the likelihood
of malnutrition for young children. Additionally, this study also finds a negative relationship
between nutritional status and displacement for primary school children. The nutritional
status of teenagers is not significantly influenced by displacement. The main reason for
these results is probably the insufficient supply of high quality food due to displacement,
which has a much stronger effect on younger children.
Being displaced leads to a lower subjective health status for children from all age cohorts.
Together with the finding that displacement does not increase the likelihood of suffering
27
from health problems significantly (except for children aged 5-12 in case of OLS estimates),
this implies that bad subjective health is not linked to acute diseases but takes into account
aspects beyond physical health. Therefore, it could be assumed that displaced parents rate
their child’s health worse compared to a non-displaced parent due to malnutrition or
psychosocial problems caused by displacement. Since this finding is robust across age groups
and specifications, more attention should be given to improve the overall health status of
displaced children. Measures could include psychological support for parents and children as
well as improving food supplies in order to avoid malnutrition.
As previously noted, displaced children are not affected by health problems significantly
more often than non-displaced children. This is a surprising finding since one would expect
that displacement leads to an increase in infectious diseases like diarrhea and acute
respiratory illnesses due to poor housing and sanitation facilities. It might be that the true
impact of displacement on diseases is underestimated. First, the survey only asks about
health problems in the last month and, therefore, older illnesses are not accounted for.
Second, chronic illnesses might be “forgotten” by the respective household member because
the chronic illness already represents normality and is therefore not mentioned by the
respondent.
Last, but not least, displaced children from all age cohort are significantly less likely to have
health insurance. This finding is understandable when looking at the complex process of
obtaining access to subsidized health insurance in Colombia. Since a subsidized health
insurance is linked to specific municipalities, affiliation is disrupted by displacement. In their
new municipality, displaced people must apply anew with their new municipality in order to
obtain insurance. Two problems arise frequently. First, access to the subsidized health care
is limited, as municipalities do not have enough resources for its poor inhabitants. Second, in
order to obtain access to the subsidized insurance in a new municipality, it is necessary to
disclose the municipality of origin. Displaced people often do not want to reveal their former
municipality out of fear of threats by paramilitaries or guerrilla groups. Consequently, they
choose to forgo health insurance. In order to improve the access to health care for displaced
families, the process of becoming a member of a health insurance should be simplified and
more places should be made available for displaced persons.
28
A next step in research would be to analyze the consequences of being uninsured for
displaced families. It could be that due to lacking access to the health care system, displaced
people use health care services or pre-, ante- and postnatal care less often. In the long-term,
this situation is likely to lead to deteriorating health outcomes for uninsured, displaced
families. Therefore, it would be useful to compare the use of health care services of
displaced and non-displaced families in order to take adequate measures to provide
displaced families with basic health care services they can afford.
29
References
Akresh, R., Verwimp, P. and T. Bundervoet. 2011. Civil War, Crop Failure, and Child Stunting in Rwanda. Economic Development and Cultural Change 59(4): 777-810.
Akresh, R., Lucchetti, L. and H. Thirumurthy. 2012a. Wars and Child Health: Evidence from the Eritrean-Ethiopian Conflict. Journal of Development Economics 99: 330-340.
Akresh, R., Bhalotra, S., Leone, M. and U. Osili. 2012b. War and Stature: Growing Up during the Nigerian Civil War. American Economic Review 102(3): 273-277.
Alderman, H., Hoogeveen, H. and M. Rossi. 2006. Reducing Child Malnutrition in Tanzania: Combined Effects of Income Growth and Program Interventions. Economics and Human Biology 4(1): 1-23.
Almond D., and J. Currie. 2011. Killing Me Softly: The Fetal Origins Hypothesis. Journal of Economic Perspectives 25(3): 153-72.
Almond D, Currie J. 2010. Human Capital Development before Age Five. In: The Handbook of Labor Economics, 4b.ed. O Ashenfelter, D Card, 15:1315-486. Amsterdam: Elsevier Science B.V.
Bundervoet, T., Verwimp, P. and R. Akresh. 2009. Health and Civil War in Rural Burundi. Journal of Human Resources 44(2): 536-563.
Bundervoet, T. 2012. War, Health, and Educational Attainment: A Panel of Children during Burundi’ s Civil War. HiCN Working Paper 114. Households in Conflict Network.
Cabrera, E. 2011. The Subsidized Health-care Scheme in the Social Protection System – Colombia. In: Sharing Innovative Experiences. Successful Social Protection Floor Experiences.Volume 18: 211-238. UNDP., New York, USA.
Calderón, V., Gáfaro, M. and A. Ibáñez. 2011. Forced Migration, Female Labor Force Participation, and Intra-household Bargaining: Does Conflict Empower Women? MICROCON Research Working Paper 56. A Micro Level Analysis of Violent Conflict.
Caliendo, M. and R. Hujer. 2006. The Microeconometric Estimation of Treatment Effects—An Overview. Advances in Statistical Analysis 90(1): 199-215.
Camacho, A. 2008. Stress and Birth Weight: Evidence from Terrorist Attacks. American Economic Review 98(2): 511-515.
Carrillo, A. 2009. Internal Displacement in Colombia: Humanitarian, Economic and Social Consequences in Urban Settings and Current Challenges. International Review of the Red Cross 91(875): 527-546.
30
Case, A., Lubotsky, D. and C. Paxson. 2002. Socioeconomic Status and Health in Childhood: The Origins of the Gradient. American Economic Review 92(5): 1308–1334.
Case, A., Fertig, A. and C. Paxson. 2005. The Lasting Impact of Childhood Health and Circumstance. Journal of Health Economics 24: 365–389.
Case, A. and C. Paxson. 2010. The Long Reach of Childhood Health and Circumstance: Evidence from the Whitehall II Study. NBER Working Paper 15640. National Bureau of Economic Research.
Chen, Y. and L. Zhou. 2007. The Long-Term Health and Economic Consequences of the 1959-1961 Famine in China. Journal of Health Economics 26(4): 659-681.
Chen, Y. And L: Hongbin. 2009. Mother's Education and Child Health: Is There a Nurturing Effect? Journal of Health Economics 28(2): 413-426. Chen, Y., Lei, X. and L. Zhou. 2010. Child Health and the Income Gradient: Evidence from China. IZA Discussion Papers 5182. Institute for the Study of Labor (IZA). Currie, J. And R. Hyson. 1999. Is the Impact of Health Shocks Cushioned by Socioeconomic Status? The Case of Low Birth Weight. American Economic Review Papers and Proceedings 89(2): 245–250.
Currie, J. and M. Stabile. 2004. Socioeconomic Status and Health: Why is the Relationship Stronger for Older Children? American Economic Review 93(5): 1813–1823.
Currie, A., Shields, M., and S. Price. 2007. Is the Child Health / Family Income Gradient Universal? Evidence from England. Journal of Health Economics 26(2): 213-232.
Currie, J. and T. Vogl. 2012. Early-Life Health and Adult Circumstance in Developing Countries. NBER Working Papers 18371. National Bureau of Economic Research. David, V., Moncada, M. and F. Ordonez. 2004. Private and Public Determinants of Child Nutrition in Nicaragua and Western Honduras. Economics & Human Biology 2(3): 457-488.
Glewwe,P., Jacoby,H. and E. King. 2001. Early Childhood Nutrition and Academic Achievement: a Longitudinal Analysis. Journal of Public Economics 81(3): 345-368.
Guerrero-Serdán, G. 2009. The Effects of the War in Iraq on Nutrition and Health: An Analysis Using Anthropometric Outcomes of Children. HiCN Working Paper 55. Households in Conflict Network.
Hoddinott, J. and B. Kinsey. 2001. Child Growth in the Time of Drought. Oxford Bulletin of Economics and Statistics 63(4): 409-36.
31
Human Rights Watch. 2005. Colombia: Displaced and Discarded. The Plight of Internally Displaced Persons in Bogotá and Cartagena. Human Rights Watch Report 17 4(B). New York, USA.
Jayachandran, S. 2009. Air Quality and Early-Life Mortality: Evidence from Indonesia’s Wildfires. Journal of Human Resources 44(4): 916-954.
Khandker, S., Koolwal, G. And H. Samad. 2010. Handbook on Impact Evaluation: Quantitative Methods and Practices. The World Bank, Washington D.C., USA.
Kuh, D. and M. Wadsworth. 1993. Physical Health Status at 36 Years in a British National Birth Cohort. Social Science and Medicine 37(7): 905–916.
Linnemayr, S., Alderman, H. and A. Ka. 2008. Determinants of Malnutrition in Senegal: Individual, Household, Community Variables, and Their Interaction. Economics & Human Biology 6(2): 252-263.
Maccini, S. and D. Yang. 2009. Under the Weather: Health, Schooling, and Economic Consequences of Early-Life Rainfall. American Economic Review 99(3): 1006-26. Maluccio, J., Hoddinott, J., Behrman, J., Martorell, R., Quisumbing, A. and Stein, A. 2006. The Impact of an Experimental Nutritional Intervention in Childhood on Education among Guatemalan Adults. FCND discussion papers 207. International Food Policy Research Institute (IFPRI).
Mansour, H. and D. Rees. 2012. Armed Conflict and Birth Weight: Evidence from the Al-Aqsa Intifada. Journal of Development Economics 99(1): 190-199.
Marmot, M., Brunner, S., and S. Hemingway. 2001. Relative Contributions of Early Life and Adult Socioeconomic Factors to Adult Morbidity in the Whitehall II Study. Journal of Epidemiology and Community Health 55: 301–307.
Maurer, J. 2010. Height, Education and Later-Life Cognition in Latin America and the Caribbean. Economics & Human Biology 8(2): 168-176. Meng, X. and N. Qian. 2006. The Long Run Health and Economic Consequences of Famine on Survivors: Evidence from China's Great Famine. CEPR Discussion Papers 5989. C.E.P.R. Discussion Papers. Minoiu, C. and O. Shemyakina. 2012. Armed Conflict, Household Vicitmization, and Child Health in Cote d’Ivoire. HiCN Working Paper 115. Households in Conflict Network.
Parlow, A. 2012. Armed Conflict and Children`s Health - Exploring New Directions: The Case of Kashmir. HiCN Working Paper 119. Households in Conflict Network.
32
Rosenbaum, P. and and D. Rubin. 1983. The Central Role of the Propensity Score in Observational Studies for Causal Effects. Biometrika 70(1): 41-55.
Seng, J., Low, L., Ben-Ami, D. and I. Liberzon. 2005. Cortisol Level and Perinatal Outcome in Pregnant Women With Posttraumatic Stress Disorder: A Pilot Study. Journal of Midwifery & Women’s Health 50(5): 392–398.
Valente, C. 2011. Children of the Revolution: Fetal and Child Health amidst Violent Civil Conflict. Health, Econometrics and Data Group (HEDG) Working Papers 11/12.
Van den Berg, G., Lindeboom, M. and F. Portrait. 2006. Economic Conditions Early in Life and Individual Mortality. American Economic Review 96(1): 290-302.
Webster, P. 2012. Treating the Displaced. Canadian Medical Association Journal 184(6): 291-292.
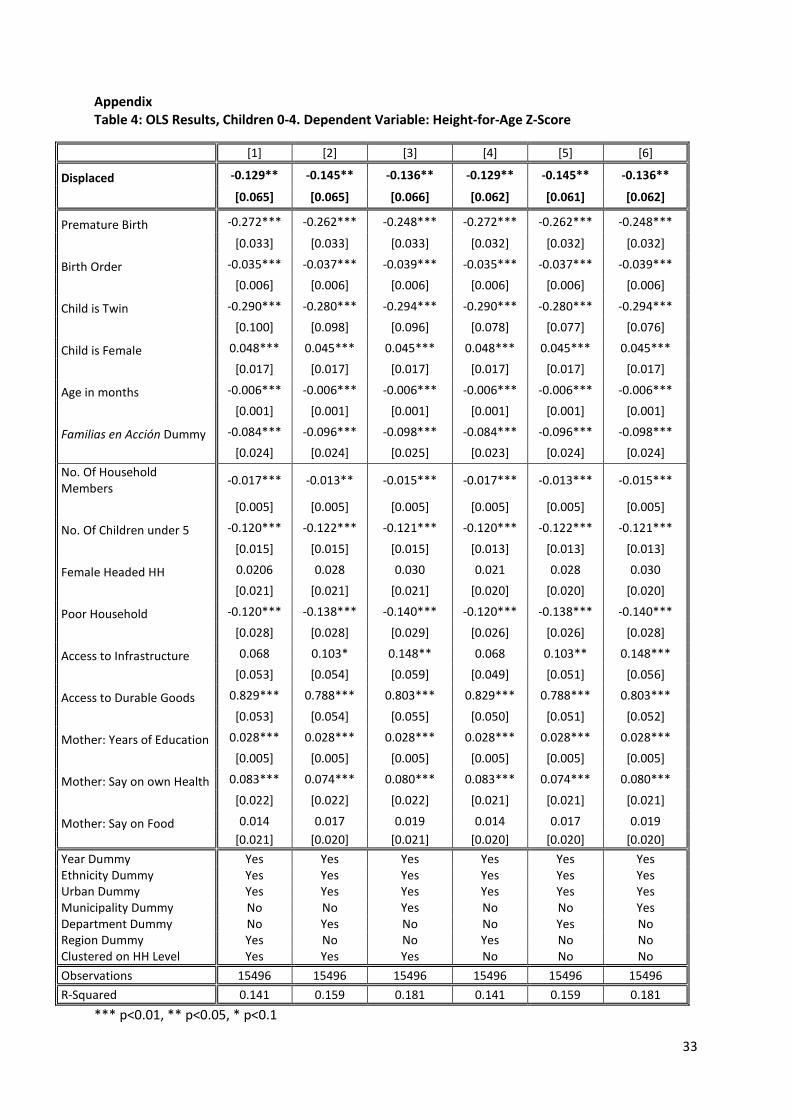
33
Appendix Table 4: OLS Results, Children 0-4. Dependent Variable: Height-for-Age Z-Score
[1] [2] [3] [4] [5] [6]
Displaced -0.129** -0.145** -0.136** -0.129** -0.145** -0.136**
[0.065] [0.065] [0.066] [0.062] [0.061] [0.062]
Premature Birth -0.272*** -0.262*** -0.248*** -0.272*** -0.262*** -0.248***
[0.033] [0.033] [0.033] [0.032] [0.032] [0.032]
Birth Order -0.035*** -0.037*** -0.039*** -0.035*** -0.037*** -0.039***
[0.006] [0.006] [0.006] [0.006] [0.006] [0.006]
Child is Twin -0.290*** -0.280*** -0.294*** -0.290*** -0.280*** -0.294***
[0.100] [0.098] [0.096] [0.078] [0.077] [0.076]
Child is Female 0.048*** 0.045*** 0.045*** 0.048*** 0.045*** 0.045***
[0.017] [0.017] [0.017] [0.017] [0.017] [0.017]
Age in months -0.006*** -0.006*** -0.006*** -0.006*** -0.006*** -0.006***
[0.001] [0.001] [0.001] [0.001] [0.001] [0.001]
Familias en Acción Dummy -0.084*** -0.096*** -0.098*** -0.084*** -0.096*** -0.098***
[0.024] [0.024] [0.025] [0.023] [0.024] [0.024] No. Of Household Members -0.017*** -0.013** -0.015*** -0.017*** -0.013*** -0.015***
[0.005] [0.005] [0.005] [0.005] [0.005] [0.005]
No. Of Children under 5 -0.120*** -0.122*** -0.121*** -0.120*** -0.122*** -0.121***
[0.015] [0.015] [0.015] [0.013] [0.013] [0.013]
Female Headed HH 0.0206 0.028 0.030 0.021 0.028 0.030
[0.021] [0.021] [0.021] [0.020] [0.020] [0.020]
Poor Household -0.120*** -0.138*** -0.140*** -0.120*** -0.138*** -0.140***
[0.028] [0.028] [0.029] [0.026] [0.026] [0.028]
Access to Infrastructure 0.068 0.103* 0.148** 0.068 0.103** 0.148***
[0.053] [0.054] [0.059] [0.049] [0.051] [0.056]
Access to Durable Goods 0.829*** 0.788*** 0.803*** 0.829*** 0.788*** 0.803***
[0.053] [0.054] [0.055] [0.050] [0.051] [0.052]
Mother: Years of Education 0.028*** 0.028*** 0.028*** 0.028*** 0.028*** 0.028***
[0.005] [0.005] [0.005] [0.005] [0.005] [0.005]
Mother: Say on own Health 0.083*** 0.074*** 0.080*** 0.083*** 0.074*** 0.080***
[0.022] [0.022] [0.022] [0.021] [0.021] [0.021]
Mother: Say on Food 0.014 0.017 0.019 0.014 0.017 0.019 [0.021] [0.020] [0.021] [0.020] [0.020] [0.020] Year Dummy Yes Yes Yes Yes Yes Yes Ethnicity Dummy Yes Yes Yes Yes Yes Yes Urban Dummy Yes Yes Yes Yes Yes Yes Municipality Dummy No No Yes No No Yes Department Dummy No Yes No No Yes No Region Dummy Yes No No Yes No No Clustered on HH Level Yes Yes Yes No No No Observations 15496 15496 15496 15496 15496 15496 R-Squared 0.141 0.159 0.181 0.141 0.159 0.181
*** p<0.01, ** p<0.05, * p<0.1

34
Table 5: OLS Results, Children 0-4. Dependent Variable: Subjective Health
[1] [2] [3] [4] [5] [6]
Displaced 0.139** 0.111** 0.111** 0.139*** 0.111** 0.111** [0.056] [0.055] [0.056] [0.051] [0.051] [0.052]
Premature Birth 0.059** 0.062** 0.054** 0.059** 0.062** 0.054**
[0.027] [0.026] [0.026] [0.026] [0.025] [0.025]
Birth Order 0.008 0.008 0.007 0.008 0.007 0.007
[0.005] [0.005] [0.005] [0.005] [0.005] [0.005]
Child is Twin -0.138* -0.143* -0.123 -0.138** -0.143** -0.123**
[0.077] [0.076] [0.077] [0.059] [0.059] [0.060]
Child is Female -0.008 -0.006 -0.011 -0.008 -0.007 -0.011
[0.014] [0.014] [0.014] [0.014] [0.014] [0.014]
Age in months 0.003*** 0.003*** 0.003*** 0.003*** 0.003*** 0.003***
[0.000] [0.000] [0.000] [0.000] [0.000] [0.000]
Familias en Acción Dummy 0.030 0.021 0.024 0.030 0.021 0.024
[0.020] [0.020] [0.021] [0.020] [0.020] [0.020] No. Of Household Members 0.017*** 0.021*** 0.020*** 0.017*** 0.021*** 0.020***
[0.004] [0.004] [0.004] [0.004] [0.004] [0.004]
No. Of Children under 5 0.036*** 0.040*** 0.039*** 0.036*** 0.040*** 0.039***
[0.013] [0.012] [0.013] [0.011] [0.010] [0.011]
Female Headed HH 0.080*** 0.079*** 0.077*** 0.080*** 0.079*** 0.077***
[0.018] [0.017] [0.017] [0.016] [0.016] [0.016]
Poor Household 0.093*** 0.075*** 0.056** 0.093*** 0.075*** 0.056**
[0.023] [0.023] [0.025] [0.021] [0.022] [0.023]
Access to Infrastructure -0.104** -0.057 -0.077 -0.104*** -0.057 -0.077*
[0.044] [0.045] [0.050] [0.040] [0.041] [0.045]
Access to Durable Goods -0.493*** -0.500*** -0.477*** -0.493*** -0.498*** -0.477***
[0.045] [0.045] [0.046] [0.041] [0.042] [0.043]
Mother: Years of Education -0.003 -0.002 -0.002 -0.003 -0.002 -0.002
[0.004] [0.004] [0.004] [0.004] [0.004] [0.004]
Mother: Say on own Health -0.018 -0.016 -0.016 -0.018 -0.016 -0.016
[0.019] [0.019] [0.019] [0.017] [0.017] [0.017]
Mother: Say on Food -0.029* -0.024 -0.024 -0.029* -0.024 -0.024 [0.017] [0.017] [0.017] [0.016] [0.016] [0.016]
Year Dummy Yes Yes Yes Yes Yes Yes
Ethnicity Dummy Yes Yes Yes Yes Yes Yes
Urban Dummy Yes Yes Yes Yes Yes Yes
Municipality Dummy No No Yes No No Yes
Department Dummy No Yes No No Yes No
Region Dummy Yes No No Yes No No
Clustered on HH Level Yes Yes Yes No No No
Observations 16425 16425 16425 16425 16425 16425 R-Squared 0.052 0.072 0.093 0.052 0.072 0.093
*** p<0.01, ** p<0.05, * p<0.1
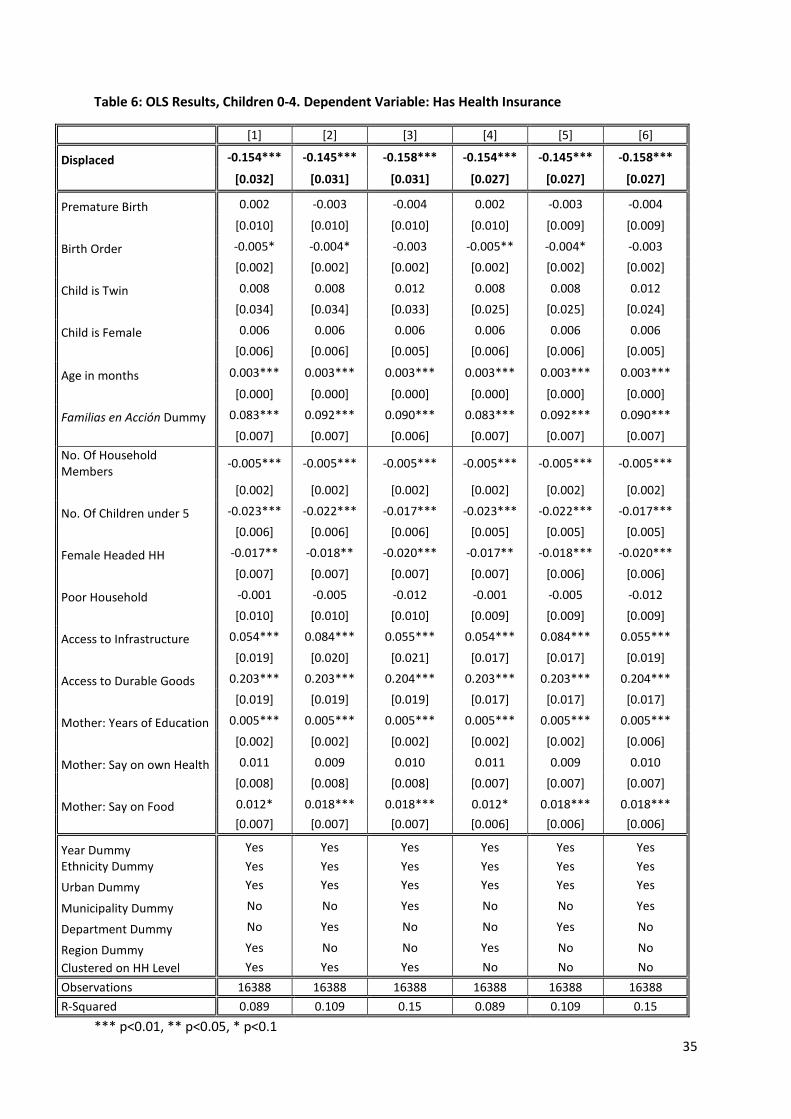
35
Table 6: OLS Results, Children 0-4. Dependent Variable: Has Health Insurance
[1] [2] [3] [4] [5] [6]
Displaced -0.154*** -0.145*** -0.158*** -0.154*** -0.145*** -0.158***
[0.032] [0.031] [0.031] [0.027] [0.027] [0.027]
Premature Birth 0.002 -0.003 -0.004 0.002 -0.003 -0.004
[0.010] [0.010] [0.010] [0.010] [0.009] [0.009]
Birth Order -0.005* -0.004* -0.003 -0.005** -0.004* -0.003
[0.002] [0.002] [0.002] [0.002] [0.002] [0.002]
Child is Twin 0.008 0.008 0.012 0.008 0.008 0.012
[0.034] [0.034] [0.033] [0.025] [0.025] [0.024]
Child is Female 0.006 0.006 0.006 0.006 0.006 0.006
[0.006] [0.006] [0.005] [0.006] [0.006] [0.005]
Age in months 0.003*** 0.003*** 0.003*** 0.003*** 0.003*** 0.003***
[0.000] [0.000] [0.000] [0.000] [0.000] [0.000]
Familias en Acción Dummy 0.083*** 0.092*** 0.090*** 0.083*** 0.092*** 0.090***
[0.007] [0.007] [0.006] [0.007] [0.007] [0.007] No. Of Household Members -0.005*** -0.005*** -0.005*** -0.005*** -0.005*** -0.005***
[0.002] [0.002] [0.002] [0.002] [0.002] [0.002]
No. Of Children under 5 -0.023*** -0.022*** -0.017*** -0.023*** -0.022*** -0.017***
[0.006] [0.006] [0.006] [0.005] [0.005] [0.005]
Female Headed HH -0.017** -0.018** -0.020*** -0.017** -0.018*** -0.020***
[0.007] [0.007] [0.007] [0.007] [0.006] [0.006]
Poor Household -0.001 -0.005 -0.012 -0.001 -0.005 -0.012
[0.010] [0.010] [0.010] [0.009] [0.009] [0.009]
Access to Infrastructure 0.054*** 0.084*** 0.055*** 0.054*** 0.084*** 0.055***
[0.019] [0.020] [0.021] [0.017] [0.017] [0.019]
Access to Durable Goods 0.203*** 0.203*** 0.204*** 0.203*** 0.203*** 0.204***
[0.019] [0.019] [0.019] [0.017] [0.017] [0.017]
Mother: Years of Education 0.005*** 0.005*** 0.005*** 0.005*** 0.005*** 0.005***
[0.002] [0.002] [0.002] [0.002] [0.002] [0.006]
Mother: Say on own Health 0.011 0.009 0.010 0.011 0.009 0.010
[0.008] [0.008] [0.008] [0.007] [0.007] [0.007]
Mother: Say on Food 0.012* 0.018*** 0.018*** 0.012* 0.018*** 0.018*** [0.007] [0.007] [0.007] [0.006] [0.006] [0.006]
Year Dummy Yes Yes Yes Yes Yes Yes Ethnicity Dummy Yes Yes Yes Yes Yes Yes Urban Dummy Yes Yes Yes Yes Yes Yes
Municipality Dummy No No Yes No No Yes
Department Dummy No Yes No No Yes No
Region Dummy Yes No No Yes No No Clustered on HH Level Yes Yes Yes No No No Observations 16388 16388 16388 16388 16388 16388 R-Squared 0.089 0.109 0.15 0.089 0.109 0.15
*** p<0.01, ** p<0.05, * p<0.1
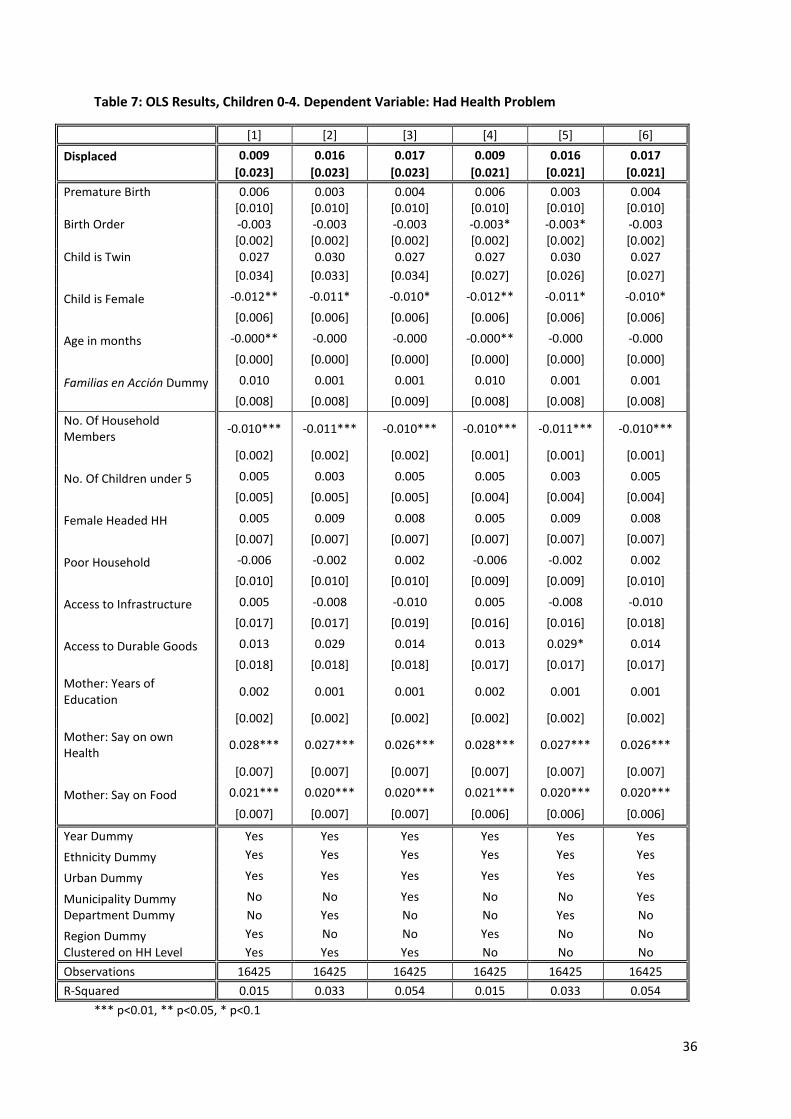
36
Table 7: OLS Results, Children 0-4. Dependent Variable: Had Health Problem
[1] [2] [3] [4] [5] [6]
Displaced 0.009 0.016 0.017 0.009 0.016 0.017 [0.023] [0.023] [0.023] [0.021] [0.021] [0.021] Premature Birth 0.006 0.003 0.004 0.006 0.003 0.004 [0.010] [0.010] [0.010] [0.010] [0.010] [0.010] Birth Order -0.003 -0.003 -0.003 -0.003* -0.003* -0.003 [0.002] [0.002] [0.002] [0.002] [0.002] [0.002] Child is Twin 0.027 0.030 0.027 0.027 0.030 0.027 [0.034] [0.033] [0.034] [0.027] [0.026] [0.027]
Child is Female -0.012** -0.011* -0.010* -0.012** -0.011* -0.010*
[0.006] [0.006] [0.006] [0.006] [0.006] [0.006]
Age in months -0.000** -0.000 -0.000 -0.000** -0.000 -0.000
[0.000] [0.000] [0.000] [0.000] [0.000] [0.000]
Familias en Acción Dummy 0.010 0.001 0.001 0.010 0.001 0.001
[0.008] [0.008] [0.009] [0.008] [0.008] [0.008] No. Of Household Members -0.010*** -0.011*** -0.010*** -0.010*** -0.011*** -0.010***
[0.002] [0.002] [0.002] [0.001] [0.001] [0.001]
No. Of Children under 5 0.005 0.003 0.005 0.005 0.003 0.005
[0.005] [0.005] [0.005] [0.004] [0.004] [0.004]
Female Headed HH 0.005 0.009 0.008 0.005 0.009 0.008
[0.007] [0.007] [0.007] [0.007] [0.007] [0.007]
Poor Household -0.006 -0.002 0.002 -0.006 -0.002 0.002
[0.010] [0.010] [0.010] [0.009] [0.009] [0.010]
Access to Infrastructure 0.005 -0.008 -0.010 0.005 -0.008 -0.010
[0.017] [0.017] [0.019] [0.016] [0.016] [0.018]
Access to Durable Goods 0.013 0.029 0.014 0.013 0.029* 0.014
[0.018] [0.018] [0.018] [0.017] [0.017] [0.017] Mother: Years of Education 0.002 0.001 0.001 0.002 0.001 0.001
[0.002] [0.002] [0.002] [0.002] [0.002] [0.002] Mother: Say on own Health 0.028*** 0.027*** 0.026*** 0.028*** 0.027*** 0.026***
[0.007] [0.007] [0.007] [0.007] [0.007] [0.007]
Mother: Say on Food 0.021*** 0.020*** 0.020*** 0.021*** 0.020*** 0.020***
[0.007] [0.007] [0.007] [0.006] [0.006] [0.006]
Year Dummy Yes Yes Yes Yes Yes Yes Ethnicity Dummy Yes Yes Yes Yes Yes Yes
Urban Dummy Yes Yes Yes Yes Yes Yes
Municipality Dummy No No Yes No No Yes Department Dummy No Yes No No Yes No Region Dummy Yes No No Yes No No Clustered on HH Level Yes Yes Yes No No No Observations 16425 16425 16425 16425 16425 16425 R-Squared 0.015 0.033 0.054 0.015 0.033 0.054
*** p<0.01, ** p<0.05, * p<0.1
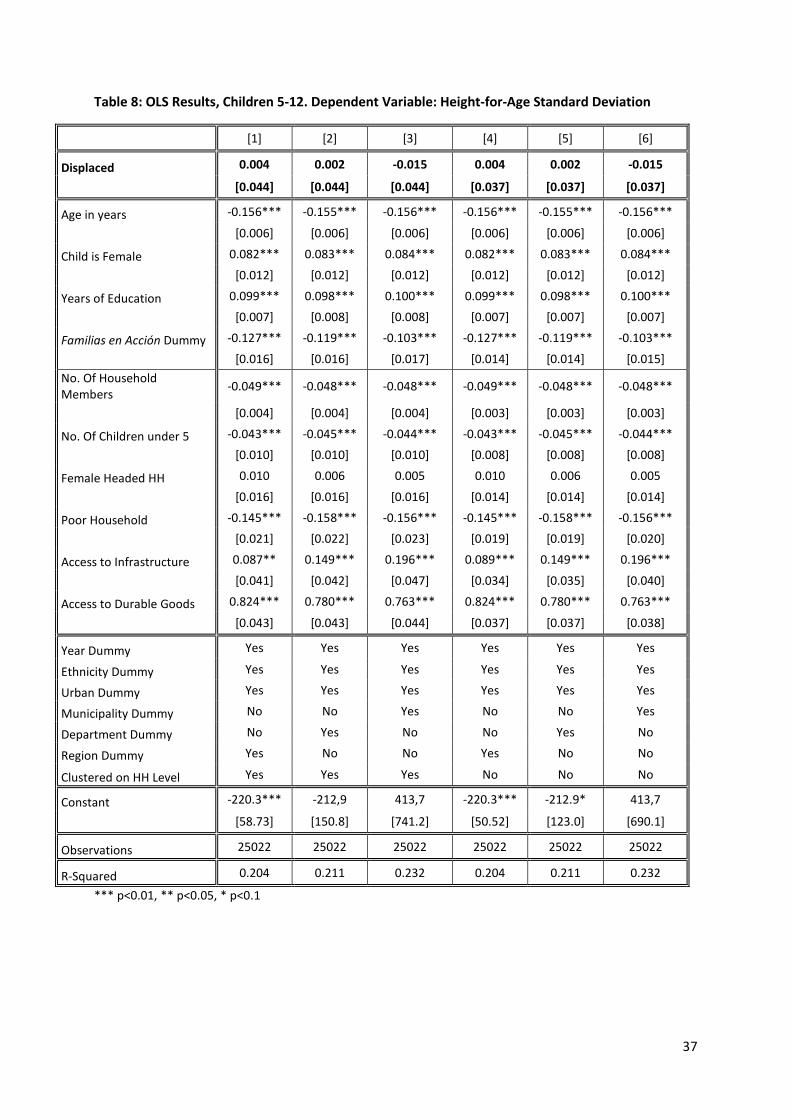
37
Table 8: OLS Results, Children 5-12. Dependent Variable: Height-for-Age Standard Deviation
[1] [2] [3] [4] [5] [6]
Displaced 0.004 0.002 -0.015 0.004 0.002 -0.015
[0.044] [0.044] [0.044] [0.037] [0.037] [0.037]
Age in years -0.156*** -0.155*** -0.156*** -0.156*** -0.155*** -0.156***
[0.006] [0.006] [0.006] [0.006] [0.006] [0.006]
Child is Female 0.082*** 0.083*** 0.084*** 0.082*** 0.083*** 0.084***
[0.012] [0.012] [0.012] [0.012] [0.012] [0.012]
Years of Education 0.099*** 0.098*** 0.100*** 0.099*** 0.098*** 0.100***
[0.007] [0.008] [0.008] [0.007] [0.007] [0.007]
Familias en Acción Dummy -0.127*** -0.119*** -0.103*** -0.127*** -0.119*** -0.103***
[0.016] [0.016] [0.017] [0.014] [0.014] [0.015] No. Of Household Members -0.049*** -0.048*** -0.048*** -0.049*** -0.048*** -0.048***
[0.004] [0.004] [0.004] [0.003] [0.003] [0.003]
No. Of Children under 5 -0.043*** -0.045*** -0.044*** -0.043*** -0.045*** -0.044***
[0.010] [0.010] [0.010] [0.008] [0.008] [0.008]
Female Headed HH 0.010 0.006 0.005 0.010 0.006 0.005
[0.016] [0.016] [0.016] [0.014] [0.014] [0.014]
Poor Household -0.145*** -0.158*** -0.156*** -0.145*** -0.158*** -0.156***
[0.021] [0.022] [0.023] [0.019] [0.019] [0.020]
Access to Infrastructure 0.087** 0.149*** 0.196*** 0.089*** 0.149*** 0.196***
[0.041] [0.042] [0.047] [0.034] [0.035] [0.040]
Access to Durable Goods 0.824*** 0.780*** 0.763*** 0.824*** 0.780*** 0.763***
[0.043] [0.043] [0.044] [0.037] [0.037] [0.038]
Year Dummy Yes Yes Yes Yes Yes Yes
Ethnicity Dummy Yes Yes Yes Yes Yes Yes
Urban Dummy Yes Yes Yes Yes Yes Yes
Municipality Dummy No No Yes No No Yes
Department Dummy No Yes No No Yes No
Region Dummy Yes No No Yes No No
Clustered on HH Level Yes Yes Yes No No No
Constant -220.3*** -212,9 413,7 -220.3*** -212.9* 413,7
[58.73] [150.8] [741.2] [50.52] [123.0] [690.1]
Observations 25022 25022 25022 25022 25022 25022
R-Squared 0.204 0.211 0.232 0.204 0.211 0.232
*** p<0.01, ** p<0.05, * p<0.1

38
Table 9: OLS Results, Children 5-12. Dependent Variable: Subjective Health
[1] [2] [3] [4] [5] [6]
Displaced 0.118*** 0.090** 0.103*** 0.118*** 0.090*** 0.103***
[0.040] [0.040] [0.039] [0.033] [0.033] [0.033]
Age in years 0.034*** 0.036*** 0.037*** 0.034*** 0.036*** 0.037***
[0.005] [0.005] [0.005] [0.005] [0.005] [0.005]
Child is Female -0.004 -0.002 -0.002 -0.004 -0.002 -0.002
[0.011] [0.011] [0.011] [0.011] [0.011] [0.011]
Years of Education -0.039*** -0.043*** -0.043*** -0.039*** -0.043*** -0.043***
[0.006] [0.006] [0.006] [0.006] [0.006] [0.006]
Familias en Acción Dummy 0.045*** 0.017 0.016 0.045*** 0.017 0.016
[0.014] [0.014] [0.015] [0.012] [0.013] [0.013] No. Of Household Members 0.015*** 0.019*** 0.018*** 0.015*** 0.019*** 0.018***
[0.003] [0.003] [0.003] [0.003] [0.003] [0.003]
No. Of Children under 5 -0.024*** -0.020** -0.022** -0.024*** -0.020*** -0.022***
[0.009] [0.009] [0.009] [0.007] [0.007] [0.007]
Female Headed HH 0.063*** 0.064*** 0.062*** 0.063*** 0.064*** 0.062***
[0.014] [0.014] [0.013] [0.012] [0.012] [0.012]
Poor Household 0.168*** 0.144*** 0.140*** 0.168*** 0.144*** 0.140***
[0.019] [0.019] [0.020] [0.016] [0.017] [0.018]
Access to Infrastructure -0.019 0.010 -0.014 -0.019 0.010 -0.014
[0.036] [0.037] [0.041] [0.030] [0.031] [0.034]
Access to Durable Goods -0.475*** -0.481*** -0.444*** -0.475*** -0.481*** -0.444***
[0.037] [0.038] [0.038] [0.032] [0.033] [0.033]
Year Dummy Yes Yes Yes Yes Yes Yes
Ethnicity Dummy Yes Yes Yes Yes Yes Yes
Urban Dummy Yes Yes Yes Yes Yes Yes
Municipality Dummy No No Yes No No Yes
Department Dummy No Yes No No Yes No
Region Dummy Yes No No Yes No No
Clustered on HH Level Yes Yes Yes No No No
Constant 152.3*** -228.0** -241,7 152.3*** -228.0** -241.7
[52.46] [115.0] [527.6] [44.15] [95.97] [448.2]
Observations 26554 26554 26554 26554 26554 26554
R-Squared 0.052 0.072 0.091 0.052 0.072 0.091
*** p<0.01, ** p<0.05, * p<0.1
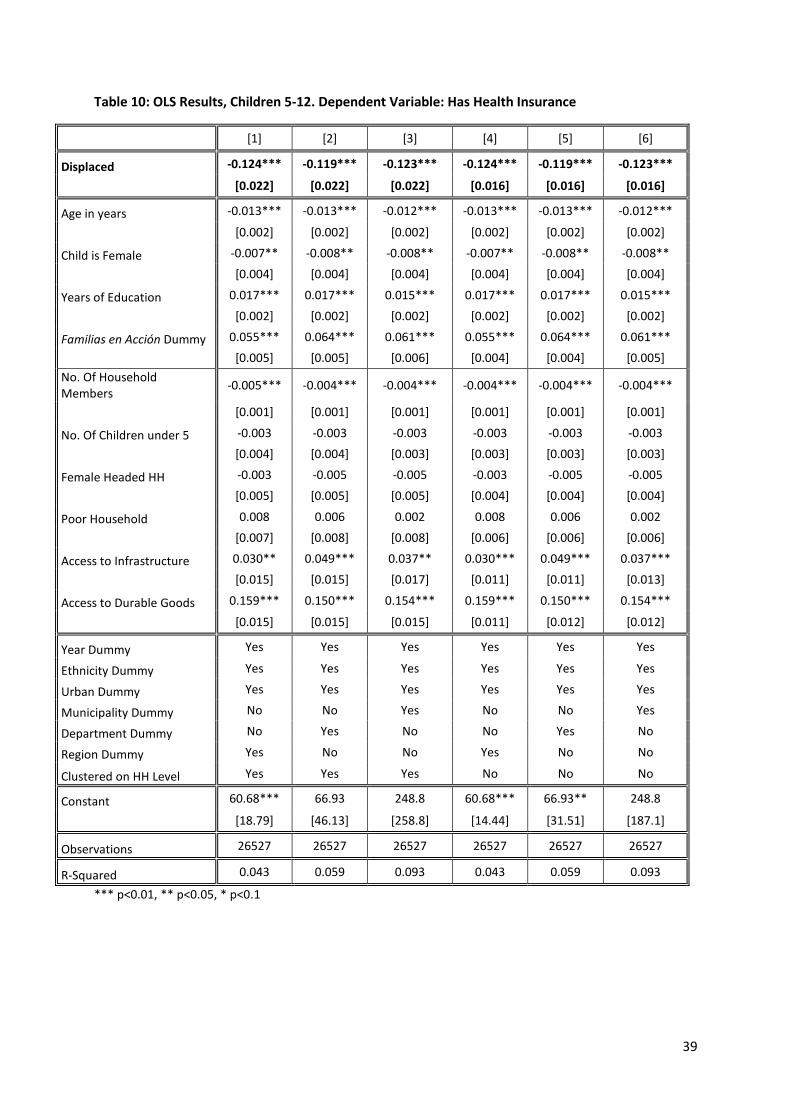
39
Table 10: OLS Results, Children 5-12. Dependent Variable: Has Health Insurance
[1] [2] [3] [4] [5] [6]
Displaced -0.124*** -0.119*** -0.123*** -0.124*** -0.119*** -0.123***
[0.022] [0.022] [0.022] [0.016] [0.016] [0.016]
Age in years -0.013*** -0.013*** -0.012*** -0.013*** -0.013*** -0.012***
[0.002] [0.002] [0.002] [0.002] [0.002] [0.002]
Child is Female -0.007** -0.008** -0.008** -0.007** -0.008** -0.008**
[0.004] [0.004] [0.004] [0.004] [0.004] [0.004]
Years of Education 0.017*** 0.017*** 0.015*** 0.017*** 0.017*** 0.015***
[0.002] [0.002] [0.002] [0.002] [0.002] [0.002]
Familias en Acción Dummy 0.055*** 0.064*** 0.061*** 0.055*** 0.064*** 0.061***
[0.005] [0.005] [0.006] [0.004] [0.004] [0.005] No. Of Household Members -0.005*** -0.004*** -0.004*** -0.004*** -0.004*** -0.004***
[0.001] [0.001] [0.001] [0.001] [0.001] [0.001]
No. Of Children under 5 -0.003 -0.003 -0.003 -0.003 -0.003 -0.003
[0.004] [0.004] [0.003] [0.003] [0.003] [0.003]
Female Headed HH -0.003 -0.005 -0.005 -0.003 -0.005 -0.005
[0.005] [0.005] [0.005] [0.004] [0.004] [0.004]
Poor Household 0.008 0.006 0.002 0.008 0.006 0.002
[0.007] [0.008] [0.008] [0.006] [0.006] [0.006]
Access to Infrastructure 0.030** 0.049*** 0.037** 0.030*** 0.049*** 0.037***
[0.015] [0.015] [0.017] [0.011] [0.011] [0.013]
Access to Durable Goods 0.159*** 0.150*** 0.154*** 0.159*** 0.150*** 0.154***
[0.015] [0.015] [0.015] [0.011] [0.012] [0.012]
Year Dummy Yes Yes Yes Yes Yes Yes
Ethnicity Dummy Yes Yes Yes Yes Yes Yes
Urban Dummy Yes Yes Yes Yes Yes Yes
Municipality Dummy No No Yes No No Yes
Department Dummy No Yes No No Yes No
Region Dummy Yes No No Yes No No
Clustered on HH Level Yes Yes Yes No No No
Constant 60.68*** 66.93 248.8 60.68*** 66.93** 248.8
[18.79] [46.13] [258.8] [14.44] [31.51] [187.1]
Observations 26527 26527 26527 26527 26527 26527
R-Squared 0.043 0.059 0.093 0.043 0.059 0.093
*** p<0.01, ** p<0.05, * p<0.1
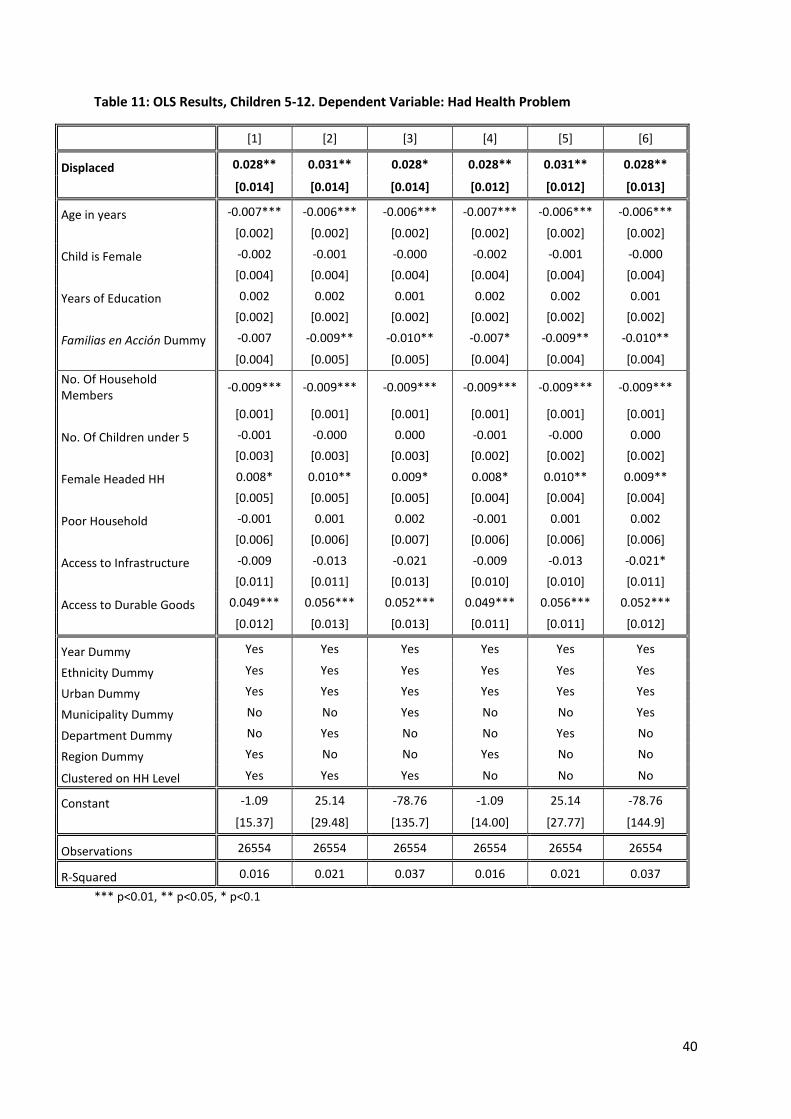
40
Table 11: OLS Results, Children 5-12. Dependent Variable: Had Health Problem
[1] [2] [3] [4] [5] [6]
Displaced 0.028** 0.031** 0.028* 0.028** 0.031** 0.028**
[0.014] [0.014] [0.014] [0.012] [0.012] [0.013]
Age in years -0.007*** -0.006*** -0.006*** -0.007*** -0.006*** -0.006***
[0.002] [0.002] [0.002] [0.002] [0.002] [0.002]
Child is Female -0.002 -0.001 -0.000 -0.002 -0.001 -0.000
[0.004] [0.004] [0.004] [0.004] [0.004] [0.004]
Years of Education 0.002 0.002 0.001 0.002 0.002 0.001
[0.002] [0.002] [0.002] [0.002] [0.002] [0.002]
Familias en Acción Dummy -0.007 -0.009** -0.010** -0.007* -0.009** -0.010**
[0.004] [0.005] [0.005] [0.004] [0.004] [0.004] No. Of Household Members -0.009*** -0.009*** -0.009*** -0.009*** -0.009*** -0.009***
[0.001] [0.001] [0.001] [0.001] [0.001] [0.001]
No. Of Children under 5 -0.001 -0.000 0.000 -0.001 -0.000 0.000
[0.003] [0.003] [0.003] [0.002] [0.002] [0.002]
Female Headed HH 0.008* 0.010** 0.009* 0.008* 0.010** 0.009**
[0.005] [0.005] [0.005] [0.004] [0.004] [0.004]
Poor Household -0.001 0.001 0.002 -0.001 0.001 0.002
[0.006] [0.006] [0.007] [0.006] [0.006] [0.006]
Access to Infrastructure -0.009 -0.013 -0.021 -0.009 -0.013 -0.021*
[0.011] [0.011] [0.013] [0.010] [0.010] [0.011]
Access to Durable Goods 0.049*** 0.056*** 0.052*** 0.049*** 0.056*** 0.052***
[0.012] [0.013] [0.013] [0.011] [0.011] [0.012]
Year Dummy Yes Yes Yes Yes Yes Yes
Ethnicity Dummy Yes Yes Yes Yes Yes Yes
Urban Dummy Yes Yes Yes Yes Yes Yes
Municipality Dummy No No Yes No No Yes
Department Dummy No Yes No No Yes No
Region Dummy Yes No No Yes No No
Clustered on HH Level Yes Yes Yes No No No
Constant -1.09 25.14 -78.76 -1.09 25.14 -78.76
[15.37] [29.48] [135.7] [14.00] [27.77] [144.9]
Observations 26554 26554 26554 26554 26554 26554
R-Squared 0.016 0.021 0.037 0.016 0.021 0.037
*** p<0.01, ** p<0.05, * p<0.1
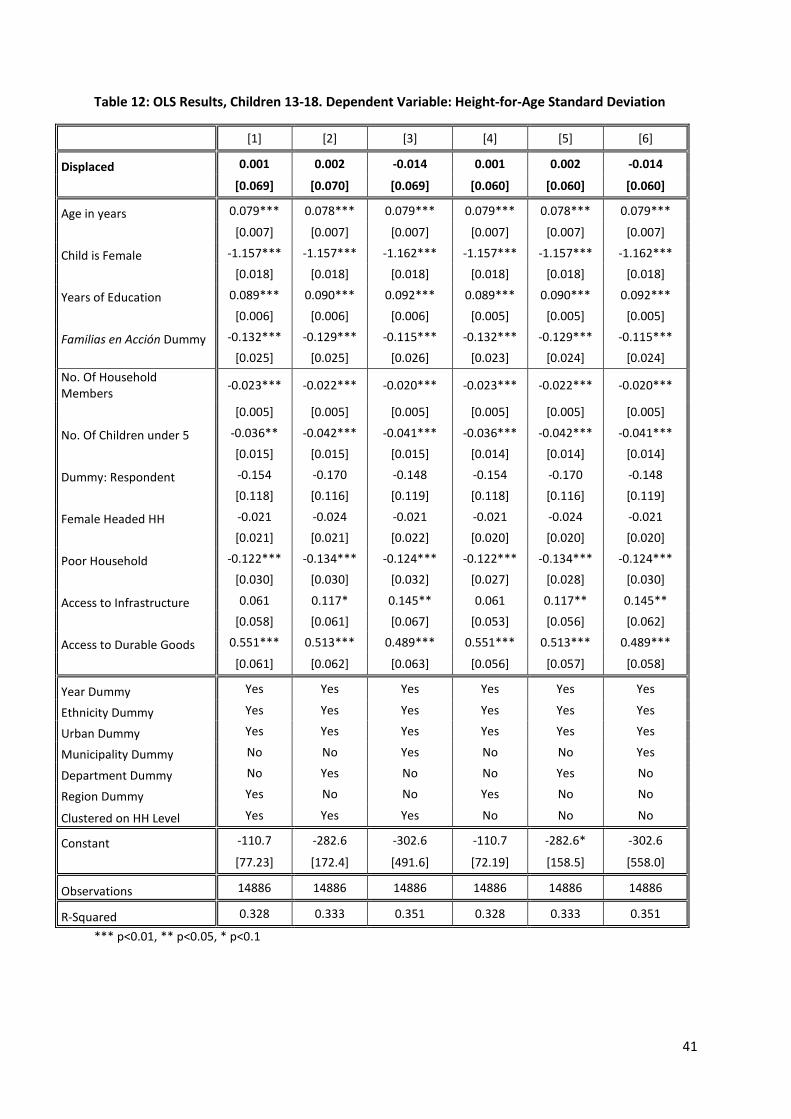
41
Table 12: OLS Results, Children 13-18. Dependent Variable: Height-for-Age Standard Deviation
[1] [2] [3] [4] [5] [6]
Displaced 0.001 0.002 -0.014 0.001 0.002 -0.014
[0.069] [0.070] [0.069] [0.060] [0.060] [0.060]
Age in years 0.079*** 0.078*** 0.079*** 0.079*** 0.078*** 0.079***
[0.007] [0.007] [0.007] [0.007] [0.007] [0.007]
Child is Female -1.157*** -1.157*** -1.162*** -1.157*** -1.157*** -1.162***
[0.018] [0.018] [0.018] [0.018] [0.018] [0.018]
Years of Education 0.089*** 0.090*** 0.092*** 0.089*** 0.090*** 0.092***
[0.006] [0.006] [0.006] [0.005] [0.005] [0.005]
Familias en Acción Dummy -0.132*** -0.129*** -0.115*** -0.132*** -0.129*** -0.115***
[0.025] [0.025] [0.026] [0.023] [0.024] [0.024] No. Of Household Members -0.023*** -0.022*** -0.020*** -0.023*** -0.022*** -0.020***
[0.005] [0.005] [0.005] [0.005] [0.005] [0.005]
No. Of Children under 5 -0.036** -0.042*** -0.041*** -0.036*** -0.042*** -0.041***
[0.015] [0.015] [0.015] [0.014] [0.014] [0.014]
Dummy: Respondent -0.154 -0.170 -0.148 -0.154 -0.170 -0.148
[0.118] [0.116] [0.119] [0.118] [0.116] [0.119]
Female Headed HH -0.021 -0.024 -0.021 -0.021 -0.024 -0.021
[0.021] [0.021] [0.022] [0.020] [0.020] [0.020]
Poor Household -0.122*** -0.134*** -0.124*** -0.122*** -0.134*** -0.124***
[0.030] [0.030] [0.032] [0.027] [0.028] [0.030]
Access to Infrastructure 0.061 0.117* 0.145** 0.061 0.117** 0.145**
[0.058] [0.061] [0.067] [0.053] [0.056] [0.062]
Access to Durable Goods 0.551*** 0.513*** 0.489*** 0.551*** 0.513*** 0.489***
[0.061] [0.062] [0.063] [0.056] [0.057] [0.058]
Year Dummy Yes Yes Yes Yes Yes Yes
Ethnicity Dummy Yes Yes Yes Yes Yes Yes
Urban Dummy Yes Yes Yes Yes Yes Yes
Municipality Dummy No No Yes No No Yes
Department Dummy No Yes No No Yes No
Region Dummy Yes No No Yes No No
Clustered on HH Level Yes Yes Yes No No No
Constant -110.7 -282.6 -302.6 -110.7 -282.6* -302.6
[77.23] [172.4] [491.6] [72.19] [158.5] [558.0]
Observations 14886 14886 14886 14886 14886 14886
R-Squared 0.328 0.333 0.351 0.328 0.333 0.351
*** p<0.01, ** p<0.05, * p<0.1
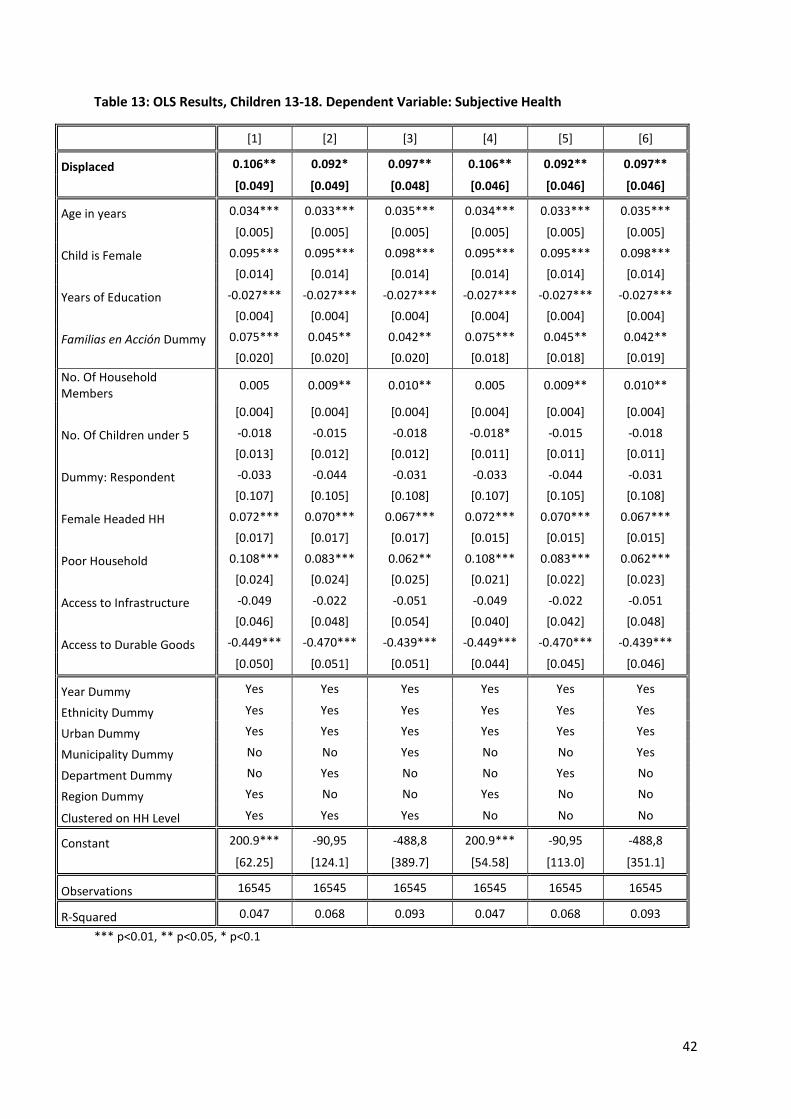
42
Table 13: OLS Results, Children 13-18. Dependent Variable: Subjective Health
[1] [2] [3] [4] [5] [6]
Displaced 0.106** 0.092* 0.097** 0.106** 0.092** 0.097**
[0.049] [0.049] [0.048] [0.046] [0.046] [0.046]
Age in years 0.034*** 0.033*** 0.035*** 0.034*** 0.033*** 0.035***
[0.005] [0.005] [0.005] [0.005] [0.005] [0.005]
Child is Female 0.095*** 0.095*** 0.098*** 0.095*** 0.095*** 0.098***
[0.014] [0.014] [0.014] [0.014] [0.014] [0.014]
Years of Education -0.027*** -0.027*** -0.027*** -0.027*** -0.027*** -0.027***
[0.004] [0.004] [0.004] [0.004] [0.004] [0.004]
Familias en Acción Dummy 0.075*** 0.045** 0.042** 0.075*** 0.045** 0.042**
[0.020] [0.020] [0.020] [0.018] [0.018] [0.019] No. Of Household Members 0.005 0.009** 0.010** 0.005 0.009** 0.010**
[0.004] [0.004] [0.004] [0.004] [0.004] [0.004]
No. Of Children under 5 -0.018 -0.015 -0.018 -0.018* -0.015 -0.018
[0.013] [0.012] [0.012] [0.011] [0.011] [0.011]
Dummy: Respondent -0.033 -0.044 -0.031 -0.033 -0.044 -0.031
[0.107] [0.105] [0.108] [0.107] [0.105] [0.108]
Female Headed HH 0.072*** 0.070*** 0.067*** 0.072*** 0.070*** 0.067***
[0.017] [0.017] [0.017] [0.015] [0.015] [0.015]
Poor Household 0.108*** 0.083*** 0.062** 0.108*** 0.083*** 0.062***
[0.024] [0.024] [0.025] [0.021] [0.022] [0.023]
Access to Infrastructure -0.049 -0.022 -0.051 -0.049 -0.022 -0.051
[0.046] [0.048] [0.054] [0.040] [0.042] [0.048]
Access to Durable Goods -0.449*** -0.470*** -0.439*** -0.449*** -0.470*** -0.439***
[0.050] [0.051] [0.051] [0.044] [0.045] [0.046]
Year Dummy Yes Yes Yes Yes Yes Yes
Ethnicity Dummy Yes Yes Yes Yes Yes Yes
Urban Dummy Yes Yes Yes Yes Yes Yes
Municipality Dummy No No Yes No No Yes
Department Dummy No Yes No No Yes No
Region Dummy Yes No No Yes No No
Clustered on HH Level Yes Yes Yes No No No
Constant 200.9*** -90,95 -488,8 200.9*** -90,95 -488,8
[62.25] [124.1] [389.7] [54.58] [113.0] [351.1]
Observations 16545 16545 16545 16545 16545 16545
R-Squared 0.047 0.068 0.093 0.047 0.068 0.093
*** p<0.01, ** p<0.05, * p<0.1
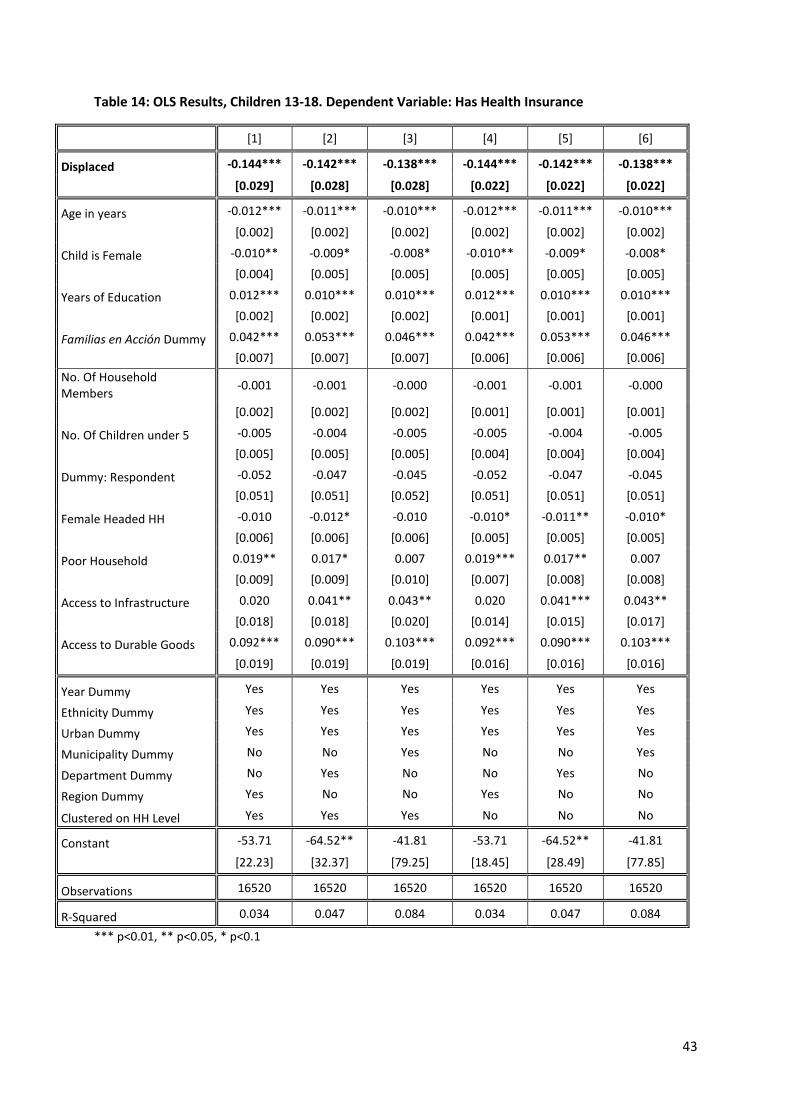
43
Table 14: OLS Results, Children 13-18. Dependent Variable: Has Health Insurance
[1] [2] [3] [4] [5] [6]
Displaced -0.144*** -0.142*** -0.138*** -0.144*** -0.142*** -0.138***
[0.029] [0.028] [0.028] [0.022] [0.022] [0.022]
Age in years -0.012*** -0.011*** -0.010*** -0.012*** -0.011*** -0.010***
[0.002] [0.002] [0.002] [0.002] [0.002] [0.002]
Child is Female -0.010** -0.009* -0.008* -0.010** -0.009* -0.008*
[0.004] [0.005] [0.005] [0.005] [0.005] [0.005]
Years of Education 0.012*** 0.010*** 0.010*** 0.012*** 0.010*** 0.010***
[0.002] [0.002] [0.002] [0.001] [0.001] [0.001]
Familias en Acción Dummy 0.042*** 0.053*** 0.046*** 0.042*** 0.053*** 0.046***
[0.007] [0.007] [0.007] [0.006] [0.006] [0.006] No. Of Household Members -0.001 -0.001 -0.000 -0.001 -0.001 -0.000
[0.002] [0.002] [0.002] [0.001] [0.001] [0.001]
No. Of Children under 5 -0.005 -0.004 -0.005 -0.005 -0.004 -0.005
[0.005] [0.005] [0.005] [0.004] [0.004] [0.004]
Dummy: Respondent -0.052 -0.047 -0.045 -0.052 -0.047 -0.045
[0.051] [0.051] [0.052] [0.051] [0.051] [0.051]
Female Headed HH -0.010 -0.012* -0.010 -0.010* -0.011** -0.010*
[0.006] [0.006] [0.006] [0.005] [0.005] [0.005]
Poor Household 0.019** 0.017* 0.007 0.019*** 0.017** 0.007
[0.009] [0.009] [0.010] [0.007] [0.008] [0.008]
Access to Infrastructure 0.020 0.041** 0.043** 0.020 0.041*** 0.043**
[0.018] [0.018] [0.020] [0.014] [0.015] [0.017]
Access to Durable Goods 0.092*** 0.090*** 0.103*** 0.092*** 0.090*** 0.103***
[0.019] [0.019] [0.019] [0.016] [0.016] [0.016]
Year Dummy Yes Yes Yes Yes Yes Yes
Ethnicity Dummy Yes Yes Yes Yes Yes Yes
Urban Dummy Yes Yes Yes Yes Yes Yes
Municipality Dummy No No Yes No No Yes
Department Dummy No Yes No No Yes No
Region Dummy Yes No No Yes No No
Clustered on HH Level Yes Yes Yes No No No
Constant -53.71 -64.52** -41.81 -53.71 -64.52** -41.81
[22.23] [32.37] [79.25] [18.45] [28.49] [77.85]
Observations 16520 16520 16520 16520 16520 16520
R-Squared 0.034 0.047 0.084 0.034 0.047 0.084
*** p<0.01, ** p<0.05, * p<0.1
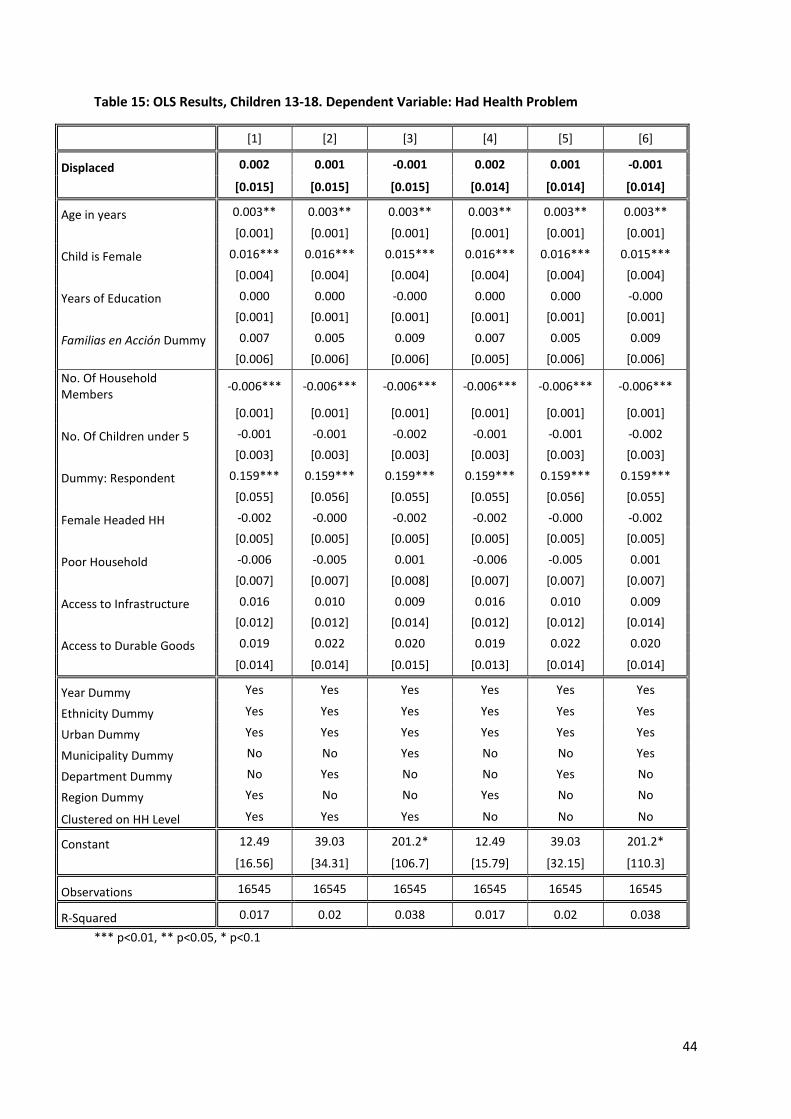
44
Table 15: OLS Results, Children 13-18. Dependent Variable: Had Health Problem
[1] [2] [3] [4] [5] [6]
Displaced 0.002 0.001 -0.001 0.002 0.001 -0.001
[0.015] [0.015] [0.015] [0.014] [0.014] [0.014]
Age in years 0.003** 0.003** 0.003** 0.003** 0.003** 0.003**
[0.001] [0.001] [0.001] [0.001] [0.001] [0.001]
Child is Female 0.016*** 0.016*** 0.015*** 0.016*** 0.016*** 0.015***
[0.004] [0.004] [0.004] [0.004] [0.004] [0.004]
Years of Education 0.000 0.000 -0.000 0.000 0.000 -0.000
[0.001] [0.001] [0.001] [0.001] [0.001] [0.001]
Familias en Acción Dummy 0.007 0.005 0.009 0.007 0.005 0.009
[0.006] [0.006] [0.006] [0.005] [0.006] [0.006] No. Of Household Members -0.006*** -0.006*** -0.006*** -0.006*** -0.006*** -0.006***
[0.001] [0.001] [0.001] [0.001] [0.001] [0.001]
No. Of Children under 5 -0.001 -0.001 -0.002 -0.001 -0.001 -0.002
[0.003] [0.003] [0.003] [0.003] [0.003] [0.003]
Dummy: Respondent 0.159*** 0.159*** 0.159*** 0.159*** 0.159*** 0.159***
[0.055] [0.056] [0.055] [0.055] [0.056] [0.055]
Female Headed HH -0.002 -0.000 -0.002 -0.002 -0.000 -0.002
[0.005] [0.005] [0.005] [0.005] [0.005] [0.005]
Poor Household -0.006 -0.005 0.001 -0.006 -0.005 0.001
[0.007] [0.007] [0.008] [0.007] [0.007] [0.007]
Access to Infrastructure 0.016 0.010 0.009 0.016 0.010 0.009
[0.012] [0.012] [0.014] [0.012] [0.012] [0.014]
Access to Durable Goods 0.019 0.022 0.020 0.019 0.022 0.020
[0.014] [0.014] [0.015] [0.013] [0.014] [0.014]
Year Dummy Yes Yes Yes Yes Yes Yes
Ethnicity Dummy Yes Yes Yes Yes Yes Yes
Urban Dummy Yes Yes Yes Yes Yes Yes
Municipality Dummy No No Yes No No Yes
Department Dummy No Yes No No Yes No
Region Dummy Yes No No Yes No No
Clustered on HH Level Yes Yes Yes No No No
Constant 12.49 39.03 201.2* 12.49 39.03 201.2*
[16.56] [34.31] [106.7] [15.79] [32.15] [110.3]
Observations 16545 16545 16545 16545 16545 16545
R-Squared 0.017 0.02 0.038 0.017 0.02 0.038
*** p<0.01, ** p<0.05, * p<0.1
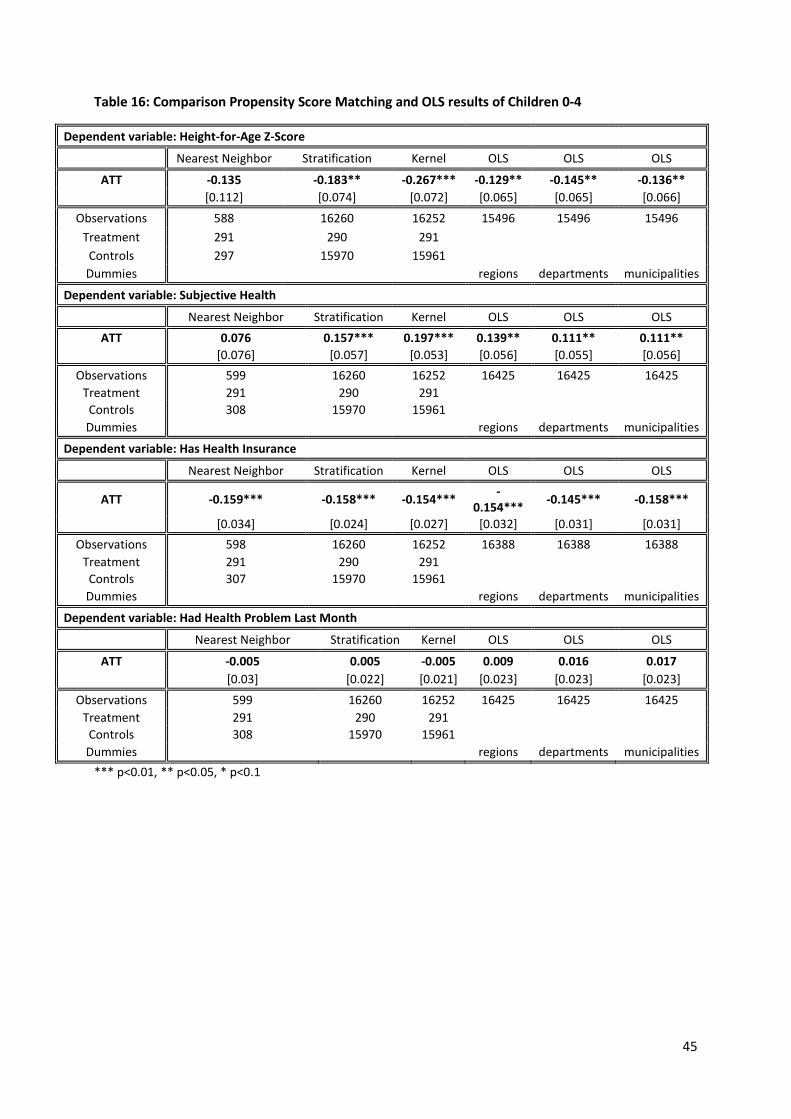
45
Table 16: Comparison Propensity Score Matching and OLS results of Children 0-4
Dependent variable: Height-for-Age Z-Score
Nearest Neighbor Stratification Kernel OLS OLS OLS
ATT -0.135 -0.183** -0.267*** -0.129** -0.145** -0.136** [0.112] [0.074] [0.072] [0.065] [0.065] [0.066]
Observations 588 16260 16252 15496 15496 15496 Treatment 291 290 291 Controls 297 15970 15961 Dummies regions departments municipalities
Dependent variable: Subjective Health
Nearest Neighbor Stratification Kernel OLS OLS OLS ATT 0.076 0.157*** 0.197*** 0.139** 0.111** 0.111**
[0.076] [0.057] [0.053] [0.056] [0.055] [0.056] Observations 599 16260 16252 16425 16425 16425
Treatment 291 290 291 Controls 308 15970 15961 Dummies regions departments municipalities
Dependent variable: Has Health Insurance
Nearest Neighbor Stratification Kernel OLS OLS OLS
ATT -0.159*** -0.158*** -0.154*** -0.154*** -0.145*** -0.158***
[0.034] [0.024] [0.027] [0.032] [0.031] [0.031] Observations 598 16260 16252 16388 16388 16388
Treatment 291 290 291 Controls 307 15970 15961 Dummies regions departments municipalities
Dependent variable: Had Health Problem Last Month
Nearest Neighbor Stratification Kernel OLS OLS OLS
ATT -0.005 0.005 -0.005 0.009 0.016 0.017 [0.03] [0.022] [0.021] [0.023] [0.023] [0.023]
Observations 599 16260 16252 16425 16425 16425 Treatment 291 290 291 Controls 308 15970 15961 Dummies regions departments municipalities
*** p<0.01, ** p<0.05, * p<0.1
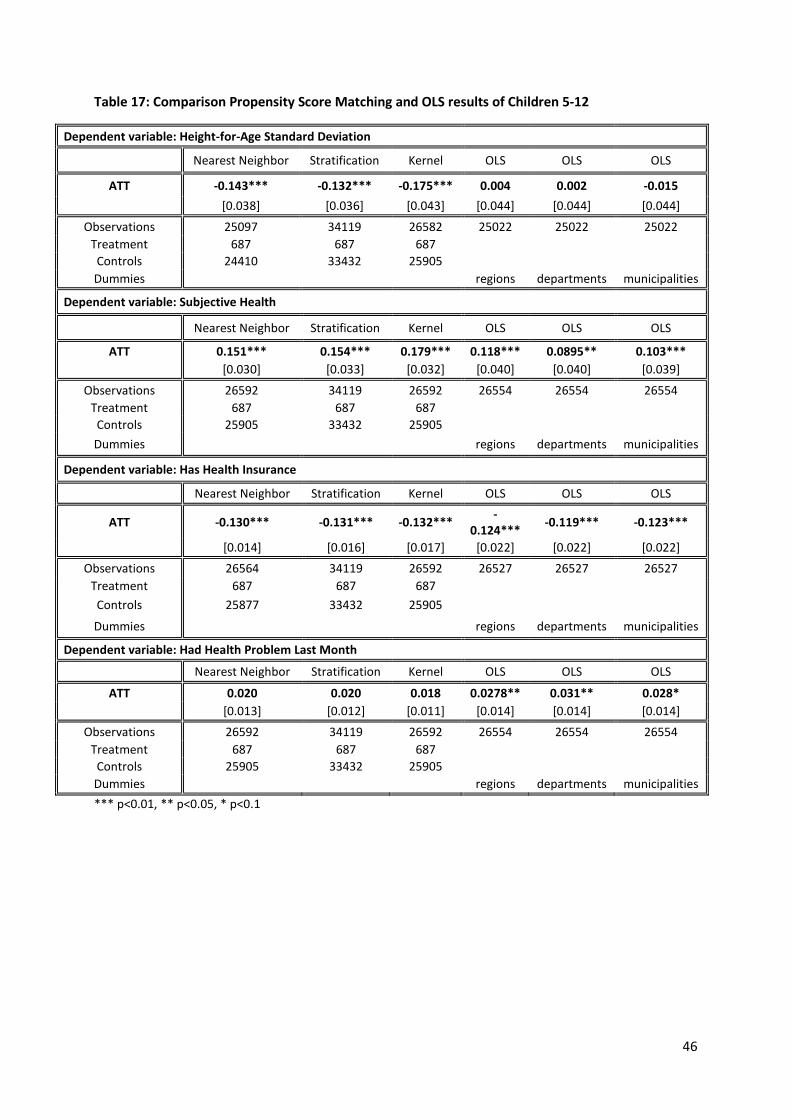
46
Table 17: Comparison Propensity Score Matching and OLS results of Children 5-12
Dependent variable: Height-for-Age Standard Deviation
Nearest Neighbor Stratification Kernel OLS OLS OLS
ATT -0.143*** -0.132*** -0.175*** 0.004 0.002 -0.015 [0.038] [0.036] [0.043] [0.044] [0.044] [0.044]
Observations 25097 34119 26582 25022 25022 25022 Treatment 687 687 687 Controls 24410 33432 25905 Dummies regions departments municipalities
Dependent variable: Subjective Health
Nearest Neighbor Stratification Kernel OLS OLS OLS
ATT 0.151*** 0.154*** 0.179*** 0.118*** 0.0895** 0.103*** [0.030] [0.033] [0.032] [0.040] [0.040] [0.039]
Observations 26592 34119 26592 26554 26554 26554 Treatment 687 687 687 Controls 25905 33432 25905 Dummies regions departments municipalities
Dependent variable: Has Health Insurance
Nearest Neighbor Stratification Kernel OLS OLS OLS
ATT -0.130*** -0.131*** -0.132*** -0.124*** -0.119*** -0.123***
[0.014] [0.016] [0.017] [0.022] [0.022] [0.022] Observations 26564 34119 26592 26527 26527 26527
Treatment 687 687 687 Controls 25877 33432 25905
Dummies regions departments municipalities
Dependent variable: Had Health Problem Last Month
Nearest Neighbor Stratification Kernel OLS OLS OLS
ATT 0.020 0.020 0.018 0.0278** 0.031** 0.028* [0.013] [0.012] [0.011] [0.014] [0.014] [0.014]
Observations 26592 34119 26592 26554 26554 26554 Treatment 687 687 687 Controls 25905 33432 25905 Dummies regions departments municipalities *** p<0.01, ** p<0.05, * p<0.1
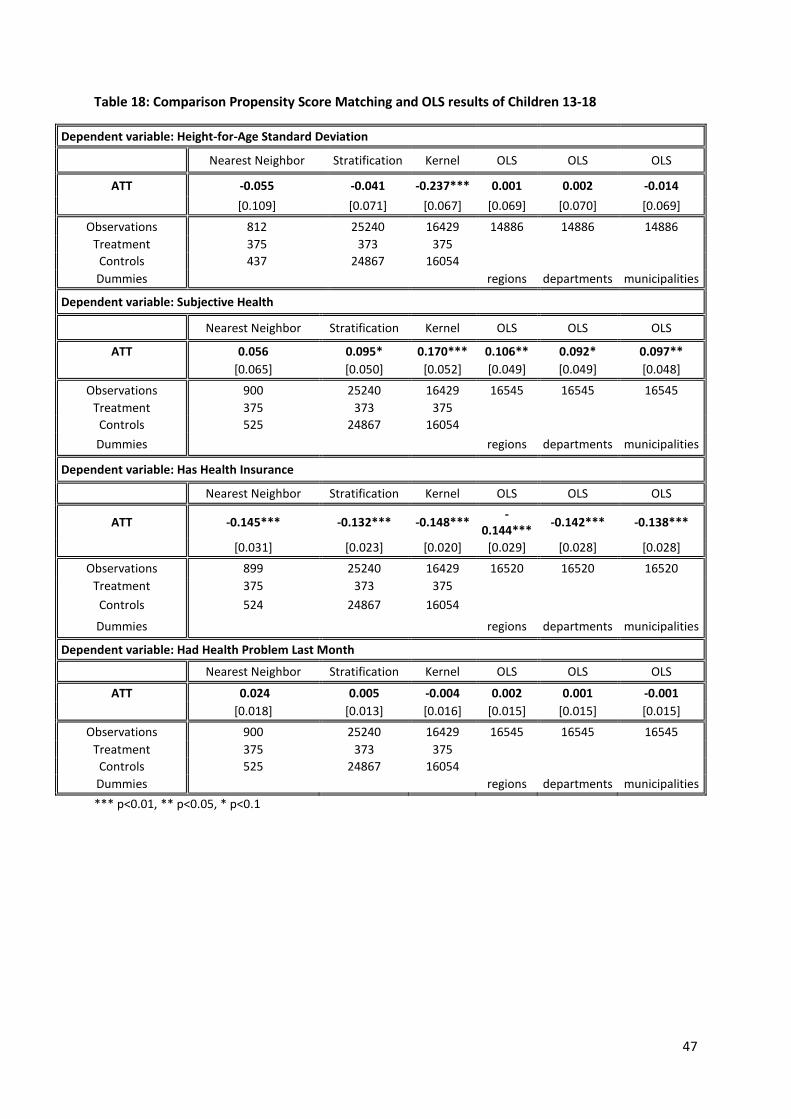
47
Table 18: Comparison Propensity Score Matching and OLS results of Children 13-18
Dependent variable: Height-for-Age Standard Deviation
Nearest Neighbor Stratification Kernel OLS OLS OLS
ATT -0.055 -0.041 -0.237*** 0.001 0.002 -0.014 [0.109] [0.071] [0.067] [0.069] [0.070] [0.069]
Observations 812 25240 16429 14886 14886 14886 Treatment 375 373 375 Controls 437 24867 16054 Dummies regions departments municipalities
Dependent variable: Subjective Health
Nearest Neighbor Stratification Kernel OLS OLS OLS
ATT 0.056 0.095* 0.170*** 0.106** 0.092* 0.097** [0.065] [0.050] [0.052] [0.049] [0.049] [0.048]
Observations 900 25240 16429 16545 16545 16545 Treatment 375 373 375 Controls 525 24867 16054 Dummies regions departments municipalities
Dependent variable: Has Health Insurance
Nearest Neighbor Stratification Kernel OLS OLS OLS
ATT -0.145*** -0.132*** -0.148*** -0.144*** -0.142*** -0.138***
[0.031] [0.023] [0.020] [0.029] [0.028] [0.028] Observations 899 25240 16429 16520 16520 16520
Treatment 375 373 375 Controls 524 24867 16054
Dummies regions departments municipalities
Dependent variable: Had Health Problem Last Month
Nearest Neighbor Stratification Kernel OLS OLS OLS
ATT 0.024 0.005 -0.004 0.002 0.001 -0.001 [0.018] [0.013] [0.016] [0.015] [0.015] [0.015]
Observations 900 25240 16429 16545 16545 16545 Treatment 375 373 375 Controls 525 24867 16054 Dummies regions departments municipalities *** p<0.01, ** p<0.05, * p<0.1