nishat chunian power limited corporate briefing 2020
TRANSCRIPT
NISHAT CHUNIAN POWER LIMITEDCORPORATE BRIEFING 2021
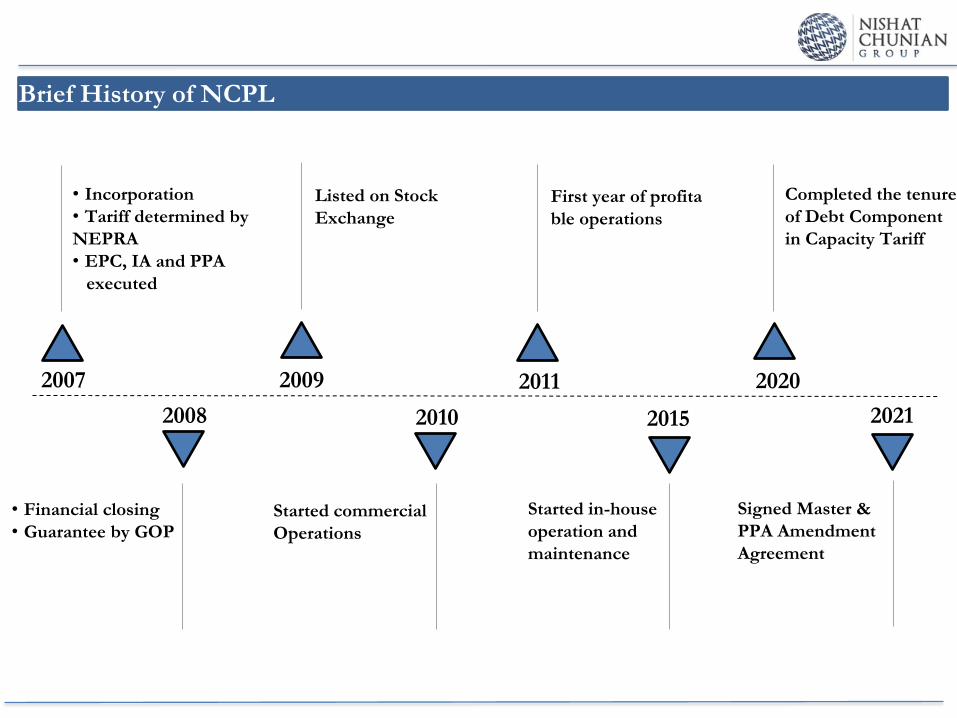
2007
• Incorporation
• Tariff determined by
NEPRA
• EPC, IA and PPA
executed
2008
• Financial closing
• Guarantee by GOP
2009
Listed on Stock
Exchange
2010
Started commercial
Operations
2011
First year of profita
ble operations
2015
Started in-house
operation and
maintenance
Brief History of NCPL
2020
Completed the tenure
of Debt Component
in Capacity Tariff
2021
Signed Master &
PPA Amendment
Agreement
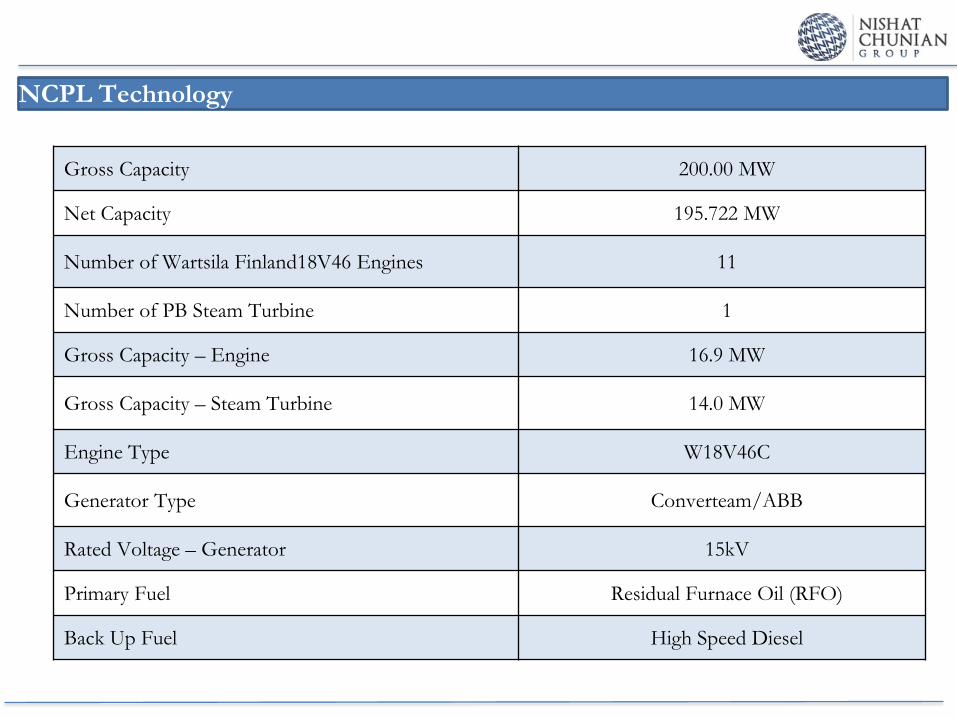
NCPL Technology
Gross Capacity 200.00 MW
Net Capacity 195.722 MW
Number of Wartsila Finland18V46 Engines 11
Number of PB Steam Turbine 1
Gross Capacity – Engine 16.9 MW
Gross Capacity – Steam Turbine 14.0 MW
Engine Type W18V46C
Generator Type Converteam/ABB
Rated Voltage – Generator 15kV
Primary Fuel Residual Furnace Oil (RFO)
Back Up Fuel High Speed Diesel
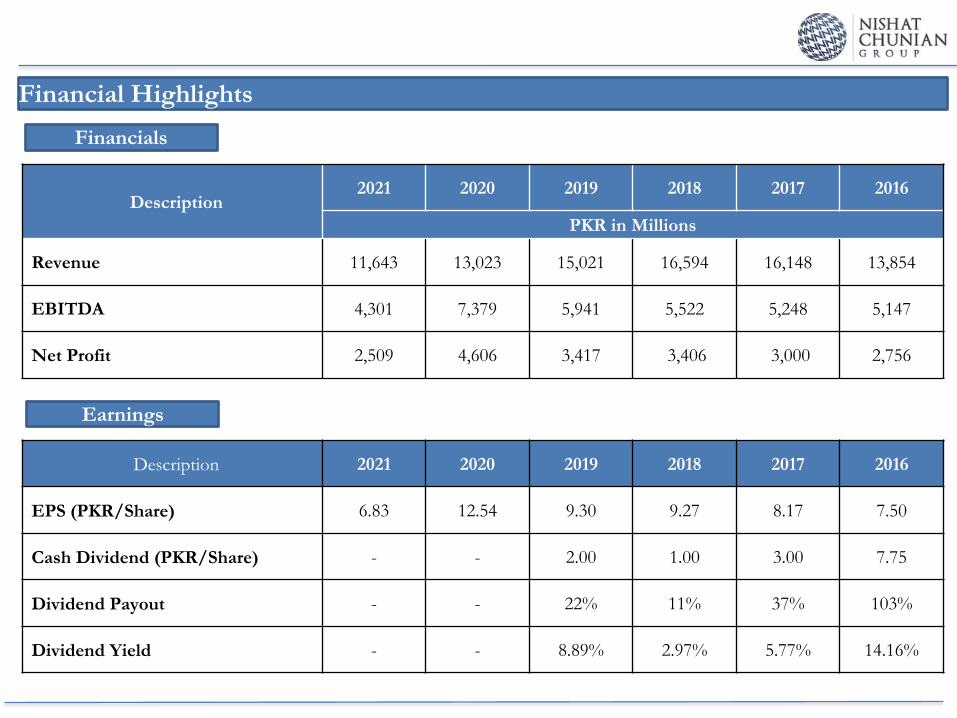
Financial Highlights
Description2021 2020 2019 2018 2017 2016
PKR in Millions
Revenue 11,643 13,023 15,021 16,594 16,148 13,854
EBITDA 4,301 7,379 5,941 5,522 5,248 5,147
Net Profit 2,509 4,606 3,417 3,406 3,000 2,756
Description 2021 2020 2019 2018 2017 2016
EPS (PKR/Share) 6.83 12.54 9.30 9.27 8.17 7.50
Cash Dividend (PKR/Share) - - 2.00 1.00 3.00 7.75
Dividend Payout - - 22% 11% 37% 103%
Dividend Yield - - 8.89% 2.97% 5.77% 14.16%
Financials
Earnings
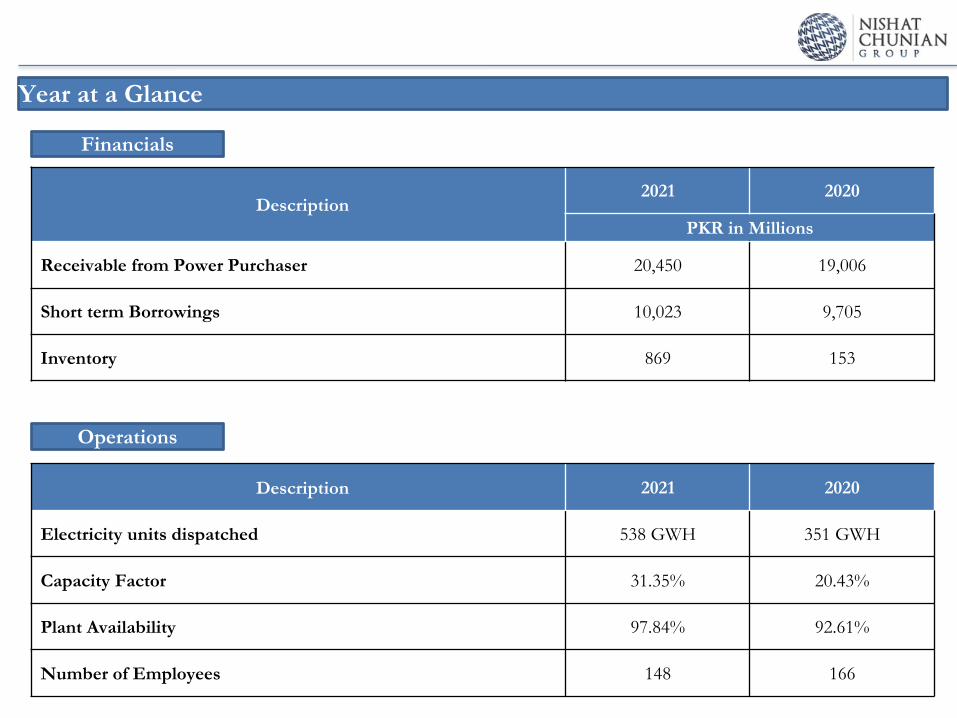
Year at a Glance
Description2021 2020
PKR in Millions
Receivable from Power Purchaser 20,450 19,006
Short term Borrowings 10,023 9,705
Inventory 869 153
Financials
Operations
Description 2021 2020
Electricity units dispatched 538 GWH 351 GWH
Capacity Factor 31.35% 20.43%
Plant Availability 97.84% 92.61%
Number of Employees 148 166
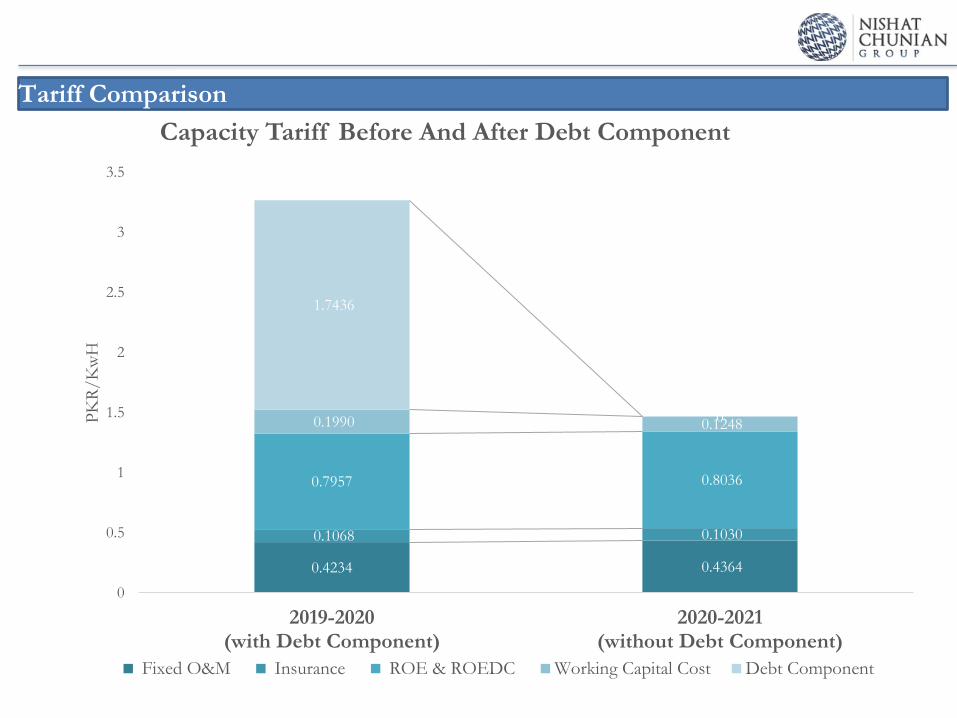
Tariff Comparison
0.4234 0.4364
0.1068 0.1030
0.7957 0.8036
0.1990 0.1248
1.7436
0
0
0.5
1
1.5
2
2.5
3
3.5
2019-2020(with Debt Component)
2020-2021(without Debt Component)
PK
R/
Kw
H
Capacity Tariff Before And After Debt Component
Fixed O&M Insurance ROE & ROEDC Working Capital Cost Debt Component
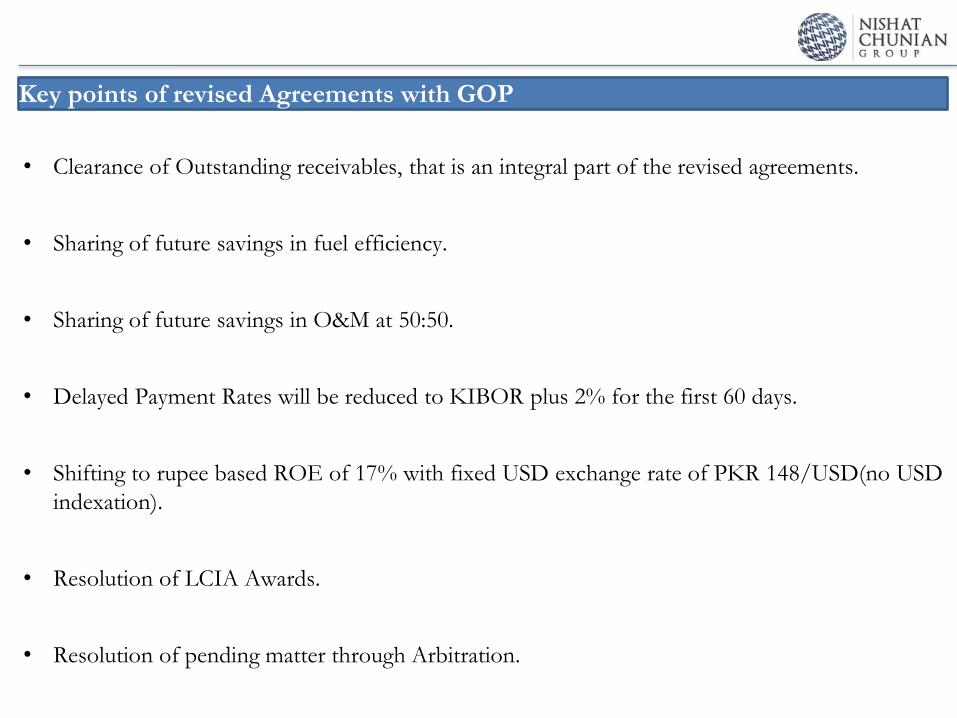
Key points of revised Agreements with GOP
• Clearance of Outstanding receivables, that is an integral part of the revised agreements.
• Sharing of future savings in fuel efficiency.
• Sharing of future savings in O&M at 50:50.
• Delayed Payment Rates will be reduced to KIBOR plus 2% for the first 60 days.
• Shifting to rupee based ROE of 17% with fixed USD exchange rate of PKR 148/USD(no USD
indexation).
• Resolution of LCIA Awards.
• Resolution of pending matter through Arbitration.
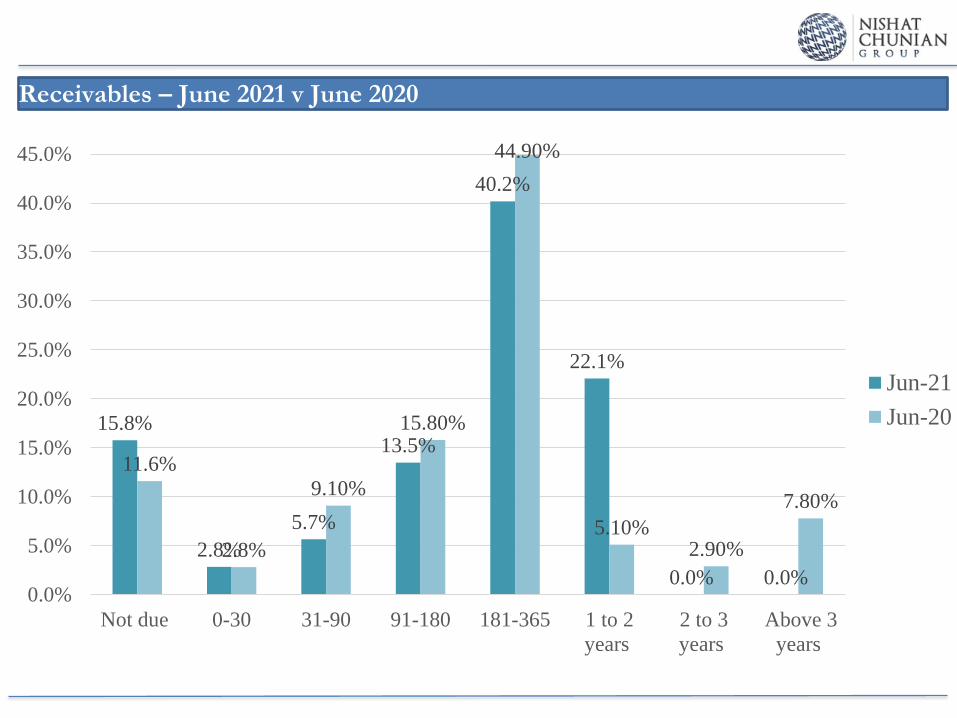
15.8%
2.8%
5.7%
13.5%
40.2%
22.1%
0.0% 0.0%
11.6%
2.8%
9.10%
15.80%
44.90%
5.10%2.90%
7.80%
0.0%
5.0%
10.0%
15.0%
20.0%
25.0%
30.0%
35.0%
40.0%
45.0%
Not due 0-30 31-90 91-180 181-365 1 to 2
years
2 to 3
years
Above 3
years
Jun-21
Jun-20
Receivables – June 2021 v June 2020
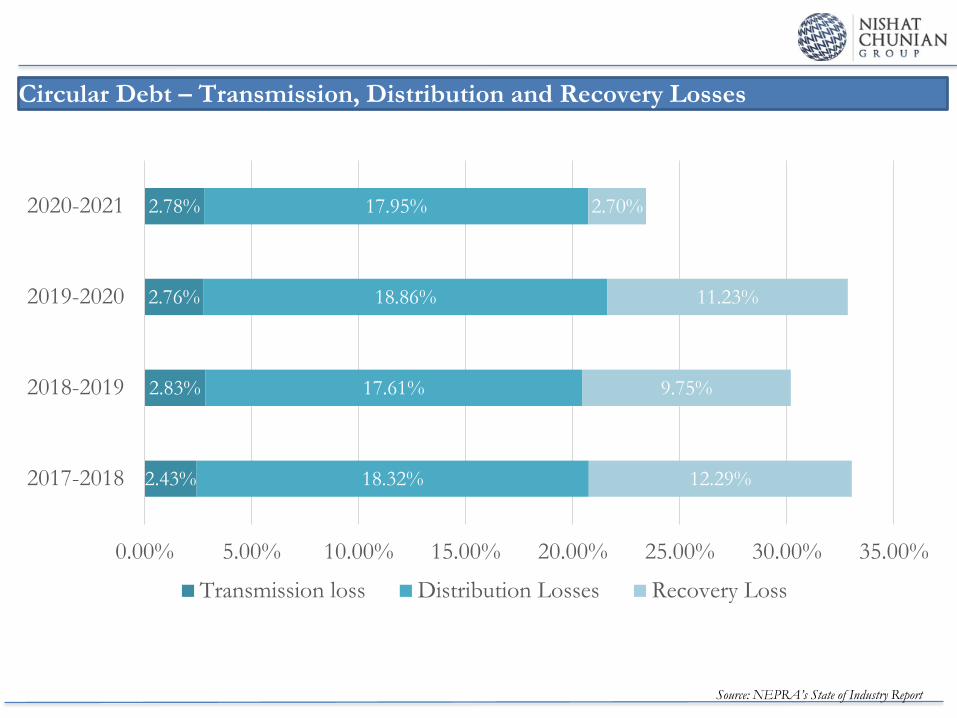
Circular Debt – Transmission, Distribution and Recovery Losses
Source: NEPRA’s State of Industry Report
2.43%
2.83%
2.76%
2.78%
18.32%
17.61%
18.86%
17.95%
12.29%
9.75%
11.23%
2.70%
0.00% 5.00% 10.00% 15.00% 20.00% 25.00% 30.00% 35.00%
2017-2018
2018-2019
2019-2020
2020-2021
Transmission loss Distribution Losses Recovery Loss
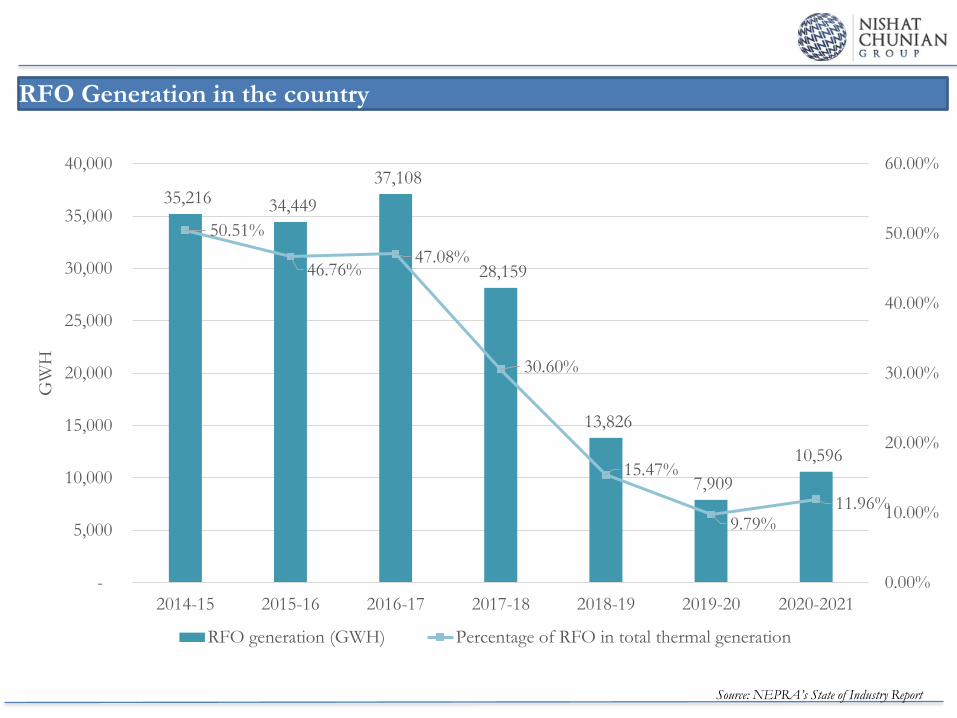
RFO Generation in the country
Source: NEPRA’s State of Industry Report
35,216 34,449
37,108
28,159
13,826
7,909
10,596
50.51%
46.76%47.08%
30.60%
15.47%
9.79%11.96%
0.00%
10.00%
20.00%
30.00%
40.00%
50.00%
60.00%
-
5,000
10,000
15,000
20,000
25,000
30,000
35,000
40,000
2014-15 2015-16 2016-17 2017-18 2018-19 2019-20 2020-2021
GW
H
RFO generation (GWH) Percentage of RFO in total thermal generation

THANK YOU!

Questions and
Answers Session