nisshinbo annual report 2001...annual report 2001 (year ended march 31, 2001) nisshinbo annual...
TRANSCRIPT
Annual Report 2001(Year ended March 31, 2001)
NI
SS
HI
NB
O
AN
NU
AL
R
EP
OR
T
20
01
Y
ea
r
en
de
d
Ma
rc
h
31
,
20
01
2-31-11, Ningyo-cho, Nihonbashi, Chuo-ku, Tokyo 103-8650, Japan
Tel: 03-5695-8833 / Fax: 03-5695-8970
URL: http://www.nisshinbo. co.jp/
Printed in Japan
3.3Nissinbo-Cover1-4 01.9.26 4:05 PM ページ 1 (1,1)
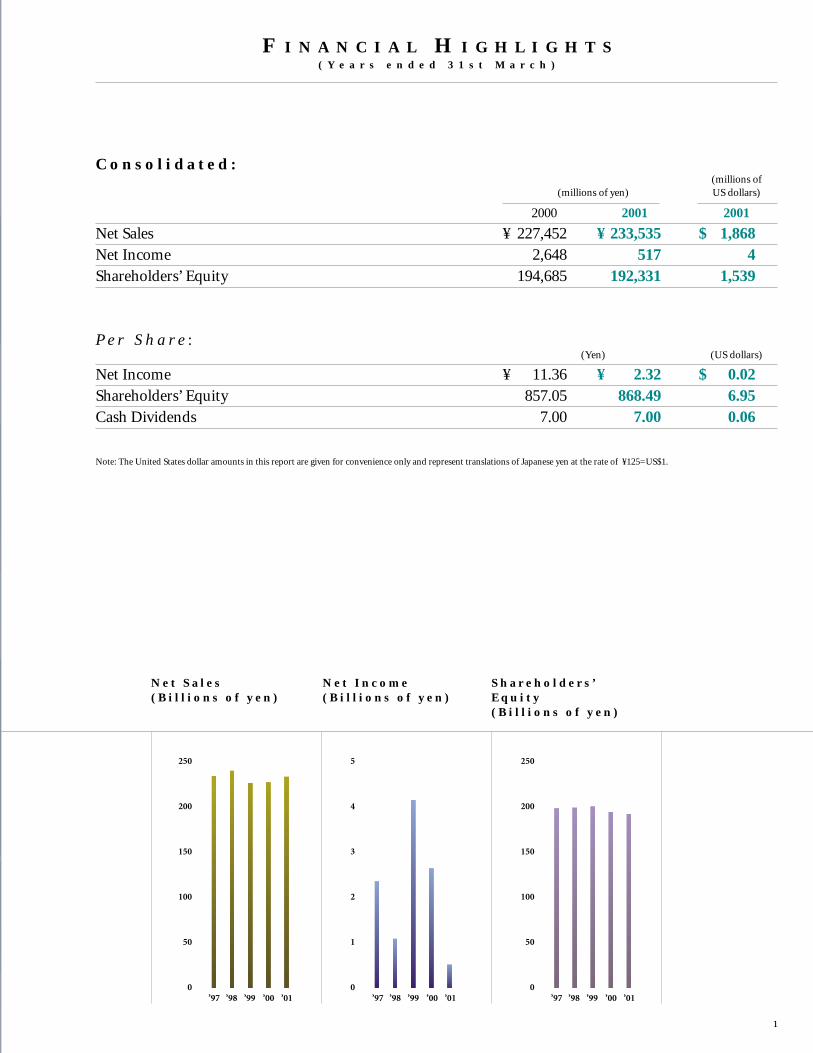
NISSHINBO Industries, Inc. (the “Company”) was
founded in 1907 as a manufacturer of cotton yarns and threads,
and quickly assumed a position of leadership in the industry.
Our history has been characterized by strategic moves taken in
advance of competitors and designed to raise productivity,
improve quality and add value. Today, we are a total textiles
manufacturer, controlling operations from spinning to
finishing. This, together with our accumulated high levels of
technology, gives us an advantage in the
development of truly distinctive products and in
quality control.
Through the application in other fields of
technologies and expertise originally developed in
the textiles area, we have diversified our
operations into the manufacture of automobile
brakes, papers, machine tools, chemical products,
and others. These non-textile lines have grown
steadily, and now account for over 65% of
consolidated net sales. We have targeted certain
strategic products to form the basis of future
growth: High value-added finishing processes and
products in the textiles field, including SUPER
SOFT and SSP (SUPER SOFT PEACHPHASE),
new-generation electronic braking systems, high
heat-insulation panels and fuel cell-related
materials.
The Company and its consolidated subsidiaries
and affiliates (together, “Nisshinbo”) are fully
focused on enhancing its collective strengths
across its entire business range. As a genuinely
21st century manufacturer backed by advanced
production systems and a wide range of high-value-added
products, we will maintain our competitiveness by emphasizing
our distinctive strengths.
C O N T E N T S
Financial Highlights
Business Lineup
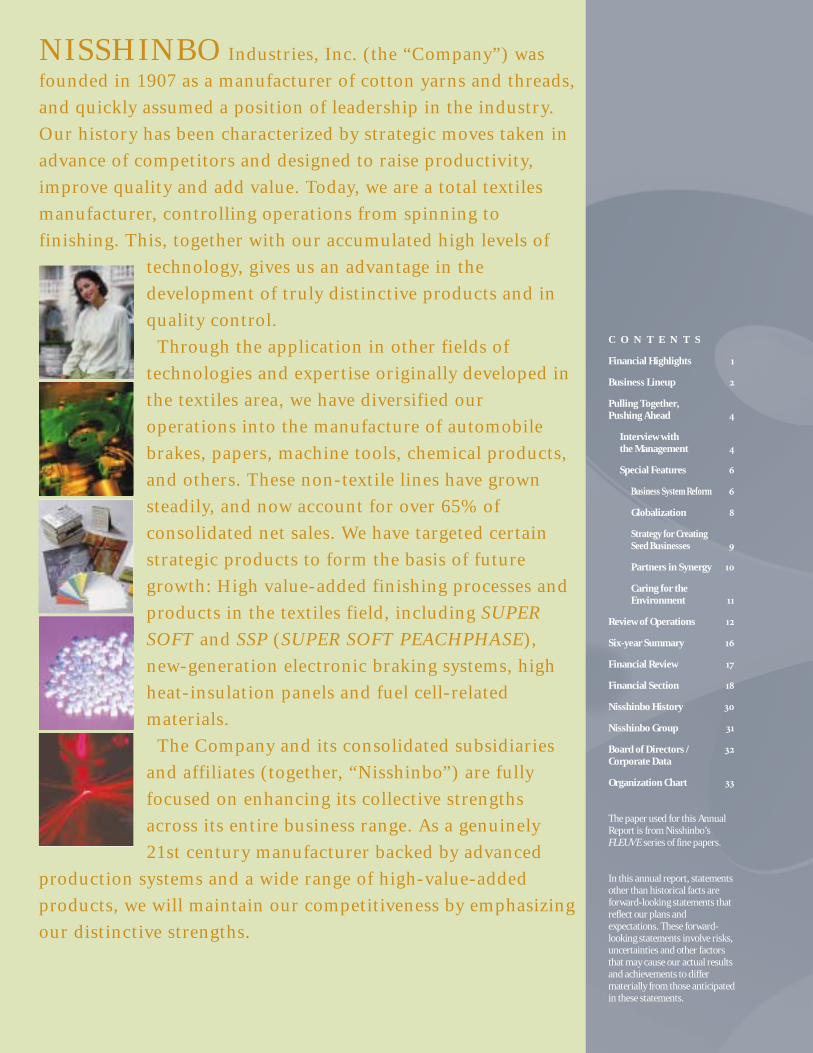
Pulling Together, Pushing Ahead
Interview with the Management
Special Features
Business System Reform
Globalization
Strategy for CreatingSeed Businesses
Partners in Synergy
Caring for the Environment
Review of Operations
Six-year Summary
Financial Review
Financial Section
Nisshinbo History
Nisshinbo Group
Board of Directors / Corporate Data
Organization Chart
The paper used for this AnnualReport is from Nisshinbo’sFLEUVE series of fine papers.
In this annual report, statementsother than historical facts areforward-looking statements thatreflect our plans andexpectations. These forward-looking statements involve risks,uncertainties and other factorsthat may cause our actual resultsand achievements to differmaterially from those anticipatedin these statements.
3.3NISSHINBO_AR2001前半(0904) 01.9.26 4:09 PM ページ 1
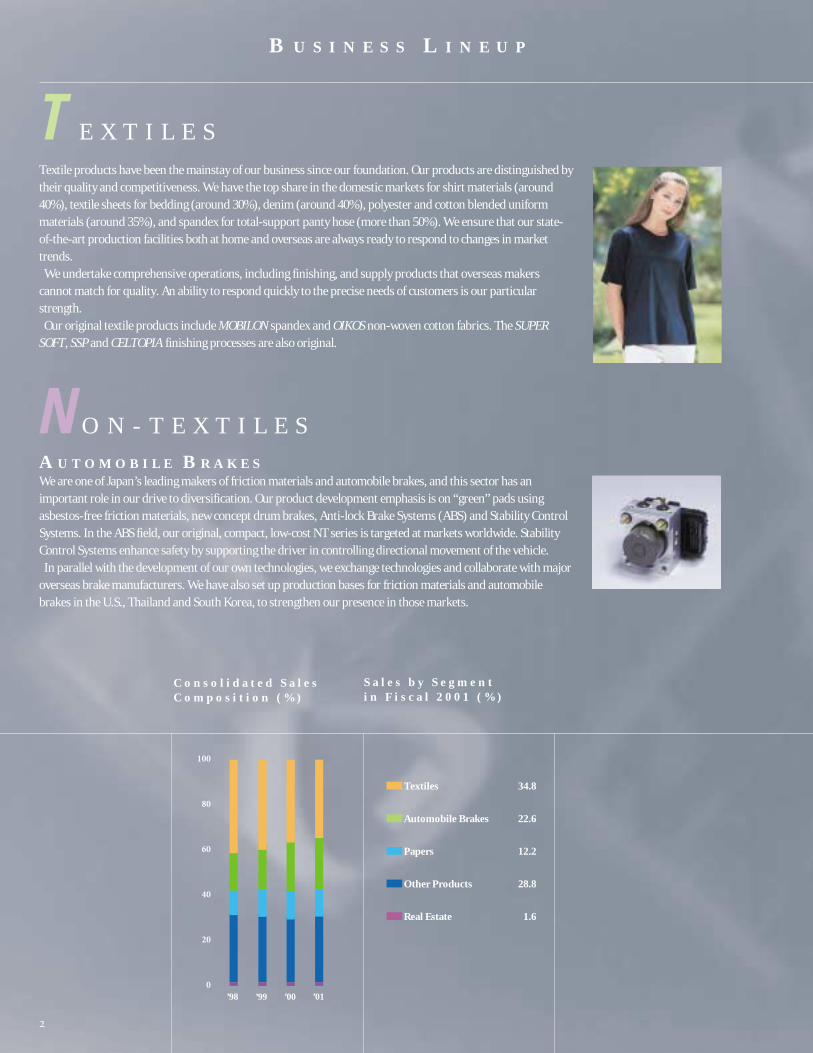
F I N A N C I A L H I G H L I G H T S( Y e a r s e n d e d 3 1 s t M a r c h )
C o n s o l i d a t e d :(millions of
(millions of yen) US dollars)
2000 2001 2001
Net Sales ¥ 227,452 ¥ 233,535 $ 1,868Net Income 2,648 517 4Shareholders’ Equity 194,685 192,331 1,539
P e r S h a r e :(Yen) (US dollars)
Net Income ¥ 11.36 ¥ 2.32 $ 0.02Shareholders’ Equity 857.05 868.49 6.95Cash Dividends 7.00 7.00 0.06
Note: The United States dollar amounts in this report are given for convenience only and represent translations of Japanese yen at the rate of ¥125=US$1.
N e t S a l e s( B i l l i o n s o f y e n )
N e t I n c o m e( B i l l i o n s o f y e n )
S h a r e h o l d e r s ’E q u i t y( B i l l i o n s o f y e n )
3.3NISSHINBO_AR2001前半(0904) 01.9.26 4:09 PM ページ 2
T E X T I L E S
Textile products have been the mainstay of our business since our foundation. Our products are distinguished bytheir quality and competitiveness. We have the top share in the domestic markets for shirt materials (around40%), textile sheets for bedding (around 30%), denim (around 40%), polyester and cotton blended uniformmaterials (around 35%), and spandex for total-support panty hose (more than 50%). We ensure that our state-of-the-art production facilities both at home and overseas are always ready to respond to changes in markettrends. We undertake comprehensive operations, including finishing, and supply products that overseas makers
cannot match for quality. An ability to respond quickly to the precise needs of customers is our particularstrength. Our original textile products include MOBILON spandex and OIKOS non-woven cotton fabrics. The SUPER
SOFT, SSP and CELTOPIA finishing processes are also original.
N O N - T E X T I L E S
A U T O M O B I L E B R A K E SWe are one of Japan’s leading makers of friction materials and automobile brakes, and this sector has animportant role in our drive to diversification. Our product development emphasis is on “green” pads usingasbestos-free friction materials, new concept drum brakes, Anti-lock Brake Systems (ABS) and Stability ControlSystems. In the ABS field, our original, compact, low-cost NT series is targeted at markets worldwide. StabilityControl Systems enhance safety by supporting the driver in controlling directional movement of the vehicle. In parallel with the development of our own technologies, we exchange technologies and collaborate with major
overseas brake manufacturers. We have also set up production bases for friction materials and automobilebrakes in the U.S., Thailand and South Korea, to strengthen our presence in those markets.
■ Textiles 34.8
■ Automobile Brakes 22.6
■ Papers 12.2
■ Other Products 28.8
■ Real Estate 1.6
B U S I N E S S L I N E U P
C o n s o l i d a t e d S a l e sC o m p o s i t i o n ( % )
’98 ’99 ’00 ’01
S a l e s b y S e g m e n t i n F i s c a l 2 0 0 1 ( % )
3.3NISSHINBO_AR2001前半(0904) 01.9.26 4:09 PM ページ 3
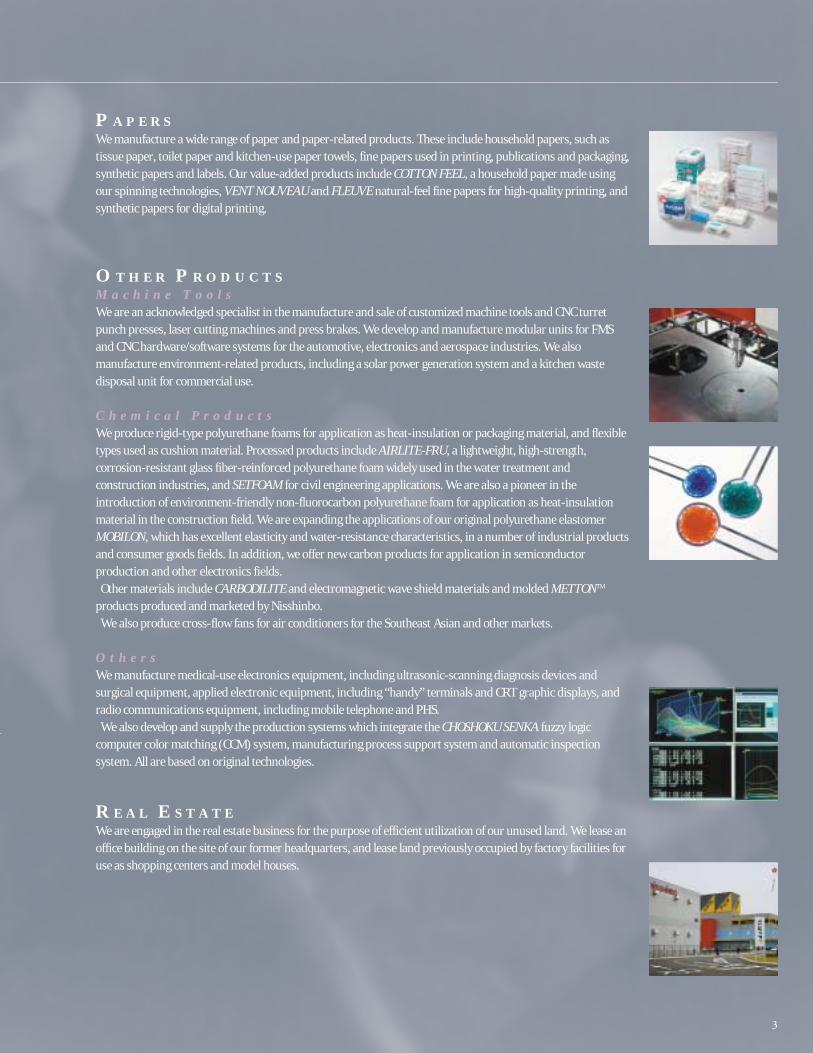
P A P E R SWe manufacture a wide range of paper and paper-related products. These include household papers, such astissue paper, toilet paper and kitchen-use paper towels, fine papers used in printing, publications and packaging,synthetic papers and labels. Our value-added products include COTTON FEEL, a household paper made usingour spinning technologies, VENT NOUVEAU and FLEUVE natural-feel fine papers for high-quality printing, andsynthetic papers for digital printing.
O T H E R P R O D U C T S M a c h i n e T o o l s We are an acknowledged specialist in the manufacture and sale of customized machine tools and CNC turretpunch presses, laser cutting machines and press brakes. We develop and manufacture modular units for FMSand CNC hardware/software systems for the automotive, electronics and aerospace industries. We alsomanufacture environment-related products, including a solar power generation system and a kitchen wastedisposal unit for commercial use.
C h e m i c a l P r o d u c t sWe produce rigid-type polyurethane foams for application as heat-insulation or packaging material, and flexibletypes used as cushion material. Processed products include AIRLITE-FRU, a lightweight, high-strength,corrosion-resistant glass fiber-reinforced polyurethane foam widely used in the water treatment andconstruction industries, and SETFOAM for civil engineering applications. We are also a pioneer in theintroduction of environment-friendly non-fluorocarbon polyurethane foam for application as heat-insulationmaterial in the construction field. We are expanding the applications of our original polyurethane elastomerMOBILON, which has excellent elasticity and water-resistance characteristics, in a number of industrial productsand consumer goods fields. In addition, we offer new carbon products for application in semiconductorproduction and other electronics fields.Other materials include CARBODILITE and electromagnetic wave shield materials and molded METTONTM
products produced and marketed by Nisshinbo.We also produce cross-flow fans for air conditioners for the Southeast Asian and other markets.
O t h e r sWe manufacture medical-use electronics equipment, including ultrasonic-scanning diagnosis devices andsurgical equipment, applied electronic equipment, including “handy” terminals and CRT graphic displays, andradio communications equipment, including mobile telephone and PHS. We also develop and supply the production systems which integrate the CHOSHOKU SENKA fuzzy logic
computer color matching (CCM) system, manufacturing process support system and automatic inspectionsystem. All are based on original technologies.
R E A L E S T A T EWe are engaged in the real estate business for the purpose of efficient utilization of our unused land. We lease anoffice building on the site of our former headquarters, and lease land previously occupied by factory facilities foruse as shopping centers and model houses.
3.3NISSHINBO_AR2001前半(0904) 01.9.26 4:10 PM ページ 4
Q1. What were Nisshinbo Industries, Inc.’s
consolidated results for fiscal 2001,
ended March 31, 2001?
Consolidated net sales totaled ¥233,535 million (US$1,868 million), an
increase of 2.7% over fiscal 2000, ended March 31, 2000. Operating
income was ¥5,751 million (US$46 million), up 38.9%, supported by
higher sales of automobile brakes, and improved profitability in the
textiles segment. Net income decreased 80.5% to ¥517 million (US$4
million), due to a decrease in gain on sales of securities and a one-time
expense resulting from the adoption of a new accounting standard for
employees’ retirement benefits and retirement benefits paid due to
restructuring of business operations.
By business segment, sales of textiles decreased 3.1% to ¥81,240 million
(US$650 million), while sales of non-textiles increased 6.0% to ¥152,295
million (US$1,218 million). The ratio of non-textiles sales to total sales
increased 2.0 percentage points to 65.2%.
For fiscal 2001, the Japanese corporate sector posted a modest recovery
in earnings. However, weak consumer spending and widespread
uncertainty about future economic prospects continued. Sales of textiles
decreased, affected particularly by lower sales prices resulting from a
sharp increase in demand for low-
priced imports. However, further
successful cost-down efforts in both
raw materials procurement and
operations enabled us to increase
profit. Our performance in the non-
textiles segment was mixed,
depending on business area, but
overall sales and operating income
increased, thanks to higher sales of
automobile brakes.
On April 1, 2000, we launched a
three-year management plan
designed to increase our corporate
value by expanding our business
scale and improving profitability.
Under this plan, we will reinforce our new product development
capabilities, establish a solid operating system for each product sector,
and bring our business structure in line with global standards.
Q2. What progress have you made so far in
promoting the three-year management plan?
Our strategies at the divisional level are designed to reinforce our ability
to develop new products and to ensure that our business systems have
the flexibility to respond to a fast-changing business environment.
Pursuing these basic goals, we have focused on organizational reform to
strengthen our operations in core businesses and seek new opportunities
in growth fields.
In the textiles segment, we are shifting production from domestic to
overseas bases to enhance our cost competitiveness. We closed down the
Notogawa Plant and have decided to close down the Harisaki plant, and
made P.T. Nikawa Textile Industry of Indonesia a subsidiary. We are
increasing production at P.T. Nikawa Textile Industry, P.T. Gistex
Nisshinbo Indonesia and Nisshinbo do Brasil Industria Textil Ltda. We
are also acquiring shares in, and providing technical assistance to,
enterprises in China.
In the non-textiles segment, we established a joint venture, Continental
Teves Corporation (CTC), with Continental Teves AG &
Co. oHG (CT) of Germany, to enable us to compete still
more successfully in the global automobile brakes market.
To promote the creation of new businesses, we set up a
Fuel Cell Department within the Research and
Development Division, and are developing several
promising products in the biotechnology and
environment-related fields. We also expanded sales of our
N’s VIP vacuum insulation panel.
In terms of management and business structure
generally, we worked to meet global standards. We
sharpened our focus on environment-related issues, set up
an advanced IT network, and made progress in acquiring
further QS9000, ISO9001 and ISO14001 certification.
In fiscal 2001, we made capital investment in an amount
of ¥17,093 million (US$137 million), which we allocated
I N T E R V I E W W I T H T H E M A N A G E M E N T
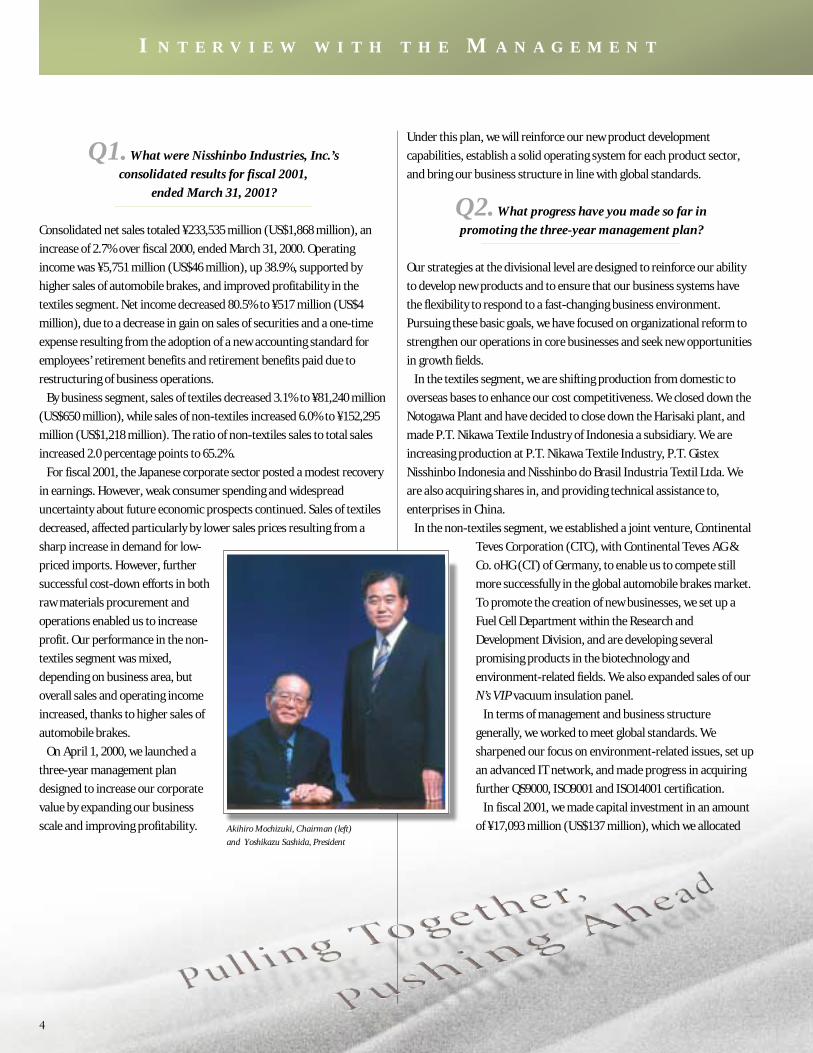
Akihiro Mochizuki, Chairman (left)
and Yoshikazu Sashida, President
3.3NISSHINBO_AR2001前半(0904) 01.9.26 4:10 PM ページ 5
mainly to development of new products in fast-growing fields and
enhancement of production facilities.
Upon completion of the current three-year management plan at the end
of fiscal 2003, we plan to have increased consolidated sales to the
¥300,000 million level, and operating income to the ¥13,000 million level.
Improving profitability in the textiles segment and accelerating business
development in the non-textiles segment are the keys to achieving these
goals.
Q3. What is the outlook for fiscal 2002,
ending March 31, 2002?
There is no sign of recovery in consumer spending, and corporate capital
investment is slowing, so we expect the current adverse business
conditions to continue well into fiscal 2002. Under these circumstances,
we are implementing a “Business System Reform” program involving a
comprehensive review of our activities. This reflects our determination to
be genuinely a 21st century manufacturer, capable of meeting all the
difficult, and exciting, challenges that lie ahead.
For fiscal 2002, we project sales of ¥238,000 million and operating
income of ¥7,000 million.
Q4. Can you give more details of the
“Business System Reform” program?
The major themes of the program are as follows: Swifter response to
changes in the business environment, enhanced competitiveness in a fast
globalizing marketplace, improved product development capabilities
matched to customer needs and higher levels of overall efficiency.
For product development, we will select development themes carefully,
based on potential for commercialization. To meet our other objectives,
each business division is currently reviewing its operating processes,
from procurement of materials through production to distribution and
marketing. Each division will define its next steps forward in relation to
our broad strategic prospective of globalization, strengthening
competitiveness, and long-term vision.
To support these activities, we will expand our utilization of advanced
IT across the Group and push ahead with a new staff training program
designed to global standards. We have high hopes that “New Challenge
System,” an in-house staff recruitment system, will make us more
efficient in getting the right people into the right jobs at the right time.
By strengthening each of our businesses, and through alliances and tie-
ups with other companies relating to finance, production and human
resources, we will enhance our competitiveness on a Group-wide basis.
By making the most of our integrated group strengths, we intend to
maintain our leadership in the Japanese textile industry. We also aim for
ascendancy in a diverse range of new business fields, ultimately obtaining
top shares both in domestic and overseas markets.
Q5. Are there any other important matters
that you would like to comment on?
Yes, one very important matter in particular. Soil at the site of our former
Tokyo Plant has been found to be contaminated. In fiscal 1999, a portion
of the site was sold to the Urban Development Corporation (UDC), and
during the course of demolishing buildings and other facilities we
discovered contamination. We conducted a thorough examination and
found that fortunately the contamination did not extend beyond the site.
We are currently decontaminating the site according to ministerial
guidelines, taking extreme care not to cause any adverse impact on the
surrounding environment. We expect to hand over the site to UDC at the
end of March 2003.
Q6. Finally, what is your policy regarding dividends?
We seek to return profits to shareholders, ideally increasing dividends in
line with earnings, while also keeping retained earnings at the levels
required to secure future growth.
Owing to the adverse business environment, our results for fiscal 2001
were not as we had hoped. Nevertheless, the dividend for fiscal 2001 is
¥7.00 (US$0.06) per common share, the same as for fiscal 2000.
During fiscal 2001, as one way of improving shareholder value, we
repurchased a total of 5,700,000 shares of the Company at a cost of ¥2,914
million (US$23 million) and cancelled them.
We shall continue in our efforts to increase profitability by offering high
value-added products deriving from superior development and advanced
production systems. Meanwhile, we take this opportunity to express our
sincere appreciation to shareholders, customers and friends for their
continuing support.
Yoshikazu Sashida
President
Akihiro Mochizuki
Chairman
3.3NISSHINBO_AR2001前半(0904) 01.9.26 4:15 PM ページ 6
B u s i n e s s S y s t e m R e f o r m
Our business system reform activities reach into all our
operating and administrative systems.
In the textiles segment, we emphasize strategic moves to enhance
profitability through a channeling of financial and management
resources into carefully selected business areas. We have identified
a number of major reform themes. These include enhancement of
customer-oriented businesses, reviewing existing product lines,
establishing an IT network linking operations from production to
sales, globalization of our operations through a shift of production
to overseas bases, and technological development. In the latter
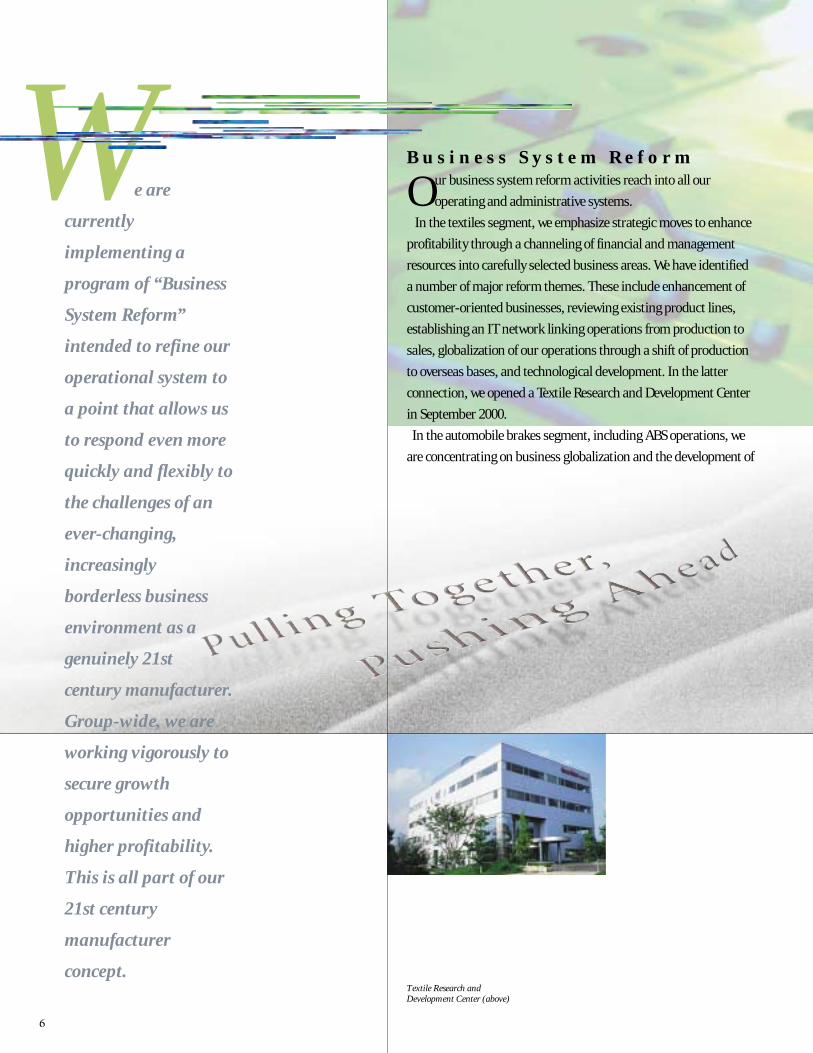
connection, we opened a Textile Research and Development Center
in September 2000.
In the automobile brakes segment, including ABS operations, we
are concentrating on business globalization and the development of
Textile Research andDevelopment Center (above)
e are
currently
implementing a
program of “Business
System Reform”
intended to refine our
operational system to
a point that allows us
to respond even more
quickly and flexibly to
the challenges of an
ever-changing,
increasingly
borderless business
environment as a
genuinely 21st
century manufacturer.
Group-wide, we are
working vigorously to
secure growth
opportunities and
higher profitability.
This is all part of our
21st century
manufacturer
concept.
W
3.3NISSHINBO_AR2001前半(0904) 01.9.26 4:10 PM ページ 7
competitive products in world markets. Automobile manufacturers
are extremely demanding in terms of maintaining and enhancing
quality. To meet their needs, we focus on meeting the requirements
for internationally recognized quality standards. In addition, we are
strengthening our global business structure, responding swiftly to
a sustained increase in demand for modular units, working to
reduce our cost base, and enhancing after-sales services.
In the paper products field, competition among the large
manufacturers is intensifying and sales prices are falling. We have
chosen to go against this trend. Cost reduction is important, but we
place more weight on the exploitation of niche markets where we
can make the most of our technological superiority and achieve
further growth.
Among other businesses, improving profitability in the machine
tools field is a priority. This involves a streamlining of our product
lineup and a shift of focus to new growth fields.
We will strengthen operations in our core businesses and invest in
areas where we see strong demand. Specifically, we intend to
develop environment-related products into a new pillar of other
businesses.
In the chemical products field, we currently handle a broad range
of products for application in various industries. We need to be
more selective, identifying growth fields and undertaking product
development accordingly. We will implement a clear strategy based
on unified development, production and sales activities, and
detailed analysis of comprehensive market data. We will establish a
direct-to-customers distribution system, a detailed cost control
system suitable for our product range, a production management
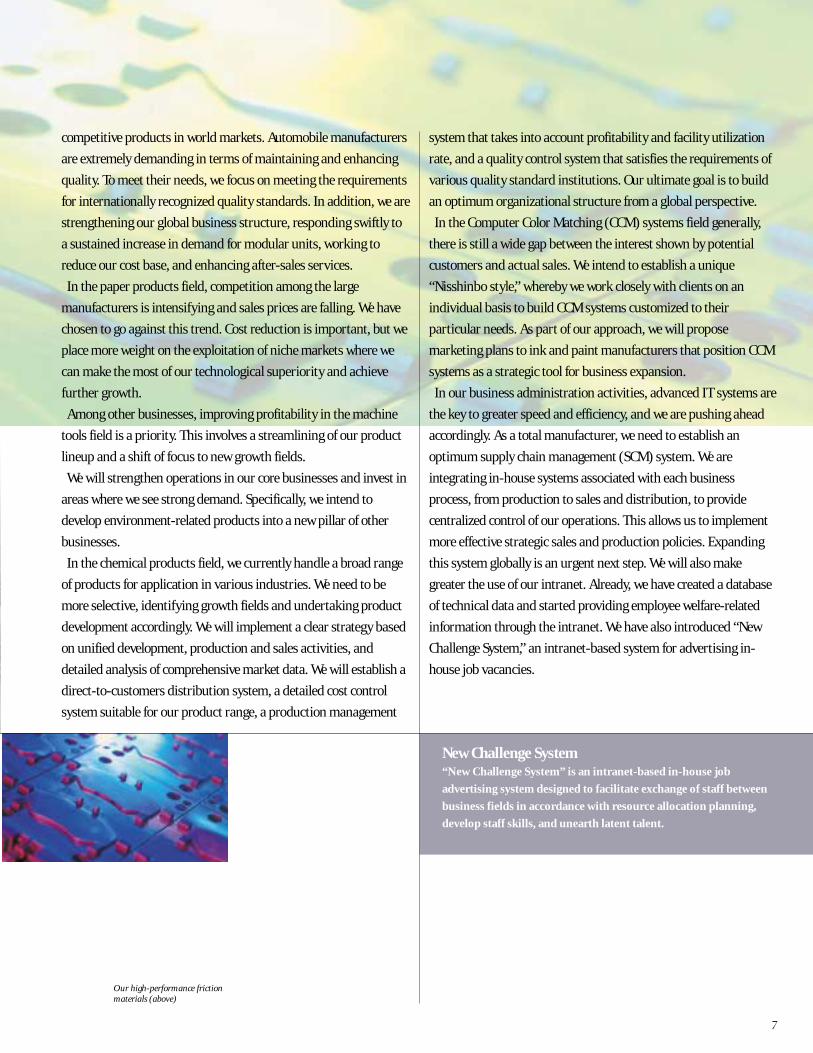
Our high-performance frictionmaterials (above)
system that takes into account profitability and facility utilization
rate, and a quality control system that satisfies the requirements of
various quality standard institutions. Our ultimate goal is to build
an optimum organizational structure from a global perspective.
In the Computer Color Matching (CCM) systems field generally,
there is still a wide gap between the interest shown by potential
customers and actual sales. We intend to establish a unique
“Nisshinbo style,” whereby we work closely with clients on an
individual basis to build CCM systems customized to their
particular needs. As part of our approach, we will propose
marketing plans to ink and paint manufacturers that position CCM
systems as a strategic tool for business expansion.
In our business administration activities, advanced IT systems are
the key to greater speed and efficiency, and we are pushing ahead
accordingly. As a total manufacturer, we need to establish an
optimum supply chain management (SCM) system. We are
integrating in-house systems associated with each business
process, from production to sales and distribution, to provide
centralized control of our operations. This allows us to implement
more effective strategic sales and production policies. Expanding
this system globally is an urgent next step. We will also make
greater the use of our intranet. Already, we have created a database
of technical data and started providing employee welfare-related
information through the intranet. We have also introduced “New
Challenge System,” an intranet-based system for advertising in-
house job vacancies.
New Challenge System“New Challenge System” is an intranet-based in-house job
advertising system designed to facilitate exchange of staff between
business fields in accordance with resource allocation planning,
develop staff skills, and unearth latent talent.
3.3NISSHINBO_AR2001前半(0904) 01.9.26 4:10 PM ページ 8
G l o b a l i z a t i o n – E n h a n c i n gC o m p e t i t i v e n e s s
The Japanese textile industry continues to face difficult business
conditions, due mainly to sluggish consumer spending and
increased competition from imports. The sales ratio of domestically
produced cotton products to total sales of cotton products for fiscal
2001 showed a year-to-year decrease of one-third.
Our response is to reduce domestic production and instead
emphasize the development of high value-added processing
technologies. Simultaneously, we will accelerate the shift of
production to overseas bases and build close, cooperative ties
within the Nisshinbo Group to facilitate business globalization.
We are confident that our strategy will succeed in making us a top
player in selected world markets. Traditionally, we have led the
Japanese textile industry by maximizing efficiency at our domestic
production operations. Today, the challenge is how to use our
world-leading production and materials technologies to create a
competitive advantage in global markets based on quality rather
than price.
In areas where we do compete on price, we are restructuring the
balance between domestic and overseas production.
Specifically, we are closing down our Notogawa and Harisaki
plants and reorganizing our domestic production system as a
whole. Among our finishing plants, we are downsizing operations
at our Miai Plant. At the same time, P.T. Nikawa Textile Industry
(Nikawa Tex) and P.T. Gistex Nisshinbo Indonesia (G&N), both
based in Indonesia, are increasing production. Nisshinbo do Brasil
Industria Textil Ltda. is doing the same. Our spinning capacity is
now 370,000 spindles in Japan and 240,000 spindles overseas,
mostly in Indonesia, Brazil and China.
In November 2000, we increased our stake in Nikawa Tex from
20% to 60% by acquiring a portion of Kanematsu Corp.’s holding.
Also in November we purchased, jointly with our long-standing
partner the Cha Chi Ming Group of Hong Kong, all the shares of
Mingly Textiles (Changzhou) Ltd. through a Chinese counterparty.
At the same time, we acquired a third of the shares in Hangzhou
Yimian Limited, a member of the Cha Chi Ming Group, and now
provide it with technical assistance. Hangzhou Yimian operates
spinning processing facilities. By transferring some production of
knitted products from our Fujieda and Miai plants, we intend to
strengthen our overall production system for these products. This
will help to restore our competitiveness in this field. In September
2001, we set up a representative office in Shanghai to improve
market information communications among our production bases
in Japan, China and Indonesia, and reinforce our marketing
operations. In August 2000, we concluded a business tie-up
agreement with the Vardhman Group, a leading cotton spinning
company in India, to supply Vardhman’s cotton yarns under the
Nisshinbo brand to apparel makers in Japan and Southeast Asia. In
parallel, we will downsize domestic production of cotton yarns.
The automobile industry was one of the first industries to
globalize operations. We responded quickly by promoting
technological tie-ups and joint ventures, and shifting production
overseas. Globalization brings the responsibility of meeting global
standards. All of our domestic and overseas business offices and
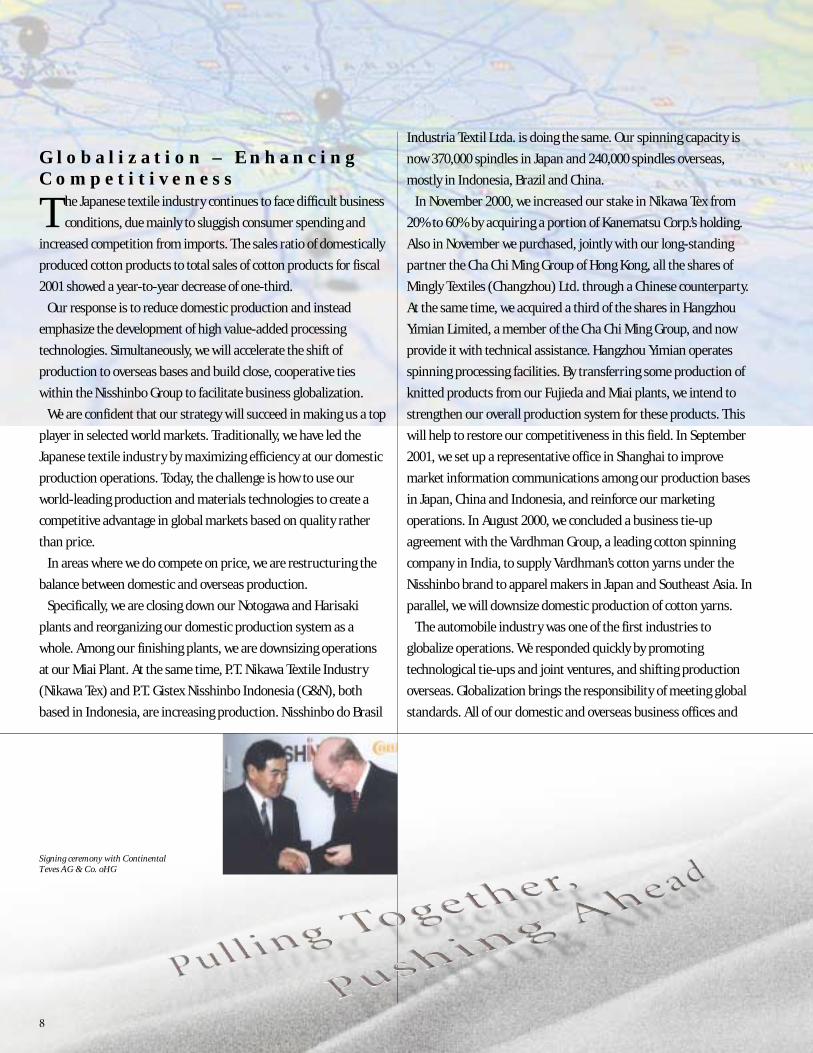
Signing ceremony with ContinentalTeves AG & Co. oHG
3.3NISSHINBO_AR2001前半(0904) 01.9.26 4:10 PM ページ 9
manufacturing operations in calendar 2002, producing our
Electronic Stability Program (ESP), that assures driving stability.
We will install ESP production facilities at our Hamakita Plant. We
forecast total sales of ¥40 billion by fiscal 2005. CTC has also
acquired Shin-Ei Industry Co., Ltd., a brake parts manufacturer,
which is a subsidiary of Mazda Motor Corporation, and its
subsidiary, Shin-Tech Co., Ltd., a manufacturer of disc brakes.
S t r a t e g y f o r C r e a t i n g S e e dB u s i n e s s e s
Comprehensive research into the development of seed
businesses with potential for growth on a global scale is a key
part of our business system reform program. We are focusing on
three areas: Electronics/IT, Energy/Ecology, and Life Sciences.
Following are examples of promising products that we have recently
developed.
In the Electronics/IT field, we have begun trial supply of an optical
filter for use in flat screens/screen displays. We plan to turn this into
a new business.
Among Energy/Ecology-related products, our recent developments
include a material for fuel cell bi-polar plates, and a solid polymer
electrolyte for secondary batteries. We now supply these products on
plants in the friction materials and automobile brakes field have
acquired QS9000 certification, the international standard for
quality management systems. In the ABS field, Hamakita Plant and
Continental Teves Corporation (CTC) aim to acquire it by July 2002.
In addition, all our domestic business offices and plants in these
fields have acquired ISO9001 certification for quality management
systems.
We established CTC, a joint venture with Continental Teves AG &
Co. oHG of Germany, one of the world’s top four brake
manufacturers, to enhance our competitiveness in a market now
dominated by just a few large global players. The two companies
have had a long-standing technological tie-up agreement relating to
disc brakes and ABS. CTC undertakes product development in the
fields of disc brakes (excluding friction materials and drum brakes)
and electronic brake systems, such as ABS, targeting mainly
Japanese and South Korean brake manufacturers. CTC will begin
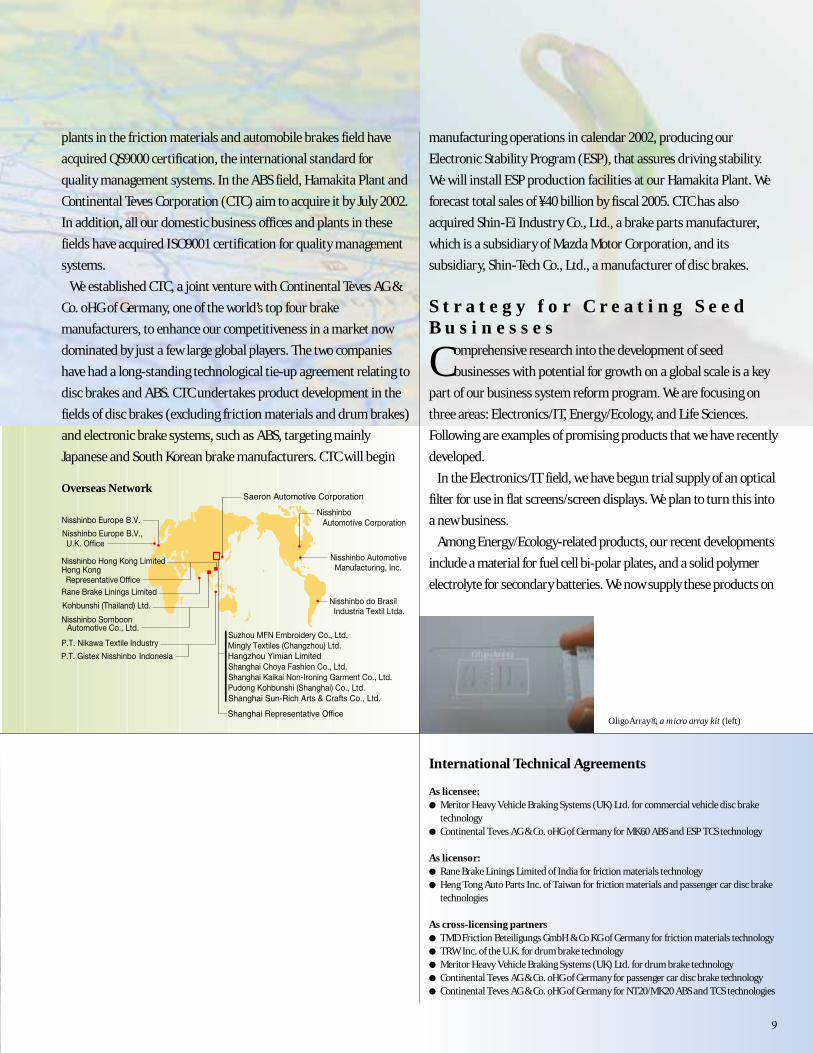
OligoArray®, a micro array kit (left)
Overseas Network
International Technical Agreements
As licensee:● Meritor Heavy Vehicle Braking Systems (UK) Ltd. for commercial vehicle disc brake
technology● Continental Teves AG & Co. oHG of Germany for MK60 ABS and ESP TCS technology
As licensor:● Rane Brake Linings Limited of India for friction materials technology● Heng Tong Auto Parts Inc. of Taiwan for friction materials and passenger car disc brake
technologies
As cross-licensing partners● TMD Friction Beteiligungs GmbH & Co KG of Germany for friction materials technology● TRW Inc. of the U.K. for drum brake technology● Meritor Heavy Vehicle Braking Systems (UK) Ltd. for drum brake technology● Continental Teves AG & Co. oHG of Germany for passenger car disc brake technology● Continental Teves AG & Co. oHG of Germany for NT20/MK20 ABS and TCS technologies
3.3NISSHINBO_AR2001前半(0904) 01.9.26 4:10 PM ページ 10
P a r t n e r s i n S y n e r g y
In addition to joint ventures and technological tie-ups, we have
various forms of business alliances that generate valuable
synergies. An example in the textiles field is the “Triangle Project,”
an alliance with Teijin Ltd. and Nippon Keori Kaisha Ltd. A number
of promising products have emerged from this project, including
ECOLOGIA uniform materials (now also used in dress shirts and
polo shirts) made from recycled PET bottles, and ECOSYS office
wear materials that offer comfort in mildly air-conditioned/heated
offices. These are good examples of groundbreaking products
resulting from combinations of the original technologies of three
companies, operating in the distinct fields of synthetic fibers, wool
and cotton.
We are also working with apparel makers to develop unique,
attractive materials matched to consumer demand. We are also
making cooperative marketing efforts to make soft denim more
fashionable.
In the non-textiles field, we are currently focusing on the
“Romance Project” in partnership with Mitsubishi Corporation,
Asahi Glass Co., Ltd., Nippon Polyurethane Industry Co., Ltd. and
Yamasan Shoji Co., Ltd. (a subsidiary of Mitsubishi Corporation).
This project is designed to make the most of the superior insulation
a trial basis. In September 2000, we established a new department
for the purpose of launching full-scale production of fuel cells by
around fiscal 2010.
In the Life Sciences field, in April 2001 we began sales of
OligoArray®, a DNA micro array kit for rapid identification of the
particular drug effective against the strain of M.tuberculosis in each
individual case. Doctors can detect the suitable drug within a day
using OligoArray®. This is our first clinical testing product.
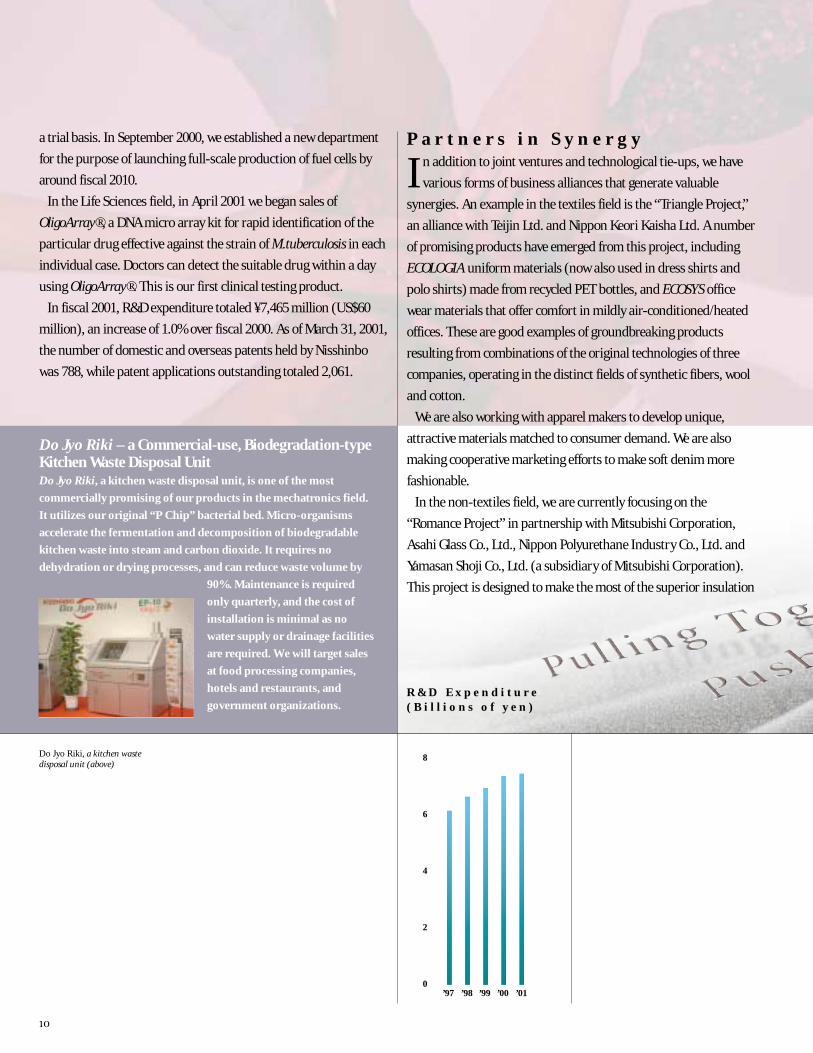
In fiscal 2001, R&D expenditure totaled ¥7,465 million (US$60
million), an increase of 1.0% over fiscal 2000. As of March 31, 2001,
the number of domestic and overseas patents held by Nisshinbo
was 788, while patent applications outstanding totaled 2,061.
Do Jyo Riki – a Commercial-use, Biodegradation-typeKitchen Waste Disposal UnitDo Jyo Riki, a kitchen waste disposal unit, is one of the most
commercially promising of our products in the mechatronics field.
It utilizes our original “P Chip” bacterial bed. Micro-organisms
accelerate the fermentation and decomposition of biodegradable
kitchen waste into steam and carbon dioxide. It requires no
dehydration or drying processes, and can reduce waste volume by
90%. Maintenance is required
only quarterly, and the cost of
installation is minimal as no
water supply or drainage facilities
are required. We will target sales
at food processing companies,
hotels and restaurants, and
government organizations.
Do Jyo Riki, a kitchen wastedisposal unit (above)
R & D E x p e n d i t u r e( B i l l i o n s o f y e n )
0
2
4
6
8
’97 ’98 ’99 ’00 ’01
3.3NISSHINBO_AR2001前半(0904) 01.9.26 4:10 PM ページ 11
Company’s head office, its Osaka branch, the Shimada Plant, and a
subsidiary, Nihon Postal Franker Co., Ltd., obtained such
certification.
By the end of fiscal 2003, we will reduce the generation of
industrial waste by 10% from fiscal 2000 levels. During the same
time frame, we will reduce the energy unit (the ratio of energy to
manufacturing cost) by 3%.
Development of environment-friendly products and products
using recycled materials is expected to make a positive contribution
to the Company’s business performance. Our environment-friendly
products include the ECOSYS lineup, hydrophilic polyurethane, and
non-fluorocarbon polyurethane foams. Respectively, these
products help conserve energy resources and avoid pollution of the
atmosphere. Other environment-friendly products include
ECOLOGIA yarns made from recycled PET bottles, EAUDOUCE
water-soluble tissue paper, OIKOS biodegradable fabrics, and
KENAF (cane) and TAKEBULKY (bamboo) papers.
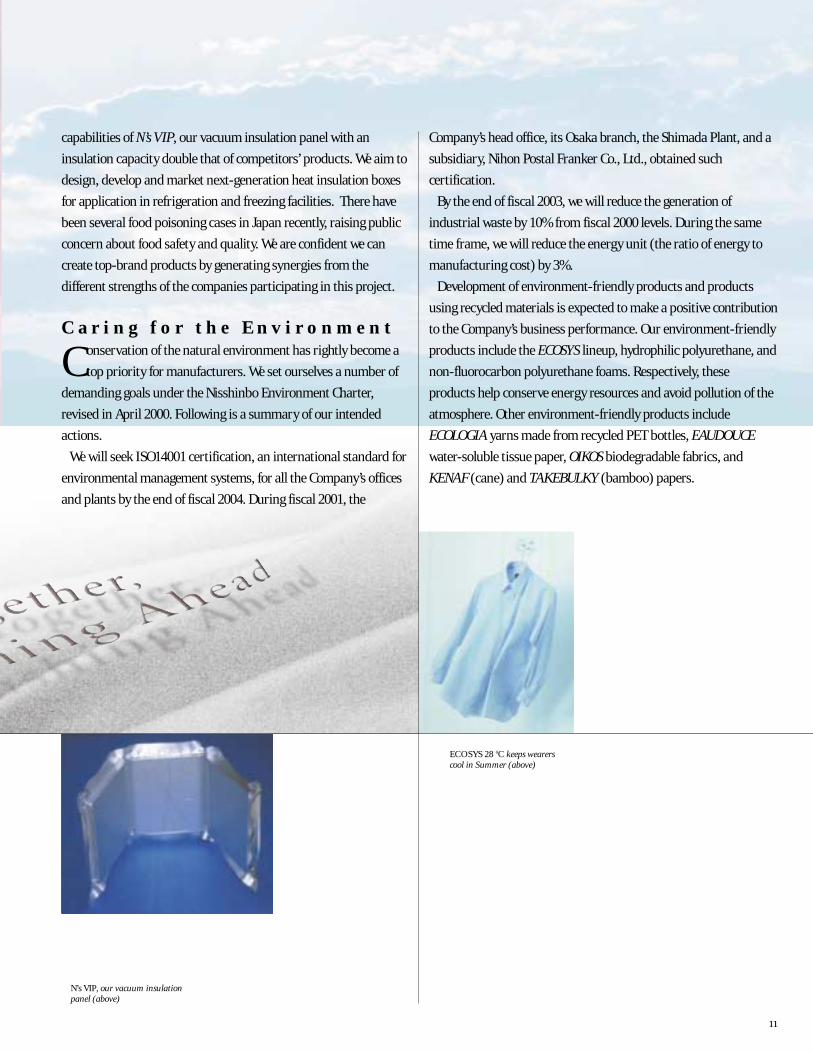
capabilities of N’s VIP, our vacuum insulation panel with an
insulation capacity double that of competitors’ products. We aim to
design, develop and market next-generation heat insulation boxes
for application in refrigeration and freezing facilities. There have
been several food poisoning cases in Japan recently, raising public
concern about food safety and quality. We are confident we can
create top-brand products by generating synergies from the
different strengths of the companies participating in this project.
C a r i n g f o r t h e E n v i r o n m e n t
Conservation of the natural environment has rightly become a
top priority for manufacturers. We set ourselves a number of
demanding goals under the Nisshinbo Environment Charter,
revised in April 2000. Following is a summary of our intended
actions.
We will seek ISO14001 certification, an international standard for
environmental management systems, for all the Company’s offices
and plants by the end of fiscal 2004. During fiscal 2001, the
N’s VIP, our vacuum insulationpanel (above)
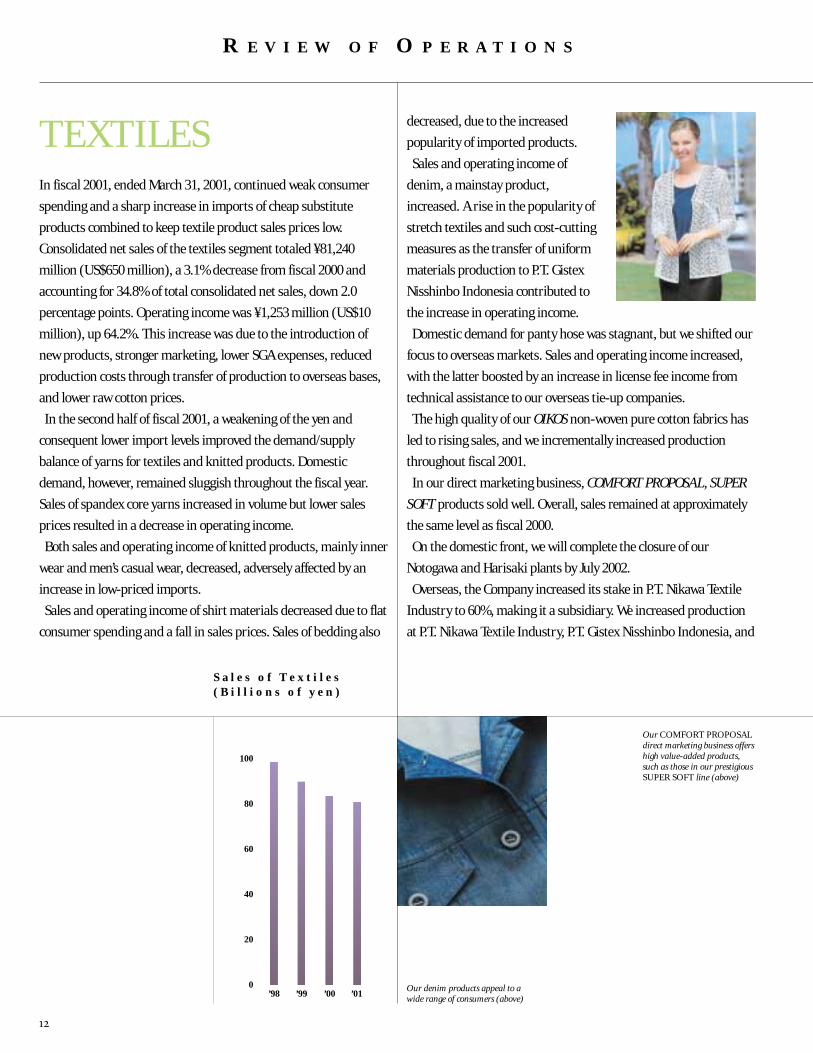
ECOSYS 28 0C keeps wearerscool in Summer (above)
3.3NISSHINBO_AR2001前半(0904) 01.9.26 4:10 PM ページ 12
TEXTILESIn fiscal 2001, ended March 31, 2001, continued weak consumer
spending and a sharp increase in imports of cheap substitute
products combined to keep textile product sales prices low.
Consolidated net sales of the textiles segment totaled ¥81,240
million (US$650 million), a 3.1% decrease from fiscal 2000 and
accounting for 34.8% of total consolidated net sales, down 2.0
percentage points. Operating income was ¥1,253 million (US$10
million), up 64.2%. This increase was due to the introduction of
new products, stronger marketing, lower SGA expenses, reduced
production costs through transfer of production to overseas bases,
and lower raw cotton prices.
In the second half of fiscal 2001, a weakening of the yen and
consequent lower import levels improved the demand/supply
balance of yarns for textiles and knitted products. Domestic
demand, however, remained sluggish throughout the fiscal year.
Sales of spandex core yarns increased in volume but lower sales
prices resulted in a decrease in operating income.
Both sales and operating income of knitted products, mainly inner
wear and men’s casual wear, decreased, adversely affected by an
increase in low-priced imports.
Sales and operating income of shirt materials decreased due to flat
consumer spending and a fall in sales prices. Sales of bedding also
decreased, due to the increased
popularity of imported products.
Sales and operating income of
denim, a mainstay product,
increased. A rise in the popularity of
stretch textiles and such cost-cutting
measures as the transfer of uniform
materials production to P.T. Gistex
Nisshinbo Indonesia contributed to
the increase in operating income.
Domestic demand for panty hose was stagnant, but we shifted our
focus to overseas markets. Sales and operating income increased,
with the latter boosted by an increase in license fee income from
technical assistance to our overseas tie-up companies.
The high quality of our OIKOS non-woven pure cotton fabrics has
led to rising sales, and we incrementally increased production
throughout fiscal 2001.
In our direct marketing business, COMFORT PROPOSAL, SUPER
SOFT products sold well. Overall, sales remained at approximately
the same level as fiscal 2000.
On the domestic front, we will complete the closure of our
Notogawa and Harisaki plants by July 2002.
Overseas, the Company increased its stake in P.T. Nikawa Textile
Industry to 60%, making it a subsidiary. We increased production
at P.T. Nikawa Textile Industry, P.T. Gistex Nisshinbo Indonesia, and
R E V I E W O F O P E R A T I O N S
Our denim products appeal to awide range of consumers (above)
Our COMFORT PROPOSALdirect marketing business offershigh value-added products,such as those in our prestigiousSUPER SOFT line (above)
S a l e s o f T e x t i l e s( B i l l i o n s o f y e n )
0
20
40
60
80
100
’98 ’99 ’01’00
3.3NISSHINBO_AR2001前半(0904) 01.9.26 4:10 PM ページ 13
Nisshinbo do Brasil Industria Textil Ltda. The Company purchased
an equity stake in Hangzhou Yimian Limited, a Chinese company,
and started to provide technical assistance with the aim of raising
productivity while maintaining quality.
In September 2000, we consolidated our product development
activities at a newly established Textile Research and Development
Center with a view to improving development efficiency and
speeding up responses to changes in customers’ needs.
NON-TEXTILESConsolidated net sales of the non-textiles segment increased 6.0%
over fiscal 2000 to ¥152,295 million (US$1,218 million), accounting
for 65.2% of total sales, up 2.0 percentage points. The increase in
sales was attributable to good performances in the automobile
brakes and other fields. Operating income increased 35.1% to
¥4,531 million (US$36 million).
A u t o m o b i l e B r a k e s
Sales of automobile brakes increased 6.6% over fiscal 2000 to
¥52,707 million (US$422 million). Operating income was ¥2,259
million (US$18 million), up 41.9%.
Although domestic passenger car sales increased, domestic
automobile production was only marginal higher owing to a
decrease in exports to the U.S. and Europe in the second half of
fiscal 2001. However, sales and operating income of friction
materials and automobile brakes increased due to steady
performances by our subsidiaries in Thailand and South Korea,
and higher sales of new products.
Sales and operating income of ABS decreased. Although ABS
usage increased overall, production of models fitted with our ABS
products declined.
In response to the increased use of modular system units in the
automobile parts industry, we established Continental Teves
Corporation (CTC), a joint venture with German automobile brake
systems manufacturer Continental Teves AG & Co. oHG, a business
partner of long standing. Through CTC, we will seek to increase
orders for electronic brake systems, including ABS, disc brakes and
actuations in the Japanese and South Korean markets. In March 2001,
CTC purchased a majority
equity stake in Shin-Ei
Industry Co., Ltd., a brake
parts manufacturer, which is a
subsidiary of Mazda Motor
Corporation, and management
rights over its subsidiary, Shin-
Tech Co., Ltd.
In May 2000, we completed
An entry at the AnnualNisshinbo Fashion Contest(below)
Our brake parts (above)
S a l e s o f A u t o m o b i l eB r a k e s( B i l l i o n s o f y e n )
0
10
20
30
40
60
50
’98 ’99 ’00 ’01
3.3NISSHINBO_AR2001前半(0904) 01.9.26 4:10 PM ページ 14
the construction of ABS
testing and production
facilities at our Chiba Plant
and launched full-scale
operations. We also
completed the transfer of
friction materials production facilities from our former Tokyo Plant
to our Tatebayashi Plant.
P a p e r s
Sales of paper products totaled ¥28,421 million (US$227 million),
up 2.8% over fiscal 2000. Operating income decreased 28.6% to
¥835 million (US$7 million) due to higher pulp prices.
Sales and operating income of household papers fell, with lower
sales prices resulting from intensified competition a contributory
factor.
In the fine papers field, sales of printing paper increased,
underpinned by higher
exports to South Korea. An
expanded product range,
through the reform of our
sales system, also boosted
sales and operating income.
Sales of fabricated products
increased due to orders from
new customers, but a large increase in development and other costs
kept operating income at approximately the fiscal 2000 level.
Sales of label printing increased due to a new large-scale order, but
related initial costs led to a decrease in operating income. In April
2001, we transferred our label printers production and sales
operations to Nihon Postal Franker Co., Ltd., a subsidiary, as part of
our business restructuring.
O t h e r P r o d u c t s
Sales of other products increased 7.1% over fiscal 2000 to ¥67,300
million (US$538 million). Operating loss decreased ¥715 million to
¥259 million (US$2 million).
● Machine Tools
Despite weak capital investment in plant and equipment in Japan
and the U.S., sales of machine tools increased and operating loss
decreased.
We increased domestic sales by lowering sales prices of certain
product lines and winning new OEM orders. The increase in
operating income was supported by inventory adjustment, reduced
Our ABS is fitted in the HondaFIT (Above, upper: © HondaMotor Co., Ltd.)Nisshinbo is a comprehensivesupplier of synthetic paperproducts (above, lower)
R E V I E W O F O P E R A T I O N S
S a l e s o f P a p e r s( B i l l i o n s o f y e n )
0
10
20
30
’98 ’99 ’00 ’01
S a l e s o f O t h e r P r o d u c t s( B i l l i o n s o f y e n )
0
20
40
60
80
’98 ’99 ’00 ’01
CNC Turret punch press HIQ-1250 (above)
3.3NISSHINBO_AR2001前半(0904) 01.9.26 4:10 PM ページ 15
SGA expenses, and improvements to our distribution system.
Overseas sales, mainly in the U.S., decreased.
We took steps during fiscal 2001 to strengthen R&D relating to
new business areas, including solar power generation systems.
● Chemical Products
Sales and operating income of chemical products increased, due to
expanded applications in new fields and continued good
performances by overseas subsidiaries. Sales of polyurethane
foams increased, due to extended applications of N’s VIP, a vacuum
heat insulation panel, and good sales of sheets for use in railway
cars. Flat sales to the construction and plant engineering
industries, our major clients. As a result, operating income
increased only slightly.
Sales and operating income of polyurethane elastomers increased.
Despite a slowdown in the second half of fiscal 2001, sales and
operating income of carbon products increased, supported by
generally favorable business
conditions in the
semiconductor industry. We
completed the transfer of
production and development
operations from our former
Tokyo Plant to our Kawagoe
Plant.
● Others
Sales of electronic
communications
equipment
increased, due to
strong demand in the cellular phone and personal computer fields.
However, lower sales prices led to a decrease in operating income.
Meanwhile, we maintained our leadership in the domestic CCM
market with the CHOSHOKU SENKA series. To exploit this, we will
promote joint marketing projects with clients. We are also making
efforts to penetrate overseas markets, beginning in Thailand.
R e a l E s t a t e
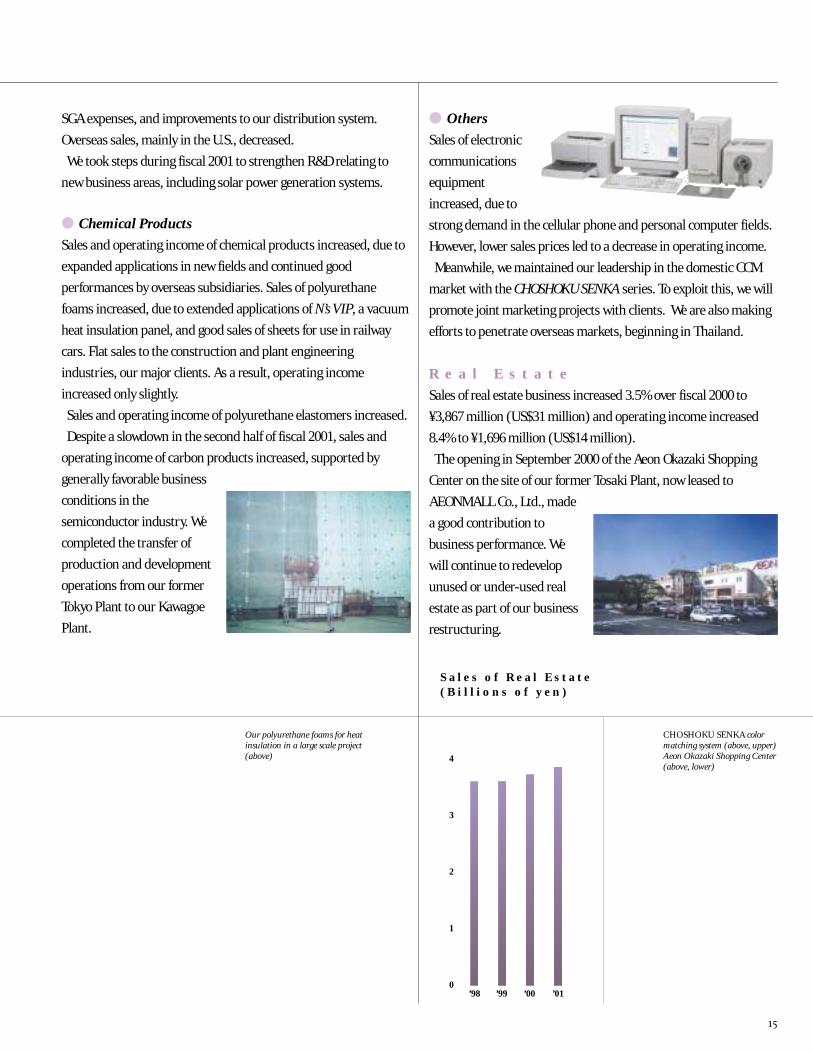
Sales of real estate business increased 3.5% over fiscal 2000 to
¥3,867 million (US$31 million) and operating income increased
8.4% to ¥1,696 million (US$14 million).
The opening in September 2000 of the Aeon Okazaki Shopping
Center on the site of our former Tosaki Plant, now leased to
AEONMALL Co., Ltd., made
a good contribution to
business performance. We
will continue to redevelop
unused or under-used real
estate as part of our business
restructuring.
Our polyurethane foams for heatinsulation in a large scale project(above)
CHOSHOKU SENKA colormatching system (above, upper)Aeon Okazaki Shopping Center(above, lower)
S a l e s o f R e a l E s t a t e( B i l l i o n s o f y e n )
0
1
2
3
4
’98 ’99 ’00 ’01
3.3NISSHINBO_AR2001前半(0904) 01.9.26 4:10 PM ページ 16
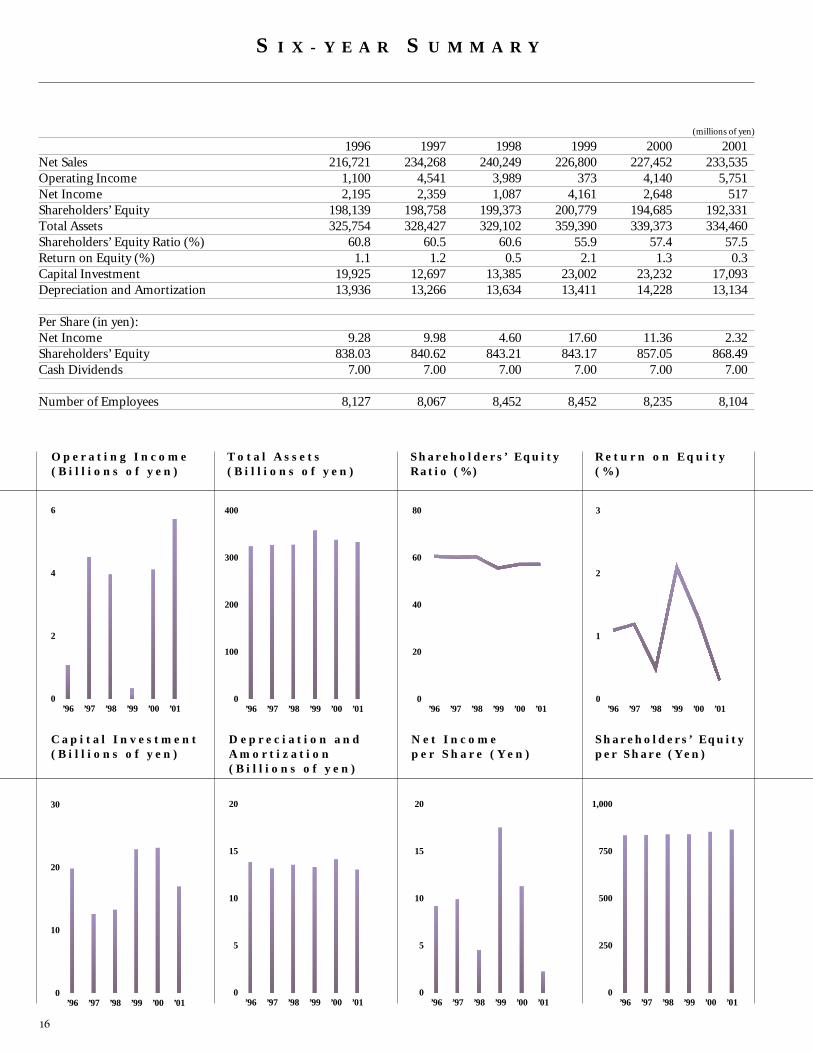
(millions of yen)
1996 1997 1998 1999 2000 2001Net Sales 216,721 234,268 240,249 226,800 227,452 233,535Operating Income 1,100 4,541 3,989 373 4,140 5,751Net Income 2,195 2,359 1,087 4,161 2,648 517Shareholders’ Equity 198,139 198,758 199,373 200,779 194,685 192,331Total Assets 325,754 328,427 329,102 359,390 339,373 334,460Shareholders’ Equity Ratio (%) 60.8 60.5 60.6 55.9 57.4 57.5Return on Equity (%) 1.1 1.2 0.5 2.1 1.3 0.3Capital Investment 19,925 12,697 13,385 23,002 23,232 17,093Depreciation and Amortization 13,936 13,266 13,634 13,411 14,228 13,134
Per Share (in yen):Net Income 9.28 9.98 4.60 17.60 11.36 2.32Shareholders’ Equity 838.03 840.62 843.21 843.17 857.05 868.49Cash Dividends 7.00 7.00 7.00 7.00 7.00 7.00
Number of Employees 8,127 8,067 8,452 8,452 8,235 8,104
S I X - Y E A R S U M M A R Y
0
2
4
6
’01’00’99’98’97’96
O p e r a t i n g I n c o m e( B i l l i o n s o f y e n )
T o t a l A s s e t s( B i l l i o n s o f y e n )
S h a r e h o l d e r s ’ E q u i t yR a t i o ( % )
R e t u r n o n E q u i t y ( % )
C a p i t a l I n v e s t m e n t( B i l l i o n s o f y e n )
D e p r e c i a t i o n a n dA m o r t i z a t i o n( B i l l i o n s o f y e n )
N e t I n c o m e p e r S h a r e ( Y e n )
S h a r e h o l d e r s ’ E q u i t yp e r S h a r e ( Y e n )
0
100
200
300
400
’01’00’99’98’97’960
20
40
60
80
’01’00’99’98’97’960
1
2
3
’01’00’99’98’97’96
0
10
20
30
’01’00’99’98’97’960
5
10
15
20
’01’00’99’98’97’960
5
10
15
20
’01’00’99’98’97’960
250
500
750
1,000
’01’00’99’98’97’96
3.3NISSHINBO_AR2001後半(0904) 01.9.26 4:28 PM ページ 1
O p e r a t i n g R e s u l t s
On a consolidated basis, net sales for fiscal 2001, ended March 31 2001,
totaled ¥233,535 million (US$1,868 million), an increase of 2.7% over
fiscal 2000.
In the Textile Segment, continued weak consumer spending and a sharp
increase in cheap substitute imports combined to keep product sales
prices low, resulting in a 3.1% decrease in net sales from fiscal 2000 to
¥81,240 million (US$650 million). However, operating income improved
due to lower raw cotton prices and successful efforts to reduce operating
costs. The share of textile sales to total sales was 34.8%, down 2.0
percentage points from fiscal 2000. In the Non-Textile Segment, there
were differences in the sales results of different product categories, but
good performances in automobile brakes resulted in a 6.0% year-on-year
increase in net sales to ¥152,295 million (US$1,218 million). The share of
non-textile sales to total sales was 65.2%, up 2.0 percentage points over
fiscal 2000*.
While cost of sales increased 1.7% to ¥200,721 million (US$1,606 mil-
lion), the ratio of cost of sales to net sales decreased 0.9 percentage points
to 85.9%. Selling, general and administrative expenses increased 4.5% to
¥27,063 million (US$217 million). Costs and expenses amounted to
¥227,784 million (US$1,822 million), up 2%. As a result, operating
income increased 38.9% to ¥5,751 million (US$46 million).
Gain on sale of securities decreased ¥4,274 million to ¥1,870 million
(US$15 million). The adoption of a new accounting standard for
employees’ benefits led to a transitional obligation of ¥16,049 million
(US$128 million) for retirement benefits, while gain on securities con-
tributed to a retirement benefit trust totaled ¥12,642 million (US$101
million). Following the closedown of the Notogawa and Harisaki plants,
retirement benefits of ¥1,276 million (US$10 million) were paid under
the early retirement scheme. As a result, other expenses totaled ¥4,456
million (US$36 million), compared with other income of ¥1,271 million
for fiscal 2000, and income before income taxes and minority interests
decreased 76.1% to ¥1,295 million (US$10 million). After deducting
income taxes of ¥894 million (US$7 million) and adding minority inter-
ests in net income of ¥116 million (US$1 million), net income for fiscal
2001 totaled ¥517 million (US$4 million), down 80.5% from fiscal 2000.
Net income per share was down ¥9.04 to ¥2.32 (US$0.02), while ROE
decreased 1.0 percentage point to 0.3%.
Despite the decrease in net income, the total dividend per share for
fiscal 2001 was maintained at ¥7.00 (US$0.06). Cash dividends totaled
¥1,570 million (US$13 million). Taking a long-term point of view,
Nisshinbo will continue to follow its basic policy of maintaining
dividends at a steady level.
* For details of divisional results, see “Review of Operations.”
F I N A N C I A L R E V I E W
F i n a n c i a l P o s i t i o n
Total assets stood at ¥334,460 million (US$2,676 million), down 1.4%
from fiscal 2000. Current assets decreased 6.4% to ¥144,542 million
(US$1,156 million), due to a large decrease in cash and cash equivalents.
An additional factor was assignment of marketable securities from cur-
rent assets to investments and other assets. Increases in notes receivable,
trade, and receivables from unconsolidated subsidiaries and affiliates
were insufficient to compensate. Property, plant and equipment
increased 2.5% to ¥108,841 million (US$871 million), while investments
and other assets increased 3.0% to ¥81,077 million (US$649 million).
Although short-term bank loans, current portion of long-term debt and
accrued income taxes decreased, an increase in payables to unconsoli-
dated subsidiaries and affiliates led to an increase in total current
liabilities to ¥91,897 million (US$735 million), up 0.7% over fiscal 2000.
Despite an increase in long-term debt, long-term liabilities decreased
6.6% to ¥47,039 million (US$376 million), due mainly to a decrease
in other long-term liabilities arising from the method used to account for
the proceeds from the sale of the land of the Tokyo Plant. Total
current and long-term liabilities amounted to ¥138,936 million
(US$1,111 million), down 1.9% from fiscal 2000.
In fiscal 2001, the Company repurchased a total of 5.7 million of its
shares for an amount of ¥2,914 million (US$23 million) and cancelled
them. Shareholders’ equity decreased 1.2% to ¥192,331 million (US$1,539
million). Shareholders’ equity ratio increased 0.1 percentage point to
57.5% and shareholders’ equity per share increased ¥11.44 to ¥868.49
(US$6.95).
C a s h F l o w s
Net cash provided by operating activities decreased ¥2,715 million to
¥8,268 million (US$66 million). This was due mainly to a decrease in
income before income taxes and minority interests, an increase in
income taxes-paid and an increase in payment of accrued pension and
severance benefits.
Net cash used in investing activities increased ¥7,237 million to ¥17,553
million (US$140 million). This was despite a decrease in payment
for purchase of property, plant and equipment, and was attributable
mainly to a decrease in proceeds from sale of investment securities and
investments in and advances to unconsolidated subsidiaries and
affiliates.
Net cash used in financing activities decreased ¥2,453 million to ¥6,343
million (US$51 million). This was due mainly to decreases in repayment
of long-term debt and a decrease in payment for purchase of treasury
stock.
As a result of the above, cash and cash equivalents at end of year
decreased ¥15,441 million to ¥17,724 million (US$142 million).
3.3NISSHINBO_AR2001後半(0904) 01.9.26 4:28 PM ページ 2
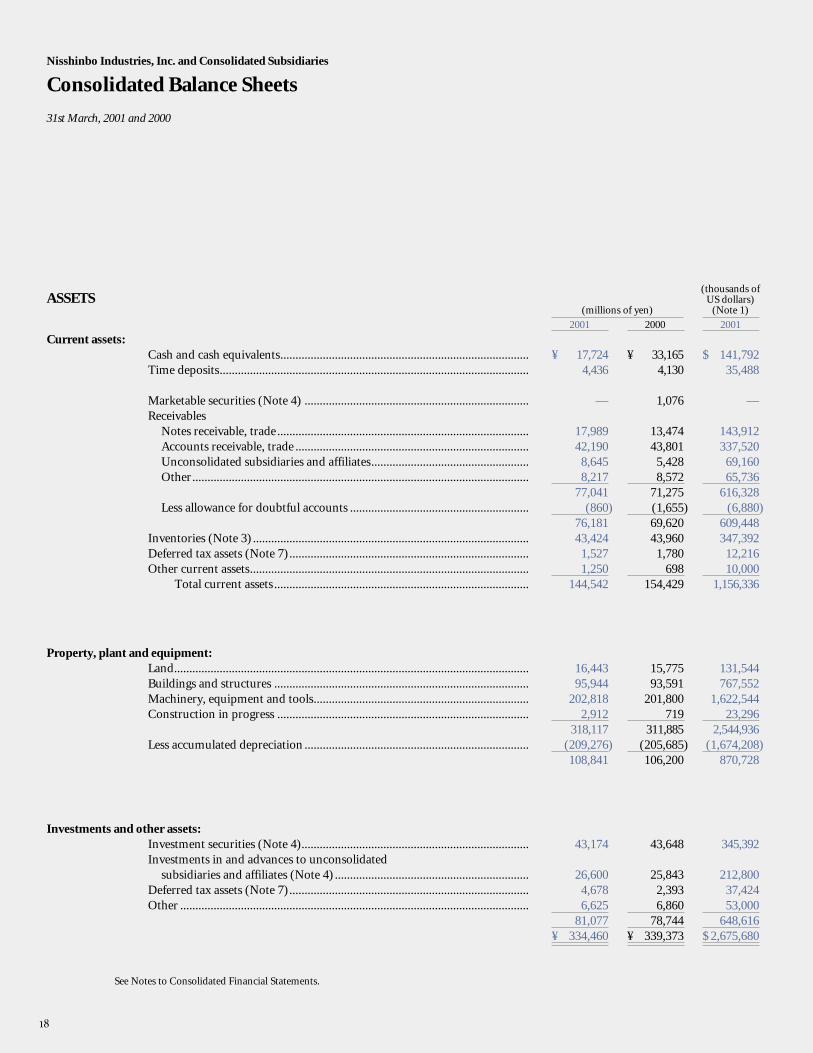
Nisshinbo Industries, Inc. and Consolidated Subsidiaries
Consolidated Balance Sheets
31st March, 2001 and 2000
(thousands ofASSETS US dollars)
(millions of yen) (Note 1)
2001 2000 2001
Current assets:Cash and cash equivalents..................................................................................Time deposits......................................................................................................
Marketable securities (Note 4) ..........................................................................Receivables
Notes receivable, trade...................................................................................Accounts receivable, trade .............................................................................Unconsolidated subsidiaries and affiliates....................................................Other...............................................................................................................
Less allowance for doubtful accounts ...........................................................
Inventories (Note 3)...........................................................................................Deferred tax assets (Note 7)...............................................................................Other current assets............................................................................................
Total current assets ....................................................................................
Property, plant and equipment:Land.....................................................................................................................Buildings and structures ....................................................................................Machinery, equipment and tools.......................................................................Construction in progress ...................................................................................
Less accumulated depreciation ..........................................................................
Investments and other assets:Investment securities (Note 4)...........................................................................Investments in and advances to unconsolidated
subsidiaries and affiliates (Note 4)................................................................Deferred tax assets (Note 7)...............................................................................Other ...................................................................................................................
See Notes to Consolidated Financial Statements.
¥ 33,1654,130
1,076
13,47443,801
5,4288,572
71,275(1,655)69,62043,960
1,780698
154,429
15,77593,591
201,800719
311,885(205,685)106,200
43,648
25,8432,3936,860
78,744¥ 339,373
¥ 17,7244,436
—
17,98942,190
8,6458,217
77,041(860)
76,18143,424
1,5271,250
144,542
16,44395,944
202,8182,912
318,117(209,276)108,841
43,174
26,6004,6786,625
81,077¥ 334,460
$ 141,79235,488
—
143,912337,520
69,16065,736
616,328(6,880)
609,448347,392
12,21610,000
1,156,336
131,544767,552
1,622,54423,296
2,544,936(1,674,208)
870,728
345,392
212,80037,42453,000
648,616$ 2,675,680
3.3NISSHINBO_AR2001後半(0904) 01.9.26 4:28 PM ページ 18
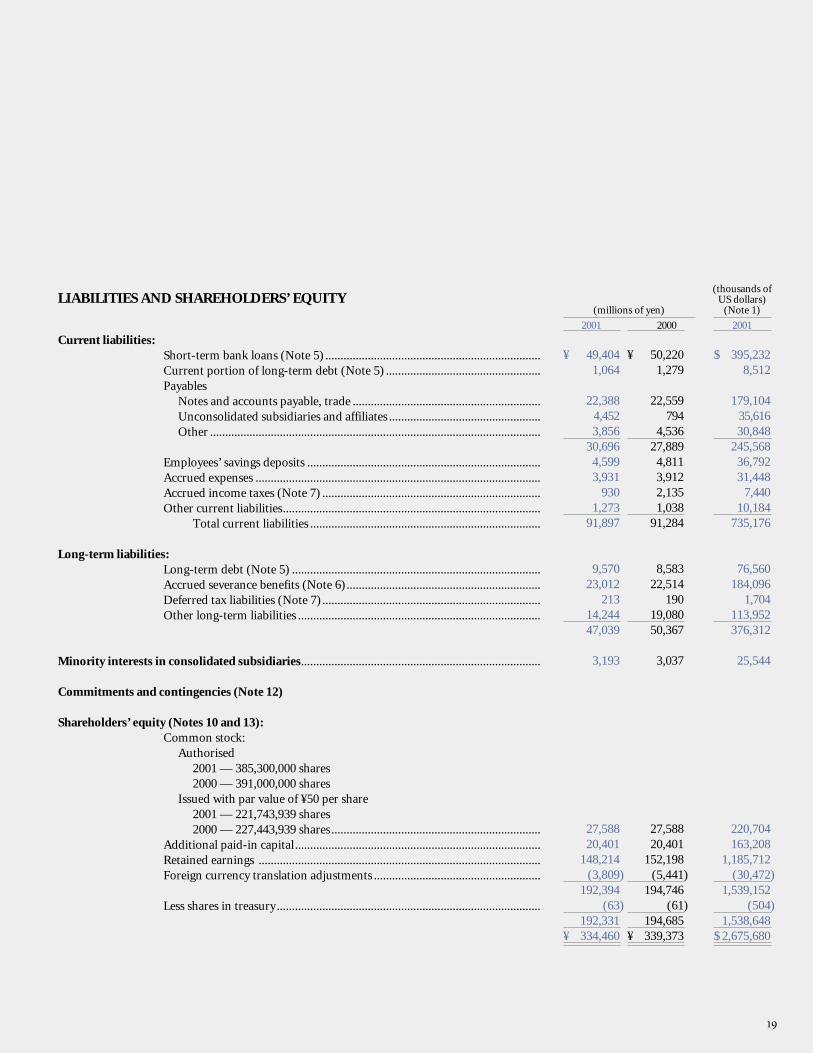
(thousands ofLIABILITIES AND SHAREHOLDERS’ EQUITY US dollars)
(millions of yen) (Note 1)
2001 2000 2001
Current liabilities:Short-term bank loans (Note 5) .......................................................................Current portion of long-term debt (Note 5) ...................................................Payables
Notes and accounts payable, trade ..............................................................Unconsolidated subsidiaries and affiliates ..................................................Other .............................................................................................................
Employees’ savings deposits .............................................................................Accrued expenses ..............................................................................................Accrued income taxes (Note 7) ........................................................................Other current liabilities.....................................................................................
Total current liabilities ............................................................................
Long-term liabilities:Long-term debt (Note 5) ..................................................................................Accrued severance benefits (Note 6)................................................................Deferred tax liabilities (Note 7)........................................................................Other long-term liabilities ................................................................................
Minority interests in consolidated subsidiaries...............................................................................
Commitments and contingencies (Note 12)
Shareholders’ equity (Notes 10 and 13):Common stock:
Authorised2001 — 385,300,000 shares2000 — 391,000,000 shares
Issued with par value of ¥50 per share2001 — 221,743,939 shares2000 — 227,443,939 shares.....................................................................
Additional paid-in capital.................................................................................Retained earnings .............................................................................................Foreign currency translation adjustments .......................................................
Less shares in treasury.......................................................................................
¥ 50,2201,279
22,559794
4,53627,889
4,8113,9122,1351,038
91,284
8,58322,514
19019,08050,367
3,037
27,58820,401
152,198(5,441)
194,746(61)
194,685¥ 339,373
¥ 49,4041,064
22,3884,4523,856
30,6964,5993,931
9301,273
91,897
9,57023,012
21314,24447,039
3,193
27,58820,401
148,214(3,809)
192,394(63)
192,331¥ 334,460
$ 395,2328,512
179,10435,61630,848
245,56836,79231,448
7,44010,184
735,176
76,560184,096
1,704113,952376,312
25,544
220,704163,208
1,185,712(30,472)
1,539,152(504)
1,538,648$ 2,675,680
3.3NISSHINBO_AR2001後半(0904) 01.9.26 4:28 PM ページ 19
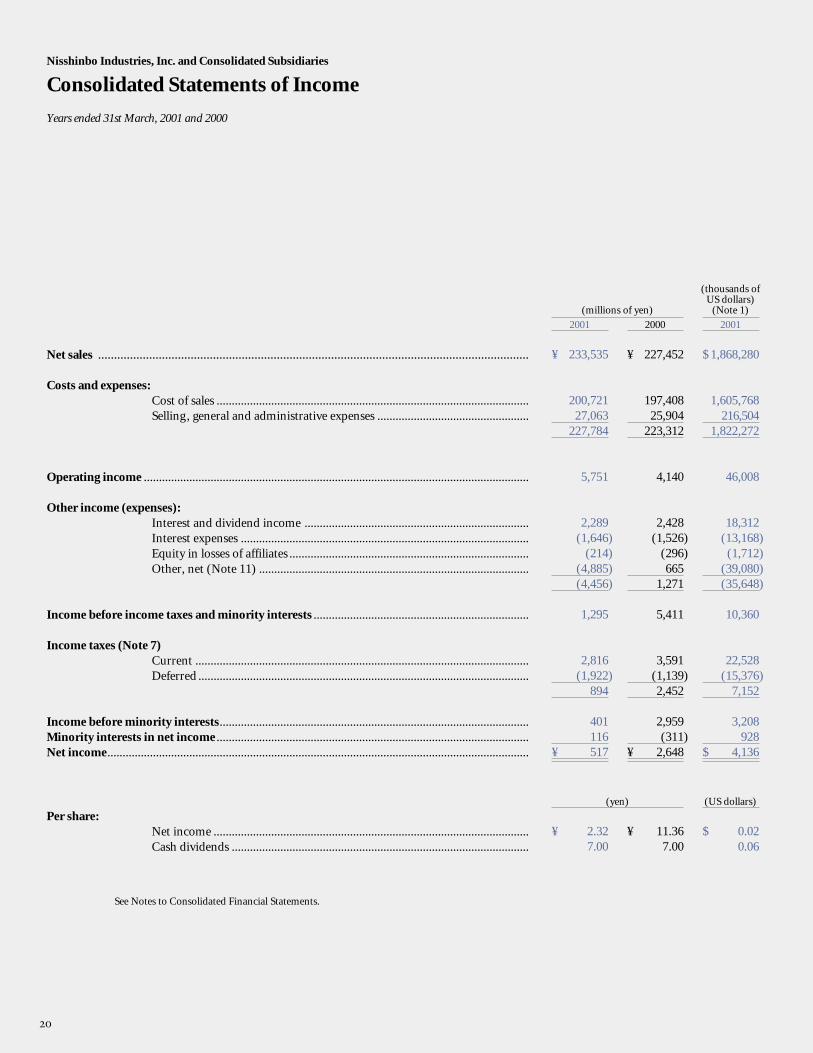
Nisshinbo Industries, Inc. and Consolidated Subsidiaries
Consolidated Statements of Income
Years ended 31st March, 2001 and 2000
(thousands ofUS dollars)
(millions of yen) (Note 1)
2001 2000 2001
Net sales .......................................................................................................................................
Costs and expenses:Cost of sales .......................................................................................................Selling, general and administrative expenses ..................................................
Operating income ...............................................................................................................................
Other income (expenses):Interest and dividend income ..........................................................................Interest expenses ...............................................................................................Equity in losses of affiliates ...............................................................................Other, net (Note 11) .........................................................................................
Income before income taxes and minority interests .......................................................................
Income taxes (Note 7)Current ..............................................................................................................Deferred .............................................................................................................
Income before minority interests......................................................................................................Minority interests in net income .......................................................................................................Net income...........................................................................................................................................
(yen) (US dollars)
Per share:Net income ........................................................................................................Cash dividends ..................................................................................................
See Notes to Consolidated Financial Statements.
¥ 227,452
197,40825,904
223,312
4,140
2,428(1,526)
(296)665
1,271
5,411
3,591(1,139)2,452
2,959(311)
¥ 2,648
¥ 11.367.00
¥ 233,535
200,72127,063
227,784
5,751
2,289(1,646)
(214)(4,885)(4,456)
1,295
2,816(1,922)
894
401116
¥ 517
¥ 2.327.00
$ 1,868,280
1,605,768216,504
1,822,272
46,008
18,312(13,168)
(1,712)(39,080)(35,648)
10,360
22,528(15,376)
7,152
3,208928
$ 4,136
$ 0.020.06
3.3NISSHINBO_AR2001後半(0904) 01.9.26 4:28 PM ページ 20
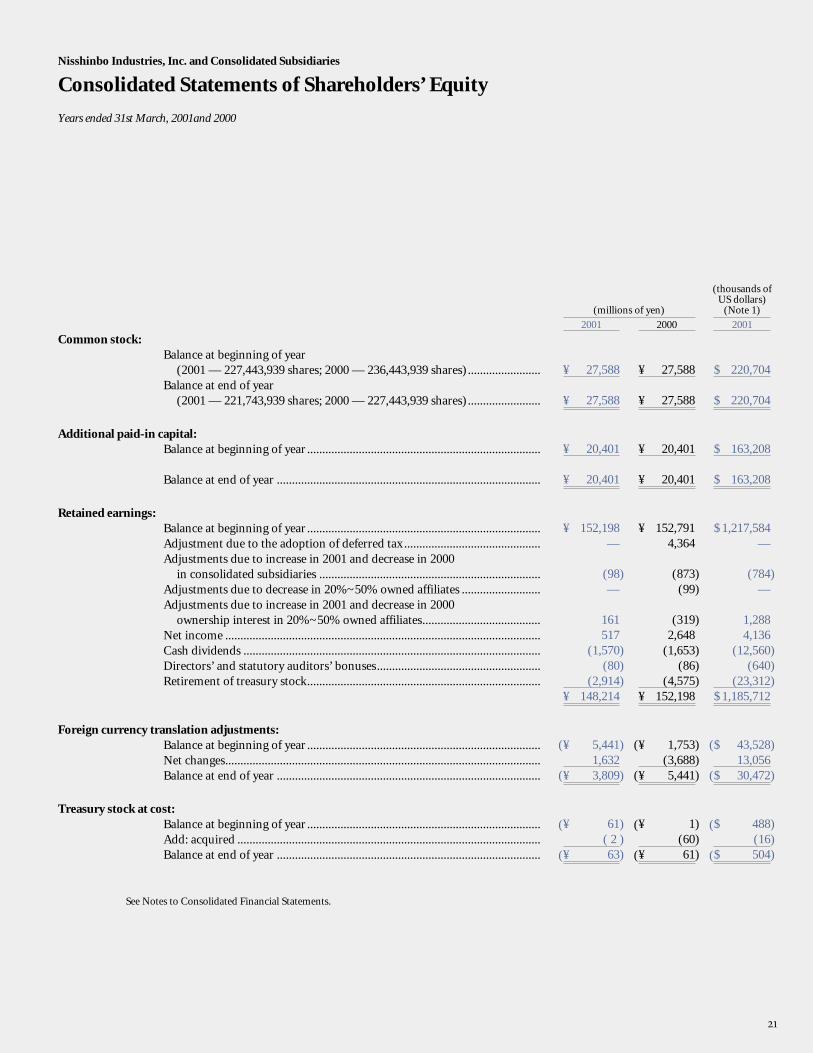
Nisshinbo Industries, Inc. and Consolidated Subsidiaries
Consolidated Statements of Shareholders’ Equity
Years ended 31st March, 2001and 2000
(thousands ofUS dollars)
(millions of yen) (Note 1)
2001 2000 2001
Common stock:Balance at beginning of year
(2001 — 227,443,939 shares; 2000 — 236,443,939 shares)........................Balance at end of year
(2001 — 221,743,939 shares; 2000 — 227,443,939 shares)........................
Additional paid-in capital:Balance at beginning of year .............................................................................
Balance at end of year .......................................................................................
Retained earnings:Balance at beginning of year .............................................................................Adjustment due to the adoption of deferred tax .............................................Adjustments due to increase in 2001 and decrease in 2000
in consolidated subsidiaries .........................................................................Adjustments due to decrease in 20%~50% owned affiliates ..........................Adjustments due to increase in 2001 and decrease in 2000
ownership interest in 20%~50% owned affiliates.......................................Net income ........................................................................................................Cash dividends ..................................................................................................Directors’ and statutory auditors’ bonuses......................................................Retirement of treasury stock.............................................................................
Foreign currency translation adjustments:Balance at beginning of year .............................................................................Net changes........................................................................................................Balance at end of year .......................................................................................
Treasury stock at cost:Balance at beginning of year .............................................................................Add: acquired ....................................................................................................Balance at end of year .......................................................................................
See Notes to Consolidated Financial Statements.
¥ 27,588
¥ 27,588
¥ 20,401
¥ 20,401
¥ 152,7914,364
(873)(99)
(319)2,648
(1,653)(86)
(4,575)¥ 152,198
¥ 1,753)(3,688)
¥ 5,441)
¥ 1)(60)
¥ 61)
(
(
(
(
(
(
(
(
(
(
(
(
¥ 27,588
¥ 27,588
¥ 20,401
¥ 20,401
¥ 152,198—
(98)—
161517
(1,570)(80)
(2,914)¥ 148,214
¥ 5,441)1,632
¥ 3,809)
¥ 61)( 2 )
¥ 63)
$ 220,704
$ 220,704
$ 163,208
$ 163,208
$ 1,217,584—
(784)—
1,2884,136
(12,560)(640)
(23,312)$ 1,185,712
$ 43,528)13,056
$ 30,472)
$ 488)(16)
$ 504)
3.3NISSHINBO_AR2001後半(0904) 01.9.26 4:28 PM ページ 21
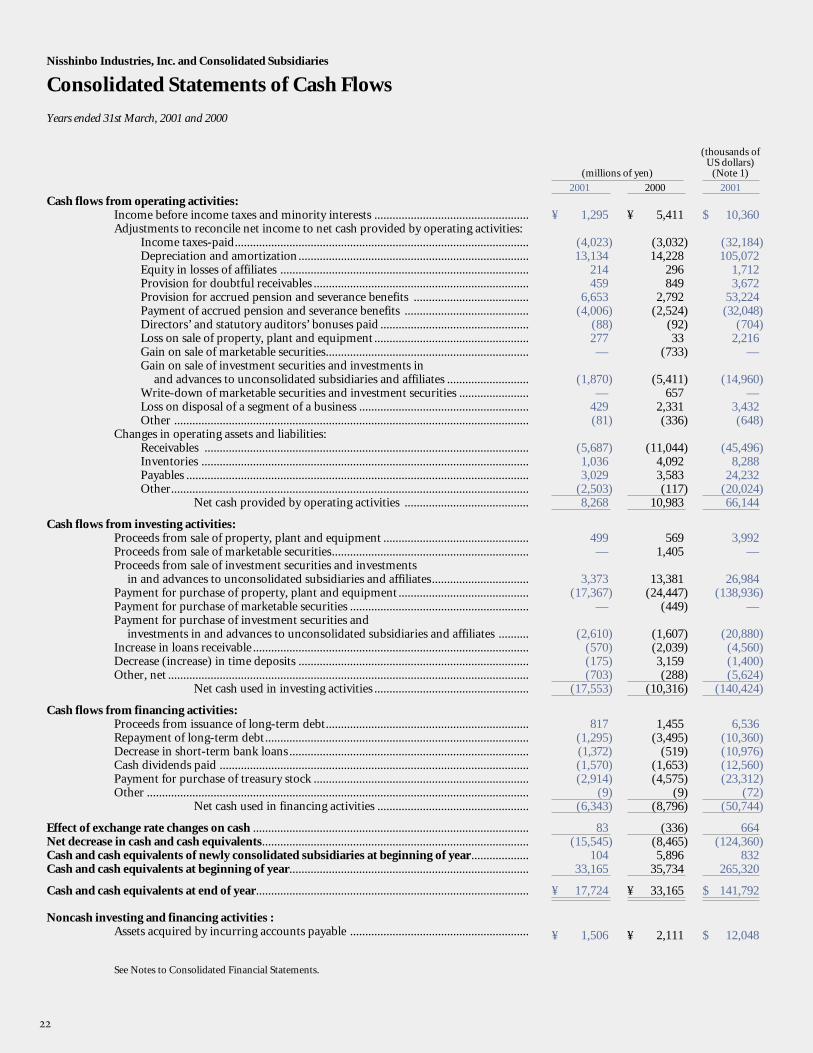
Nisshinbo Industries, Inc. and Consolidated Subsidiaries
Consolidated Statements of Cash Flows
Years ended 31st March, 2001 and 2000
(thousands ofUS dollars)
(millions of yen) (Note 1)
2001 2000 2001Cash flows from operating activities:
Income before income taxes and minority interests ...................................................Adjustments to reconcile net income to net cash provided by operating activities:
Income taxes-paid.................................................................................................Depreciation and amortization............................................................................Equity in losses of affiliates ..................................................................................Provision for doubtful receivables .......................................................................Provision for accrued pension and severance benefits ......................................Payment of accrued pension and severance benefits .........................................Directors’ and statutory auditors’ bonuses paid .................................................Loss on sale of property, plant and equipment ...................................................Gain on sale of marketable securities...................................................................Gain on sale of investment securities and investments in
and advances to unconsolidated subsidiaries and affiliates ...........................Write-down of marketable securities and investment securities .......................Loss on disposal of a segment of a business ........................................................Other .....................................................................................................................
Changes in operating assets and liabilities:Receivables ...........................................................................................................Inventories ............................................................................................................Payables .................................................................................................................Other......................................................................................................................
Net cash provided by operating activities .........................................
Cash flows from investing activities:Proceeds from sale of property, plant and equipment ................................................Proceeds from sale of marketable securities.................................................................Proceeds from sale of investment securities and investments
in and advances to unconsolidated subsidiaries and affiliates................................Payment for purchase of property, plant and equipment ...........................................Payment for purchase of marketable securities ...........................................................Payment for purchase of investment securities and
investments in and advances to unconsolidated subsidiaries and affiliates ..........Increase in loans receivable ...........................................................................................Decrease (increase) in time deposits ............................................................................Other, net .......................................................................................................................
Net cash used in investing activities ...................................................
Cash flows from financing activities:Proceeds from issuance of long-term debt...................................................................Repayment of long-term debt.......................................................................................Decrease in short-term bank loans ...............................................................................Cash dividends paid ......................................................................................................Payment for purchase of treasury stock .......................................................................Other ..............................................................................................................................
Net cash used in financing activities ..................................................
Effect of exchange rate changes on cash ...........................................................................................Net decrease in cash and cash equivalents........................................................................................Cash and cash equivalents of newly consolidated subsidiaries at beginning of year...................Cash and cash equivalents at beginning of year...............................................................................
Cash and cash equivalents at end of year..........................................................................................
Noncash investing and financing activities : Assets acquired by incurring accounts payable ...........................................................
See Notes to Consolidated Financial Statements.
¥ 1,295
(4,023)13,134
214459
6,653(4,006)
(88)277—
(1,870)—
429(81)
(5,687)1,0363,029
(2,503)8,268
499—
3,373(17,367)
—
(2,610)(570)(175)(703)
(17,553)
817(1,295)(1,372)(1,570)(2,914)
(9)(6,343)
83(15,545)
10433,165
¥ 17,724
¥ 1,506
$ 10,360
(32,184)105,072
1,7123,672
53,224(32,048)
(704)2,216
—
(14,960)—
3,432(648)
(45,496)8,288
24,232(20,024)66,144
3,992—
26,984(138,936)
—
(20,880)(4,560)(1,400)(5,624)
(140,424)
6,536(10,360)(10,976)(12,560)(23,312)
(72)(50,744)
664(124,360)
832265,320
$ 141,792
$ 12,048
¥ 5,411
(3,032)14,228
296849
2,792(2,524)
(92)33
(733)
(5,411)657
2,331(336)
(11,044)4,0923,583(117)
10,983
5691,405
13,381(24,447)
(449)
(1,607)(2,039)3,159(288)
(10,316)
1,455(3,495)
(519)(1,653)(4,575)
(9)(8,796)
(336)(8,465)5,896
35,734
¥ 33,165
¥ 2,111
3.3NISSHINBO_AR2001後半(0904) 01.9.26 4:28 PM ページ 22
1. BASIS OF PRESENTING FINANCIAL STATEMENTS:
The accompanying consolidated financial statements have been prepared in accordance with the provisions set forth in the JapaneseSecurities and Exchange Law and its related accounting regulations, and in conformity with accounting principles and practices gen-erally accepted in Japan, which are different in certain respects as to application and disclosure requirements of International AccountingStandards. The consolidated financial statements are not intended to present the financial position, results of operations and cashflows in accordance with accounting principles and practices generally accepted in countries and jurisdictions other than Japan.
In addition, the accompanying footnotes include information which is not required under generally accepted accounting prin-ciples and practices in Japan but is presented herein as additional information.
The United States dollar ($) amounts included herein are given solely for convenience and are stated, as a matter of arithmeticalcomputation only, at the rate of ¥125 = $1, the approximate exchange rate at 31st March, 2001. The translations should not be construed as representations that the Japanese yen amounts have been, could have been, or could in the future be, converted intoUnited States dollars.
2. SUMMARY OF SIGNIFICANT ACCOUNTING POLICIES:
(a) ConsolidationThe consolidated financial statements include the accounts of Nisshinbo Industries, Inc. (the “Company”) and its significant
subsidiaries (together, the “Group”).Under the control or influence concept, those companies in which the Parent, directly or indirectly, is able to exercise control
over operations are fully consolidated, and those companies over which the Group has the ability to exercise significant influenceare accounted for by the equity method.
Investments in unconsolidated subsidiaries and associated companies are accounted for by the equity method.Investments in the remaining unconsolidated subsidiaries and associated companies are stated at cost. If the equity method of
accounting had been applied to the investments in these companies, the effect on the accompanying consolidated financial statements would not be material.
All significant intercompany balances and transactions have been eliminated in consolidation. All material unrealized profit includedin assets resulting from transactions within the Group is eliminated.(b) Foreign currency transactions
Short-term receivables and payables in foreign currencies are translated into Japanese yen at the current exchange rates as of thebalance sheet dates.
Investments in and advances to unconsolidated subsidiaries and affiliates in foreign currencies are translated at the historical rateseffective at the dates of transaction from which such accounts were originated.(c) Foreign currency financial statements
The balance sheet accounts, revenue and expense accounts of the consolidated foreign subsidiaries are translated into Japaneseyen at the current exchange rate as of the balance sheet date except for shareholders’ equity, which is translated at the historical rate.(d) Cash equivalents
Cash equivalents include time deposits which mature or become due within six months of the date of acquisition.(e) Marketable and investment securities
Prior to 1st April, 2000, current and non-current marketable securities were stated at the lower of cost or market. Effective 1st April, 2000, the Group adopted a new accounting standard for financial instruments. Under this standard, all securities are classified as available-for-sale securities and are stated at cost.(f) Inventories
Inventories are stated principally at the lower of cost or market, cost being substantially determined by the average cost method.(g) Property, plant and equipment
Property, plant and equipment is stated at cost. Depreciation is computed principally on the declining balance method over theirestimated useful lives.(h) Retirement and pension plans
Under the employees’ retirement plans for the Company and certain consolidated subsidiaries, prior to 1st April, 2000, the annual provision for retirement benefits is calculated to state the liability at the amount that would be required if all employees voluntarily terminated their employment at each balance sheet date.
Effective 1st April, 2000, the Group adopted a new accounting standard for employees’ retirement benefits and accounted for theliability for retirement benefits based on the projected benefit obligations and plan assets at the balance sheet date.
Nisshinbo Industries, Inc. and Consolidated Subsidiaries
Notes to Consolidated Financial Statements
3.3NISSHINBO_AR2001後半(0904) 01.9.26 4:28 PM ページ 23
The full amount of the transitional obligation of ¥16,049 million ($128,392 thousand), determined as of the beginning of year,is charged to income and presented as other expense in the income statement.
In 2000, the Company contributed certain available-for-sale securities with a fair value of ¥14,791 million ($118,328 thousand)to employee retirement benefit trust for the Company’s non-contributory pension plans, and recognized a non-cash gain of ¥12,642million ($101,136 thousand). The securities held in this trust are qualified as plan assets.
Retirement benefits to directors and corporate auditors are provided at the amount which would be required if all directors andcorporate auditors retired at the balance sheet date.(i) Income taxes
The provision for income taxes is computed based on the pretax income included in the consolidated statements of income. Theasset and liability approach is used to recognize deferred tax assets and liabilities for the expected future tax consequences of tem-porary differences between the carrying amounts and the tax bases of assets and liabilities. Deferred taxes are measured by applyingcurrently enacted tax laws to the temporary differences.(j) Derivative financial instruments
The Group uses a variety of derivative financial instruments, including foreign currency forward contracts and interest rate swapsas a means of hedging exposure to foreign currency and interest rate risks. The Group does not enter into derivatives for trading orspeculative purposes.
Effective 1st April, 2000, the Group adopted a new accounting standard for derivative financial instruments and a revised account-ing standard for foreign currency transactions. These standards require that: a) all derivatives be recognized as either assets or liabilities and measured at fair value, and gains or losses on derivative transactions are recognized in the income statement and b)for derivatives used for hedging purposes, if derivatives qualify for hedge accounting because of high correlation and effectivenessbetween the hedging instruments and the hedged items, gains or losses on derivatives are deferred until maturity of the hedged transactions.
The foreign currency forward contracts are utilized to hedge foreign currency exposures in procurement of raw materials fromoverseas suppliers. Trade payables denominated in foreign currencies are translated at the contracted rates if the forward contractsqualify for hedge accounting.
Interest rate swaps are utilized to hedge interest rate exposures of long-term debt. These swaps which qualify for hedge account-ing and meet specific matching criteria are not remeasured at market value but the differential paid or received under the swap agree-ments are recognized and included in interest expense or income.
3. INVENTORIES:
Inventories at 31st March, 2001 and 2000 were as follows:
(thousands of(millions of yen) US dollars)
2001 2000 2001
Finished products ..............................................................................................................Work in process.................................................................................................................Materials and supplies.......................................................................................................
4. MARKETABLE EQUITY SECURITIES:
At 31st March, 2001 and 2000, the aggregate cost and market value of current and non-current portfolios of marketable equitysecurities included in marketable securities, investment securities and investments in unconsolidated subsidiaries and affiliates weresummarised as follows:
(thousands of(millions of yen) US dollars)
2001 2000 2001
Current portfolios:Cost and carrying amount ............................................................................................Market value ..................................................................................................................
Non-current portfolios:Cost and carrying amount ............................................................................................Market value ..................................................................................................................
¥ 26,0458,5388,841
¥ 43,424
$ 208,36068,30470,728
$ 347,392
¥ ——
43,023151,085
$ ——
344,1841,208,680
¥ 26,7118,5338,716
¥ 43,960
¥ 5711,571
58,341202,975
3.3NISSHINBO_AR2001後半(0904) 01.9.26 4:28 PM ページ 24
5. SHORT-TERM BANK LOANS AND LONG-TERM DEBT:
Short-term bank loans at 31st March, 2001 and 2000 were principally represented by 180 to 365 days notes issued by Nisshinboand its consolidated subsidiaries to banks. The annual interest rates applicable to the short-term bank loans at 31st March, 2001 and2000 were 0.9% to 8.8% and 0.8% to 8.8%, respectively.
Long-term debt at 31st March, 2001 and 2000 consisted of the following:
(thousands of(millions of yen) US dollars)
2001 2000 2001
Long-term debt with collateral:Loans from banks maturing serially to 2007, ranging from 1.6% to 6.0%................
Long-term debt without collateral:Loans from banks maturing serially to 2005, ranging from 1.5% to 6.6%................
Capital lease obligations, due through 2010................................................................
Less current portion ..........................................................................................................
Annual maturities of long-term debt were as follows:
Year ending 31st March, (millions of yen) (thousands of US dollars)
2002............................................................................................................................2003 .........................................................................................................................................2004............................................................................................................................2005............................................................................................................................2006 and thereafter ...................................................................................................
At 31st March, 2001 and 2000, net book value of property, plant and equipment pledged as collateral for short-term bank loansand long-term debt was ¥6,851 million ($54,808 thousand) and ¥7,341 million, respectively.
6. RETIREMENT AND PENSION PLANS:
Under most circumstances, employees terminating their employment are entitled to lump-sum severance payments based on therate of pay at termination, years of service and certain other factors.
The liability for retirement benefits at 31st March, 2001 for directors and corporate auditors is ¥939 million ($7,512 thousand).The retirement benefits for directors and corporate auditors are paid subject to the approval of the shareholders.
Effective 1st April, 2000, the Group adopted a new accounting standard for employees’ retirement benefits.The liability for employees’ retirement benefits at 31st March, 2001 consisted of the followings:
(millions of yen) (thousands of US Dollars)
Projected benefit obligation .....................................................................................Fair value of plan assets.......................................................................................................
Unrecognized actuarial loss......................................................................................Net liability............................................................................................................
¥ 1,423
2,924
6,28710,634(1,064)
¥ 9,570
$ 11,384
23,392
50,29685,072(8,512)
$ 76,560
$ 8,51212,24820,888
6,92836,496
$ 85,072
¥ 1,0641,5312,611
8664,562
¥ 10,634
¥ 1,562
2,539
5,7619,862
(1,279)¥ 8,583
¥ 62,137(36,655)25,482(3,409)
¥ 22,073
$ 497,096(293,240)203,856(27,272)
$ 176,584
3.3NISSHINBO_AR2001後半(0904) 01.9.26 4:28 PM ページ 25
The components of net periodic benefit costs for the year ended 31st March, 2001 are as follows:(millions of yen) (thousands of US dollars)
Service cost ................................................................................................................Interest cost............................................................................................................................Expected return on plan assets .................................................................................Amortization of transitional obligation...................................................................
Net periodic benefit costs .....................................................................................
Assumptions used for the year ended 31st March, 2001 are set forth as follows:
Discount rate ............................................................................................................. 3.0~3.5%Expected rate of return on plan assets ............................................................................. 3.5~4.0%Recognition period of actuarial gain / loss .............................................................. 15 yearsAmortization period of transitional obligation....................................................... 1 year
Pension costs charged to income for the year ended 31st March, 2000 were ¥383 million.
7. INCOME TAXES:
The tax effects of significant temporary differences and loss carryforwards which resulted in deferred tax assets and liabilities at31st March, 2001 and 2000 are as follows:
(thousands of(millions of yen) US dollars)
2001 2000 2001
Deferred tax assets:Property, plant and equipment ................................................................................Tax loss carryforwards ..............................................................................................Allowance for doubtful accounts .............................................................................Accrued employees’ bonuses....................................................................................Accrued severance benefits.......................................................................................Other..........................................................................................................................Less valuation allowance...........................................................................................
Deferred tax liabilities:Deferred gains on sale of property ...........................................................................Other..........................................................................................................................
Net deferred tax assets.......................................................................................................
A reconciliation between the normal effective statutory tax rate for the year ended 31st March, 2001 and 2000 and the actual effective tax rates reflected in the accompanying consolidated statement of income is as follows:
Normal effective statutory tax rate............................................................................................................Dividend income not taxable ............................................................................................................Tax benefits not recognized on operating losses of subsidiaries .....................................................Equity in losses of affiliates................................................................................................................Lower income tax rates applicable to income in certain foreign countries ....................................Other...................................................................................................................................................
Actual effective tax rate ..............................................................................................................................
$ 20,77614,792
(11,144)128,392
$ 152,816
¥ 2,5971,849
(1,393)16,049
¥ 19,102
200142.0%(6.7)52.9
6.9(29.5)
3.469.0%
200042.0%
(10.5)16.6
2.3(3.7)(1.4)45.3%
$ 4,49620,992
4,9364,944
65,13610,584
(26,296)$ 84,792
$ 36,080)(776)
$ 36,856)
$ 47,936
¥ 6171,939
493436
6,2881,340
(2,259)¥ 8,854
¥ 4,843)(28)
¥ 4,871)
¥ 3,983
¥ 5622,624
617618
8,1421,323
(3,287)¥ 10,599
¥ 4,510)(97)
¥ 4,607)
¥ 5,992
(
(
(
(
(
(
3.3NISSHINBO_AR2001後半(0904) 01.9.26 4:28 PM ページ 26
8. LEASES:
The Group leases certain machinery, computer equipment and other assets.Total rental expenses for the years ended 31st March, 2001 and 2000 were ¥659 million ($5,272 thousand) and ¥733 million, respec-
tively, including ¥624 million ($4,992 thousand) and ¥698 million of lease payments under finance leases.Pro forma information of leased property such as acquisition cost, accumulated depreciation, obligation under finance lease, depre-
ciation expense of finance leases that do not transfer ownership of the leased property to the lessee on an “as if capitalized” basis forthe years ended 31st March, 2001 and 2000 was as follows:
(thousands of(millions of yen) US dollars)
2001 2000 2001
Acquisition cost.........................................................................................................Accumulated depreciation........................................................................................Net leased property ...................................................................................................
Obligations under finance leases:(thousands of
(millions of yen) US dollars)2001 2000 2001
Due within one year..................................................................................................Due after one year .....................................................................................................Total...........................................................................................................................
Depreciation expense under finance leases:(thousands of
(millions of yen) US dollars)2001 2000 2001
Depreciation expense................................................................................................
Depreciation expense, which is not reflected in the accompanying statements of income, is computed by the straight-line method.
9. DERIVATIVES:
The Group enters into foreign currency forward contracts to hedge foreign exchange risk associated with certain assets and liabilities denominated in foreign currencies. The Group also enters into interest rate swap contracts to manage its interest rate exposures on certain liabilities.
All derivative transactions are entered into to hedge interest and foreign currency exposures incorporated within its business.Accordingly, market risk in these derivatives is basically offset by opposite movements in the value of hedged assets or liabilities.
Derivative transactions which qualify for hedge accounting are not subject to the disclosure of market value information.
¥ 3,1942,036
¥ 1,158
$ 25,55216,288
$ 9,264
¥ 3,5341,992
¥ 1,542
¥ 521637
¥ 1,158
$ 4,1685,096
$ 9,264
¥ 574968
¥ 1,542
¥ 624 $ 4,992¥ 698
3.3NISSHINBO_AR2001後半(0904) 01.9.26 4:28 PM ページ 27
28
10. SHAREHOLDERS’ EQUITY:
The Japanese Commercial Code provides that an amount equal to at least 10% of all cash payments which are made as an appro-priation of retained earnings be appropriated as a legal reserve until such reserve equals 25% of stated value of capital stock. Thisreserve is not available for dividends but may be used to reduce a deficit by resolution of the shareholders or may be capitalised byresolution of the Board of Directors.
Dividends are approved by the shareholders at a meeting held subsequent to the fiscal year to which the dividend is applicable.In addition, a semi-annual interim dividend may be paid upon resolution of the Board of Directors, subject to limitations imposedby the Code.
The computation of net income per share is based on the weighted average number of shares of common stock outstanding dur-ing each fiscal year.
11. OTHER INCOME (EXPENSES) — OTHER, NET:
Other income (expenses) — Other, net consisted of the following:
(thousands of(millions of yen) US dollars)
2001 2000 2001
Loss on sale of property, plant and equipment ..............................................................Gain on sale of securities...................................................................................................Write-down of securities ..................................................................................................Write-off of inventories ...................................................................................................Loss on plant closures ......................................................................................................Transitional obligation for retirement benefits ..............................................................Gain on securities contributed to retirement benefit trust .............................................Retirement benefits paid due to restructuring of business operations...........................Other, net ..........................................................................................................................
12. COMMITMENTS AND CONTINGENCIES:
Contingent liabilities at 31st March, 2001 and 2000 for trade notes discounted with banks and trade notes delivered with endorsementsfor payments amounted to ¥610 million ($4,880 thousand) and ¥1,806 million, respectively. Contingent liabilities at 31st March, 2001 and2000 for loans guaranteed amounted to ¥4,395 million ($35,160 thousand) and ¥1,539 million, respectively.
Commitments for capital expenditures outstanding at 31st March, 2001 and 2000 were in the approximate amounts of ¥2,578 million($20,624 thousand) and ¥4,563 million, respectively.
13. SUBSEQUENT EVENTS:
On 28th June, 2001, Nisshinbo’s shareholders authorised the appropriation of retained earnings as follows:
(millions of yen) (thousands of US dollars)
Cash dividends (¥3.50 per share) .....................................................................................Directors’ bonuses.............................................................................................................
(¥ 277)1,870
—(749)(429)
(16,049)12,642(1,276)
(617)(¥ 4,885)
($ 2,216)14,960
—(5,992)(3,432)
(128,392)101,136(10,208)
(4,936)($ 39,080)
(¥ 33)6,144(657)(736)
(2,331)———
(1,722)¥ 665
$ 6,208400
¥ 77650
3.3NISSHINBO_AR2001後半(0904) 01.9.26 4:28 PM ページ 28
29
Independent Auditors’ Report
To the Board of Directors ofNisshinbo Industries, Inc.
We have audited the consolidated balance sheets of Nisshinbo Industries, Inc. and consolidated subsidiaries as of31st March, 2001 and 2000, and the related consolidated statements of income, shareholders’ equity, and cash flowsfor the year then ended, all expressed in Japanese yen. These financial statements are the responsibility of theCompany’s management. Our responsibility is to express an opinion on these financial statements based on ouraudits.
We conducted our audits in accordance with auditing standards, procedures and practices generally accepted andapplied in Japan. Those standards require that we plan and perform the audit to obtain reasonable assurance aboutwhether the financial statements are free of material misstatement. An audit includes examining, on a test basis,evidence supporting the amounts and disclosures in the financial statements. An audit also includes assessing theaccounting principles used and significant estimates made by management, as well as evaluating the overall financialstatement presentation. We believe that our audits provide a reasonable basis for our opinion.
In our opinion, the consolidated financial statements referred to above present fairly, in all material respects, thefinancial position of Nisshinbo Industries, Inc. and consolidated subsidiaries as of 31st March, 2001 and 2000, and theresults of their operations and their cash flows for the year then ended, in conformity with accounting principles andpractices generally accepted in Japan.
The United States dollar amounts shown in the consolidated financial statements have been translated solely forconvenience. We have reviewed this translation and, in our opinion, the consolidated financial statements expressedin Japanese yen have been translated into US dollars on the basis described in Note 1.
Masami Tsukeshiba Etsuko NagashimaCertified Public Accountant Certified Public Accountant
28th June, 2001Tokyo, Japan
3.3NISSHINBO_AR2001後半(0904) 01.9.26 4:28 PM ページ 29
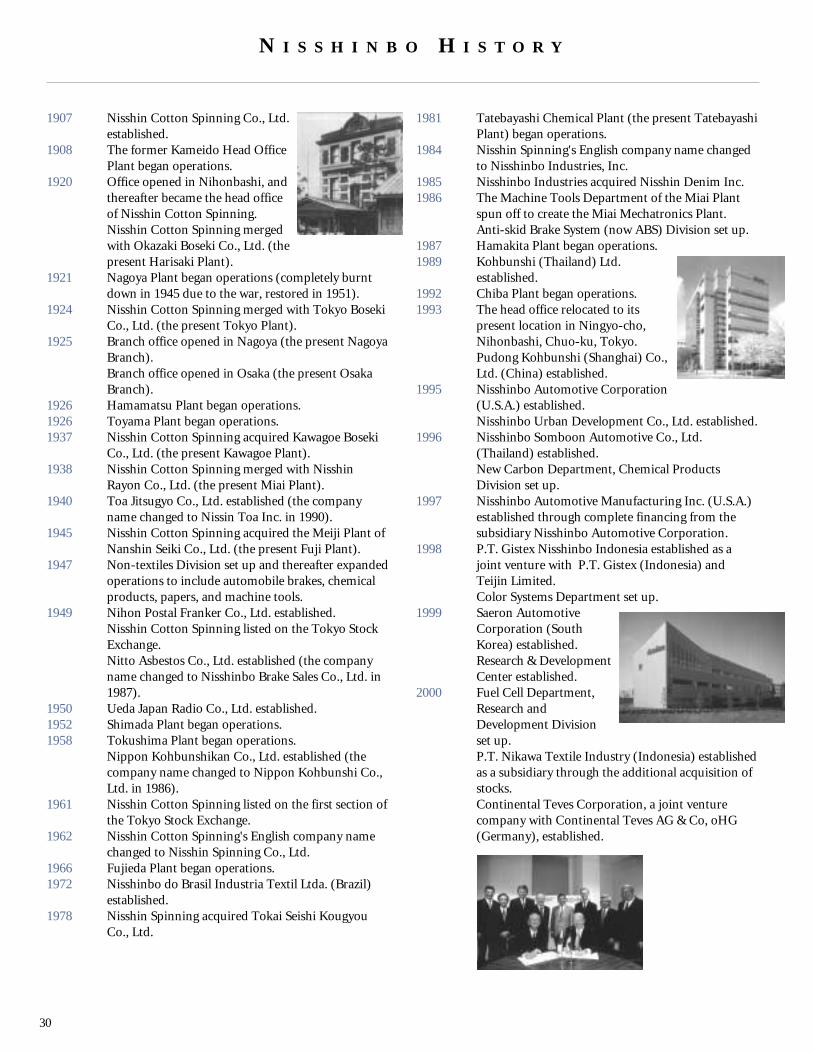
30
N I S S H I N B O H I S T O R Y
1907 Nisshin Cotton Spinning Co., Ltd.established.
1908 The former Kameido Head OfficePlant began operations.
1920 Office opened in Nihonbashi, andthereafter became the head officeof Nisshin Cotton Spinning.Nisshin Cotton Spinning mergedwith Okazaki Boseki Co., Ltd. (thepresent Harisaki Plant).
1921 Nagoya Plant began operations (completely burntdown in 1945 due to the war, restored in 1951).
1924 Nisshin Cotton Spinning merged with Tokyo BosekiCo., Ltd. (the present Tokyo Plant).
1925 Branch office opened in Nagoya (the present NagoyaBranch).Branch office opened in Osaka (the present OsakaBranch).
1926 Hamamatsu Plant began operations.1926 Toyama Plant began operations.1937 Nisshin Cotton Spinning acquired Kawagoe Boseki
Co., Ltd. (the present Kawagoe Plant).1938 Nisshin Cotton Spinning merged with Nisshin
Rayon Co., Ltd. (the present Miai Plant).1940 Toa Jitsugyo Co., Ltd. established (the company
name changed to Nissin Toa Inc. in 1990).1945 Nisshin Cotton Spinning acquired the Meiji Plant of
Nanshin Seiki Co., Ltd. (the present Fuji Plant).1947 Non-textiles Division set up and thereafter expanded
operations to include automobile brakes, chemicalproducts, papers, and machine tools.
1949 Nihon Postal Franker Co., Ltd. established. Nisshin Cotton Spinning listed on the Tokyo StockExchange.Nitto Asbestos Co., Ltd. established (the companyname changed to Nisshinbo Brake Sales Co., Ltd. in1987).
1950 Ueda Japan Radio Co., Ltd. established.1952 Shimada Plant began operations.1958 Tokushima Plant began operations.
Nippon Kohbunshikan Co., Ltd. established (thecompany name changed to Nippon Kohbunshi Co.,Ltd. in 1986).
1961 Nisshin Cotton Spinning listed on the first section ofthe Tokyo Stock Exchange.
1962 Nisshin Cotton Spinning's English company namechanged to Nisshin Spinning Co., Ltd.
1966 Fujieda Plant began operations.1972 Nisshinbo do Brasil Industria Textil Ltda. (Brazil)
established. 1978 Nisshin Spinning acquired Tokai Seishi Kougyou
Co., Ltd.
1981 Tatebayashi Chemical Plant (the present TatebayashiPlant) began operations.
1984 Nisshin Spinning's English company name changedto Nisshinbo Industries, Inc.
1985 Nisshinbo Industries acquired Nisshin Denim Inc. 1986 The Machine Tools Department of the Miai Plant
spun off to create the Miai Mechatronics Plant.Anti-skid Brake System (now ABS) Division set up.
1987 Hamakita Plant began operations.1989 Kohbunshi (Thailand) Ltd.
established.1992 Chiba Plant began operations.1993 The head office relocated to its
present location in Ningyo-cho,Nihonbashi, Chuo-ku, Tokyo.Pudong Kohbunshi (Shanghai) Co.,Ltd. (China) established.
1995 Nisshinbo Automotive Corporation(U.S.A.) established. Nisshinbo Urban Development Co., Ltd. established.
1996 Nisshinbo Somboon Automotive Co., Ltd.(Thailand) established. New Carbon Department, Chemical ProductsDivision set up.
1997 Nisshinbo Automotive Manufacturing Inc. (U.S.A.)established through complete financing from thesubsidiary Nisshinbo Automotive Corporation.
1998 P.T. Gistex Nisshinbo Indonesia established as ajoint venture with P.T. Gistex (Indonesia) andTeijin Limited.Color Systems Department set up.
1999 Saeron AutomotiveCorporation (SouthKorea) established.Research & DevelopmentCenter established.
2000 Fuel Cell Department,Research andDevelopment Divisionset up.P.T. Nikawa Textile Industry (Indonesia) establishedas a subsidiary through the additional acquisition ofstocks. Continental Teves Corporation, a joint venturecompany with Continental Teves AG & Co, oHG(Germany), established.
3.3NISSHINBO_AR2001後半(0904) 01.9.26 4:28 PM ページ 30
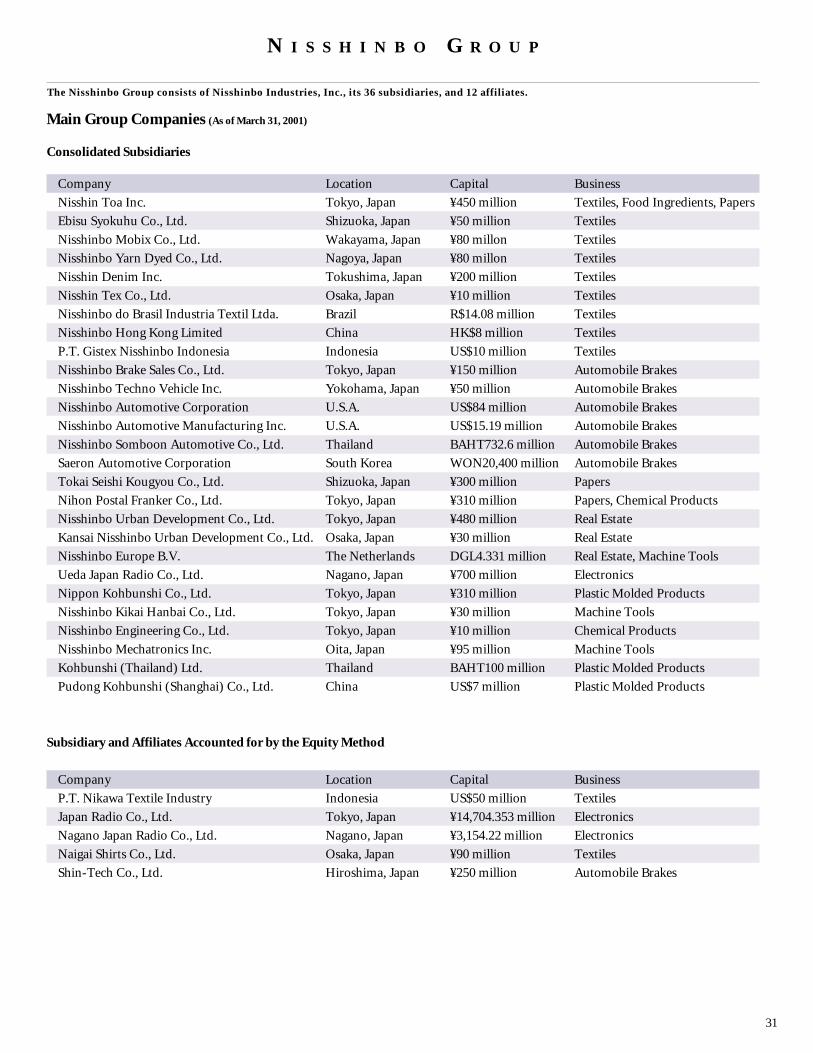
31
N I S S H I N B O G R O U P
Main Group Companies (As of March 31, 2001)
Consolidated Subsidiaries
Company Location Capital Business
Nisshin Toa Inc. Tokyo, Japan ¥450 million Textiles, Food Ingredients, Papers
Ebisu Syokuhu Co., Ltd. Shizuoka, Japan ¥50 million Textiles
Nisshinbo Mobix Co., Ltd. Wakayama, Japan ¥80 millon Textiles
Nisshinbo Yarn Dyed Co., Ltd. Nagoya, Japan ¥80 millon Textiles
Nisshin Denim Inc. Tokushima, Japan ¥200 million Textiles
Nisshin Tex Co., Ltd. Osaka, Japan ¥10 million Textiles
Nisshinbo do Brasil Industria Textil Ltda. Brazil R$14.08 million Textiles
Nisshinbo Hong Kong Limited China HK$8 million Textiles
P.T. Gistex Nisshinbo Indonesia Indonesia US$10 million Textiles
Nisshinbo Brake Sales Co., Ltd. Tokyo, Japan ¥150 million Automobile Brakes
Nisshinbo Techno Vehicle Inc. Yokohama, Japan ¥50 million Automobile Brakes
Nisshinbo Automotive Corporation U.S.A. US$84 million Automobile Brakes
Nisshinbo Automotive Manufacturing Inc. U.S.A. US$15.19 million Automobile Brakes
Nisshinbo Somboon Automotive Co., Ltd. Thailand BAHT732.6 million Automobile Brakes
Saeron Automotive Corporation South Korea WON20,400 million Automobile Brakes
Tokai Seishi Kougyou Co., Ltd. Shizuoka, Japan ¥300 million Papers
Nihon Postal Franker Co., Ltd. Tokyo, Japan ¥310 million Papers, Chemical Products
Nisshinbo Urban Development Co., Ltd. Tokyo, Japan ¥480 million Real Estate
Kansai Nisshinbo Urban Development Co., Ltd. Osaka, Japan ¥30 million Real Estate
Nisshinbo Europe B.V. The Netherlands DGL4.331 million Real Estate, Machine Tools
Ueda Japan Radio Co., Ltd. Nagano, Japan ¥700 million Electronics
Nippon Kohbunshi Co., Ltd. Tokyo, Japan ¥310 million Plastic Molded Products
Nisshinbo Kikai Hanbai Co., Ltd. Tokyo, Japan ¥30 million Machine Tools
Nisshinbo Engineering Co., Ltd. Tokyo, Japan ¥10 million Chemical Products
Nisshinbo Mechatronics Inc. Oita, Japan ¥95 million Machine Tools
Kohbunshi (Thailand) Ltd. Thailand BAHT100 million Plastic Molded Products
Pudong Kohbunshi (Shanghai) Co., Ltd. China US$7 million Plastic Molded Products
Subsidiary and Affiliates Accounted for by the Equity Method
Company Location Capital Business
P.T. Nikawa Textile Industry Indonesia US$50 million Textiles
Japan Radio Co., Ltd. Tokyo, Japan ¥14,704.353 million Electronics
Nagano Japan Radio Co., Ltd. Nagano, Japan ¥3,154.22 million Electronics
Naigai Shirts Co., Ltd. Osaka, Japan ¥90 million Textiles
Shin-Tech Co., Ltd. Hiroshima, Japan ¥250 million Automobile Brakes
The Nisshinbo Group consists of Nisshinbo Industries, Inc., its 36 subsidiaries, and 12 affiliates.
3.3NISSHINBO_AR2001後半(0904) 01.9.26 4:28 PM ページ 31
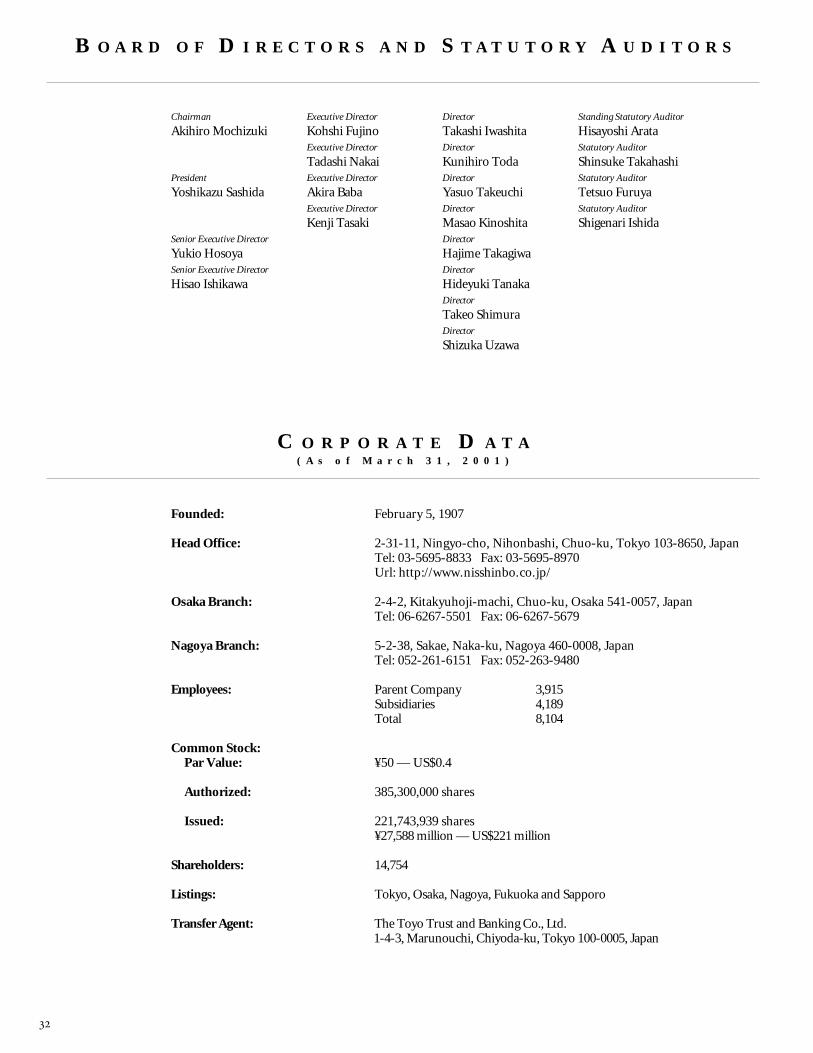
Chairman
Akihiro Mochizuki
President
Yoshikazu Sashida
Senior Executive Director
Yukio HosoyaSenior Executive Director
Hisao Ishikawa
Executive Director
Kohshi FujinoExecutive Director
Tadashi NakaiExecutive Director
Akira BabaExecutive Director
Kenji Tasaki
Director
Takashi IwashitaDirector
Kunihiro TodaDirector
Yasuo TakeuchiDirector
Masao KinoshitaDirector
Hajime TakagiwaDirector
Hideyuki TanakaDirector
Takeo ShimuraDirector
Shizuka Uzawa
Standing Statutory Auditor
Hisayoshi ArataStatutory Auditor
Shinsuke TakahashiStatutory Auditor
Tetsuo FuruyaStatutory Auditor
Shigenari Ishida
B O A R D O F D I R E C T O R S A N D S T A T U T O R Y A U D I T O R S
C O R P O R A T E D A T A( A s o f M a r c h 3 1 , 2 0 0 1 )
Founded: February 5, 1907
Head Office: 2-31-11, Ningyo-cho, Nihonbashi, Chuo-ku, Tokyo 103-8650, JapanTel: 03-5695-8833 Fax: 03-5695-8970Url: http://www.nisshinbo.co.jp/
Osaka Branch: 2-4-2, Kitakyuhoji-machi, Chuo-ku, Osaka 541-0057, JapanTel: 06-6267-5501 Fax: 06-6267-5679
Nagoya Branch: 5-2-38, Sakae, Naka-ku, Nagoya 460-0008, JapanTel: 052-261-6151 Fax: 052-263-9480
Employees: Parent Company 3,915Subsidiaries 4,189Total 8,104
Common Stock:Par Value: ¥50 — US$0.4
Authorized: 385,300,000 shares
Issued: 221,743,939 shares¥27,588 million — US$221 million
Shareholders: 14,754
Listings: Tokyo, Osaka, Nagoya, Fukuoka and Sapporo
Transfer Agent: The Toyo Trust and Banking Co., Ltd. 1-4-3, Marunouchi, Chiyoda-ku, Tokyo 100-0005, Japan
3.3NISSHINBO_AR2001後半(0904) 01.9.26 4:28 PM ページ 32
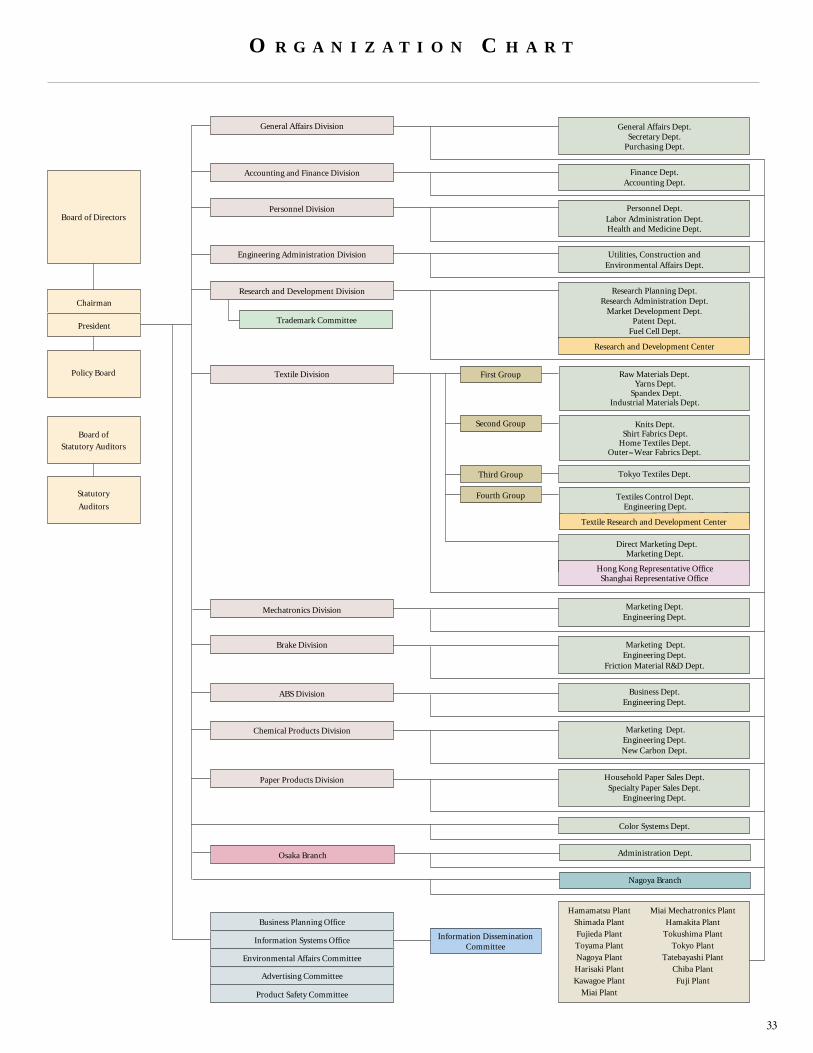
Board of Directors
President
Chairman
Policy Board
Board of
Statutory Auditors
Statutory
Auditors
General Affairs Division
Personnel Division
Engineering Administration Division
Research and Development Division
Accounting and Finance Division
Trademark Committee
Textile Division
Business Planning Office
Information Systems Office
Environmental Affairs Committee
Advertising Committee
Product Safety Committee
First Group
Second Group
Third Group
Information DisseminationCommittee
General Affairs Dept.Secretary Dept.
Purchasing Dept.
Personnel Dept.Labor Administration Dept.Health and Medicine Dept.
Research Planning Dept.Research Administration Dept.
Market Development Dept.Patent Dept.
Fuel Cell Dept.
Yarns Dept.
Knits Dept.Shirt Fabrics Dept.
Home Textiles Dept.
Spandex Dept.Industrial Materials Dept.
Outer-Wear Fabrics Dept.
Fourth Group
Tokyo Textiles Dept.
Textile Research and Development Center
Direct Marketing Dept.
Raw Materials Dept.
Textiles Control Dept.
Marketing Dept.
Engineering Dept.
Finance Dept.Accounting Dept.
Utilities, Construction andEnvironmental Affairs Dept.
Research and Development Center
Hong Kong Representative OfficeShanghai Representative Office
Mechatronics Division
Brake Division
ABS Division
Chemical Products Division
Paper Products Division
Marketing Dept.Engineering Dept.
Business Dept.Engineering Dept.
Engineering Dept.
Color Systems Dept.
Marketing Dept.Engineering Dept.
Friction Material R&D Dept.
Marketing Dept.Engineering Dept.New Carbon Dept.
Household Paper Sales Dept.Specialty Paper Sales Dept.
Osaka Branch Administration Dept.
Nagoya Branch
Hamamatsu Plant
Shimada Plant
Fujieda Plant
Toyama Plant
Nagoya Plant
Harisaki Plant
Kawagoe Plant
Miai Plant
Miai Mechatronics Plant
Hamakita Plant
Tokushima Plant
Tokyo Plant
Tatebayashi Plant
Chiba Plant
Fuji Plant
O R G A N I Z A T I O N C H A R T
3.3NISSHINBO_AR2001後半(0904) 01.9.26 4:28 PM ページ 33
Annual Report 2001(Year ended March 31, 2001)
NI
SS
HI
NB
O
AN
NU
AL
R
EP
OR
T
20
01
Y
ea
r
en
de
d
Ma
rc
h
31
,
20
01
2-31-11, Ningyo-cho, Nihonbashi, Chuo-ku, Tokyo 103-8650, Japan
Tel: 03-5695-8833 / Fax: 03-5695-8970
URL: http://www.nisshinbo. co.jp/
Printed in Japan
3.3Nissinbo-Cover1-4 01.9.26 4:05 PM ページ 1 (1,1)