nitrogen deposition in spain: modeled patterns and ... · nitrogen deposition in spain: modeled...
TRANSCRIPT
Nitrogen deposition in Spain: modeled patterns and potential implications for
conservation
H. García-Gómez1, J.L. Garrido
1, M.G. Vivanco
1, L. Lassaletta
2, I. Rabago
1, A. Àvila
3, A.
Benedictow4, G. Sánchez
5, A. González
6, I. González-Fernández
1, R. Alonso
1
1) Atmospheric Pollution Division, CIEMAT, Madrid, Spain
2) CNRS/UPMC, UMR 7619 Sisyphe, Paris, France
3) CREAF, Universitat Autònoma de Barcelona, Bellaterra, Spain
4) MSC-W of EMEP, Norwegian Meteorological Institute, Oslo, Norway
5) Spanish Ministry of Agriculture, Food and Environment, ICP Forest, Spain
6) Spanish Ministry of Agriculture, Food and Environment, Air Quality and Industrial
Environment, Spain
Correspondence to: hector.garcí[email protected]
Abstract
Evidences of an ongoing nitrogen enrichment of Spanish terrestrial ecosystems have been
recently recorded. Atmospheric chemical transport models are valuable tools to identify those
areas where these effects of atmospheric nitrogen deposition could be occurring. This study
documents the performance of two chemical transport models (EMEP and CHIMERE) in
predicting annual values of wet deposition of nitrogen and describes its main patterns for the
period 2005-2008 in Spain. Wet nitrogen deposition was acceptably predicted by both
models, showing better results for oxidized than for reduced nitrogen, particularly using the
CHIMERE model. Dry nitrogen deposition may be underestimated, particularly by the EMEP
model. Both models estimated higher wet deposition values in Northern and Northeastern
Spain, decreasing along a NE-SW axis and ranging 1.2-13.3 and 1.0-8.7 kgN ha-1
y-1
for
This is the author’s version of a work that was accepted for publication in Science of the total environment (Ed.
Elsevier). Changes resulting from the publishing process, such as peer review, editing, corrections, structural
formatting, and other quality control mechanisms may not be reflected in this document. Changes may have been
made to this work since it was submitted for publication. A definitive version was subsequently published in García-
Gómez, H. et al. “Nitrogen deposition in Spain: modeled patterns and threatened habitats within the Natura 2000
network” in Science of the total environment, vol. 485-486 (2014), p.450-460. DOI 10.1016/j.scitotenv.2014.03.112
EMEP and CHIMERE model, respectively. Total nitrogen deposition (wet plus dry) in 2008
was used to calculate Critical Load exceedances within the Spanish Natura 2000 network
(188,856.9 km2). Threatened areas of 4521.4 and 1657 km
2 were predicted by CHIMERE and
EMEP models, respectively. Grassland habitats proved to be the most threatened group,
particularly in the Alpine Bio-geographical Region, pointing out that biodiversity
conservation in these protected areas could be endangered.
1. Introduction
The global biogeochemical cycle of nitrogen (N) has been deeply altered (Sutton et al.,
2011), to the extent that the boundary within which humankind can operate safely has long
been crossed (Rockström et al., 2009). Anthropogenic reactive nitrogen (Nr) circulates across
different compartments (atmosphere, hydrosphere and terrestrial ecosystems) inducing a
cascade of environmental effects, such as tropospheric ozone formation, ecosystem
acidification and eutrophication (Bobbink et al., 2010; Galloway et al., 2008; Sutton et al.,
2011) . Particularly, eutrophication is still a widespread problem that affects most European
ecosystems (EEA, 2013). Increased atmospheric N deposition can directly damage
vegetation, alter nutrient ratios in soil and vegetation, and increase plant susceptibility to
other stressors, resulting in changes of community composition, loss of biodiversity and
invasions of new species (Dise et al., 2011; EEA, 2013).
The Mediterranean Basin presents an extraordinary biological richness recognized as one of
the first 25 Global Biodiversity Hotspots for conservation priorities (Myers et al., 2000).
Dentener et al., (2006) indicated that central Europe and circum-Mediterranean countries are
one of the planet hotspots experiencing high N deposition rates. Nonetheless, scarce
information is available on the threat that air pollution and in particular reactive N, can pose
to biodiversity in the Mediterranean area (Bleeker et al., 2011; Ochoa-Hueso et al., 2011,
2013).
The implemented Gothenburg Protocol of the Convention on Long-Range Trans-boundary
Air Pollution (CLRTAP) under the UNECE framework and the related European policies
have resulted in substantial reductions of the emissions of N compounds to the atmosphere in
the period 1990-2009 in Europe (EEA, 2011). During the same period, Spanish emission of
NH3 increased 12.8% and NOx emissions decreased 17%, but only after that a continuous
increase stopped in 2007 (MAGRAMA, 2013). Increments in NO3- deposition in Catalonia
(NE of Spain) during period 1983-2007 have been related with the increase in Spanish NOx
emissions (Àvila et al., 2010; Àvila and Rodà, 2012). Moreover, similar trends in N
deposition have been detected in mountain areas of the Pyrenees in the period 1997-2007
(Camarero and Catalán, 2012). Total annual atmospheric N deposition loads in eastern Spain
have been estimated in 15-30 kg N ha-1
yr-1
, with dry deposition representing about 40-70%
of total N deposition (Àvila and Rodà, 2012; Rodà et al., 2002; Sanz et al., 2002). Regardless
of that, atmospheric N deposition in Spain is lower than values recorded in central Europe,
from both measured (Lorenz and Becher, 2012) and modeled data (Simpson et al., 2011).
However, since changes in species composition occur early in the sequence of N saturation
(Emmet, 2007), N deposition effects could be occurring in Spanish natural ecosystems.
Some evidences of N enrichment already occurring in Spanish terrestrial ecosystems have
been reported. A continuous increase of nitrophilous plants has been detected in the Iberian
Peninsula for the period 1900-2008 using the Global Biodiversity Information facility (GBIF)
database (Ariño et al., 2011). Also an increase in the N content in bryophytes, but not in
vascular plants, has been observed in herbarium specimens collected in Spain throughout the
last century (Peñuelas and Filella, 2001). Rising nitrate concentration in headwater streams
detected in areas of NE Spain have been considered a sign of the onset of eutrophication is
(Àvila and Rodà, 2012; Camarero and Aniz, 2010).
Suitable N deposition data are needed to identify those areas where effects of N deposition
could be occurring in natural ecosystems. Since the deployment of air quality networks is still
limited in rural areas, air quality models constitute a valuable tool to quantify air pollution
over broad geographical areas. The European Monitoring and Evaluation Program developed
the EMEP MSC-W chemical transport model, which estimates regional atmospheric
dispersion and deposition of acidifying and eutrophying compounds (S, N), ground level
ozone and particulate matter all over Europe. This model plays a key role in the development
of emission control strategies for Europe within the framework of the CLRTAP/UNECE and
the European Union policies. Similarly, the CHIMERE chemical transport model has been
extensively applied to simulate the evolution and spatial distribution of concentration of
several pollutants such as ozone and its precursors, aerosols, etc. along with estimates of
pollutant deposition (Bessagnet et al. 2004; Vivanco et al. 2008, 2009). The successive
developments of this model were recently reviewed on the basis of published investigations
by Menut et al. (2013).

Critical loads (CL) are effect thresholds for N deposition, defined under the CLRTAP for the
protection of the ecosystems. CL are defined as a quantitative estimate of pollutant deposition
below which significant harmful effects on specified sensitive elements of the environment
do not occur according to present knowledge (UBA, 2004). Different approaches have been
adopted in the Convention to define N critical loads involving either modeling or field
evidences. Empirical N critical loads have been defined for specific ecosystems based on
observed changes in the structure and function of the ecosystems, primarily in species
abundance, composition and/or diversity (Bobbink et al., 2010; Bobbink and Hettelingh,
2011). Exceedance of empirical critical loads has been used in Europe since 1990s to assess
impacts on biodiversity in natural systems and, in this way, its use is recommended in the EC
Habitats Directive (EC, 2010) to inform whether nitrogen deposition should be recorded as a
“threat to future prospects” (Whitfield et al, 2011). However, the definition and application of
N empirical critical loads in Mediterranean areas is still very limited and further research is
being required (Bobbink et al., 2010; Ochoa-Hueso et al., 2011).
The objectives of this work were 1) to document the performance of atmospheric N
deposition values predicted with EMEP and CHIMERE models under Mediterranean
environmental conditions; 2) to analyze the distribution of atmospheric N deposition in the
Iberian Peninsula; and 3) to assess the possible effects of atmospheric N deposition for
biodiversity preservation in the Spanish Natura 2000 network (more than 30% of the Spanish
territory). For this analysis, wet deposition of nitrate (NO3-) and ammonium (NH4
+) modeled
by EMEP (v 3.8.1) and CHIMERE (v V200603par-rc1 and V2008) models were compared
with measured data for the period 2005-2008 obtained from different monitoring networks in
Spain: ICP Forests Level II plots, EMEP monitoring network and the Air Quality Network of
the Regional Catalan Government. Modeled deposition values were used to calculate
exceedances of empirical critical loads in the Natura 2000 network for a preliminary
assessment of the possible threat posed by N in these areas.
2. Material and Methods
2.1. Measurements
2.1.1. ICP Forests Level II network
The ICP Forest is a biomonitoring program launched in 1985 under the CLRTAP with the
aim of providing comprehensive information on forest condition in Europe and the possible

relationships to anthropogenic and natural stress factors, in particular air pollution (http://icp-
forests.net/). This Program includes Level II plots as intensive monitoring sites offering the
possibility of understanding complex ecosystem processes. At these sites, bulk deposition is
measured in open areas in the neighbourhood of the forest plots and deposition under canopy
is derived from throughfall measurements following standard protocols (http://icp-
forests.net/). Measured bulk deposition data of 13 ICP Forest Level II plots located in Spain
(Figure 1) were considered for the period 2005-2008. Fortnightly collected data were used to
calculate annual accumulated deposition rates (in some occasions data were collected
monthly). Contaminated or unrealistic values were removed from the data set. Only those
years and plots with maxima 30 days (2 fortnightly periods) of missing measurements per
year were considered. Valid data used for the analysis represented 80% of the total dataset.
Missing values were filled in with the monthly mean value for that site estimated from data
available for the other years. Annual deposition was calculated adding the product of
concentration and precipitation for each measuring period. The Spanish Level II plots are
located in a range of 50-1650 m.a.s.l, with 421-1787 mm average annual precipitation and
7.1-17.2 ºC average annual temperature.
2.1.2. EMEP measurement network
The EMEP program (www.emep.int) of the CLRTAP includes a network for monitoring air
pollutant concentration and deposition following standard methodologies and adequate
quality assurance procedures (http://www.nilu.no/projects/ccc/manual/index.html). The
EMEP network has focused on air pollutants in rural and background areas. These
measurements are combined with emissions and modeling data, allowing the assessment of
concentration and deposition of air pollutants, the significance of transboundary fluxes and
the related exceedances to critical levels and loads. The network needs to ensure an adequate
spatial coverage and sufficient temporal resolution to test the effectiveness of the
Convention’s protocols. In Spain, the current network has 10 monitoring stations located
from sea level to 1360 m.a.s.l. (http://www.aemet.es/es/idi/medio_ambiente/vigilancia;
Figure 1). Daily samples of precipitation chemistry are collected with wet-only samplers in 9
of the monitoring stations. Measured deposition data accumulated throughout the year
following EMEP protocols (www.emep.int) were considered for the period 2005-2008.
- Catalan Air Quality sites
Precipitation samples were obtained in four station of the Catalan Air Quality Network
(Xarxa de Vigilància y Prevenció de la Contaminació Atmosfèrica of the Generalitat de
Catalunya) in NE Spain (Figure 1). Weekly precipitation was sampled with wet-only
collectors (MCV®, CPH-004, Spain) at 4 sites ranging 198-685 m.a.s.l elevation. All the sites
were located in the outskirts of small towns with less that 9000 inhabitants (further
information of the sites provided in Àvila et al., 2010). Additionally, weekly wet-only
precipitation was also collected at La Castanya experimental site in the Montseny Mountains
at 720 m.a.s.l (Figure 1). All samples were analyzed by CREAF laboratory following a
protocols published elsewhere (Àvila and Rodà, 2002). Participation in the AQUACON
project for “Acid Rain” (Mosello et al., 1998) provided an interlaboratory check for
analytical quality. Concentrations were weighted by volume to give annual volume weighted
mean (VWM) concentrations and deposition was calculated as the product of annual VWM
by annual precipitation.
2.2. Air quality models
2.2.1. EMEP MSC-W chemical transport model
The EMEP programme relies on the collection of emission data from the European countries
and the measurements of air and precipitation quality from the EMEP stations to model
regional atmospheric dispersion and deposition of air pollutants all over Europe with the
EMEP MSC-W model. The model currently uses 20 vertical layers and considers about 140
reactions among 70 species. A detailed description of the model is provided in Simpson et al.
(2012). For this study, monthly atmospheric nitrogen deposition data estimated for the period
2005-2008 with the EMEP model rv3.8.1 over Europe using a grid size of 50 km × 50 km
were used (Fagerli et al., 2011). Meteorological data were obtained from ECMWF-IFS
Cycle36r1 (http://www.ecmwf.int/research/ifsdocs/) and emissions from 2011_CEIP_tends
(Fagerli et al., 2011).
2.2.2. CHIMERE regional air quality model
CHIMERE computing modelling was performed using the regional V200603par-rc1 version
for the 2005-2007 simulations and the V2008b version for 2008 simulations. More
information and detailed description of the model can be found in
http://www.lmd.polytechnique.fr/chimere/ and in Menut et al. (2013). The simulations were
performed as at a 0.2º- horizontal resolution for the period 2005-2007 and at a 0.1º-horizontal
resolution for 2008, covering the Iberian Peninsula and Balearic Islands. A further description
of the model setup for the 2005-2007 simulations is described in Vivanco et al. (2009). For
2008 a different set-up was used. For the same territory extension resolutions for the coarser
and finer domains were 0.2 and 0.1º respectively. On the other hand, in 2008 the WRF model
was used to obtain the meteorological fields. Regarding emissions, they were derived from
the annual totals of the EMEP database (Vestreng et al., 2005). Spatial emission distribution
was performed and NMVOC speciation was also estimated as indicated in Vivanco et al.
(2009).
2.3. Comparison of measured and modelled data
The location of the monitoring sites of the different networks was matched with the
corresponding EMEP and CHIMERE grid cells using ARCGIS version 9.3 (ESRI, Redlands
CA, USA). Annual bulk deposition of NO3- and NH4
+ measured in the ICP Forest plots and
wet-only deposition measured in EMEP network and Catalan Air Quality sites were
compared with modelled wet deposition data obtained with EMEP and CHIMERE models.
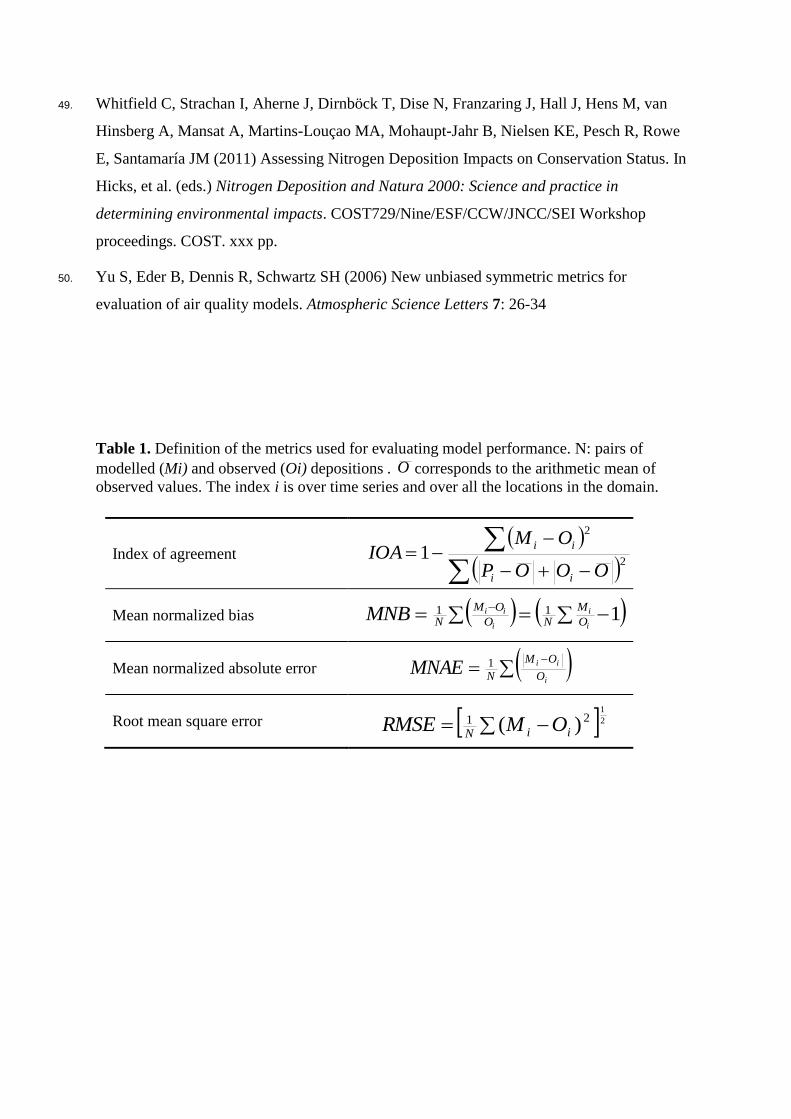
Traditional metrics commonly used in model evaluation (Chang and Hanna, 2004; Yu et al.,
2006), such as index of agreement (IOA), mean normalized bias (MNB), mean normalized
absolute error (MNAE) and root mean square error (RMSE) were calculated as shown in
Table 1 for nitrate wet deposition (WDON), ammonium wet deposition (WDRN) and total N
wet deposition (WDTN). Also scatterplots, Pearson’s correlation coefficients and linear
regression were used to study the relationships between modelled and measured values. All
the analysis were performed using Statistica version 11 (StatSoft, Inc. Tule, OK, USA).
Alpha was set at 0.05.
2.4. Risk assessment of atmospheric N deposition in the Natura 2000 network
Total atmospheric N deposition, including wet and dry deposition, estimated with EMEP and
CHIMERE models for 2008 was used to evaluate the risk for vegetation in the areas included
in the Spanish Natura 2000 designated areas. Only the Habitat Types of Community Interest
described in the Annex I of the Habitats Directive (EC, 2010) and included in the Natura
2000 network were considered. These habitats covered 34% of the 188,856.9 km2 included in
the Spanish Natura 2000 network. Empirical critical loads (CL) of N deposition recently
revised by Bobbink et al. (2010) were used for estimating N exceedances, calculated as
deposition minus CL (positive exceedance is taken to be undesirable). Aquatic and some
other habitats were excluded of the analysis: coastal and halophytic habitats, freshwater
habitats, rocky habitats and caves, and wetlands. Consequently, the area used for estimating
N exceedances occupied an extension of 57,675.7 km2. The CL assigned to each habitat type
was defined as the average of the range of CL reported by Bobbink and Hettelingh (2011) for
habitat type. When a N empirical CL was not defined for a habitat, the CL of similar or
equivalent habitats were used (these cases represented about 35% of the surface analyzed).
Table 2 shows the sub-groups of habitats included in the analysis and the corresponding N
empirical CL. Annex I includes the details of the N empirical CL applied to each vegetation
type. The scientific background supporting the empirical CL of nitrogen is described in detail
in Bobbink and Hettelingh (2011). The exceedance values and the area where the CL is
exceeded were estimated for each vegetation type. Similarly, for each habitat sub-group CL
exceedances were estimated weighting exceedances by the corresponding area.
3. Results and discussion
3.1. Comparison of measured and modelled data
Some metrics (Table 3) and scatterplots (Figure 2) were performed to compare the observed
values of annual N wet deposition with those estimated by the EMEP and CHIMERE air
quality models. A more detailed evaluation is currently being developed considering monthly
values (Vivanco et al., unpublished results).
In general, CHIMERE model seems to perform better for WDON than EMEP, since the
former obtained a better correlation and IOA and a lower error metrics (RMSE, MNB and
MNAE). Besides, scatterplots of model results vs. observations showed similar slope and
interception. In the case of WDRN, the CHIMERE model seems to provide worse estimates
than the EMEP model as deduced from the lower correlation and IOA, higher MNB and
MNAE (Table 3), and the regression functions and scatterplots (Figure 2). CHIMERE clearly
underestimates WDRN (with a MNB of -46%). Meanwhile, EMEP estimates showed a
satisfactory MNB, but MNAE was poor, not showing a clear trend to under- or
overprediction. For total wet deposition (WDTN), the correlation for the CHIMERE results is
better, while the EMEP model provides a higher IOA. However, CHIMERE clearly
subpredicts WDTN (with a MNB of -26%), mostly due to the strong underprediction of
WDRN. The values of RMSE y MNAE are very similar for both models. The RMSE metrics
indicated that the average difference between both model estimations for WDTN was about
0.2 kgN ha-1
y-1
.
Correlation coefficients of wet deposition values were 0.40 and 0.37 with EMEP, and 0.67
and 0.32 with CHIMERE, for WDON and WDRN, respectively. In general, the scatterplots
of modelled vs. measured values of N deposition (Figure 2) showed y-interception values
(‘a’) clearly above 0 kgN/ha and relatively low slopes (‘b’; 0.20-0.60) indicating that both
CHIMERE and EMEP models generally underestimate the high and overestimate the low N
deposition values.
Interestingly, annual precipitation estimates used by both models correlated better with
measured values than wet deposition. EMEP and CHIMERE models showed similar error
indices with some scattering and underestimation of high precipitation, but all the evaluation
metrics indicated an adequate model performance (high IOA values and relatively low values
of MNB and MNAE). When analysing the precipitation results for each measurement
network independently, the correlation and IOA was higher when comparing models
estimates with ICP Forest data than when considering the EMEP monitoring network or
Catalan sites. However the error expressed as RMSE was higher for the ICP Forest data since
both models underestimated the high precipitation values recorded in this network.
Both estimates of precipitation performed better for Spanish ICP Forest dataset than values
reported in a previous comparison with EMEP model for other European ICP Forest data
excluding Mediterranean area (Simpson et al., 2006a).This result could be explained by the
homogeneity of precipitation collectors used in Spain, compared to the variety of collectors
used by the different countries at the time when previous comparisons were performed
(Erisman et al., 2003).
Nitrogen wet deposition estimations were also compared with observed values for each
measurement network independently. Modelling N wet deposition in EMEP sites obtained
the best results, especially when using the EMEP model (Table 3), with correlation
coefficients in a range (0.60-0.76) similar to those reported for other European areas
(Simpson et al., 2006b). For the Spanish EMEP sites, EMEP model generally slightly
overestimated the WDTN observed values (MNB equal to 5%) while CHIMERE
underestimated them (MNB equal to 16%). Evaluation of EMEP model performance is
regularly assessed in EMEP reports (http://www.emep.int/) through comparing model
estimations with values measured in the EMEP monitoring network. A recent review reported
that EMEP model performance for the Mediterranean area was comparable to the one found
for other parts in Europe (Aas et al., 2010).
Model estimates of N wet deposition for the ICP Forest sites were similar or slightly worse
than for EMEP sites. In this case, both EMEP and CHIMERE underestimated wet N
deposition values of reduced and oxidized forms (Table 3). These underestimations can be
partially explained by the bulk samplers used by the ICP Forest network to collect wet
deposition, since some influence of dry deposition onto the funnels cannot be disregarded.
The proportion of dry deposition collected in the funnels depends on location, climate,
sampler aerodynamic characteristics and chemical component (Erisman et al., 2003). On the
other hand, wet-only samplers used in the EMEP sites might underestimate wet deposition
due to the delayed opening of the lid at the onset of precipitation, when the concentration of
compounds may be highest, and also because of the different aerodynamic characteristics of
the samplers (Erisman et al., 2003; Thimonier, 1998).
Model performance was quite poor when comparing with measurements obtained in the 5
monitoring Catalan sites. Correlations between modelled and measured deposition were not
significant and the IOA metrics were always below 0.50 for both model approaches, even if
precipitation estimations were acceptable (Table 3). While EMEP overestimated N wet
deposition in this area, and especially WDRN, CHIMERE underestimated the deposition
showing smaller errors than EMEP. Some variability is always expected when comparing
values modelled for an entire grid cell with measurements performed at single sites. The lack
of correlation in the Catalan region could be due to the small range of deposition values. The
complex topography of this region and the influence of local emissions might also explain the
poor model performance at small regional scale, as it is argued in previous studies for similar
regions (e.g. Simpson et al., 2006a).
Evaluation metrics and scatterplots indicate that estimations of total N wet deposition of both
models are within acceptable ranges of performance although results should be applied with
caution, especially at small regional scale. The higher resolution used with CHIMERE for
2008 estimations (10x10 km compared to 20x20 km resolution used for 2005-2007) did not
improve the overall estimation of wet deposition and all the evaluation metrics considered
were within the ranges of values observed for previous years (data not shown). Some studies,
such as Cuvelier et al. (2013) and Vivanco et al. (2008), showed that an increase in model
resolution did not lead to an improvement of model performance at rural sites for air
concentration. Similarly, different EMEP model runs with finer resolution found small
improvements in the estimations of air concentration of most acidifying and eutrophying
compounds, but similar performance for wet deposition and concentration in precipitation in
rural areas (Nyíri and Gauss, 2010). Increasing model resolution and a finer placement of
emission sources are expected to have more remarkable improvements in polluted than in
rural areas (Cuvelier et al., 2013; Hirst and Storvik, 2002; Nyíri and Gauss, 2010).
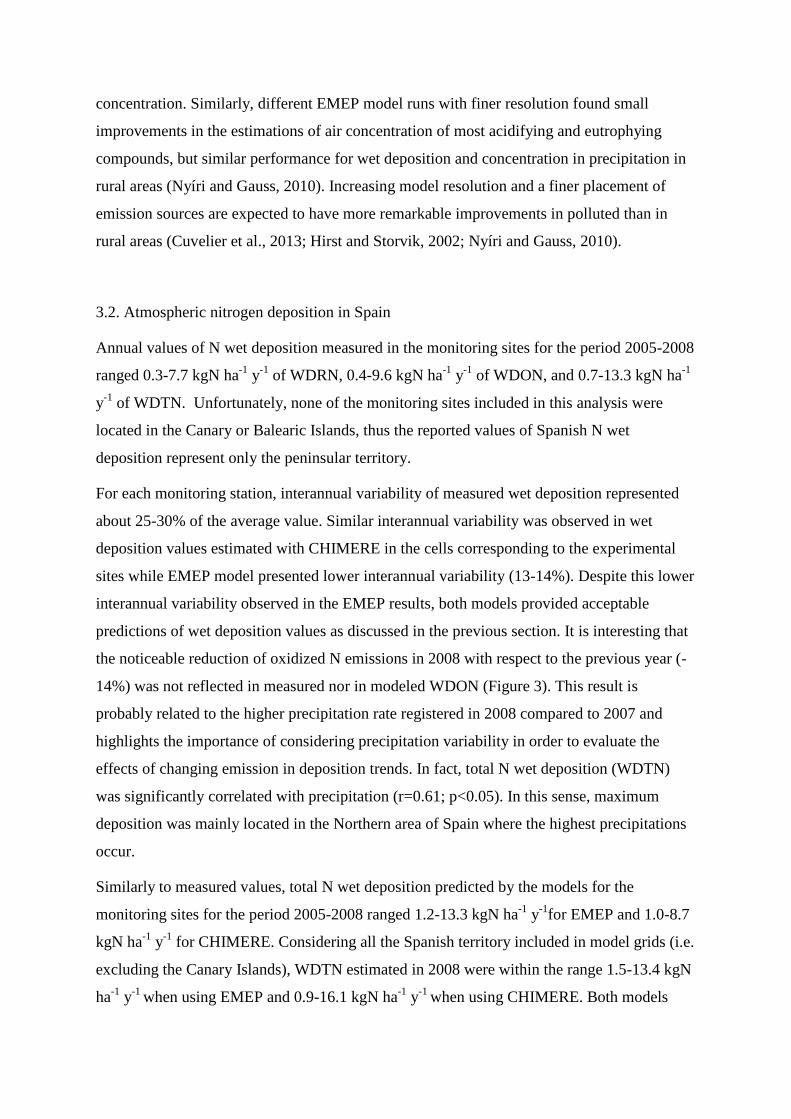
3.2. Atmospheric nitrogen deposition in Spain
Annual values of N wet deposition measured in the monitoring sites for the period 2005-2008
ranged 0.3-7.7 kgN ha-1
y-1
of WDRN, 0.4-9.6 kgN ha-1
y-1
of WDON, and 0.7-13.3 kgN ha-1
y-1
of WDTN. Unfortunately, none of the monitoring sites included in this analysis were
located in the Canary or Balearic Islands, thus the reported values of Spanish N wet
deposition represent only the peninsular territory.
For each monitoring station, interannual variability of measured wet deposition represented
about 25-30% of the average value. Similar interannual variability was observed in wet
deposition values estimated with CHIMERE in the cells corresponding to the experimental
sites while EMEP model presented lower interannual variability (13-14%). Despite this lower
interannual variability observed in the EMEP results, both models provided acceptable
predictions of wet deposition values as discussed in the previous section. It is interesting that
the noticeable reduction of oxidized N emissions in 2008 with respect to the previous year (-
14%) was not reflected in measured nor in modeled WDON (Figure 3). This result is
probably related to the higher precipitation rate registered in 2008 compared to 2007 and
highlights the importance of considering precipitation variability in order to evaluate the
effects of changing emission in deposition trends. In fact, total N wet deposition (WDTN)
was significantly correlated with precipitation (r=0.61; p<0.05). In this sense, maximum
deposition was mainly located in the Northern area of Spain where the highest precipitations
occur.
Similarly to measured values, total N wet deposition predicted by the models for the
monitoring sites for the period 2005-2008 ranged 1.2-13.3 kgN ha-1
y-1
for EMEP and 1.0-8.7
kgN ha-1
y-1
for CHIMERE. Considering all the Spanish territory included in model grids (i.e.
excluding the Canary Islands), WDTN estimated in 2008 were within the range 1.5-13.4 kgN
ha-1
y-1
when using EMEP and 0.9-16.1 kgN ha-1
y-1
when using CHIMERE. Both models
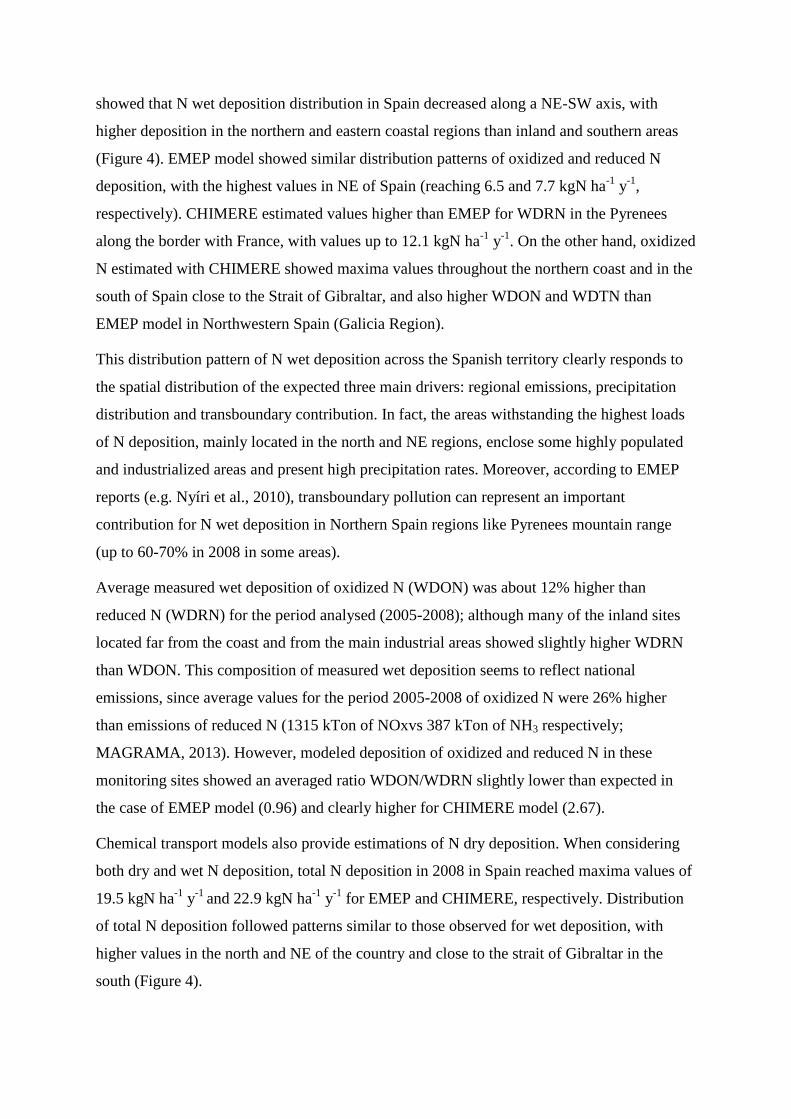
showed that N wet deposition distribution in Spain decreased along a NE-SW axis, with
higher deposition in the northern and eastern coastal regions than inland and southern areas
(Figure 4). EMEP model showed similar distribution patterns of oxidized and reduced N
deposition, with the highest values in NE of Spain (reaching 6.5 and 7.7 kgN ha-1
y-1
,
respectively). CHIMERE estimated values higher than EMEP for WDRN in the Pyrenees
along the border with France, with values up to 12.1 kgN ha-1
y-1
. On the other hand, oxidized
N estimated with CHIMERE showed maxima values throughout the northern coast and in the
south of Spain close to the Strait of Gibraltar, and also higher WDON and WDTN than
EMEP model in Northwestern Spain (Galicia Region).
This distribution pattern of N wet deposition across the Spanish territory clearly responds to
the spatial distribution of the expected three main drivers: regional emissions, precipitation
distribution and transboundary contribution. In fact, the areas withstanding the highest loads
of N deposition, mainly located in the north and NE regions, enclose some highly populated
and industrialized areas and present high precipitation rates. Moreover, according to EMEP
reports (e.g. Nyíri et al., 2010), transboundary pollution can represent an important
contribution for N wet deposition in Northern Spain regions like Pyrenees mountain range
(up to 60-70% in 2008 in some areas).
Average measured wet deposition of oxidized N (WDON) was about 12% higher than
reduced N (WDRN) for the period analysed (2005-2008); although many of the inland sites
located far from the coast and from the main industrial areas showed slightly higher WDRN
than WDON. This composition of measured wet deposition seems to reflect national
emissions, since average values for the period 2005-2008 of oxidized N were 26% higher
than emissions of reduced N (1315 kTon of NOxvs 387 kTon of NH3 respectively;
MAGRAMA, 2013). However, modeled deposition of oxidized and reduced N in these
monitoring sites showed an averaged ratio WDON/WDRN slightly lower than expected in
the case of EMEP model (0.96) and clearly higher for CHIMERE model (2.67).
Chemical transport models also provide estimations of N dry deposition. When considering
both dry and wet N deposition, total N deposition in 2008 in Spain reached maxima values of
19.5 kgN ha-1
y-1
and 22.9 kgN ha-1
y-1
for EMEP and CHIMERE, respectively. Distribution
of total N deposition followed patterns similar to those observed for wet deposition, with
higher values in the north and NE of the country and close to the strait of Gibraltar in the
south (Figure 4).
Dry deposition estimated with EMEP in 2008 represented 14-59% of total N deposition with
an average value of 40 %. In the case of CHIMERE estimations, dry deposition represented
11-83% of total N deposition with an average value of 54 %. Previous studies performed in
Spain have calculated that dry deposition represented 62-67% of total N deposition in
Quercus ilex forests (Rodá et al., 2002) and 40-75% in Pinus halepensis forests (Sanz et al.,
2002) in NE and eastern Spain respectively. Values estimated by the models on those cells of
the grid where monitoring plots are located in Q. ilex or P. halepensis forests, showed that
39% with EMEP and 54% with CHIMERE of N total deposition was associated to dry
deposition. Although data from different years are compared, these results might suggest that
the importance of dry deposition could be underestimated, particularly by the EMEP model,
for the Mediterranean area. However little information is available and more detailed studies
are needed to characterize dry deposition in Spanish ecosystems under typically
Mediterranean climate conditions.
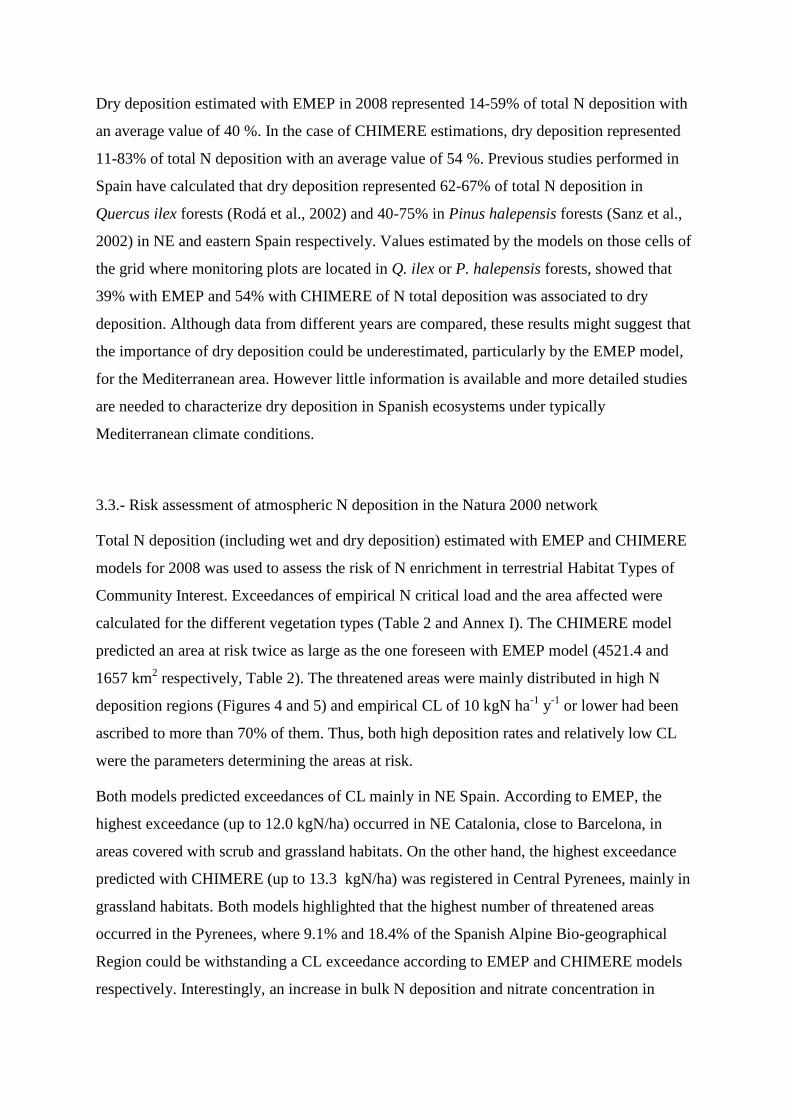
3.3.- Risk assessment of atmospheric N deposition in the Natura 2000 network
Total N deposition (including wet and dry deposition) estimated with EMEP and CHIMERE
models for 2008 was used to assess the risk of N enrichment in terrestrial Habitat Types of
Community Interest. Exceedances of empirical N critical load and the area affected were
calculated for the different vegetation types (Table 2 and Annex I). The CHIMERE model
predicted an area at risk twice as large as the one foreseen with EMEP model (4521.4 and
1657 km2 respectively, Table 2). The threatened areas were mainly distributed in high N
deposition regions (Figures 4 and 5) and empirical CL of 10 kgN ha-1
y-1
or lower had been
ascribed to more than 70% of them. Thus, both high deposition rates and relatively low CL
were the parameters determining the areas at risk.
Both models predicted exceedances of CL mainly in NE Spain. According to EMEP, the
highest exceedance (up to 12.0 kgN/ha) occurred in NE Catalonia, close to Barcelona, in
areas covered with scrub and grassland habitats. On the other hand, the highest exceedance
predicted with CHIMERE (up to 13.3 kgN/ha) was registered in Central Pyrenees, mainly in
grassland habitats. Both models highlighted that the highest number of threatened areas
occurred in the Pyrenees, where 9.1% and 18.4% of the Spanish Alpine Bio-geographical
Region could be withstanding a CL exceedance according to EMEP and CHIMERE models
respectively. Interestingly, an increase in bulk N deposition and nitrate concentration in

headwater streams has been detected for the period 1997-2007 in the Aigüestortes i Estany
de Sant Maurici National Park in the Central Pyrenees (2236 m.a.s.l.; Camarero and Catalán,
2012),suggesting a possible N saturation in these high altitude catchments Although other
climate factors should be taken into account as potential drivers of nitrate leaching (Baron et
al., 2009), the N saturation of alpine catchments in Central Pyrenees seems to be a
generalized process and it could be widespread in the Pyrenees System (Camarero and Aniz,
2010). The CHIMERE model also pointed out other areas spread through the Spanish
territory where exceedances of N empirical CL could be occurring, such as mountain areas
north of Madrid region and Eastern Coast, on the Cantabrian Range and near the Strait of
Gibraltar. The higher resolution used in CHIMERE simulation could partially explain the
detection of more areas at risk of N enrichment.
‘Natural and semi-natural grasslands’ is the habitat group most threatened by N deposition,
since an average from 9.1 to 15.5% (depending on the model approach) of the assessed
surface is at risk and presents some subgroups such as ‘natural grasslands’ with up to 42-71%
of the area affected (Table 2). Moreover, the ‘siliceous Pyrenean Festuca eskia grasslands’
within this sub-group is the habitat type at highest risk within Spanish Natura 2000 network,
with a threatened surface from 76 to 100% of the total assessed (Annex I). For ‘natural and
semi-natural grasslands’ the CHIMERE model predicts an averaged CL exceedance above 7
kgN ha-1
. The habitats in this group were assigned relatively low CL, but most of them were
ascribed to its specific habitat type and had a good reliability (#), according to Bobbink and
Hettelingh (2011) (Annex 1). The major uncertainty regarding the potential threat to
Pyrenean grasslands, and other grasslands located in mountain areas, is that no monitoring
site was able to test the performance of the models in this alpine region. Although both
models obtained acceptable approximations (data not shown) to N wet deposition in the
closest monitoring sites to Pyrenean grasslands (Figure 1), these monitoring sites are located
at altitudes below threatened habitats. Moreover, other habitat sub-groups typical of
mountains areas (Table 2) like ‘temperate mountainous coniferous forest’ (e.g. Pinus
uncinata or Abies pinsapo forests) and habitat types like ‘Luzulo-Fagetum beech forests’
(Annex I) presented a high percentage of their surface area at risk. Thus, further deployment
of air quality monitoring networks should be planned in Spanish mountain areas for assessing
the risk of air pollution to these particularly rich and valuable ecosystems.
The EMEP model also predicted an averaged exceedance of the N empirical CL above 4 kgN
ha-1
in ‘Mediterranean sclerophyllous forests’ (Table 2), although the area affected was only

around 5%. Those sclerophyllous forests experiencing N exceedances are mainly located in
the NE Spain, close to Barcelona, where high N atmospheric deposition has been reported
(Rodà et al., 2002). Increases of NO3- concentration in streamwaters in undisturbed
catchments in this area have been detected, being considered a sign of the onset of
eutrophication (Àvila and Rodà, 2012). However, these ecosystems are considered still far
from N saturation because most of the deposited N is retained within the ecosystem (Àvila
and Rodà, 2012). An empirical CL of 15 kgN ha-1
y-1
was ascribed to these sclerophyllous
forests for prevention of nitrate leaching from the ecosystem following expert criteria
(Bobbink and Hettelingh, 2011), but more information is needed to define CL for the
protection of changes in vegetation or other effects that could appear before N saturation
(Emmet, 2007). In this sense, an empirical CL of 5.5 kgN ha-1
y-1
has been proposed for the
protection of epiphytic lichens in a similar ecosystem in California (Fenn et al., 2010).
This analysis represents the first approach to assess the risk of N enrichment for Spanish
ecosystems. Although further investigation is urgently needed to confirm the suitability of N
empirical critical loads used, this study points out that effects of N enrichment could be
already occurring in some natural ecosystems, particularly in grasslands and forest of
mountain areas located in the north (Pyrenees, Cantabrian Range) and other habitats located
close to high emission sources such as big cities (Barcelona, Madrid), industrial areas located
in the east coast or the Strait of Gibraltar. Interestingly, exceedances of N critical loads were
related with high WDON more often than with high WDRN or dry deposition rates.
4. Conclusions
This performance of the EMEP and CHIMERE air quality models to estimate N wet
deposition in Spain showed that both models provided acceptable estimates, particularly for
oxidized N, although results should be applied with caution especially at small regional scale.
This result is especially relevant in a country like Spain where several mountains ranges cross
the territory. Nitrogen wet deposition in Spain reached maxima measured values up to 13.3
kgN ha-1
y-1
for the period 2005-2008. Both models estimated higher N wet deposition in the
north and NE Spain. While measured oxidized N wet deposition was on average 12% higher
than reduced N, CHIMERE model overestimated the ratio between oxidized and reduced N
wet deposition. Adding dry deposition, total N deposition in 2008 in Spain reached maxima
values of 19.5 kgN ha-1
y-1
and 22.9 kgN ha-1
y-1
calculated with EMEP and CHIMERE
respectively. Distribution of total N deposition followed similar patterns observed for wet
deposition. Total atmospheric N deposition exceeded empirical critical loads proposed for the
protection of terrestrial Habitat Types of Community Interest included in the Natura 2000 net.
The habitats presenting higher risk of N effects were the natural and semi-natural grasslands
and forest of mountain areas located in the north (Pyrenees, Cantabrian Range). This result
highlights the need to extend air quality networks and include some monitoring stations in
mountains areas. Other habitats showing exceedances of N empirical critical loads were some
forests and grasslands located close to high emission sources such as big cities (Barcelona,
Madrid), industrial areas located in the east coast or the Strait of Gibraltar. This preliminary
analysis indicates that atmospheric N deposition should be considered as a factor that could
be affecting the biodiversity and health of the natural ecosystems in Spain. More detailed
investigations should be carried out to quantify these effects and to explore possible
management practices that might ameliorate these effects.
Acknowledgements
This research was funded by the European ECLAIRE (Effects of climate change on air
pollution impacts and response strategies for European ecosystems) project FP7-ENV, the
Spanish projects Consolider Montes CSD2008-00040, CGL2009-13188-C03-02 and
Comunidad de Madrid-Agrisost project. This study was also supported by the Spanish
Ministry of Agriculture, Food and Environment. The authors would like to specially
acknowledge Eugenio Sánchez García for his help with GIS processing and Fernando Martín
Llorente for his helpful checking and advices.

References
1. Aas W, Solberg S, Gauss M, Simpson D. (2010). The Mediterranean Region. In:
Transboundary Acidification, Eutrophication and Ground Level Ozone in Europe in 2008.
EMEP Status Report 2010. The Norwegian Meteorological Institute, Oslo, Norway, pp. 99-
104
2. Ariño AH, Gimeno BS, Pérez de Zabalza A, Ibáñez R, Ederra A, Santamaría JM (2011)
Influence of nitrogen deposition on plant biodiversity at Natura 2000 sites in Spain. In:
Nitrogen Deposition and Natura 2000. Science & practice in determining environmental
impacts. pp. 140-146
3. Àvila A, Rodà F (2002)Assessing decadal changes in rainwater alkalinity at a rural
Mediterranean site in the Montseny Mountains (NE Spain). Atmospheric Environment 36:
2881–2890
4. Àvila A, Rodà F (2012) Changes in atmospheric deposition and streamwater chemistry over
25 years in undisturbed catchments in a Mediterranean mountain environment. Science of the
Total Environment 434: 18–27
5. Àvila A, Molowny-Horas R, Gimeno BS, Peñuelas J (2010) Analysis of decadal time series
in wet N concentrations at five rural sites in NE Spain. Water, Air and Soil Pollution 207 (1-
4): 123-138
6. Baron JS, Schmidt TM, Hartman MD (2009) Climate-induced changes in high elevation
stream nitrate dynamics. Global Change Biology 15: 1777-1789
7. Bessagnet B, Hodzic A, Vautard R, Beekmann M, Rouil L, Rosset R (2004) Aerosol
modelling with CHIMERE – first evaluation at continental scale. Atmospheric Environment
38(18): 2803–2817
8. Bleeker A, Hicks WK, Dentener E, Galloway J, Erisman JW (2011) N deposition as a threat
to the World’s protected areas under the Convention on Biological Diversity. Environmental
Pollution 159(10): 2280-2288
9. Bobbink R, Hettelingh JP (eds.) (2011) Review and revision of empirical critical loads and
dose-response relationships, Coordination Centre for Effects, National Institute for Public
Health and the Environment (RIVM), www.rivm.nl/cce. 244 pp.
10. Bobbink R, Hicks K, Galloway J, Spranger T, Alkemade R, Ashmore M, Bustamante M,
Cinderby S, Davidson E, Dentener F, Emmett B, Erisman JW, Fenn M, Gilliam F, Nordin A,

Pardo L, de Vries W (2010) Global assessment of nitrogen deposition effects on terrestrial
plant diversity: a synthesis. Ecological Applications 20(1): 30-59
11. Camarero L, Aniz M (2010) Surface waters monitoring in the LTER-Aigüestortes node:
trends and indicators of the impacts of N and S atmospheric deposition. Ecosistemas 19(2):
24-41 (in spanish)
12. Camarero L, Catalan J (2012) Atmospheric phosphorus deposition may cause lakes to revert
from phosphorus limitation back to nitrogen limitation. Nature Communications 3(1118)
13. Chang JC, Hanna SR (2004) Air quality model performance evaluation. Meteorology and
Atmospheric Physics 87: 167-196
14. Cuvelier C, Thunis P, Karam D, Schaap M, Hendriks C, Kranenburg R, Fagerli H, Nyiri A,
Simpson D, Wind P, Schulz M, Bessagnet B, Colette A, Terrenoire E, Rouïl L, Stern R, Graff
A, Baldasano JM, Pay MT (2013) ScaleDep: Performance of European chemistry-transport
models as function of horizontal special resolution. EMEP Technical report 1/2013. 63 pp.
15. Dentener F, Drevet J, Lamarque JF, Bey I, Eickhout B, Fiore AM, Hauglustaine D, Horowitz
LW, Krol M, Kulshrestha UC, Lawrence M, Galy-Lacaux C, Rast S, Shindell D, Stevenson
D, Van Noije T, Atherton C, Bell N, Bergman D, Butler T, Cofala J, Collins B, Doherty R,
Ellingsen K, Galloway J, Gauss M, Montanaro V,.Muller JF, Pitari G, Rodriguez J,
Sanderson M, Solmon F, Strahan S, Schultz M, Sudo K, Szopa S, Wild O (2006) Nitrogen
and sulfur deposition on regional and global scales: A multi-model evaluation. Global
Biogeochemical Cycles 20(4): GB4003
16. Dise NB, Ashmore M, Belyazid S, Bleeker A, Bobbink B, de Vries W, Erisman JW,
Spranger T, Stevens CJ, van den Berg L (2011) Nitrogen as a threat to European terrestrial
biodiversity. En: Sutton MA et al. (eds). The European Nitrogen Assessment. Sources, effects
and Polcy Perspectives, Cambridge University Press, pp. 463-494
17. EEA (2011) Air quality in Europe – 2011 Report. European Environment Agency Technical
Report 12/2011. Available on-line at http://www.eea.europa.eu
18. EEA (2013) Air quality in Europe – 2013 Report. European Environment Agency Technical
Report No 9/2013. Available on-line at http://www.eea.europa.eu
19. Emmett AB (2007) Nitrogen saturation of terrestrial ecosystems: Some recent findings and
their implications for our conceptual framework. Water, Soil and Air Pollution: Focus 7: 99-
109

20. Erisman JW, Mols H, Fonteijn P, Geusebroek M, Draaijers G, Bleeker A, van der Veen D
(2003) Field intercomparison of precipitation measurements performed within the framework
of the Pan European Intensive Monitoring Program of EU/ICP Forest. Environmental
Pollution 125: 139–155
21. Fagerli H, Gauss M, Benedictow A, Griesfeller J, Jonson JE, Nyiri A, Schulz M, Simpson D,
Steensen BM, Tsyro S, Valdebenito A, Wind P, Aas W, Hjellbrekke AG, Mareckova K,
Wankmüller R, Iversen T, Kirkevag A, Seland O, Vieno M (2011) Transboundary
acidification, eutrophication and ground level ozone in Europe in 2009. EMEP Status Report
1/2011. Norwegian Meteorological Institute, Oslo. 127 pp.
22. Fenn ME, Allen EB, Weiss SB, Jovan S, Geiser LH, Tonnesen GS, Johnson RF, Rao LE,
Gimeno BS, Yuani F, Meixner T, Bytnerowicz A (2010) Nitrogen critical loads and
management alternatives for N-impacted ecosystems in California. Journal of Environmental
Management 91: 2404-2423
23. Galloway JN, Townsend AR, Erisman JW, Bekunda M, Cai ZC, Freney JR, Martinelli LA,
Seitzinger SP, Sutton MA (2008) Transformation of the nitrogen cycle: Recent trends,
questions, and potential solutions. Science 320(5878): 889-892
24. Hirst D, Storvik G (2003) Estimating critical load exceedance by combining the EMEP
model with data from measurement stations. Science of the Total Environment 310:163–170
25. EC (2010). Council Directive 92/43/EEC of 21 May 1992 on the conservation of natural
habitats and of wild fauna and flora. European Commission. Consolidated version 1.1. 2007.
26. Lorenz M, Becher G (eds.) (2012) Forest Condition in Europe, 2012. Technical Report of
ICP Forests. Work Report of the Thünen Institute for World Forestry 2012/1. ICP Forests,
Hamburg. 165 pp.
27. MAGRAMA (2013). Inventario de Emisiones a la Atmósfera de España. Edición 2013 (serie
1990-2011). Sumario de resultados de acidificadores, eutrofizadores y precursores del ozono.
Available on-line at www.magrama.gob.es
28. Menut L, Bessagnet B, Khvorostyanov D, Beekmann M, Blond N, Colette A, Coll I, Curci G,
Foret G, Hodzic A, Mailler S, Meleux F, Monge J-L, Pison I, Siour G, Turquety S, Valari M,
Vautard R, Vivanco MG (2013) CHIMERE 2013: a model for regional atmospheric
composition modeling. Geoscientific Model Development 6(4): 981-1028

29. Mosello R, Bianchi m, Geiss H, Marchetto A, Serrini G, Serrini Lanza G, Tartari GA,
Muntau H (1998) AQUACON-MedBas Subproject No. 6. Acid rain analysis.
Intercomparison 1/97. Joint Res. Centre European Commission, Rep. EUR 18135 EN, 65 pp.
30. Myers N, Mittermeier RA, Mittermeier CG, da Fonseca GA, Kent J (2000) Biodiversity
hotspots for conservation priorities. Nature 403(6772): 853-858
31. Nyíri Á, Gauss M (2010) Improved resolution in the EMEP model. In: Transboundary
Acidification, Eutrophication and Ground Level Ozone in Europe in 2008. EMEP Status
Report 2010. The Norwegian Meteorological Institute, Oslo, Norway, pp. 99-104
32. Nyíri Á, Gauss M, Klein H (2010) Transboundary air pollution by main pollutants (S, N, O3)
and PM in 2010. Spain. MSC-W Data Note 1/2010. ISSN 1890-0003. 24 pp.
33. Ochoa-Hueso R, Allen EB, Branquinho C, Cruz C, Dias T, Fenn ME, Manrique E, Pérez-
Corona ME., Sheppard LJ, Stock WD (2011) Nitrogen deposition effects on Mediterranean-
type ecosystems: An ecological assessment. Environmental Pollution 159(10): 2265-2279
34. Ochoa-Hueso R, Stevens CJ, Ortiz-Llorente MJ, Manrique E (2013) Soil chemistry and
fertility alterations in response to N application in a semiarid Mediterranean shrubland.
Science of the Total Environment 452-453:78-86
35. Peñuelas J, Filella I (2001) Herbaria century record of increasing eutrophication in Spanish
terrestrial ecosystems. Global Change Biology 7: 427-433
36. Rockström J, Steffen W, Noone K, Persson Å, Chapin FS, Lambin EF,Lenton TM, Scheffer
M, Folke C, Schellnhuber HJ, Nykvist B, de Wit CA, Hughes T, van der Leeuw S, Rodhe H,
Sörlin S, Snyder PK, Costanza R, Svedin U, Falkenmark M, Karlberg L, Corell RW, Fabry
VJ, Hansen J, Walker B, Liverman D, Richardson K, Crutzen P, Foley JA (2009). A safe
operating space for humanity. Nature, 461(7263), 472-475.
37. Rodà F, Àvila A, Rodrigo A (2002) Nitrogen deposition in Mediterranean forests.
Environmental Pollution 118: 205-213
38. Sanz MJ, Carratalá A, Gimeno C, Millán MM (2002) Atmospheric nitrogen deposition on the
east coast of Spain: relevance of dry deposition in semi-arid Mediterranean regions.
Environmental Pollution 118: 259-272
39. Simpson D, Fagerli H, Hellsten S, Knulst JC, Westling O (2006a) Comparison of modelled
and monitored deposition fluxes of sulphur and nitrogen to ICP-forest sites in Europe.
Biogeosciences 3: 337-355
40. Simpson D, Butterbach-Bahl K, Fagerl, H, Kesik M, Skiba U, Tang S. (2006b) Deposition
and emissions of reactive nitrogen over European forests: a modelling study. Atmospheric
Environment 40(29): 5712-5726
41. Simpson et al., 2011 (modeled data for Spain are lower than European values)
42. Simpson, D, Benedictow, A, Berge, H, Bergstrom, R, Emberson, LD; Fagerli, H; Flechard,
CR; Hayman, GD; Gauss, M ; Jonson, JE; Jenkin, ME; Nyiri, A; Richter, ; Semeena, VS;
Tsyro, S; Tuovinen, JP; Valdebenito, A; Wind, P. (2012). The EMEP MSC-W chemical
transport model - technical description. Atmospheric Chemistry and Physics 12(16): 7825-
7865
43. Sutton MA, Billen G, Bleeker A, Erisman JW, Grennfelt P, van Grinsven H, Grizzetti B,
Howard CM, Leip A (2011) The European nitrogen Assessment. Technical Summary. En:
Sutton MA et al. (eds). The European Nitrogen Assessment. Sources, effects and Polcy
Perspectives, Cambridge University Press, 2011, pp. xxxv-li
44. Thimonier A. (1998) Measurement of atmospheric deposition under forest canopies: some
recommendations for equipment and sampling design. Environmental Monitoring and
Assessment 52: 353–387
45. UBA (2004). Manual on methodologies and criteria for modelling and mapping of critical
loads and levels and air pollution effects, risks and trends. Umweltbundesamt, Dessau,
Germany. Available on-line at http://www.icpmapping.org
46. Vestreng V, Breivik K, Adams M, Wagener A, Goodwin J, Rozovskkaya O, Pacyna JM
(2005) Inventory Review 2005, Emission Data Reported to LRTAP Convention and NEC
Directive, Initial review of HMs and POPs, Technical Report MSC-W 1/2005.
47. Vivanco MG, Correa M, Azula O, Palomino I, Martín F (2008). Influence of model
resolution on ozone predictions over Madrid area (Spain) The 2008 International Conference
on Computational Science and Applications (ICCSA 2008). Perugia (Italy) Lecture Notes in
Computing Science LNCS 5072. Vol. I, Pp. 165-178, Editorial: Springer ISBN-10: 3-540-
69838-8 Germany.
48. Vivanco MG, Palomino I, Vautard R, Bessagnet B, Martín F, Menut L, Jiménez S (2009)
Multi-year assessment of photochemical air quality simulation over Spain. Environmental
Modelling & Software 24: 63-73
49. Whitfield C, Strachan I, Aherne J, Dirnböck T, Dise N, Franzaring J, Hall J, Hens M, van
Hinsberg A, Mansat A, Martins-Louçao MA, Mohaupt-Jahr B, Nielsen KE, Pesch R, Rowe
E, Santamaría JM (2011) Assessing Nitrogen Deposition Impacts on Conservation Status. In
Hicks, et al. (eds.) Nitrogen Deposition and Natura 2000: Science and practice in
determining environmental impacts. COST729/Nine/ESF/CCW/JNCC/SEI Workshop
proceedings. COST. xxx pp.
50. Yu S, Eder B, Dennis R, Schwartz SH (2006) New unbiased symmetric metrics for
evaluation of air quality models. Atmospheric Science Letters 7: 26-34
Table 1. Definition of the metrics used for evaluating model performance. N: pairs of
modelled (Mi) and observed (Oi) depositions . corresponds to the arithmetic mean of
observed values. The index i is over time series and over all the locations in the domain.
Index of agreement
Mean normalized bias
Mean normalized absolute error
Root mean square error
O
2
2
1OOOP
OMIOA
ii
ii
111
i
i
i
ii
O
M
NO
OM
NMNB
i
ii
O
OM
NMNAE 1
2
121 )( iiN
OMRMSE

Table 2. Surface area of habitat sub-groups from Annex 1 of Habitats Directive assessed for exceedance of empirical critical loads (CLexc) and
results, according EMEP and CHIMERE modelizations.
Sub-groups from Annex I
of Habitats Directive
Area assessed
(km2)
CL
(kgN ha-1
y-1
)
EMEP CLexc
area (km2 (%))
CHIMERE
CLexcarea
(km2 (%))
EMEP CLexc
Avg. (kg/ha)
CHIMERE
CLexcAvg. (kg/ha)
21. Sea dunes of the Atlantic coast 21.8 11.5 – 15.0 n.e. 0.04 (0.2) n.e. 4.21
22. Sea dunes of the Mediterranean coast 259.4 9.0 – 11.5 6.1 (2.3) 10.4 (4.0) 2.01 2.14
4. Temperateheath and scrub 23 870.9 10.0 – 15.0 280.8 (1.2) 2204.3 (9.2) 2.49 1.92
51. Sub-Med. and temperate sclerophyllous scrub 1555.9 10.0 – 25.0 1.9 (0.1) 242.4 (15.6) 2.36 1.30
52. Mediterraneanarborescent matorral 3857.0 25.0 n.e. n.e. n.e. n.e.
53. Thermo-Mediterranean and pre-steppe brush 5547.6 25.0 n.e. n.e. n.e. n.e.
54. Phryganascrub 0.2 15.0 n.e. n.e. n.e. n.e.
61. Natural grasslands 1920.9 7.5 – 20.0 807.6 (42.0) 1373.3 (71.5) 1.73 4.24
62. Semi-natural dry grasslands and scrubland
facies
4809.0 12.5 – 20.0 n.e. 23.3 (0.5) n.e. 1.04
63. Sclerophillous grazed forests (dehesas) 2336.2 20.0 n.e. n.e. n.e. n.e.
64. Semi-natural tall-herb humid meadows 477.6 7.5 – 20.0 77.62 (16.3) 113.0 (23.7) 3.43 5.30
65. Mesophile grasslands 125.3 25.0 n.e. n.e. n.e. n.e.
71. Sphagnum acid bog 0.001 12.5 n.e. 0.001 (92.1) n.e. 1.75
72. Calcareous fens 76.5 22.5 n.e. n.e. n.e. n.e.
91. Forest of temperate Europe 1757.6 15.0 – 17.5 79.7 (4.5) 117.4 (6.7) 3.82 1.00
92. Med. deciduous forests 2770.2 15.0 – 25.0 35.7 (1.3) 30.3 (1.1) 3.86 1.43
93. Mediterranean sclerophyllous forests 5303.3 15.0 – 17.5 290.2 (5.5) 241.5 (4.6) 4.04 2.59
94. Temperate mountainous coniferous forests 119.0 10.0 50.9 (42.8) 107.1 (90.0) 3.48 2.96
95. Med. and Macaron. mountainous coniferous
forests
1339.7 9.0 – 15.0 26.5 (2.0) 58.3 (4.4) 1.56 0.69
TOTAL AREA 57675.7 7.5 – 25.0 1657.0 (2.9) 4521.4 (7.8)
CLexc area (km2 (%)): Sum of areas with exceedance of CL expressed in total area (km
2) and in percentage (%) of area assessed for each sub-group.
n.e.: None exceedance was found within this sub-group.
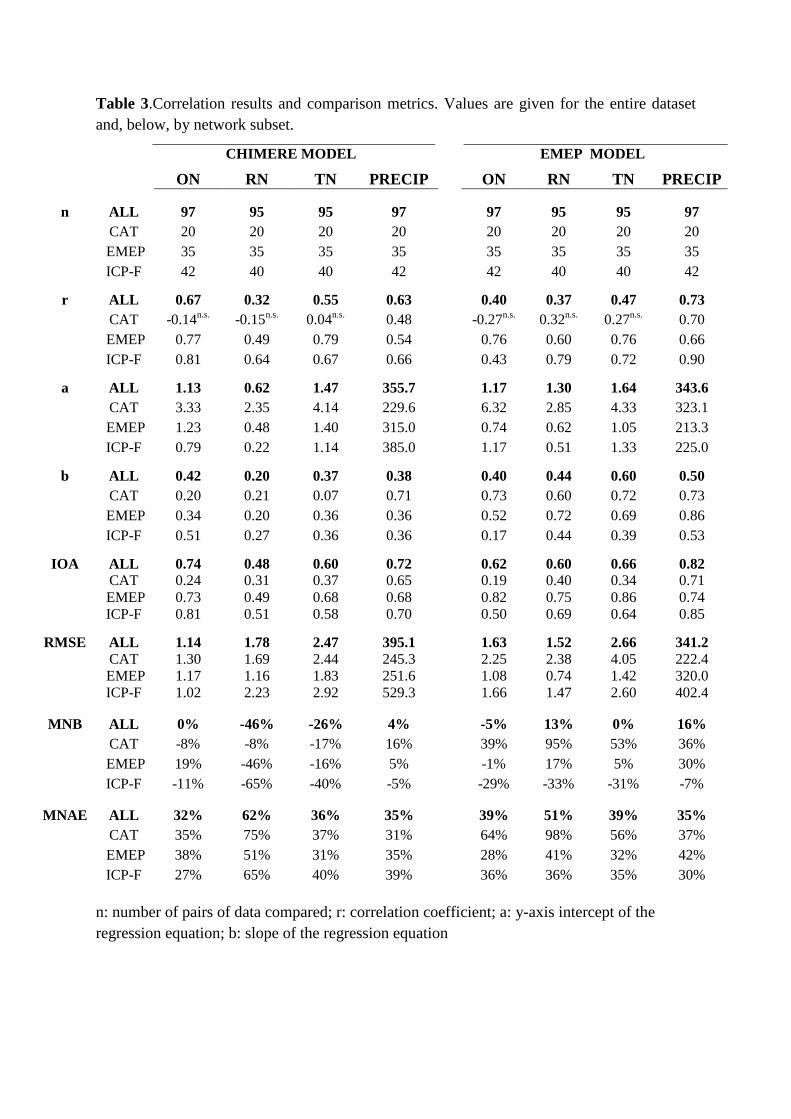
Table 3.Correlation results and comparison metrics. Values are given for the entire dataset
and, below, by network subset.
CHIMERE MODEL EMEP MODEL
ON RN TN PRECIP ON RN TN PRECIP
n ALL 97 95 95 97 97 95 95 97
CAT 20 20 20 20 20 20 20 20
EMEP 35 35 35 35 35 35 35 35
ICP-F 42 40 40 42 42 40 40 42
r ALL 0.67 0.32 0.55 0.63 0.40 0.37 0.47 0.73
CAT -0.14n.s.
-0.15n.s.
0.04n.s.
0.48 -0.27n.s.
0.32n.s.
0.27n.s.
0.70
EMEP 0.77 0.49 0.79 0.54 0.76 0.60 0.76 0.66
ICP-F 0.81 0.64 0.67 0.66 0.43 0.79 0.72 0.90
a ALL 1.13 0.62 1.47 355.7 1.17 1.30 1.64 343.6
CAT 3.33 2.35 4.14 229.6 6.32 2.85 4.33 323.1
EMEP 1.23 0.48 1.40 315.0 0.74 0.62 1.05 213.3
ICP-F 0.79 0.22 1.14 385.0 1.17 0.51 1.33 225.0
b ALL 0.42 0.20 0.37 0.38 0.40 0.44 0.60 0.50
CAT 0.20 0.21 0.07 0.71 0.73 0.60 0.72 0.73
EMEP 0.34 0.20 0.36 0.36 0.52 0.72 0.69 0.86
ICP-F 0.51 0.27 0.36 0.36 0.17 0.44 0.39 0.53
IOA ALL 0.74 0.48 0.60 0.72 0.62 0.60 0.66 0.82
CAT 0.24 0.31 0.37 0.65 0.19 0.40 0.34 0.71
EMEP 0.73 0.49 0.68 0.68 0.82 0.75 0.86 0.74
ICP-F 0.81 0.51 0.58 0.70 0.50 0.69 0.64 0.85
RMSE ALL 1.14 1.78 2.47 395.1 1.63 1.52 2.66 341.2
CAT 1.30 1.69 2.44 245.3 2.25 2.38 4.05 222.4
EMEP 1.17 1.16 1.83 251.6 1.08 0.74 1.42 320.0
ICP-F 1.02 2.23 2.92 529.3 1.66 1.47 2.60 402.4
MNB ALL 0% -46% -26% 4% -5% 13% 0% 16%
CAT -8% -8% -17% 16% 39% 95% 53% 36%
EMEP 19% -46% -16% 5% -1% 17% 5% 30%
ICP-F -11% -65% -40% -5% -29% -33% -31% -7%
MNAE ALL 32% 62% 36% 35% 39% 51% 39% 35%
CAT 35% 75% 37% 31% 64% 98% 56% 37%
EMEP 38% 51% 31% 35% 28% 41% 32% 42%
ICP-F 27% 65% 40% 39% 36% 36% 35% 30%
n: number of pairs of data compared; r: correlation coefficient; a: y-axis intercept of the
regression equation; b: slope of the regression equation

Figure 1 Monitoring sites with observed wet deposition of nitrogen included in this study.

Figure 2. Scatterplots and regression line for observed-modelled deposition values at
monitoring sites.
▲EMEP monitoring sites
□ICP-Forests Level II monitoring sites
♦ Catalan monitoring sites
CHIMERE MODEL EMEP MODEL
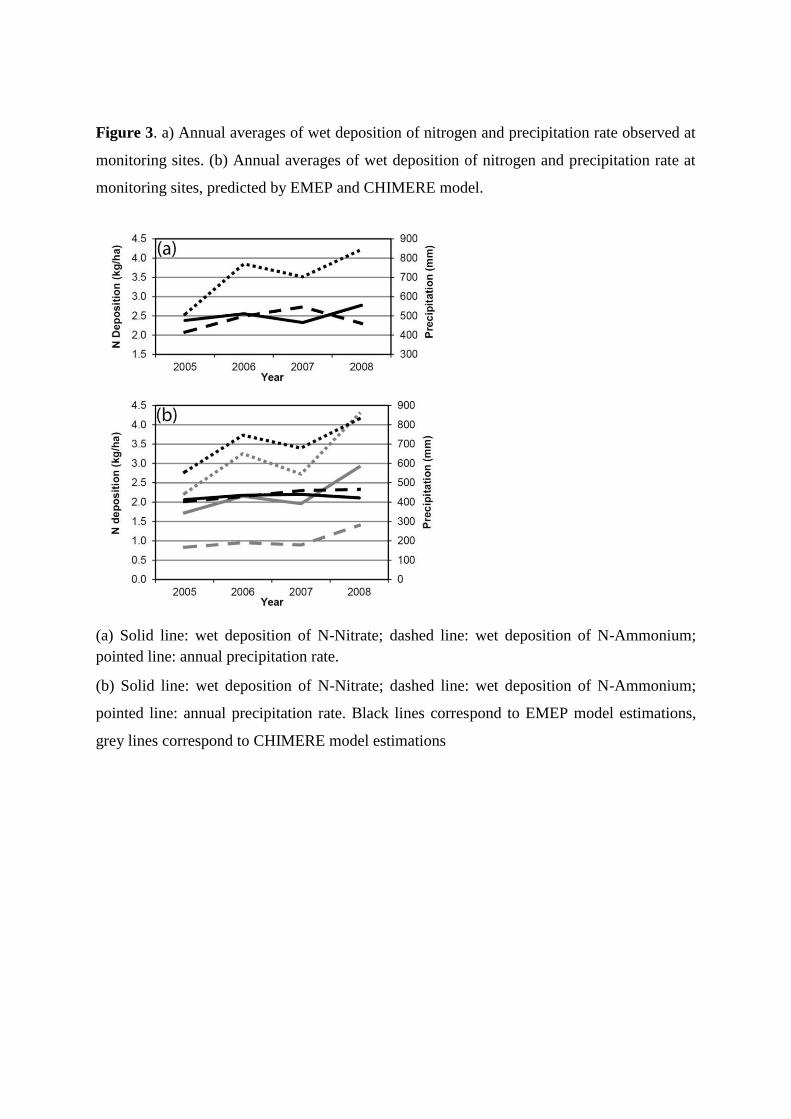
Figure 3. a) Annual averages of wet deposition of nitrogen and precipitation rate observed at
monitoring sites. (b) Annual averages of wet deposition of nitrogen and precipitation rate at
monitoring sites, predicted by EMEP and CHIMERE model.
(a) Solid line: wet deposition of N-Nitrate; dashed line: wet deposition of N-Ammonium;
pointed line: annual precipitation rate.
(b) Solid line: wet deposition of N-Nitrate; dashed line: wet deposition of N-Ammonium;
pointed line: annual precipitation rate. Black lines correspond to EMEP model estimations,
grey lines correspond to CHIMERE model estimations

Figure 4.Wet deposition of oxidized and reduced nitrogen (WDON and WDRN), and total
deposition of nitrogen (TDTN) in 2008, according both EMEP and CHIMERE models.

Figure 5.Natura 2000 areas withstanding an exceedance of the assignated critical load
(CLexc) according EMEP and CHIMERE models.