nitrogen deposition: issues and effects in rocky · pdf filenitrogen deposition: issues and...
TRANSCRIPT

Nitrogen Deposition: Issues and Effects in Rocky
Mountain National Park Technical Background Document
Rocky Mountain National Park Initiative
Denver, Colorado March, 2004
i

Nitrogen Deposition: Issues and Effects in Rocky Mountain National Park
Technical Background Document Table of Contents
Executive Summary Background Ecosystem Effects in Rocky Mountain National Park
Nitrogen Deposition in Rocky Mountain National Park Other Air Pollution Impacts in Rocky Mountain National Park Future Directions Introduction Nitrogen Effects on Ecosystems in Rocky Mountain National Park and the Colorado Front Range
Nitrogen Effects on Surface Waters Nitrogen Effects on Vegetation and Soils Nitrogen Effects on Aquatic Plants Nitrogen Cycling in High-Elevation Ecosystems Predicting Future Ecosystem Effects
Nitrogen Deposition in Rocky Mountain National Park and the Colorado Front Range Monitoring Deposition
Spatial Distribution Trends Over Time Nitrogen Emissions Sources and Atmospheric Transport Related Pollution Issues in Rocky Mountain National Park Ozone Visibility Future Directions References Appendix A: Nitrogen Deposition Data Appendix B: Nitrogen Emissions Source Data Appendix C: Ozone and Visibility Data Cover photo courtesy of the U.S.Geological Survey, Denver
This technical review paper was written by Tamara Blett, Ecologist, and Kristi Morris, Physical Scientist with the Air Resources Division of the National Park Service. Other contributors and reviewers included Jill Baron, USGS; Don Campbell, USGS; Karl Cordova,NPS; Dan Ely, CDPHE; Douglas Latimer, EPA; Brian Mitchell, NPS; Ellen Porter, NPS; Chris Shaver, NPS; Mike Silverstein, CDPHE; John Vimont, NPS; Judy Visty, NPS.
ii

Executive Summary
Background High-elevation ecosystems in Rocky Mountain National Park have been changed by the effects of nitrogen deposition (Baron and others 2000; Burns 2003). High-elevation ecosystems at Rocky Mountain National Park are more vulnerable to atmospheric nitrogen deposition than many ecosystems in the eastern U.S. or in other countries. This vulnerability is due to several factors. First, the granitic bedrock and shallow soils found in the Park do not provide much chemical buffering (Baron 1992; Campbell and others 1995; Clow and Sueker 2000). Second, short growing seasons at high-elevation limit the amount of time plants have to absorb nitrogen during the year; these plants evolved under very low nitrogen conditions, so they are more adapted to nitrogen impoverishment rather than nitrogen enrichment (Baron and others 1994). In addition, studies of ecosystem changes with increasing deposition in the eastern U.S. and Europe support the idea that changes in soils, waters, plants and animals in Rocky Mountain National Park are likely to become more severe if elevated nitrogen deposition continues to occur (Aber and others 1998; Driscoll and others 2001). Rocky Mountain National Park is adjacent to many man-made sources of air pollution. Nitrogen oxides (NOx) and ammonia (NH3) come from vehicles, industrial emissions, and agricultural sources such as farm fertilizer and animal waste (Vitousek and others, 1997; Fenn and others 2003a). Pollutants from near and distant sources along Colorado’s Front Range, as well as from other areas in the U.S. and abroad, are transported into the Park (Heuer and others 2000; Burns 2003). These pollutants are deposited in rain and snow, and as particles and gases (Nanus and others 2003). Researchers from the U.S. Geological Survey and National Park Service have been working for over 20 years to determine whether the amounts of air pollution found in Rocky Mountain National Park are affecting Park ecosystems. Sufficient data now exist to demonstrate that soils, waters, and plants show evidence of changes from nitrogen deposition (Baron and others 2000; Williams and Tonnessen 2000: Fenn and others 2003b). More than eighty peer-reviewed journal articles have been published on various aspects of the biogeochemistry and ecology of high-elevation ecosystems in the Colorado Front Range (http://www.nrel.colostate.edu/projects/lvws/pages/publications/publications.htm); these and other papers form the basis of this technical background document on deposition and deposition effects in Rocky Mountain National Park. Nitrogen emissions and source area overviews are also included, to the extent that they are available from the Colorado Department of Public Health and Environment, and in the published literature. Ecosystem Effects in Rocky Mountain National Park Nitrogen oxides and ammonium carried in air currents and deposited in ecosystems can act as a growth enhancing fertilizer in some plants, and cause toxic effects in others. These unnatural changes favor some types of plants and leave others at a disadvantage (Brooks 2003; Stevens and others 2004). This creates an imbalance in natural ecosystems, and long-term effects of these changes may be profound as species shifts occur and ecosystem processes are disrupted (Likens and others 1996; Driscoll and others 2001a). The acidifying properties of some nitrogen compounds can strip natural buffering agents from sensitive soils and waters leaving Park ecosystems vulnerable to acidification (Fenn and others 1998; Williams and Tonnessen 2000). Ecosystem effects in Rocky Mountain National Park can be summarized as follows:
Surface Waters • There is more nitrogen deposited in high-elevation ecosystems at the Park than plants can
use, and excess nitrogen is leaking into Park lakes and streams at some times of the year.
iii
• Unnatural chemical changes due to excess nitrogen are occurring in lakes and streams on the east side of the Park.
Soils and Vegetation • Old-growth Engelmann spruce forests on the east side of the Continental Divide show
significantly altered chemistry attributable to nitrogen deposition, compared to similar spruce forests on the west side.
• Experiments on nearby Niwot Ridge show that increasing nitrogen changes the species assemblages of plants that live on the tundra. Grasses and sedges outcompete flowering plants, a change that could diminish alpine flowers of the Park and reduce habitat for some animals.
Aquatic Plants • Lake sediment analysis indicates that excess nitrogen deposition has altered diatom species
composition on the east side of the Park. Diatoms are algae, small oxygen producing plants in lakes. This change began to occur around 1950.
Nitrogen Cycling • Excess nitrogen has resulted in enhanced microbial activity in soils and talus in high-
elevation areas on the east side of the Park, altering biogeochemical cycling processes. Predicting Future Ecosystem Effects • Nitrogen deposition has been shown in other parts of the country to use up natural
buffering chemicals in lakes and soils, until they eventually become acidic and cease to support sensitive aquatic species, including fish. Ecosystem models are being employed to determine how long it would take, at current and elevated rates of nitrogen deposition, for this to occur in Rocky Mountain National Park.
Nitrogen Deposition in Rocky Mountain National Park Total annual (wet and dry) nitrogen deposition monitored in the Park over the most recent five-year period averages around 3.9 kg/ha/yr (NADP 1999-2003 and CASTNet 1999-2003). Pre-industrial or “natural” levels of nitrogen deposition are estimated to be about 0.2 kg/ha/yr or approximately 20 times lower than current deposition. (Galloway and others 1982; Galloway and others 1995; Hedin and others 1995; National Park Service 2002). Atmospheric deposition in Rocky Mountain National Park can be summarized as follows:
Spatial Distribution • In the Colorado Front Range, Atmospheric nitrogen deposition is generally lower on west
slope monitoring sites than on east slope monitoring sites, however current deposition levels exceed natural levels at all sites.
• Wet nitrogen deposition is greatest at the three highest elevation sites (out of 15 sites monitored) on the eastern slope of the Continental Divide. One of these three sites is Loch Vale at Rocky Mountain National Park.
Composition
• Total nitrogen deposition at the Park is ~75% wet and ~25% dry. Nitrate and ammonium contribute approximately equal amounts to wet nitrogen deposition. Nitric acid is
iv
responsible for about ~75% of dry nitrogen deposition, nitrate and ammonium the other ~25% (ammonia is not measured).
Trends over Time • Nitrate and ammonium concentrations in precipitation at the Park are increasing; however
ammonium is increasing more rapidly. • Nitrogen deposition to high-elevation Park ecosystems has been increasing by about 2%
per year over the last two decades. • Total nitrogen deposition in the Park is highest in the summer months of June, July, and
August.
Emission Sources • Both local and regional nitrogen emissions sources are likely to be contributing to nitrogen
deposition in the Park. During the winter, the majority of atmospheric transport is from areas to the north and west of the Park. However, large snowfall events during the winter and early spring are frequently associated with easterly upslope flow, which can bring pollutants to the Park from the Front Range urban corridor and the eastern plains.
• During the summer months, atmospheric transport to the Park is generally from the southwest or southeast, incorporating both localized upslope flow from the Denver-Boulder–Ft. Collins urban area, and larger scale flow from more distance source areas.
• The largest Colorado sources of nitrogen oxides emissions are highway vehicles, stationary point sources (industry and power plants with smokestacks), and off-road vehicles.
• The largest Colorado source of ammonia emissions is confined animal feeding operations. Other sources include vehicles, fertilizer application and smoke.
Other Air Pollution Impacts in Rocky Mountain National Park Nitrogen pollution also contributes to the formation of visibility-reducing haze and ozone, a pollutant harmful to human health and vegetation (Fenn and others 2003a). Nitrate particles formed from reactions of NOx emissions and ammonia (NH3) are a contributor to regional haze at the Park. Ozone is formed through photochemical reactions of nitrogen oxides (NOx) and volatile organic compounds (VOCs). A number of the Colorado Front Range counties are in violation of the federal health standard for ozone, including the eastern portion of Rocky Mountain National Park. Future Directions Decreases in nitrogen deposition in Rocky Mountain National Park could reduce the extent and amount of unnatural ecosystem change that park ecosystems are experiencing. The National Park Service and the Colorado Department of Public Health and Environment are working together to determine options for addressing ecosystem impacts to Rocky Mountain National Park. A companion paper, entitled “Rocky Mountain National Park Initiative: Regulatory and Non-Regulatory Options” discusses policy options for reducing nitrogen deposition affecting the Park.
v

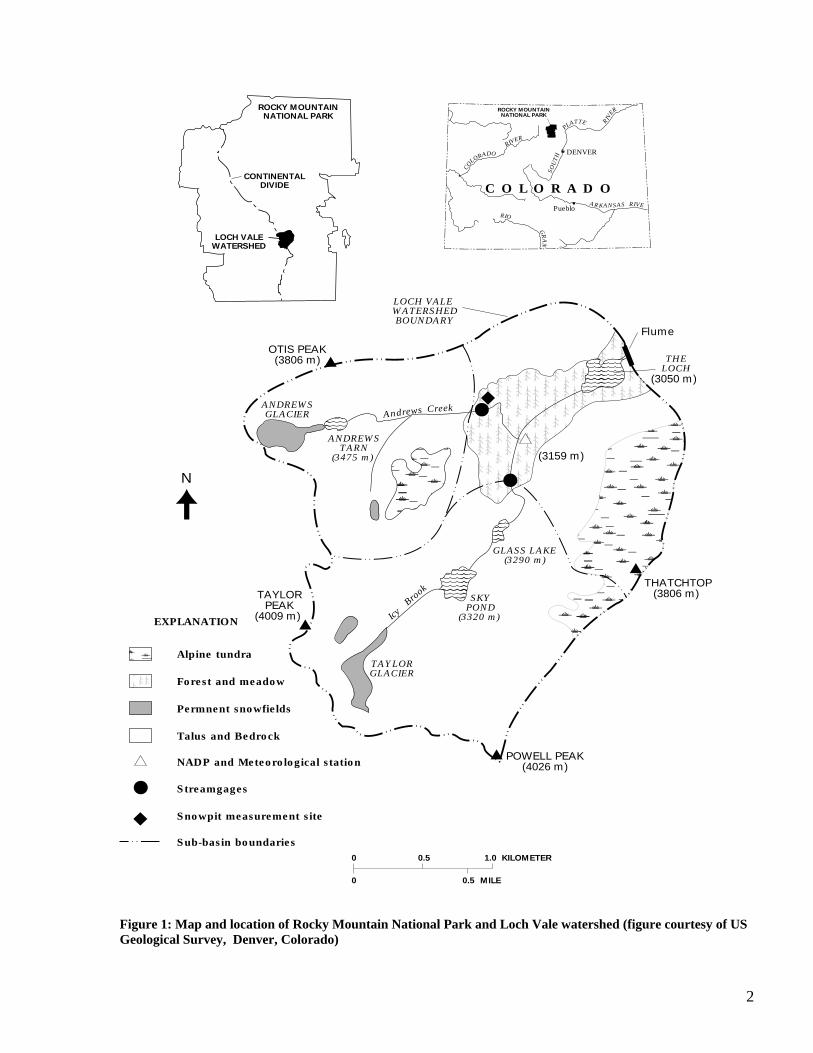
Introduction Rocky Mountain National Park (NP) is one of the crown jewels of the National Park System. Established by Congress in 1915, the Park is recognized worldwide as an outstanding scenic area and natural treasure. As a national park and wilderness, the meadows, forests, alpine peaks, tundra, lakes and streams, wildlife, and all other parts of the natural ecosystem (from soils to microscopic plants and animals) are part of this natural landscape. Over 3 million visitors come to Rocky Mountain NP each year to see the ice and rock glaciers, clear, cold alpine lakes, abundant wildlife, over 350 miles of trails, and 60 mountain peaks reaching over 12,000 feet elevation. Two native trout, greenback cutthroat trout and the Colorado River cutthroat, are protected in the Park. The greenback cutthroat trout, once close to extinction, is found east of the Continental Divide. The Colorado River cutthroat trout, eliminated from 99% of its historic range, still occurs in healthy populations in the Park west of the Divide. Rocky Mountain NP, located in north central Colorado (figure 1), encompasses 265,780 acres and straddles the Continental Divide. Approximately 2,917 acres within the Park are designated as wilderness, and an additional 248,464 acres have been recommended for wilderness designation and are managed as wilderness. The Park lies within Larimer, Boulder and Grand counties and is bordered by the towns of Estes Park, Allenspark, and Glenhaven on the east and Grand Lake on the west. The metropolitan areas of Denver and Ft. Collins are east of the Park. The Park is surrounded by state, local, private and federally owned lands. Park managers are responsible for protecting the Park’s natural environment, while providing recreational opportunities for the public. High-elevation ecosystems in Rocky Mountain NP are being changed by nitrogen (N) deposition (Baron and others 2000; Burns 2003). This includes changes in forest and soil biogeochemistry, enhanced microbial activity in soils, shifts in species of diatoms (small algal plants at the base of the aquatic food web), increased N in Park lakes and streams, changes in surface water chemistry, and altered tree chemistry. N deposition to high-elevation ecosystems has been increasing in Rocky Mountain National Park (NADP 2002; Clow and others 2003). Current levels of N deposition are about 20 times higher than background (pre-industrial) levels of N deposition for the western U.S. (Galloway and others 1982; Galloway and others 1995; Hedin and others 1995). The following sections will provide an overview of the current, peer-reviewed, published science regarding N deposition and its effects on ecosystems in Rocky Mountain NP. Emissions inventory data and air quality monitoring data provided by the Colorado Department of Public Health and Environment, and data available through national monitoring networks such as NADP (National Atmospheric Deposition Program) and CASTNet (Clean Air Status and Trends Network) are also included and summarized in the sections below.
1
�������������������������
������
��N
0
0
0.5
0.5 1.0
MILE
KILOMETER
��
��
����
����
Icy
OTIS PEAK(3806 m)
POWELL PEAK(4026 m)
THATCHTOP(3806 m)
GLASS LAKE(3290 m)
TAYLORPEAK
(4009 m)
SKYPOND
(3320 m)
ANDREWSTARN
(3475 m)
ANDREWSGLACIER
THELOCH
EXPLANATION
Permnent snowfields
NADP and Meteorological station
Forest and meadow
��
Alpine tundra
��
(3159 m)
(3050 m)
Brook
Andrews Creek
Flume
ROCKY MOUNTAINNATIONAL PARK
CONTINENTALDIVIDE
LOCH VALEWATERSHED
ROCKY MOUNTAINNATIONAL PARK
LOCH VALEWATERSHEDBOUNDARY
TAYLORGLACIER
Streamgages
Snowpit measurement site
Sub-basin boundaries
DENVER
Pueblo
C O L O R A D O
CO
LORADORIVER
SOU
TH
PLATTE RIV
ER
RIO
GRA
N
ARKANSAS RIVE
Talus and Bedrock
Figure 1: Map and location of Rocky Mountain National Park and Loch Vale watershed (figure courtesy of US Geological Survey, Denver, Colorado)
2

Nitrogen Effects on Ecosystems in Rocky Mountain National Park and the Colorado Front Range The effects of acidic deposition related to nitrogen oxide emissions, have been well documented in the eastern U.S. These effects are ongoing and include altered soils, stressed trees, and acidified lakes and streams (Driscoll and others 2001b). In addition to its acidifying effects, N carried in air currents and deposited in ecosystems can act as a fertilizer, favoring invasive types of plants and leaving native plants at a competitive disadvantage (Brooks 2003; Stevens and others 2004). This creates an imbalance in natural ecosystems, and long-term effects of these changes may be profound, such as shifts in types of plant and animal species, and disruption of ecosystem processes such as nutrient cycling, and changes in fire frequency (Likens and others 1996; Driscoll and others 2001a; Stevens and others 2004). Current ecosystem effects, as well as potential future changes in Rocky Mountain NP, can be better understood by studying progressions of change that have occurred over time with increasing N deposition in the eastern U.S. As deposition increases, ecosystems reach a point at which they can no longer utilize the nitrogen and it begins to accumulate, eventually leading to a condition called “saturation”. A widely-used conceptual model has been developed based on data from ecosystems in the eastern U.S., to describe the four stages (0,1,2,3) of N saturation (Aber 1998). These four stages describe the progression of N induced changes in forest ecosystems, based on relative rates of biogeochemical processes that are affected as N deposition increases. Stage zero effects are negligible; in stage one increased rates of biogeochemical cycling processes in plants and soils occurs, including increases in N-mineralization, and net primary productivity and increases in concentrations of N in plants., In stage two, further increases in biogeochemical cycling rates occur along with the beginning stages of N leaching from surface waters. Finally in stage three (which has been documented in some eastern ecosystems) there is a decline in net primary productivity, along with chemical imbalances in soils and plants that can be sufficient to severely damage vegetation and trees. Studies conducted in Rocky Mountain National Park over the past two decades have documented various changes to Park ecosystems that are related to N deposition effects. Many of these studies describe effects that are typical of N saturation at stages one and two, as described above. These studies, along with research documenting other types of N deposition effects, are summarized below. Nitrogen Effects on Surface Waters Long-term lake sampling has been conducted at Loch Vale in Rocky Mountain NP, from 1982 to the present. The streams and lakes in this watershed consistently show high nitrate concentrations each spring, and measurable nitrate year round (Baron and Campbell 1997; Campbell and others 2000). Using the generally accepted definition that N saturation occurs when the availability of NO3 and NH4 exceeds the total combined plant and microbial nutritional demand (Aber and others 1989), the evidence indicates that some alpine and subalpine watersheds in the Colorado Rocky Mountains are currently experiencing stage two N saturation under the conceptual model described above (Burns 2004).
3
Several lake surveys in and adjacent to Rocky Mountain NP have looked at nitrate concentrations to assess N deposition effects in surface waters. The results from five of these studies were combined to compare the chemistry of 291 high-elevation lakes east and west of the Continental Divide. Nitrate concentrations were two to six times higher in lakes on the east side of the Continental Divide compared to lakes on the west side (Burns 2004). This suggests that lakes on the east side are exposed to greater amounts of atmospheric deposition than lakes on the west side; this is discussed further in the next section on N deposition. Surface waters at higher elevations also tend to experience greater N deposition loads because higher precipitation amounts usually occur with increasing elevation (Burns 2003). Higher elevation watersheds have less soils and vegetation to retain N inputs (Clow and Sueker 2000). This means that high-elevation ecosystems both receive the highest N deposition loads, and are the most sensitive to change from pollutants. Nitrogen Effects on Vegetation and Soils Although N is an essential plant nutrient, increased levels of atmospheric N deposition stress ecosystems, and have been associated with forest decline in North America (Aber and others 1989). Chronic elevated N deposition in the eastern U.S. has been shown to alter soil and plant chemical balances such that plants become more vulnerable to grazing by animals, insect and disease infestation, and drought or frost damage (Aber and others 1989). It is unknown whether current levels of deposition in Rocky Mountain NP are high enough to produce similar effects, because of the differences in forest ecosystems (physical, chemical and biological) between eastern and western forests. However, changes in tree chemistry associated with N deposition have been documented in spruce trees in Rocky Mountain NP. Old-growth Engelmann spruce forests on the east side of the Continental Divide, where deposition is higher (Burns 2003), show significantly altered chemistry compared to the chemistry of needles and soils in similar forests (with comparable stand history, age, species composition, soil texture) on the west side of the Divide (Rueth and Baron 2002). Soil data shows that increased N deposited to forest soils on the east side of the Park has resulted in changes in essential soil decomposition processes (N mineralization) that make more N available for plants than they can use for growth (Rueth and Baron 2002). In addition to the disruption of natural nutrient cycling process, the increased rates of mineralization move additional N (in the form of NO3) into Park surface waters An analysis of naturally occurring stable isotopes of NO3 in precipitation and surface water in Loch Vale showed that even in alpine areas with little soil and vegetation, more than half of the NO3 reaching surface waters had been microbially cycled (Campbell and others 2002). The significance of this process is discussed further in the nitrogen cycling section below. As N increases in alpine ecosystems, grasses grow more quickly, outcompeting herbaceous (flowering) plants (Bowman and others 1993). Alpine ecosystems in the Colorado Front Range are susceptible to these species shifts as a result of anthropogenic N deposition (Bowman and others 1995; Bowman and Steltzer 1998). Species changes from flowering plants to grasses have been documented in nearby Niwot Ridge over the past few decades (Bowman and others 1993; Bowman 1994; Bowman 2000), but it has not yet been shown definitively whether these changes result from the documented increases in N deposition, or from other factors. A shift from flowering alpine plants to grasses and sedges in the Park will result not only in the loss of alpine wildflower communities but also the loss of habitat for certain animals. Scientists from the University of
4

Colorado at Boulder are working with Rocky Mountain NP staff to plan and implement studies in the Park in 2005 and 2006 to determine whether plant species shifts related to N deposition have already occurred, or are likely to occur in the future. These studies will be similar to those conducted on Niwot Ridge in the past, and will utilize data from plots in the Park collected decades ago, to assess potential changes in plant species. Nitrogen Effects on Aquatic Plants Aquatic algae are microscopic plants that form the base of lake food chains. They are one of the first components in the ecosystem to be affected by increased N, making them good early warning indicators of N induced ecosystem changes (Interlandi and Kilham 1998; Wolfe and others 2001). A type of algae called diatoms are often preserved in lake sediments and can serve as indicators that provide a valuable history of past chemical and biological conditions. Diatoms are small oxygen producing plants that are a key part of the aquatic food web that sustains all aquatic life. Lake sediment analysis indicates that excess N deposition is the likely cause of changes in diatom species composition and abundance in high-elevation lakes in the Park. N deposition has induced diatom species shifts from those typical of pristine, low-nutrient lakes, to species typical of N impacted lakes (Baron and others 2000; Wolfe and others 2001; Wolfe and others 2003). Sediment cores from lake bottoms show the history of the types of diatoms that existed in lakes in the recent past. Changes in diatoms in the two lakes sampled on the east side of the Divide in Rocky Mountain NP (Sky Pond and Lake Louise) began to occur around 1950 (Wolfe and others 2003). Similar changes had not occurred in lakes sampled on the west side of the divide (Wolfe and others 2003). Experimental additions of N and phosphorus to enclosed systems (mesocosms) in high-elevation lakes confirm that N pollution, rather than other ecosystem stressors, is a likely driver of the observed changes in aquatic biota (Lafrancois and others 2004; Nydick and others 2004). Naturally occurring stable isotopes of N measured in the same sediments suggest that changes in the emissions sources of N depositing to lakes occurred at around the same time as the diatoms began to be affected. Changes in diatom species in Park lakes are significant because they indicate that aquatic ecosystems have shifted away from their natural condition. Diatom species shifts may also have produced changes throughout the aquatic food web. Changes documented in high-elevation aquatic ecosystems in Rocky Mountain NP indicate that the nutrient quantities and rates of nutrient cycling are currently quite different than they were historically. Changes at the base of the food chain often have effects at higher trophic levels of the food chain (as shown by experiments and history in Europe and the eastern U.S.), however it has not yet been established what effects these food web changes may have on other components of the aquatic ecosystems in Rocky Mountain NP, such as aquatic insects and native fish species. Nitrogen Cycling in High-Elevation Ecosystems N cycling studies can be used to evaluate how deposited N impacts Park resources, and to predict the rates and types of ecosystem changes that could occur in response to future N deposition. In high-elevation ecosystems within Rocky Mountain NP, atmospheric N deposition can enter surface waters directly or it can first move through talus (rock debris), tundra, and soils (Campbell and others 2000; Campbell and others 2002). The chemical form of atmospherically-deposited N changes as it moves between rocks, soils, plants, microbes, decomposed material, lakes, and streams, through nitrogen-cycling processes such as assimilation, mineralization, and nitrification. These processes are a pathway by which plants and microbes of high-elevation areas convert organic N into NH3 and NH4, and convert NH4 to NO3. The processes are important because
5

increased amounts of N deposition in Rocky Mountain NP have been shown to speed up rates of N mineralization in soils (Rueth and Baron 2002). This means that as deposition increases, the rates at which atmospherically deposited NH4 and NO3 are converted by microorganisms to NO3 in lakes and streams increases; which then exacerbates ecosystem changes related to N saturation, (as discussed in the four stages above) (Aber and others 1998). Much of the N stored in talus and soil remains there until it is flushed by snowmelt or large rainfall events and released into surface waters (Baron and Campbell 1997). Microbes are active during winter under the snowpack and the amount of microbial activity that converts NH4 to NO3 can impact the amount of NO3 that is released when the snow melts in the spring (Brooks and others 1996; Brooks and others 1998) The highest surface water NO3 concentrations are present in high-elevation Park waters in the late spring (Campbell and others 2000). N continues to be released from alpine areas throughout the growing season, which is significant because it shows that excess N is present even when biological demand is at its peak. Studies of N cycling in the Park also help explain why N ends up in surface waters as a result of atmospheric deposition levels that are substantially lower than levels inducing N excess in the eastern U.S. and in Europe. The large surface areas of talus and rock in Rocky Mountain NP mean that relatively little soils and plants are available to store and use significant amounts of N for biological activity and growth. In addition, much of the N stored in the winter snowpack is released into Park waters each spring before the weather is warm enough to substantially increase biological demand of N for plant growth. Therefore, N flushes through the system and enters surface waters relatively quickly. Predicting Future Ecosystem Effects The acidifying properties of N (in the nitric acid form) can strip natural buffering agents from soils within sensitive watersheds leaving ecosystems vulnerable to acidification. Research in the eastern U.S. shows that N excess (saturation) produces a sequence of reasonably predictable effects on ecosystems, and that the effects become increasingly severe with continuing elevated N deposition (Aber and others 1998; Stoddard 2001). Eventually, acidifying compounds accumulate in ecosystems and may cause waters to become acidic and cease to support sensitive aquatic species such as fish (Baker and Christensen 1991; Baker and others 1996.) Effects of deposition can occur however, long before a lake or stream becomes chronically acidic. Key species that are part of the aquatic food web (for example, insects and plants that are preferred by native species of fish) often disappear from lakes and streams once the chemical buffering ability of a lake falls below a level that protects it from episodic acidification. While N fertilization effects have already been documented in the Park, as discussed in the sections above, the potential for episodic or chronic acidification in lakes and streams in Rocky Mountain NP is less certain. Studies suggest that, because of the enhanced sensitivity of high-elevation ecosystems in the Park, N deposition causes unnatural changes in ecosystems at deposition levels lower than at which those changes are observed in less-sensitive ecosystems (Baron and others 2000). Ecosystem models are being employed to determine how long it will take, at current and elevated rates of N deposition, for episodic or chronic acidification to occur in sensitive high-elevation lakes and streams in the Park. Results from these models are expected to be published in scientific journals in 2005 or 2006.
6
Nitrogen Deposition in Rocky Mountain National Park and the Colorado Front Range Atmospheric deposition is the process by which airborne pollutants are deposited to ecosystems. Atmospheric N deposition consists of both wet and dry components. Wet deposition occurs when pollutants are deposited in combination with precipitation, predominantly by rain and snow, but also by clouds and fog. Dry deposition of particles and gases occurs by complex processes that include settling, impaction, adsorption, and uptake by vegetation. Monitoring Deposition Wet deposition is monitored by the National Atmospheric Deposition Program/National Trends Network (NADP/NTN) at 15 high-elevation sites (>2000 m) in Colorado and southern Wyoming; two of these sites are located within Rocky Mountain NP. Both sites, Beaver Meadows (2490 m) and Loch Vale (3159 m), are located on the east side of the Continental Divide and have been operating since the early 1980s. NADP precipitation samples are collected weekly and sent to a central laboratory, where they are analyzed for major ions, including nitrate (NO3) and ammonium (NH4), both of which contribute to wet N deposition. Data are reported as concentration and deposition. Deposition is calculated by multiplying concentration by the recorded amount of precipitation. Concentration data are commonly used to examine spatial and temporal trends rather than deposition, because deposition data are a function of precipitation amount which varies from year to year. Deposition data are used to quantify the amount of pollutants that are deposited to ecosystems. More information about the NADP network and data are available at http://nadp.sws.uiuc.edu.
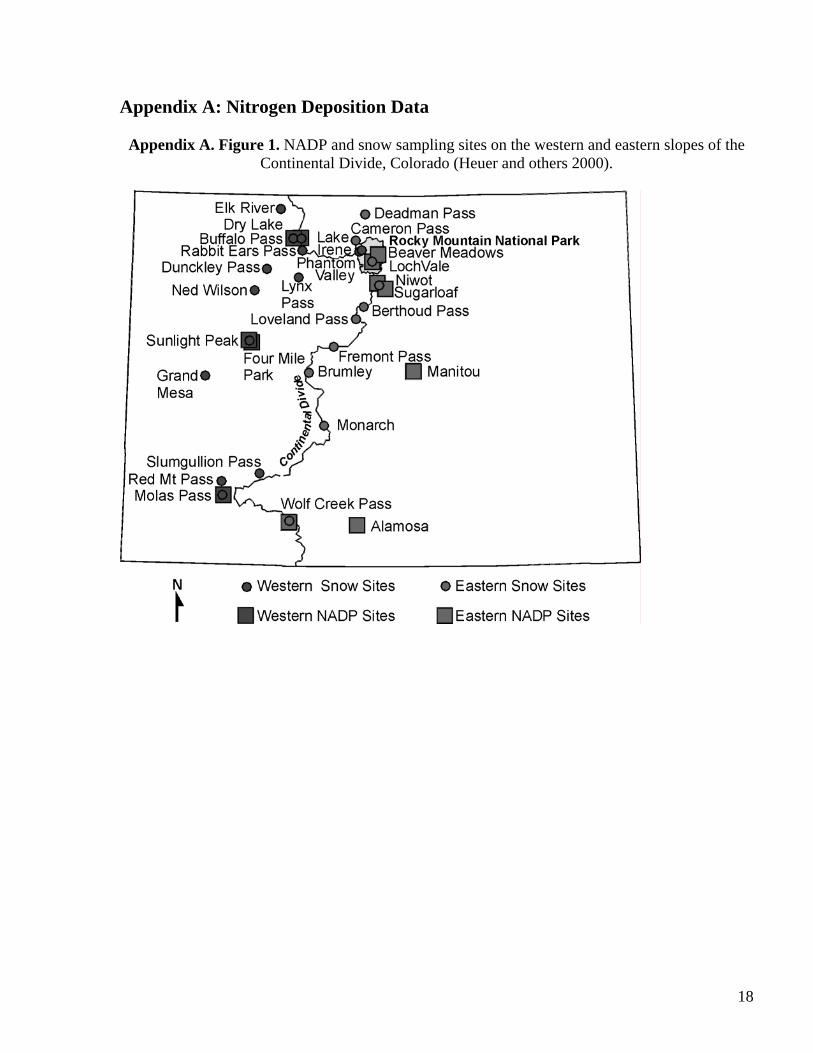
In addition to wet deposition monitoring by NADP, an extensive snowpack monitoring network has been operated since 1993 by the U.S. Geological Survey, in cooperation with the National Park Service, USDA Forest Service, and other organizations. Snowpack samples are collected near the time of maximum snow accumulation at 75 high-elevation sites in the Rocky Mountains from Montana to New Mexico, with four sites located in Rocky Mountain NP. A map of NADP and snowpack sampling sites in Colorado is provided in Appendix A, Figure 1. Snowpack samples are analyzed for major ions, including NO3 and NH4, and other constituents (Ingersoll and others 2004). Dry deposition is monitored by the Clean Air Status and Trends Network (CASTNet) at two high-elevation sites in Colorado and one in southern Wyoming. The site in Rocky Mountain NP (2743 m) has been operating since 1995. In addition to other parameters and meteorological conditions, CASTNet measures weekly atmospheric concentrations of the gases and particles that contribute to dry N deposition. These include nitric acid (HNO3), particulate nitrate (NO3), and particulate ammonium (NH4). Ammonia gas (NH3) is not measured. Dry deposition rates are modeled using atmospheric concentrations, meteorological data, and information on land use, vegetation, and surface conditions. More information about CASTNet and access to data is provided on their website at http://www.epa.gov/castnet. The NPS recommends estimating total deposition by summing the most recent five-year average of wet (3.1) and dry (0.8) N deposition components, as measured by NADP and CASTNet (1999-2003), yielding a mean total N deposition estimate for Rocky Mountain NP of 3.9 kg N/ha/yr. We chose to incorporate the wet deposition estimate for Loch Vale, as opposed to Beaver Meadows,
7
because most sensitive resources are at high-elevations in the Park. This methodology (the five-year running average of total deposition) will provide a useful benchmark for assessing changes in deposition. This estimate of 3.9 kg N/ha/yr is lower than a previous estimate (4.4 kg N/ha/yr) by Burns 2003 that was included in the NPS Fact Sheet, “Nitrogen Deposition Issues and Effects in Rocky Mountain National Park,” because of the difference in dry deposition calculations explained below. This estimate of total deposition is likely to be biased low, because it does not include the contribution of organic N. Organic N has not been measured at the Park, however studies at similar locations have shown that it may contribute 15-25% of total N deposition (Williams and others 2001; Sickman and others 2001). Drought conditions in the Park may also cause deposition estimates to be lower than expected. Pre-industrial or “natural” levels of N deposition are estimated at around 0.2 kg/ha/yr, more than 20 times lower than current deposition. This estimate is a general estimate for the western U.S. based on current and historical data from remote sites worldwide (Galloway and others 1982; Galloway and others 1995; Hedin and others 1995).
Spatial Distribution Atmospheric N deposition is generally lower in the western U.S. than in the East (NADP 2004 and CASTNet 2004), however, it is still of concern because Rocky Mountain ecosystems are sensitive to even small amounts of N deposition. Data from 15 NADP sites in the Front Range, for 1999 to 2003, showed that wet N (NO3 and NH4) deposition ranged from 0.8 to 5.4 kg N/ha/yr (kilograms of N per hectare per year) for sites east of the Continental Divide, and 1.3 to 2.2 kg N/ha/yr for sites west of the Divide (Appendix A, Table 1; NADP 2004). Wet N deposition is greatest at the three highest elevation sites (>3000 m) on the eastern slope of the Continental Divide, which include Loch Vale at Rocky Mountain NP (Burns 2003; NADP 2004). Annual concentrations of NO3 and NH4 in precipitation are higher for sites on the eastern slope than for sites on the western slope of the Continental Divide (Burns 2003; Heuer and others 2000). Likewise, snow survey sites within the Park boundary show higher NO3 and NH4 concentrations on the eastern side of the Park (Ingersoll and others 2004). Wet N deposition is greater at the higher elevation NADP site in Rocky Mountain NP, Loch Vale (3.1 kg N/ha/yr), than at the lower elevation site at Beaver Meadows (1.9 kg N/ha/yr); this is likely due to the increase in precipitation with elevation. However, annual average (1999-2003) concentrations of NO3 and NH4 are greater at Beaver Meadows. Beaver Meadows had the fourth highest NO3 concentration and the third highest NH4 concentration of the 15 Front Range NADP sites, 1.2 and 0.33 mg/l (milligrams per liter), respectively (Appendix A, Table 1; NADP 2004). From 1999 to 2003, the three dry deposition monitoring sites reported dry N (HNO3, NO3, and NH4) deposition between 0.4 and 0.9 kg N/ha/yr, with 0.8 kg N at Rocky Mountain NP (CASTNet 2004). This range is lower than a range previously reported by Burns 2003 (0.5 to 1.4 kg N/ha/yr), due to changes in the CASTNet database. In May 2003, CASTNet began reporting gas concentrations at local temperature and pressure, as opposed to standard temperature and pressure,
8

resulting in a ~30% decrease in estimates of dry N deposition to high-elevation sites, such as Rocky Mountain NP. Composition Comparisons of NADP and CASTNet data at these three sites suggest that dry deposition generally constitutes 25-30% of annual total N deposition (Burns 2003; Zeller and others 2000), however; another study at nearby Niwot Ridge has shown that dry deposition may contribute as much as 47% to total deposition (Sievering and others 1996). Contributions of NO3 and NH4 to total wet N deposition are roughly equal in the Park. From 1999-2003, NO3 contributed 51% and NH4 contributed 49% to annual wet N deposition at the Beaver Meadows site, and NO3 contributed 57% and NH4 contributed 43% at the Loch Vale site. Of the dry deposition components, HNO3 is the major contributor, ~75%, to dry N deposition at sub-alpine forests in the Rocky Mountains (Sievering and others 2001). However, in the alpine tundra, NH3 and HNO3 contribute equally to dry N deposition (Rattray and others 2001). Trends Over Time The Seasonal Kendall Test is a statistical technique that has been used to determine long-term temporal trends in seasonally varying NADP wet deposition data (Nilles and Conley 2001; Burns 2003; Clow and others 2003). All but two of the 15 NADP sites in Colorado and southern Wyoming have data records extending back 15 years or more. Of these 15 sites, five have statistically significant (p<0.05) increasing trends (1983-2000) in wet N deposition (Burns 2003). All five, including Loch Vale, are high-elevation (>3000 m) sites. Other sites showed no significant trends (Burns 2003). Wet N deposition has been increasing by about 2% per year at Loch Vale over the last two decades (NADP 2002; Clow and others 2003). This increasing trend is primarily attributed to significant increases in NH4 concentrations (Burns 2003). The most recent trends analysis for the Beaver Meadows site (Lehman and others In press), reports a 26% increase in NO3 concentrations and a 73% increase in NH4 concentrations from 1985 to 2002 (Appendix A: Figures 2 and 3). Significant increases in NH4 concentrations in precipitation have occurred at the majority of NADP sites in Colorado and throughout the western United States (Lehman and others In press). Increases in NO3 concentration were somewhat less at sites from the High Plains through the Intermountain regions, while sites in Washington, Oregon, California and Nevada showed little or no trend (Lehman and others In press). Trend analysis on dry deposition data from the Rocky Mountain CASTNet site indicate that total nitrate (HNO3 plus NO3) has increased from 1995 to 2003 (p < 0.05, NPS analysis). Of the other two sites in the region, only the site in southern Wyoming also shows a statistically significant increase in total nitrate concentrations. Contrary to increasing trends in wet NH4 concentrations, no trends in dry NH4 are reported, and of course, NH3 is not measured. However, a more intensive monitoring study at Niwot Ridge comparing filter pack data obtained in 1993-1994 with that obtained at another site from 1979-1985, suggested that the air concentrations of N species (HNO3, NO3, and NH4) doubled from the mid-1980s to the mid-1990s (Sievering and others 1996). In addition to long-term trends, it is also useful to examine seasonal patterns in deposition and concentration data. Wet N deposition and dry N deposition at Rocky Mountain NP are consistently highest in the summer months of June, July, and August (NADP 2004; CASTNet 2004). Summer
9
concentrations of NO3 and NH4 in precipitation are generally twice as high as winter concentrations (Heuer and others 2000). Likewise, air concentrations of the N species that contribute to dry deposition show a strong seasonality: concentrations of HNO3 are highest in the summer, concentrations of particulate NO3 are highest in the spring, and concentrations of particulate NH4 are elevated from March through November (CASTNet 2004). This information, in combination with knowledge of local meteorological conditions, can be used to determine source area regions and will be discussed further in the next section. Nitrogen Emissions Sources and Atmospheric Transport Rocky Mountain NP is adjacent to many man-made sources of air pollution. Pollutants from sources along Colorado’s Front Range, as well as from other areas in the U.S. and abroad, are carried into Park ecosystems (Heuer and others 2000; Burns 2003). These pollutants are deposited in rain, snow, and as dry particles and gases (Nanus and others 2003). NOx and NH3 come from vehicles, industrial emissions, agricultural sources such as farm fertilizer and animal waste, and natural sources such as fire. N emissions from the transportation, industrial and power plant sectors are dominated by nitrogen oxides (NOx) which is made up nearly entirely of NO (nitric oxide); while N emissions from fertilized crops and confined animal feeding operations (CAFOs) are primarily ammonia (NH3). Total emissions of NOx in 10 of 11 western states (excluding California) increased by 8% from 1985 to 1999 (EPA 2003). California NOx emissions decreased by 28% over the same time period (Alexis 2001). In the Colorado Front Range (Adams, Arapahoe, Boulder, Broomfield, Denver, Douglas, Jefferson, Weld, Larimer, Morgan, and Elbert Counties), 2002 NOx emissions sources were estimated by the State of Colorado as 201,000 tons per year, comprising: 42% mobile sources, 33% point sources (commercial, industrial, power generation, oil and gas), 11% off-road sources (construction, farm machinery, lawn and garden), 5% biogenic sources (vegetation), 3% railroads, 3% area source fuel combustion, and 4% other area sources combined such as fire, wood burning, and aircraft (see Appendix B, Table 1). Summer-only NOx emissions estimates for the Front Range remain in similar proportion with mobile sources, point sources, and off-road sources being the three largest contributors (see Appendix B, Table 2). Statewide NOx emissions for 2002 were estimated as 370,000 tons per year, consisting of: 33% mobile sources, 32% point sources, 11% biogenic, 9% off-road, 6% wildfire and structure fires, 4% railroads, 3% prescribed fire, 2% area fuel combustion (see Appendix B, Table 3). Front Range emissions for NH3 in 2002 were estimated by the State of Colorado as 31,000 tons per year, comprising: 77% animal husbandry, 10% highway, 6% fertilizer application, 5% waste disposal/treatment, 2% wildfire, and less than 1% each for point sources, oil and gas operations, prescribed fire, and off road sources (see Appendix B, Table 4). Statewide NH3 emissions for 2002 were estimated as 89,000 tons per year, consisting of: 64% animal husbandry, 15% prescribed burning, 9% fertilizer application, 5% highway, 5% wildfire, 2% waste disposal/treatment, and less than 1% each for point sources, oil and gas, and off road sources (see Appendix B, Table 5). A point source in Cheyenne, Wyoming, the DynoNobel fertilizer plant, produces approximately 180 tons per year NH4, or less than 1% of the Colorado Front Range totals (State of Wyoming, DEQ, personal communication, 1-5-05). Emissions estimates for NH3 have a high degree of uncertainty associated with them. Emissions estimates for NH3 in Colorado are
10

substantially lower than emissions estimates for NOx, however monitoring indicates that NH4 and NO3 contribute approximate equal amounts to wet deposition in Rocky Mountain NP. A better understanding about NH3 emissions inventories, and atmospheric transport of NH3 to the Park would be useful in helping to explain this disparity. The HYSPLIT atmospheric transport model has been used to compute back trajectories of air parcels reaching Rocky Mountain NP, to help identify potential source regions of N. Air masses that reach the Park predominantly originate from the west, although there are distinct seasonal differences in the direction of the trajectories (Mast and others 2003). During the winter, the majority of transport is from areas to the north and west of the Park (Heuer and others 2000; Mast and others 2003). However, large snowfall events east of the Continental Divide, during the winter and early spring, are frequently associated with easterly upslope flow, which can bring pollutants to the Park from the Front Range urban corridor and the eastern plains. During the summer months, transport is generally from the southwest or southeast (Heuer and others 2000; Mast and others 2003). During the summer, a pattern of morning heating of the east-facing slopes of the Rocky Mountain Front Range sets up a localized upslope flow, which can transport pollutants from the Denver-Boulder-Fort Collins urban area and from the eastern plains into the Park. The localized transport is imbedded in the larger scale flow, which brings some pollutants into the area from beyond the local region. The morning heating can also trigger convective rain shower activity, leading to precipitation events in the Park, that then contribute to wet deposition loading. Related Pollution Issues in Rocky Mountain National Park Ozone Ozone is a pollutant harmful to human health and vegetation (Fenn and others 2003a). It is formed through photochemical reactions of NOx and volatile organic compounds (VOCs). Ozone has been monitored continuously as part of a national network since 1986 at one site (site #080690007442011) on the east side of the Park through the NPS Gaseous Pollutant Monitoring Program (www2.nature.nps.gov/air/data/index.htm). Concentrations occasionally exceeded the previous human health-based 1-hr primary National Ambient Air Quality Standard (NAAQS). In addition, a number of the Colorado Front Range counties are in violation of the federal 8-hour NAAQS for ozone, including the eastern portion of Rocky Mountain NP (see Appendix C, Table 1). Seasonal ozone exposures have also frequently been high enough to cause concern about ozone-sensitive plant species in the Park. Recent short-term monitoring has shown that ozone concentrations are higher on the east side of the Park, versus the west side, and that, in general, concentrations increase with elevation. While ozone-sensitive species occur in Rocky Mountain NP (for example quaking aspen (Populus tremuloides)), plants in the Park have not been evaluated systematically for ozone injury. Visibility Nitrogen pollution contributes to visibility-reducing haze. As part of the Interagency Monitoring of Protected Visual Environments (IMPROVE) network, visual air quality in Rocky Mountain NP has been monitored using an aerosol sampler (March 1988 through the present), transmissometer (1987 through the present), and 35mm camera (1985-1995). The U.S. Environmental Protection Agency’s Regional Haze regulations require improving visibility in Class I air quality areas on the worst visibility days and preventing degradation of visibility on the best days. The most recent
11
visibility monitoring data (1997-2003) shows that on the clearest days, visibility is improving at Rocky Mountain NP. However, on the haziest days, visibility at the Park continues to deteriorate (see Appendix C, Table 2 and Table 3). Future Directions Decreases in N deposition in Rocky Mountain NP would likely reduce the extent and amount of unnatural ecosystem change that Park ecosystems are experiencing. Current deposition levels have altered Park ecosystems, including both aquatic and terrestrial systems. Detrimental effects will continue to be seen at current deposition levels and effects may increase in severity, if deposition continues to increase at current rates. Enhanced monitoring in and adjacent to Rocky Mountain NP could further the understanding about sources of NOx and NH3 to the Park. This could include continuous monitoring of all species that contribute to N deposition, including oxidized forms of N (NOy) and reduced forms of N (NH3 and NH4). In addition, continuation of current efforts to monitor deposition and concentration of N in rainfall, snow, and surface waters is important because these efforts remain the most direct measure available of N entering Park ecosystems. Tracking the progress of efforts to reduce N deposition in the Park could be done consistently by using running means of 5-year averages of wet deposition (NADP) + dry deposition (CASTNet).
The National Park Service and the Colorado Department of Public Health and Environment are working together to evaluate options for addressing ecosystem impacts to Rocky Mountain NP. A companion paper to this one, entitled “Rocky Mountain National Park Initiative: Regulatory and Non-Regulatory Options” lists policy options for reducing N deposition affecting Rocky Mountain NP.
12

References Aber, J.D., Nadelhoffer, K.J., Steudler, P.A., and Melilo, J.M. 1989. Nitrogen saturation in northern forest ecosystems. Bioscience 39: 378-386 Aber, J., McDowell, W., Nadelhoffer, K., Magill, A., Berntson, G., Damakea, M., McNulty, S., Currie, W., Rustad, L., Fernandez, I. 1998. Nitrogen saturation in temperate forest ecosystems: Hypothesis revisited. Bioscience 48:921-934 Alexis A., Delao A., Garcia C., Nystrom M., Rosenkranz K. 2001. The 2001 California Almanac of Emissions and Air Quality. Sacramento: California Air Resources Board, California Environmental Protection Agency. Baker, J.P., Van Sickle, J, Gagen, C.J, De Walle, D.R., Sharpe, W.E., Carline, R.F., Baldigo, B.P, Murdoch, P.S., Bath, D.W., Kretser, W.A., Simonin, H.A., Wigington, P.J. Jr. 1996. Episodic acidification of small streams in the northeastern United States: Effects on fish populations. Ecological Applications 6: 422-437. Baker, J.P. and S.W. Christensen. 1991. Effects of acidification on biological communities. In: Charles, D.F.(ed.) Acidic Deposition and Aquatic Ecosystem. Springer-Verlag, New York, pp. 83-106. Baron, J.S., Rueth, H.M., Wolfe, A.N., Nydick, K.R., Allstott, E.J., Minear, J.T., Moraska, B. 2000. Ecosystem responses to nitrogen deposition in the Colorado Front Range. Ecosystems 3: 352-368. Baron, J.S., and Campbell, D.H. 1997. Nitrogen Fluxes in a high elevation Colorado Rocky Mountain Basin. Hydrological Processes 11: 783-799. Baron, J.S., Ojima, D.S., Holland, E.A., Parton, W.J. 1994. Analysis of nitrogen saturation potential in Rocky Mountain tundra and forest: implications for aquatic systems. Biogeochemistry 27: 61-82. Baron, J.S. and Denning, A.S. 1993. The influence of mountain meteorology on precipitation chemistry at low and high elevations in the Colorado Front Range, USA. Atmospheric Environment, 27A, 2337-2349. Baron, J. ed. 1992. Biogeochemistry of a subalpine ecosystem: Loch Vale Watershed. Ecological Study Series #90, Springer-Verlag, New York. Bowman, W.D. 2000. Biotic controls over ecosystem response to environmental change in alpine tundra of the Rocky Mountains. Ambio 29(7): 396-400 Bowman, W.D. and Steltzer, H. 1998. Positive feedbacks to anthropogenic nitrogen deposition in Rocky Mountain alpine tundra. Ambio 27(7):514-517.
13
Bowman, W.D., Theodose T.A., Fisk, M.C. 1995. Physiological and production responses of plant growth forms to increase in limiting resources in alpine tundra: implications for differential community response to environmental change. Oecologia 101: 217-227. Bowman, W.D. 1994. Accumulation and use of nitrogen and phosphorus following fertilization in two alpine tundra communities. Oikos 70(2): 261-270 Bowman, W.D., Theodose, T.A., Schardt, J.C., Conant, R.T. 1993. Constraints of nutrient availability on primary production in two alpine tundra communities. Ecology 74(7): 2085-2097. Brooks, M.L. 2003. Effects of increased soil nitrogen on the dominance of alien annual plants in the Mojave Desert. Journal of Applied Ecology 40: 344-353 Brooks, P.D., Williams, M.W., Schmidt, S.K. 1998. Inorganic nitrogen and microbial biomass dynamics before and during spring snowmelt. Biogeochemistry 43: 1-15 Brooks, P.D., Williams, M.W., Schmidt, S.K. 1996. Microbial activity under alpine snowpacks, Niwot Ridge, Colorado. Biogeochemistry 32: 93-113 Burns, D. A. 2004. The effects of atmospheric nitrogen deposition in the Rocky Mountains of Colorado and southern Wyoming, USA – a critical review. Environmental Pollution 127: 257-269. Burns, D.A. 2003. Atmospheric nitrogen deposition in the Rocky Mountains of Colorado and Southern Wyoming- A review and new analysis of past study results. Atmospheric Environment 37: 921-932. Campbell, D.H., Kendall, C., Chang, C.C.Y., Silva, S.R., and Tonnessen, K.A., 2002, Pathways for nitrate release from an alpine watershed: determination using �15N and �18O, Water Resources Research 38 (5) 10.1029/2001WR000294. Campbell, D.H., Baron, J., Tonnessen, K. A., Brooks, P.D., and Schuster,P.F., 2000, Controls on nitrogen flux in alpine/subalpine watersheds of Colorado, Water Resources Research 36: 37-47. Campbell, D. H., Clow, D. W., Ingersoll, G. P., Mast, M.A., Spahr, N. E., Turk, J. T. 1995. Processes controlling the chemistry of two snowmelt-dominated streams in the Rocky Mountains. Water Resources Research 31(11): 2811-2821.
CASTNet (Clean Air Status and Trends Network). 2004. U.S. Environmental Protection Agency, Clean Air Markets Division, 1310 L Street, NW, Washington, DC 20005. http://www.epa.gov/castnet
Clow, D.W., Sickman, J.O., Striegl, R.G., Krabbenhoft, D.P., Elliott, J.G., Dornblaser, M.M., Roth, D.A., and Campbell, D.H., 2003, Changes in the chemistry of lakes and precipitation in high-elevation National Parks in the western United States, 1985-99: Water Resources Research 39: 6, 1171doi:10.1029/2002WR001533
14

Clow, D.W; Sueker, J.K. 2000. Relations between basin characteristics and stream water chemistry in alpine/subalpine basins in Rocky Mountain National Park, Colorado. Water Resources Research 36(1): 49-61. Driscoll C.T., Lawrence G.B., Bulger A.J., Butler T.J., Cronan C.S., Eager C., Lambert K.F., Likens G.E., Stoddard J.L., Weathers K.C. 2001a. Acidic deposition in the Northeastern United States: Sources and inputs, ecosystem effects and management strategies. Bioscience 51:180–198. Driscoll C.T., Lawrence G.B., Bulger A.J., Butler T.J., Cronan C.S., Eager C., Lambert K.F., Likens G.E., Stoddard J.L., Weathers K.C. 2001b. Acid Rain Revisited: advances in scientific understanding since the passage of the 1970 and 1990 Clean Air Act Amendments. Hubbard Brook Research Foundation Science Links Publication. Vol.1, No. 1. [EPA] U.S. Environmental Protection Agency. 2003. National Emission Trends Database (17 March 2003) www.epa.gov/air/data/index.html. Fenn, M.E., Haeuber, R., Tonnesen, G.S., Baron, J.S., Gorssman-Clarke, S., Hope, D., Jaffe, D., Copeland, S., Geiser, L., Rueth, H.M., Sickman, J.O. 2003a. Nitrogen emissions, deposition, and monitoring in the western United States. Bioscience 53(4): 391-403. Fenn, M.E., Baron, J.S., Allen, E.B., Rueth, H.M., Nydick, K.R., Geiser, L., Bowman, W.D., Sickman, J.O., Meixner, T., Johnson, D.W., Neitlich, P. 2003b. Ecological effects of nitrogen deposition in the western United States. Bioscience 53: 404-420. Fenn, M.E., Poth, M.A., Aber, J.D., Baron, J.S., Bormann, B.T., Johnson, D.W., Lemly, A.D., McNulty, S.G., Ryan, D.F., Stottlemyer, R. 1998. Nitrogen excess in North American ecosystems: predisposing factors, ecosystem responses, and management strategies. Ecological Applications. 8(3): 706-733. Galloway, J.N., Schlesinger W.H., Levy H.II, Michaels, A., and Schnoor, J.L. 1995. Nitrogen fixation: Anthropogenic enhancement - environmental response. Global Biogeochemical Cycles 9(2): 235-252. Galloway, J.N., Likens, G.E., Keene, W.C., Miller, J.M. 1982. The composition of precipitation in remote areas of the world. Journal of Geophysical Research 87: 8771-8776 Hedin, L.O., Armesto, J.J., and Johnson, A.H. 1995. Patterns of nutrient loss from unpolluted, old-growth temperate forests: evaluation of biogeochemical theory. Ecology 76: 493-509. Heuer, K., Tonnessen K.A., Ingersoll, G.P. 2000. Comparison of precipitation chemistry in the Central Rocky Mountains, Colorado, USA. Atmospheric Environment 34: 1713-1722. Ingersoll, G.P., Mast, A.M., Nanus, L., Manthorne, D.J., Clow, D.W., Handran, H.M., Winterringer, J.A., and Campbell, D.H. 2004. Rocky Mountain Snowpack Chemistry at Selected Sites, 2002. Open-File Report 2004-1027, U.S. Geological Survey, U.S. Department of the Interior.
15

Interlandi S.J. and Kilham, S.S. 1998. Assessing the effects of nitrogen deposition on mountain waters: a study of phytoplankton community dynamics. Water Science Technology. 38:139-146. Lafrancois, B.M., Nydick, K.R., Johnson, B.M. Baron, J.S. 2004. Cumulative effects of nutrients and pH on the plankton of two mountain lakes. Canadian Journal of Fisheries and Aquatic Science. 61: 1153-1165 Lehmann, C.M.B., Bowersox, V.C., Larson, S.M. In press. Spatial and temporal trends of precipitation chemistry in the United States, 1985-2002. Environmental Pollution. Likens G.E., Driscoll C.T., Buso D.C. 1996. Long-term effects of acid rain: response and recovery of a forest ecosystem. Science 272: 244–246. Mast, M.A., Campbell, D.H., Ingersoll, G.P., Foreman, W.T., Krabbenhoft, D.P. 2003. Atmospheric deposition of nutrients, pesticides, and mercury in Rocky Mountain National Park, Colorado 2002. Water Resources Investigations Report 03-4241, U.S. Geological Survey, U.S. Department of the Interior. Nanus, L., Campbell, D.H., Ingersoll, G.P., Clow, D.W., Mast, M.A. 2003. Atmospheric deposition maps for the Rocky Mountains. Atmospheric Environment 37: 4881-4892. NADP (National Acidic Deposition Program) 2002. Rocky Mountain National Park Loch Vale Data, based on 1983-2002 Inorganic N annual data summaries. http://nadp.sws.uiuc.edu/
NADP (National Atmospheric Deposition Program). 2004. NADP Program Office, Illinois State Water Survey, 2204 Griffith Dr., Champaign, IL 61820. NRSP-3, http://nadp.sws.uiuc.edu
National Park Service, Air Resources Division. 2002. Guidance on Nitrogen and Sulfur Deposition Analysis Thresholds. http://www2.nature.nps.gov/air/Permits/flag/NSDATGuidance.htm Nilles, M.A., Conley B. E. 2001. Changes in the chemistry of precipitation in the United States, 1981-1998. Water, Air and Soil Pollution 130: 409-414. Nydick, K.R., Lafrancois, B.M., Baron, J.S., and Johnson, B.M. 2004. Nitrogen regulation of algal biomass, productivity, and composition in shallow mountain lakes, Snowy Range Wyoming, USA. Canadian Journal of Fisheries and Aquatic Resources. 61: 1256-1268. Rattray, G. and Sievering, H. 2001. Dry deposition of ammonia, nitric acid, ammonium, and nitrate to alpine tundra at Niwot Ridge, Colorado. Atmospheric Environment 35:1105-1109. Rueth H.M., Baron J.S. 2002. Differences in Englemann spruce forest biogeochemistry east and west of the Continental Divide in Colorado, USA. Ecosystems 5:45–57.
16

Sickman, J.O., Leydecker, A., Melack, J.M. 2001. Nitrogen mass balances and abiotic controls on N retention and yield in high-elevation catchments of the Sierra Nevada, California, United States. Water Resources Research 37, 1445-1461. Sievering, H., Kelly, T., McConville, G., Seibold, C., and Tunipseed, A. 2001. Nitric acid dry deposition to conifer forests: Niwot Ridge spruce-fir-pine study. Atmospheric Environment 35, 3851-3859. Sievering H., Rusch, D., Marquez, L. 1996. Nitric acid, particulate nitrogen and ammonium in the continental free troposphere: Nitrogen deposition to an alpine tundra ecosystem. Atmospheric Environment Vol. 30, No. 14: 2527-2537. State of Wyoming, Department of Environmental Quality, personal communication with Glenn Spangler, January 3, 2005. Stevens, C.J., Dise, N.B., Mountford, J.O., Gowing, D.J. 2004. Impact of nitrogen deposition on the species richness of grasslands. Science. 303: 1876-1879. Stoddard, J.L., Traaen, T.S. and Skjelkvale, B.L. 2001. Assessment of Nitrogen Leaching at ICP-Waters sites (Europe and North America). Water, Air and Soil Pollution. 130: 781-786 Vitousek, P.M., Aber, J.D, Howarth, R.W., Likens, G.E., Matson, P.A., Schindler, D.W., Schlesinger, W.H., Tilman, D.G. 1997. Human alteration of the global nitrogen cycle: Sources and consequences. Ecological Applications 7: 737-750. Williams, M.W.; Hood, E.; Caine, N. 2001. The role of organic nitrogen in the nitrogen cycle of a high-elevation catchment, Colorado Front Range. Water Resources Research 37, 2569-2582. Williams, M.W. and Tonnessen, K.A. 2000. Critical loads for inorganic nitrogen deposition in the Colorado Front Range, USA. Ecological Applications. 10(6): 1648-1665 Wolfe, A.P., Van Gorp, A.C., and Baron, J.S. 2003. Recent ecological and biogeochemical changes in alpine lakes of Rocky Mountain National Park (Colorado, USA): a response to anthropogenic N deposition. Geobiology 1: 153-168. Wolfe, A.P., Baron, J. S., Cornett, J.S. 2001. Anthropogenic nitrogen deposition induces rapid ecological changes in alpine lakes of the Colorado Front Range (USA). Journal of Paleolimnology 25: 1-7. Zeller, K., Harrington, D., Riebau, A., Donev, E. 2000. Annual wet and dry deposition of sulfur and nitrogen in the Snowy Range, Wyoming. Atmospheric Environment 34, 1703-1711.
17
Appendix A: Nitrogen Deposition Data
Appendix A. Figure 1. NADP and snow sampling sites on the western and eastern slopes of the Continental Divide, Colorado (Heuer and others 2000).
18
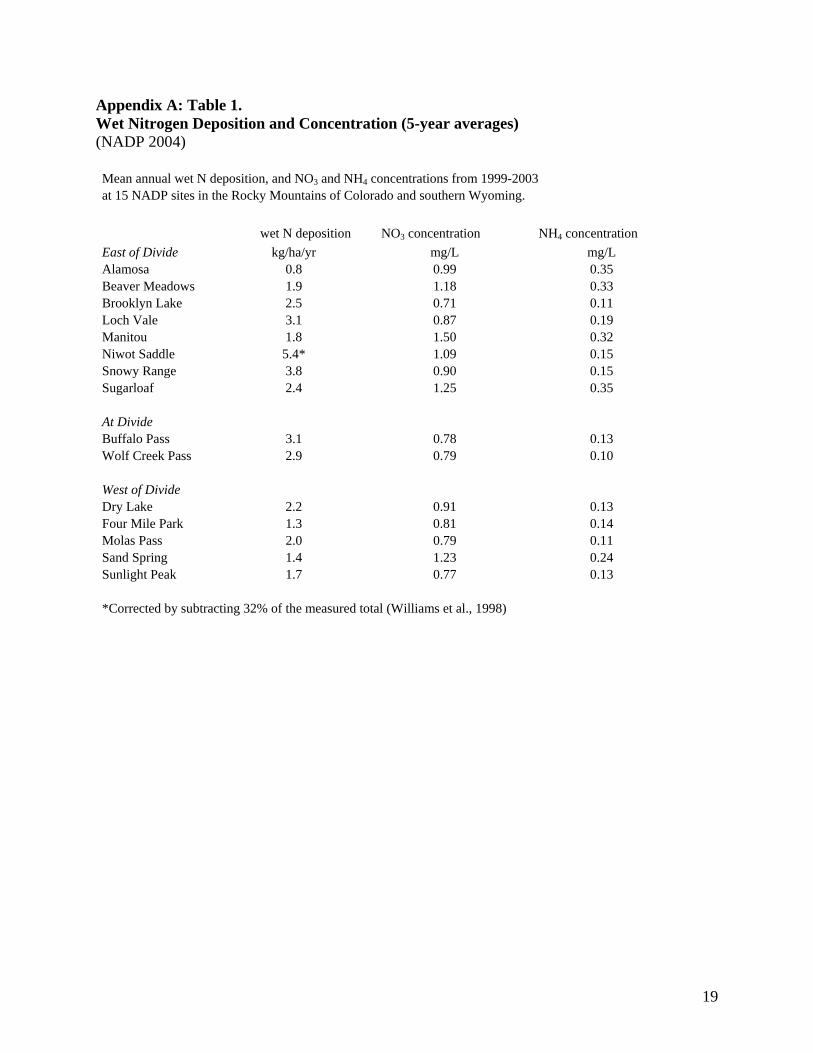
Appendix A: Table 1. Wet Nitrogen Deposition and Concentration (5-year averages) (NADP 2004) Mean annual wet N deposition, and NO3 and NH4 concentrations from 1999-2003 at 15 NADP sites in the Rocky Mountains of Colorado and southern Wyoming. wet N deposition NO3 concentration NH4 concentration East of Divide kg/ha/yr mg/L mg/L Alamosa 0.8 0.99 0.35 Beaver Meadows 1.9 1.18 0.33 Brooklyn Lake 2.5 0.71 0.11 Loch Vale 3.1 0.87 0.19 Manitou 1.8 1.50 0.32 Niwot Saddle 5.4* 1.09 0.15 Snowy Range 3.8 0.90 0.15 Sugarloaf 2.4 1.25 0.35 At Divide Buffalo Pass 3.1 0.78 0.13 Wolf Creek Pass 2.9 0.79 0.10 West of Divide Dry Lake 2.2 0.91 0.13 Four Mile Park 1.3 0.81 0.14 Molas Pass 2.0 0.79 0.11 Sand Spring 1.4 1.23 0.24 Sunlight Peak 1.7 0.77 0.13 *Corrected by subtracting 32% of the measured total (Williams et al., 1998)
19

Appendix A: Figure 2. Trend significance (p=0.10), trend homogeneity (p>0.10), and percent change for nitrate concentration, Dec. 1984 – Nov. 2002. Numeric values indicated at sites with a significant trend (Lehman and others In press). A positive percent change indicates that nitrate is increasing.
20
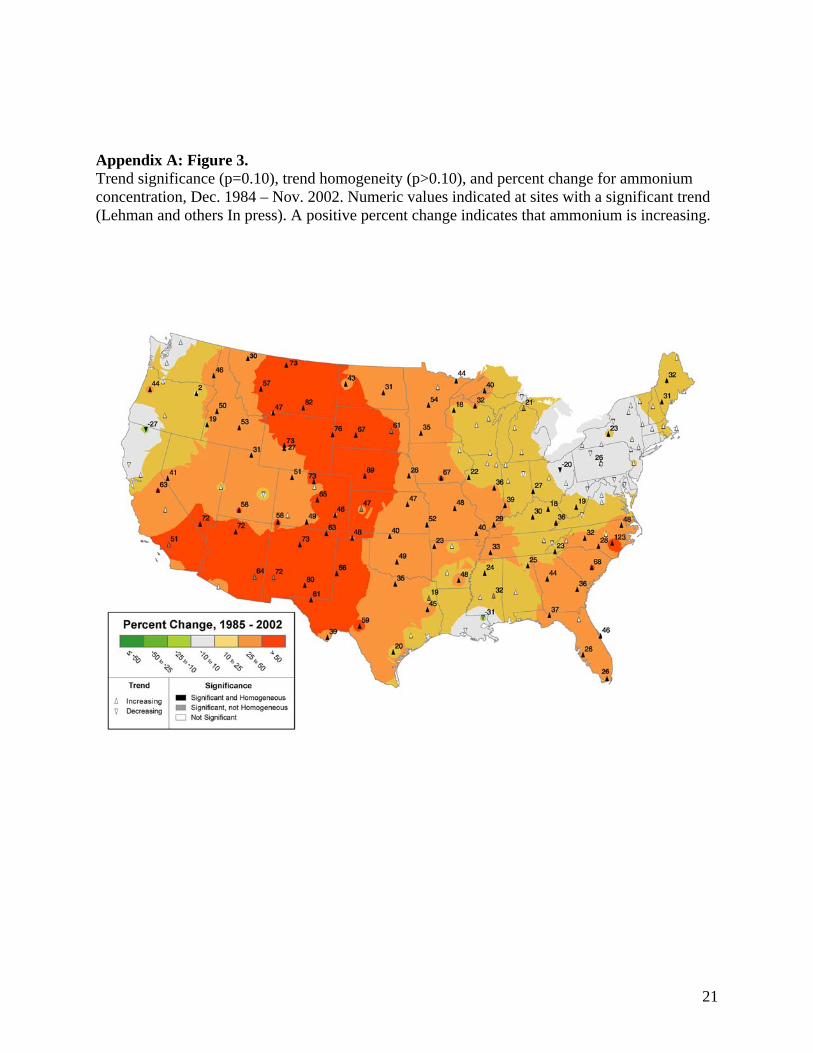
Appendix A: Figure 3. Trend significance (p=0.10), trend homogeneity (p>0.10), and percent change for ammonium concentration, Dec. 1984 – Nov. 2002. Numeric values indicated at sites with a significant trend (Lehman and others In press). A positive percent change indicates that ammonium is increasing.
21

Appendix B: Nitrogen Emissions Source Data Appendix B: Table 1 Colorado Front Range NOx Emissions
YEAR 2002 COLORADO FRONT RANGE NOx EMISSIONS (TONS PER YEAR)
AREA AND NON ROAD SOURCES
Source Category Front Range TOTAL Adams Arapahoe Boulder Broomfield Denver Douglas El Paso Jefferson Larimer Morgan Pueblo Weld
Aircraft 2,037.11 1.20 6.17 2.20 1,881.40 136.53 2.06 1.39 0.07 3.73 2.36 Forest & Struct. Fires 2,735.26 73.68 121.74 163.16 15.93 177.82 404.63 163.34 513.92 100.94 541.62 458.48 Fuel Combustion 6,927.26 460.12 1,157.11 486.59 48.10 2,033.13 249.60 751.95 819.66 372.25 40.29 229.61 278.88 Non-Road 22,953.63 2,452.53 3,186.18 2,102.39 251.55 3,773.08 1,698.60 2,609.37 2,218.46 1,505.29 484.31 636.33 2,035.54 Prescribed Fire 66.73 0.35 3.83 1.68 58.65 0.94 1.28Railroads 6,918.00 999.46 408.71 340.89 75.69 244.23 497.07 775.19 309.83 71.03 1,009.56 816.76 1,369.59 Woodburning 534.97 17.89 17.76 19.48 2.22 29.54 11.50 279.70 44.62 34.56 5.71 49.90 22.10 TOTAL 42,172.97 4,004.88 4,897.67 3,115.07 377.55 7,977.30 2,634.59 4,961.19 3,559.66 2,557.09 1,640.87 2,278.89 4,168.22
Source Category Front Range TOTAL Adams Arapahoe Boulder Broomfield Denver Douglas El Paso Jefferson Larimer Morgan Pueblo Weld POINT SOURCES 65,385.24 13,014.14 746.26 4,804.59 14.05 5,789.22 75.04 8,640.73 2,742.38 4,373.67 6,479.39 9,918.11 8,787.66
Source Category Front Range TOTAL Adams Arapahoe Boulder Broomfield Denver Douglas El Paso Jefferson Larimer Morgan Pueblo Weld HIGHWAY SOURCES 84,311.57 8,829.38 10,022.15 5,484.91 1,255.09 13,021.49 5,414.49 10,917.27 11,823.85 5,968.62 1,221.61 3,715.70 6,637.03
Source Category Front Range TOTAL Adams Arapahoe Boulder Broomfield Denver Douglas El Paso Jefferson Larimer Morgan Pueblo Weld Biogenics
9,141.52 1,032.90 801.90 265.40 10.75 433.42 228.74 929.75 92.88 731.02 1,493.33 595.85 2,525.58
Source Type Front Range TOTAL Adams Arapahoe Boulder Broomfield Denver Douglas El Paso Jefferson Larimer Morgan Pueblo Weld GRAND TOTAL 201,011.31 26,881.30 16,467.98 13,669.97 1,657.43 27,221.43 8,352.86 25,448.94 18,218.75 13,630.40 10,835.20 16,508.55 22,118.49
Source: State of Colorado Ozone Action Plan, adopted by the Colorado Air Quality Control Commission on 3/12/04
22
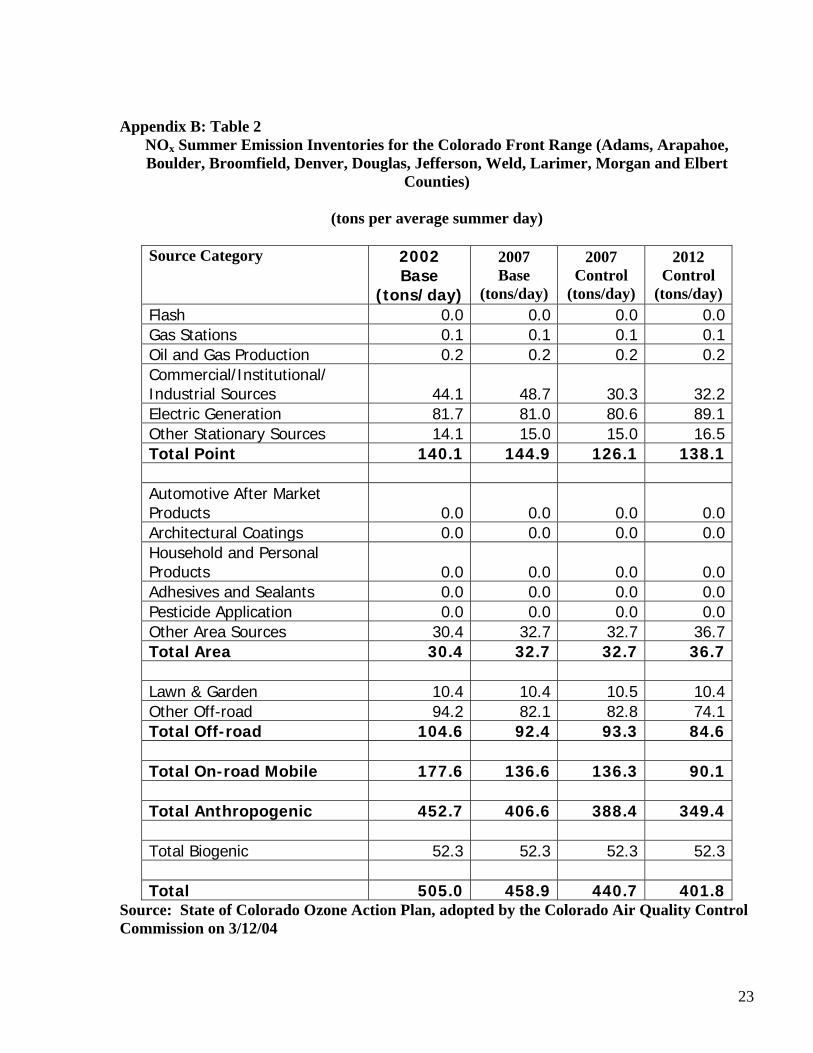
Appendix B: Table 2
NOx Summer Emission Inventories for the Colorado Front Range (Adams, Arapahoe, Boulder, Broomfield, Denver, Douglas, Jefferson, Weld, Larimer, Morgan and Elbert
Counties)
(tons per average summer day)
Source Category 2002 Base
(tons/day)
2007 Base
(tons/day)
2007 Control
(tons/day)
2012 Control
(tons/day) Flash 0.0 0.0 0.0 0.0Gas Stations 0.1 0.1 0.1 0.1Oil and Gas Production 0.2 0.2 0.2 0.2Commercial/Institutional/ Industrial Sources 44.1 48.7 30.3 32.2Electric Generation 81.7 81.0 80.6 89.1Other Stationary Sources 14.1 15.0 15.0 16.5Total Point 140.1 144.9 126.1 138.1 Automotive After Market Products 0.0 0.0 0.0 0.0Architectural Coatings 0.0 0.0 0.0 0.0Household and Personal Products 0.0 0.0 0.0 0.0Adhesives and Sealants 0.0 0.0 0.0 0.0Pesticide Application 0.0 0.0 0.0 0.0Other Area Sources 30.4 32.7 32.7 36.7Total Area 30.4 32.7 32.7 36.7 Lawn & Garden 10.4 10.4 10.5 10.4Other Off-road 94.2 82.1 82.8 74.1Total Off-road 104.6 92.4 93.3 84.6 Total On-road Mobile 177.6 136.6 136.3 90.1 Total Anthropogenic 452.7 406.6 388.4 349.4 Total Biogenic 52.3 52.3 52.3 52.3 Total 505.0 458.9 440.7 401.8
Source: State of Colorado Ozone Action Plan, adopted by the Colorado Air Quality Control Commission on 3/12/04
23
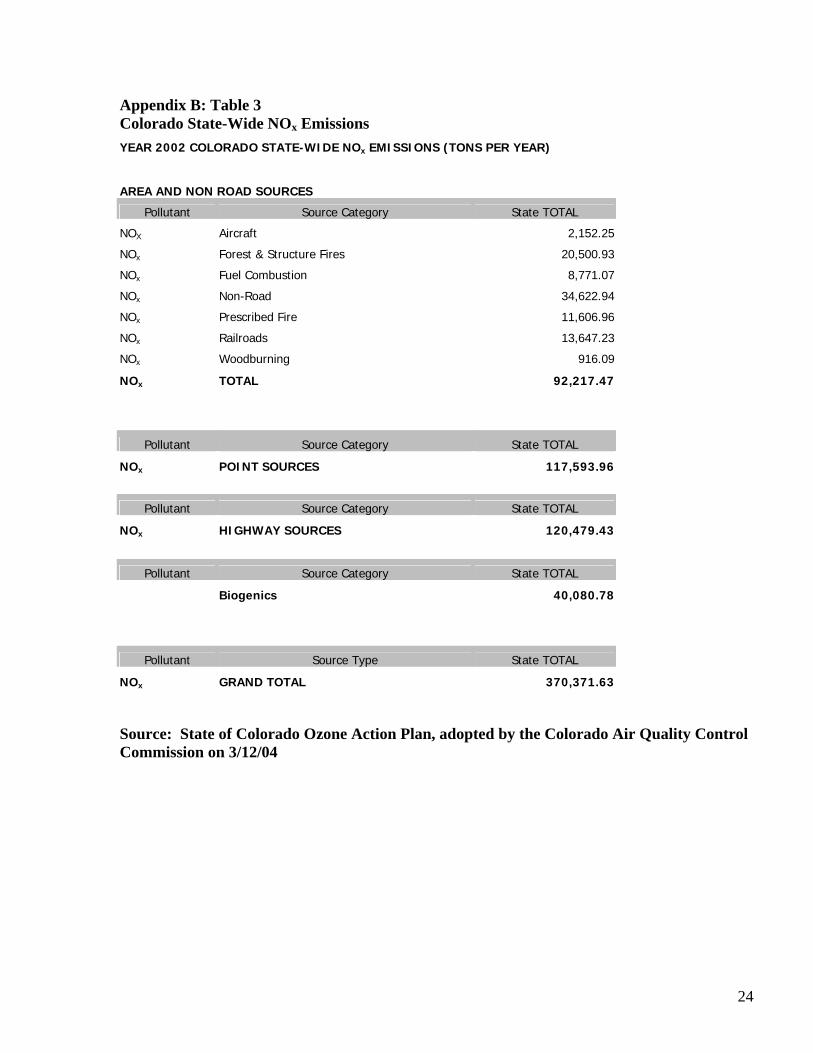
Appendix B: Table 3 Colorado State-Wide NOx Emissions YEAR 2002 COLORADO STATE-WIDE NOx EMISSIONS (TONS PER YEAR)
AREA AND NON ROAD SOURCES
Pollutant Source Category State TOTAL
NOX Aircraft 2,152.25
NOx Forest & Structure Fires 20,500.93
NOx Fuel Combustion 8,771.07
NOx Non-Road 34,622.94
NOx Prescribed Fire 11,606.96
NOx Railroads 13,647.23
NOx Woodburning 916.09
NOx TOTAL 92,217.47
Pollutant Source Category State TOTAL
NOx POINT SOURCES 117,593.96
Pollutant Source Category State TOTAL
NOx HIGHWAY SOURCES 120,479.43
Pollutant Source Category State TOTAL
Biogenics 40,080.78
Pollutant Source Type State TOTAL
NOx GRAND TOTAL 370,371.63
Source: State of Colorado Ozone Action Plan, adopted by the Colorado Air Quality Control Commission on 3/12/04
24
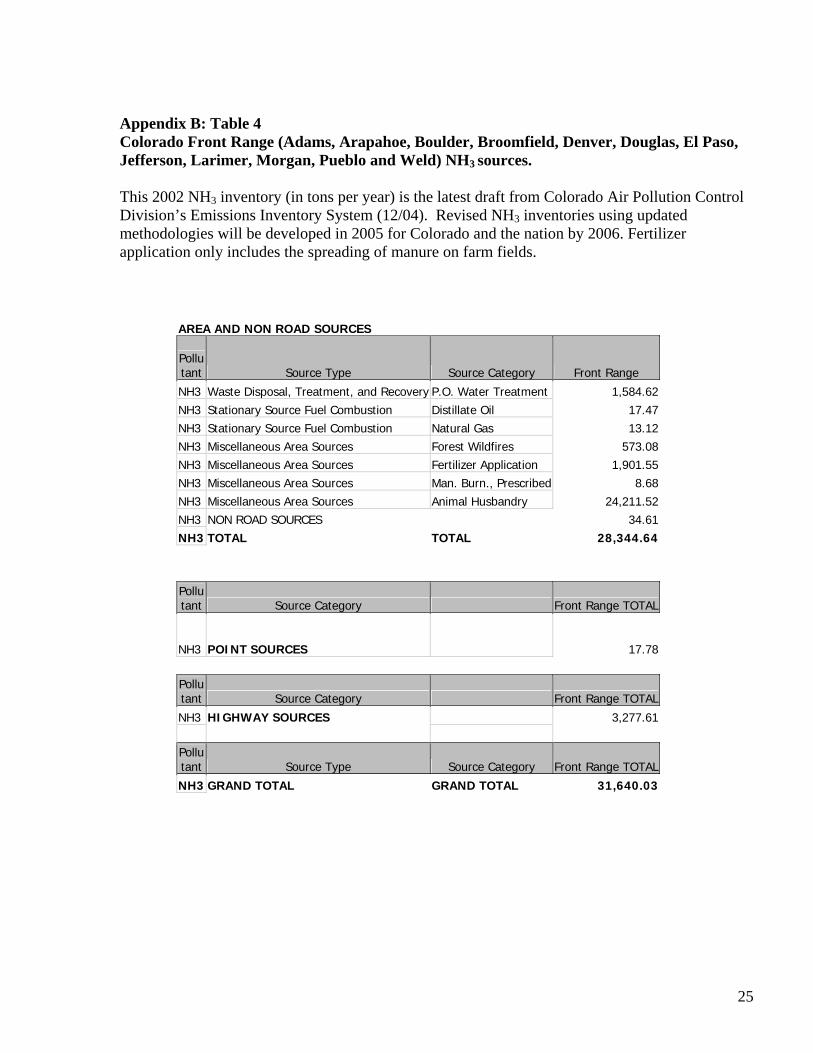
Appendix B: Table 4 Colorado Front Range (Adams, Arapahoe, Boulder, Broomfield, Denver, Douglas, El Paso, Jefferson, Larimer, Morgan, Pueblo and Weld) NH3 sources. This 2002 NH3 inventory (in tons per year) is the latest draft from Colorado Air Pollution Control Division’s Emissions Inventory System (12/04). Revised NH3 inventories using updated methodologies will be developed in 2005 for Colorado and the nation by 2006. Fertilizer application only includes the spreading of manure on farm fields.
AREA AND NON ROAD SOURCES
Pollutant Source Type Source Category Front Range
NH3 Waste Disposal, Treatment, and Recovery P.O. Water Treatment 1,584.62NH3 Stationary Source Fuel Combustion Distillate Oil 17.47NH3 Stationary Source Fuel Combustion Natural Gas 13.12NH3 Miscellaneous Area Sources Forest Wildfires 573.08NH3 Miscellaneous Area Sources Fertilizer Application 1,901.55NH3 Miscellaneous Area Sources Man. Burn., Prescribed 8.68NH3 Miscellaneous Area Sources Animal Husbandry 24,211.52NH3 NON ROAD SOURCES 34.61NH3 TOTAL TOTAL 28,344.64 Pollutant Source Category Front Range TOTAL
NH3 POINT SOURCES 17.78 Pollutant Source Category Front Range TOTAL
NH3 HIGHWAY SOURCES 3,277.61 Pollutant Source Type Source Category Front Range TOTAL
NH3 GRAND TOTAL GRAND TOTAL 31,640.03
25

Appendix B: Table 5 This NH3 inventory is the latest draft from Colorado Air Pollution Control Division’s Emissions Inventory System (12/04). Revised inventories using updated methodologies will be developed in 2005 for Colorado and the nation for use by 2006. Fertilizer application only includes the spreading of manure on farm fields
YEAR 2002 COLORADO STATE-WIDE NH3 EMISSIONS (TONS PER YEAR)
AREA AND NON ROAD SOURCES
Pollutant Source Type Source Category State TOTAL
NH3 Waste Disposal, Treatment, and Recovery Public Owned 1,932.38
NH3 Stationary Source Fuel Combustion Distillate Oil 21.75 NH3 Stationary Source Fuel Combustion Natural Gas 16.80
NH3 Miscellaneous Area Sources Managed Burning, Prescribed 13,580.15
NH3 Miscellaneous Area Sources Fertilizer Application 8,021.33 NH3 Miscellaneous Area Sources Forest Wildfires 4,297.90 NH3 Miscellaneous Area Sources Animal Husbandry 56,712.58 NH3 NON ROAD SOURCES 51.99 NH3 TOTAL TOTAL 84,634.88
Pollutant Source Category State TOTAL
NH3 POINT SOURCES 20.29
Pollutant Source Category State TOTAL
NH3 HIGHWAY SOURCES 4,403.41
Pollutant Source Type Source Category State TOTAL
NH3 GRAND TOTAL GRAND TOTAL 89,058.58
.
26

Appendix C: Ozone and Visibility Data Appendix C: Table 1. 8-Hour Ozone Data for Rocky Mountain National Park. Source: State of Colorado Ozone Action Plan, adopted by the Colorado Air Quality Control Commission on 3/12/04.
4th Maximum Concentrations at Rocky Mountain NP
2001 2002 2003 20042001-2003
2002-2004
8-hr. O3 8-hr. O3 8-hr. O3 8-hr. O3 3-yr. Avg. 3-yr. Avg.4th Max. 4th Max. 4th Max. 4th Max. 4th Max. 4th Max.
Value Value Value Value Value Value (ppm) (ppm) (ppm) (ppm) (ppm) (ppm)
0.070
0.087
0.087
0.073
0.081
0.082
Exceedances of Federal Health-Based Ozone Standard in Rocky Mountain NP
Year Number of Exceedances
Maximum 8-hr Concentration
(ppb)
4th Highest 8-hr Concentration
(ppb) 2004 0 77 73 2003 7 92 87 2002 6 92 87 2001 0 80 70 2000 2 90 78 1999 1 85 73 1998 3 88 80
* An exceedance of the ozone NAAQS occurs when the maximum daily 8-hour average concentration is greater than 84 ppb. 2004 was a cool, wet year, so ozone formation was limited.
27
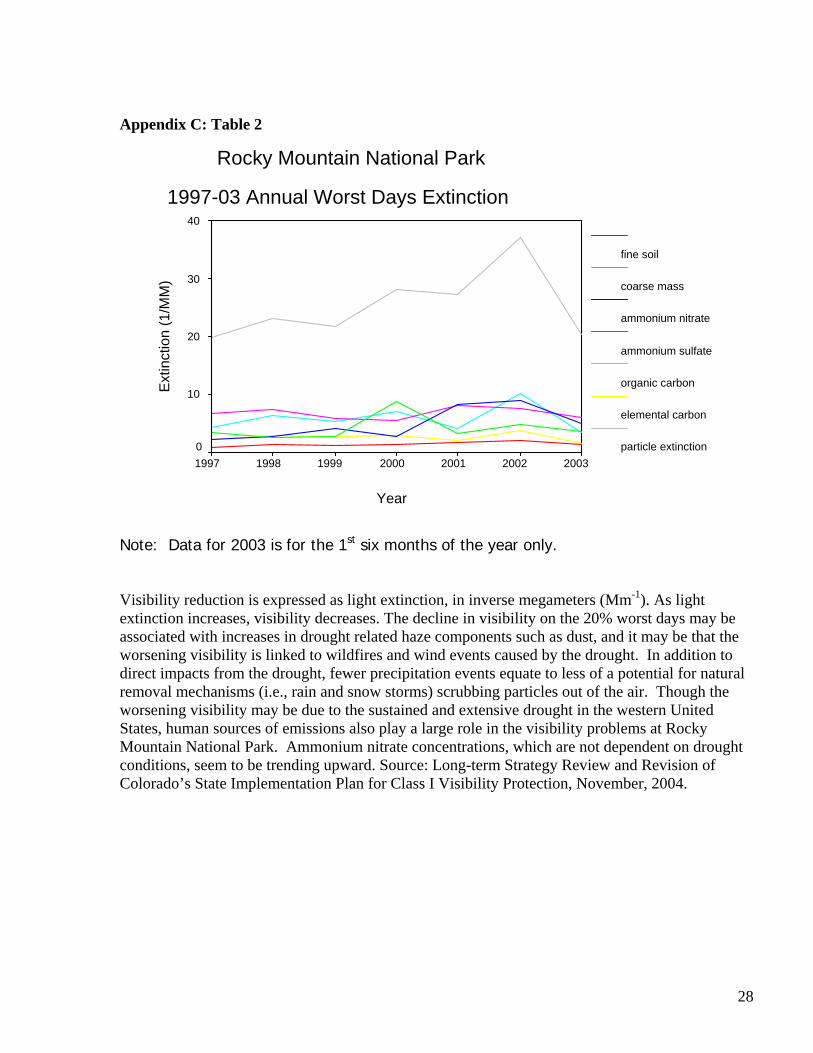
Appendix C: Table 2
Rocky Mountain National Park
1997-03 Annual Worst Days Extinction
Year
2003200220012000199919981997
Ext
inct
ion
(1/M
M)
40
30
20
10
0
fine soil
coarse mass
ammonium nitrate
ammonium sulfate
organic carbon
elemental carbon
particle extinction
Note: Data for 2003 is for the 1st six months of the year only. Visibility reduction is expressed as light extinction, in inverse megameters (Mm-1). As light extinction increases, visibility decreases. The decline in visibility on the 20% worst days may be associated with increases in drought related haze components such as dust, and it may be that the worsening visibility is linked to wildfires and wind events caused by the drought. In addition to direct impacts from the drought, fewer precipitation events equate to less of a potential for natural removal mechanisms (i.e., rain and snow storms) scrubbing particles out of the air. Though the worsening visibility may be due to the sustained and extensive drought in the western United States, human sources of emissions also play a large role in the visibility problems at Rocky Mountain National Park. Ammonium nitrate concentrations, which are not dependent on drought conditions, seem to be trending upward. Source: Long-term Strategy Review and Revision of Colorado’s State Implementation Plan for Class I Visibility Protection, November, 2004.
28

Appendix C: Table 3
Rocky Mountain National Park
1997-03 Worst Day Annual Avg. Deciview
Year
2003200220012000199919981997
Dec
ivie
w
16
15
14
13
12
11
10
1997-2001 Monitored Visibility Data Worst
20% Days (deciviews)
2018 Preliminary
Reasonable Progress Visibility
Target Values Worst 20% Days
(deciviews)
Difference between 1997-2001 observed
and Preliminary 2018 Reasonable
Progress Estimates (deciviews)
Rocky Mountain National Park
13.4
11.69
1.71
Visibility is expressed in deciviews for the purpose of tracking progress under the Regional Haze Rule. A deciview is a unit of visibility proportional to the logarithm of atmospheric light extinction; therefore, as haze increases and visibility decreases, the deciview measure increases. The visibility monitoring data for the period 2000-2004, not 1997-2001 as presented above, will be used determine reasonable progress for Rocky Mountain NP in the Colorado State Implementation Plan. Source: Long-term Strategy Review and Revision of Colorado’s State Implementation Plan for Class I Visibility Protection, November, 2004.
29

30