nitrogen dioxide diffusion tube survey: annual report 2010 · ealing nitrogen dioxide diffusion...
TRANSCRIPT

Environment
London Borough of Ealing October 2011
Nitrogen Dioxide Diffusion Tube Survey: Annual Report 2010

Prepared by: ................................... Checked by: ............................ Alistair Thorpe Dr Gareth Collins Environmental Scientist Technical Director
Approved by: ............................. Michele Hackman Technical Director Nitrogen Dioxide Diffusion Tube Survey: Annual Report 2010
Rev No Comments Checked by Approved by
Date
1 Draft Report GMC MH May 11 2 Final Report GMC MH Oct 11
9th & 10th Floors, Sunley House, 4 Bedford Park, CR0 2AP Telephone: 020 8639 3500 Website: http://www.aecom.com Job No 145337 Reference v.03.11 Date Created October 2011 This document has been prepared by AECOM Limited for the sole use of our client (the “Client”) and in accordance with generally accepted consultancy principles, the budget for fees and the terms of reference agreed between AECOM Limited and the Client. Any information provided by third parties and referred to herein has not been checked or verified by AECOM Limited, unless otherwise expressly stated in the document. No third party may rely upon this document without the prior and express written agreement of AECOM Limited. f:\projects\environmental services - ealing diffusion tubes\reports\aecom report ealing diffusion tubes v2.doc

Executive Summary ................................................................................................................................................................ 2
1 Introduction................................................................................................................................................................ 3
1.1 Overview ........................................................................................................................................................ 3
1.2 Legislation and Policy Background................................................................................................................... 3
2 Methodology .............................................................................................................................................................. 4
2.1 Procedures and Site Changes ......................................................................................................................... 4
2.2 Tube Preparation, Analysis and QA/QC ........................................................................................................... 4
2.3 Factors Affecting Diffusion Tube Performance .................................................................................................. 4
2.4 Data Validation................................................................................................................................................ 5
2.5 Site Details ..................................................................................................................................................... 5
3 Results ....................................................................................................................................................................... 6
3.1 Data Capture .................................................................................................................................................. 6
3.2 Bias Adjustment .............................................................................................................................................. 6
3.3 Annual Mean NO2 Concentrations ................................................................................................................... 7
3.4 Comparison With Objectives ............................................................................................................................ 8
3.5 Variation With Height ....................................................................................................................................... 9
3.6 Seasonal Variation .......................................................................................................................................... 9
3.7 Historical Trends in NO2 ................................................................................................................................ 10
4 Conclusions and Recommendations....................................................................................................................... 12
Appendix A: Diffusion Tube Sites Details ................................................................................................................. 13
Appendix B: Bias Adjustment Calculations ............................................................................................................... 26
Appendix A: Diffusion Tube Sites Details ........................................................................................................................... 13
Appendix B: Bias Adjustment Calculations ........................................................................................................................ 26
Table 1: UK and EU Air Quality Objectives for NO2 and NOX .................................................................................................3
Table 2: Site Type Designation Criteria, based on AEAT Practical Guidance ......................................................................5
Table 3: Data Capture Rates, Ealing Diffusion Tube Network, 2006 – 2010 ...........................................................................6
Table 4: Summary of Continuous Monitoring Data and Local Bias Adjustment Factors, 2010 .............................................7
Table 5: Summary of National Bias Adjustment Factors, 2010 ..............................................................................................7
Table 6: Annual Mean NO2 Concentrations in Ealing, 2010 ...................................................................................................8
Table 7: Sites Exceeding Annual Mean NO2 Objective, 2010 .................................................................................................8
Table 8: Sites With Bias Adjusted Annual Mean NO2 Greater Than 60 µg/m3, 2010 ..............................................................9
Table 9: Annual Mean NO2 Concentrations in Ealing, 2010 ...................................................................................................9
Table 10: Monthly Mean Raw NO2 Concentrations in Ealing, 2010 ..................................................................................... 10
Table 11: Raw Winter and Summer Period Mean Concentrations in Ealing, 2010 .............................................................. 10
Table 12: Ealing Diffusion Tube Network Monitoring Site Details, 2010 .............................................................................. 14
Table 13: Local Bias Adjustment Factor Calculation, Ealing Town Hall ............................................................................. 27
Table 14: Local Bias Adjustment Factor Calculation, Acton Town Hall .............................................................................. 28
Table 15: Local Bias Adjustment Factor Calculation, Southall (Blair Peach School) ......................................................... 29
Table 16: National Bias Adjustment Factor Calculation, Roadside and Kerbside Sites ..................................................... 30
Table 17: National Bias Adjustment Factor Calculation, Near-Road Sites .......................................................................... 31
Table 18: National Bias Adjustment Factor Calculation, Urban Background Sites ............................................................. 31
Figure 1: Historic NO2 Diffusion Tube Concentrations (Annual Mean, Uncorrected) in the London Borough of Ealing ... 11
Figure 2: Monitoring Sites in Ealing – Northolt and Greenford ........................................................................................... 20
Figure 3: Monitoring Sites in Ealing – Southall and Hanwell .............................................................................................. 21
Figure 4: Monitoring Sites in Ealing – Ealing Town and Haven Green ............................................................................... 22
Figure 5: Monitoring Sites in Ealing – South Ealing ............................................................................................................ 23
Figure 6: Monitoring Sites in Ealing – Acton Town and Surrounding Area ........................................................................ 24
Figure 7: Monitoring Sites in Ealing – North Acton and Park Royal ................................................................................... 25
Table of Contents


AECOM Nitrogen Dioxide Diffusion Tube Survey: Annual Report 2010 2
Capabilities on project:
Environment
The London Borough of Ealing Diffusion Tube Network was established several years ago to provide insight into the spatial and temporal variation of nitrogen dioxide (NO2) concentrations throughout the Borough. The network currently comprises 100 sites, including several long-term monitoring sites, and supplements continuous monitoring activities undertaken at several locations within the Borough.
This report provides an analysis of the data collected during the 2010 monitoring period, running from the week commencing 4
th January 2010 to the week commencing 3
rd January 2011. The bias adjusted annual mean NO2
concentrations are presented along with the raw monthly results and details of the bias adjustment calculation. The final results have been compared with the annual mean NO2 objective to indicate areas of exceedence. A comparison is drawn with historical NO2 concentration data from the network to look for evidence of long-term trends and significant changes in pollutant levels at specific locations.
Four new sites were established during the 2010 survey period in response to concerns raised by local residents of pollution concentrations in their area. Good data capture was achieved across the network with 95 sites having greater than 75% data capture and 87 sites having greater than 90%. All sites are classified according to the Practical Guidance for Diffusion Tube Monitoring. All sites are categorised as either “kerbside”, “roadside”, “near-road”, or “urban background”.
The highest recorded annual mean NO2 concentration was measured at by the single tube site at Fernlea House, Hangar Lane (82.8 µg/m
3). In total 76 sites in the survey were found to exceed the annual mean NO2 objective and
15 sites were determined to be likely to exceed the hourly objective.
Executive Summary

AECOM Nitrogen Dioxide Diffusion Tube Survey: Annual Report 2010 3
Capabilities on project:
Environment
1.1 Overview
AECOM was commissioned in December 2009 to manage and maintain the operation of the London Borough of Ealing nitrogen dioxide diffusion tube monitoring network. The network covers 100 sites throughout the Borough, providing information on the spatial and temporal variation in NO2 concentrations in the area. The diffusion tube network supplements data collected at six continuous monitoring stations within the Borough providing high-resolution real-time measurements of NO2 concentrations. These sites are located at Horn Lane, Hangar Lane Gyratory, Acton Town Hall, Ealing Town Hall, Blair Peach School (Southall) and Western Avenue.
This report covers the 2010 diffusion tube monitoring period from January to December 2010. It describes details of bias adjustment of the raw diffusion tube results, reports upon the annual mean concentrations and analyses the spatial and temporal variations at locations in the Borough.
1.2 Legislation and Policy Background
Limit values and air quality objectives for nitrogen dioxide and oxides of nitrogen (NOX) were set out in the First Daughter Directive (1999/30/EC) and subsequent revisions. An annual mean NO2 objective was set at 40 µg/m
3 to
be achieved by 1st January 2010. A 200 µg/m
3 hourly mean standard not to be exceeded more than 18 hours per
year was also outlined, to be achieved by the same compliance date. These objectives were reiterated in the 2008 Directive on ambient air quality and cleaner air for Europe (2008/50/EC).
The UK published its own Air Quality Strategy, which detailed the UK’s position on nitrogen dioxide. The UK air quality objectives differ from the European objectives only in their compliance dates; the UK objectives were to be achieved by the end of 2005. European and UK air quality objectives have also been set for oxides of nitrogen for the protection of vegetation and ecosystems. A summary of the principal air quality objectives for NO2 and NOX is given in Table 1.
Table 1: UK and EU Air Quality Objectives for NO2 and NOX
Pollutant
UK Air Quality Objectives
Standard / Concentration Measured as Date to be achieved by
and maintained thereafter
Nitrogen Dioxide
200 µg/m3 not to be
exceeded more than 18 times a year
1 Hour Mean 31.12.2005
40 µg/m3 Annual Mean
Nitrogen Oxides (for the protection of vegetation)
30 µg/m3 Annual Mean 31.12.2000
EU Air Quality Objectives
Standard / Concentration Measured as Date to be achieved by
and maintained thereafter
Nitrogen Dioxide
200 µg/m3 not to be
exceeded more than 18 times per year
1 Hour Mean 1 January 2010
40 µg/m3 Annual Mean
Nitrogen Oxides (assuming as nitrogen dioxide)
30 µg/m3 Annual Mean 19 July 2001
1 Introduction

AECOM Nitrogen Dioxide Diffusion Tube Survey: Annual Report 2010 4
Capabilities on project:
Environment
2.1 Procedures and Site Changes
At the beginning of 2010 the Ealing Diffusion Tube Network covered a total of 96 sites distributed throughout the Borough. In February 2010 a monitoring site at Haven Green Court residential care home was added to the network. Co-location study sites were set up at Ealing Horn Lane and Western Avenue continuous monitoring stations in March and April, respectively. The total number of sites was increased to 100 and the number of tubes deployed to 125 in June 2010 with the addition of one tube at Sinton Andrews Estate Agent, Haven Green.
Triplicate tubes are deployed at 12 sites with single tubes being deployed at the remaining sites. Of the triplicate sites, five are co-located with continuous analysers. At Wendover Court, Western Avenue, four tubes are installed, one on each floor of the building, to monitor the variation in NO2 with height.
Tubes were collected and replaced every four to five weeks in accordance with the UK Diffusion Tube Calendar 1.
All tubes were stored in a refrigerator prior to deployment and after collection and were transported to and from site in a portable cooler. Any tubes exposed outside of the time frame dictated by the calendar have been removed from the dataset. Tubes subject to contamination (e.g. spider webs, foreign bodies etc.) or vandalised have also been excluded from the final dataset.
2.2 Tube Preparation, Analysis and QA/QC
The diffusion tubes were supplied and analysed by Gradko International Ltd. To maintain consistency with previous monitoring the preparation method used was 20% v/v triethanolamine in water. Gradko International Ltd. participate in the Health and Safety Laboratory’s Workplace Analysis Scheme for Proficiency (WASP) scheme, which provides a Quality Assurance / Quality Control framework for local authorities carrying out diffusion tube monitoring as a part of their local air quality management process. Gradko International Ltd. achieved a Performance Criteria Score of “Good” in the laboratory performance testing rounds during 2010
2.
2.3 Factors Affecting Diffusion Tube Performance
NO2 diffusion tubes are an indicative monitoring technique, as they do not offer the same accuracy as the reference method for NO2, the automatic chemiluminescence analyser. NO2 diffusion tubes are affected by several factors, which may cause them to exhibit bias relative to the reference technique.
Over-estimation may be attributed to one of the three interfering factors:
- The shortening of the diffusive path length caused by the wind - The blocking of UV light resulting in reduced NO2 photolysis in the tube - The interference effects of peroxyacetyl nitrate (PAN).
Under-estimation can be caused by the following factors:
- Increasing exposure period. This is thought to be due to degradation of the absorbed nitrate with time - Insufficient extraction of nitrite from the meshes. - The photochemical degradation of the triethanolamine-nitrite complex by light. This has been minimised by the
use of opaque end-caps. - The solution used. For example, 50% v/v solution of TEA in water has been reported to lead to comparatively
reduced NO2 uptake.
There are a number of additional factors that may also affect diffusion tube performance including time of the year, the exposure setting (i.e. sheltered or open sites), the proximity to roads, the preparation method and analytical laboratory used, the exposure concentration and the ratio of NO2 to NOX.
1 UK Diffusion Tube Calendar 2010. Details of exposure dates and tube changeover dates available from http://www.airquality.co.uk .
2 WASP – Annual Performance Criteria for NO2 Diffusion Tubes used in Local Air Quality Management (LAQM), 2008 onwards, and Summary of
Laboratory Performance in Rounds 105-10. September 2010. Available from http://laqm1.defra.gov.uk .
2 Methodology

AECOM Nitrogen Dioxide Diffusion Tube Survey: Annual Report 2010 5
Capabilities on project:
Environment
2.4 Data Validation
Validation of diffusion tube readings is vital to ensure public confidence in the measurements produced. Validation is achieved through comparison of diffusion tube readings co-located alongside a continuous monitor. The comparison of the NO2 concentration as measured by the diffusion tube with the continuous monitor measurement is used to derive a bias adjustment factor. Bias adjustment factors can also be obtained using the Nitrogen Dioxide Diffusion Tube Bias Adjustment spreadsheet
3, which is updated periodically and collates the bias-adjustment
factors obtained in co-location studies conducted nationally.
There are six operational continuous NO2 monitoring sites within the Borough which are affiliated to the London Air Quality Network (LAQN). Co-location studies were conducted at three of the six sites for the whole of 2010. Co-location at Ealing Horn Lane commenced in March 2010. The site at Western Avenue was commissioned in March 2010 with co-located tubes being positioned in April 2010. The results of the co-location studies have been used to derive a local bias adjustment factor to correct the raw diffusion tube measurements.
2.5 Site Details
2.5.1 Locations
Single and triplicate tubes are positioned at more than 90 locations throughout the Borough at locations representing kerbside, roadside, near road (intermediate) and urban background sites and, where possible, to be in locations of relevant exposure. See section 2.5.2 for details of site designations. The tube locations, along with a full list of period mean raw and bias adjusted NO2 concentrations are listed in Appendix A.
2.5.2 Site Designations
The designation of site types was used to compare different locations statistically. Sites were categorised as kerbside, roadside, near road (intermediate) and urban background sites according to the definitions given in the “Practical Guidance for Diffusion Tube Monitoring”
4 report. These definitions are reproduced in Table 2 below. Site
type designations are included in the site details in Appendix A.
Table 2: Site Type Designation Criteria, based on AEAT Practical Guidance 4
Site Type Definition
Kerbside Within 1 m of the kerb.
Roadside Between 1 m and 5 m from the kerb.
Near Road More than 5 m from kerb of a nearby busy road but air quality is likely to be affected
by the busy road.
Urban Background
>50 m from any major NO2 source, e.g. multi-storey car parks;
>30 m from any very busy road (>30,000 vehicles per day);
>20 m from any busy road (10,000 – 30,000 vehicles per day)
>10 m from any main road (quiet roads in residential estates are acceptable);
>5m from any area where vehicles are likely to be idling.
3 Spreadsheet of Combined Bias Adjustment Factors. Available for download from http://laqm1.defra.gov.uk/review/tools/no2/baf-national.php .
4 AEAT (2008). Diffusion Tubes for Ambient NO2 Monitoring: Practical Guidance. Report to Defra & the Devolved Administrations. Report Ref:
AEAT/ENV/R/2504

AECOM Nitrogen Dioxide Diffusion Tube Survey: Annual Report 2010 6
Capabilities on project:
Environment
3.1 Data Capture
Data capture for the whole network in 2010 was very good (95.7%) and is summarised in Table 3. Good data capture (greater than 90%) was achieved at 87 of the 100 sites. Wendover Court, Western Avenue – Top Floor suffered from numerous thefts, resulting in only 58.3% data capture. Data capture for the Sinton Andrews tube at Haven Green achieved 100% data capture from its installation in June 2010, giving an overall data capture rate for the year of 58.3%. The site at Brent Lodge was affected by construction work and vandalism leading to data capture for 2010 of 75%.
The co-located tubes at Western Avenue AQMS were introduced in April 2010 and 100% data capture was achieved for the period April to December 2010 (75% data capture for 2010 as a whole). Similarly, 100% data capture was achieved at Ealing Horn Lane after the tubes were installed in March 2010. Two months of data were lost at Southfields School due to access problems during holiday periods. The sites at 156 Horn Lane, Jubilee Gardens Library, 14 Bond Street, 181 Castle Road, 200 Boston Road and the middle of Haven Green were subject to thefts leading to less than 90% data capture.
Table 3: Data Capture Rates, Ealing Diffusion Tube Network, 2006 – 2010
Site Type Data Capture (%)
2006 2007 2008 2009 2010
All Sites 96.1 93.4 91.4 93.7 95.7
Roadside / Kerbside 96.5 96.4 94.7 96.0 94.3
Near Roadside 98.8 95.9 90.9 94.3 96.8
Urban Background 90.1 87.5 86.1 89.6 97.2
3.2 Bias Adjustment
The results of the three co-location studies were used to calculate a local bias adjustment factor (Ealing Town Hall, Acton Town Hall and Blair Peach School, Southall). Data from Western Avenue and Horn Lane were not used due to insufficient data capture. The triplicate tubes at Hangar Lane are not strictly co-located with the continuous monitor and so this comparison was also excluded.
The AEA Diffusion Tube Precision Accuracy Bias Spreadsheet 5 tool was used to calculate bias adjustment factors
for each co-location site. Continuous monitoring data was sourced from the London Air Quality Network (LAQN) website
6. It should be noted that the continuous monitoring data used in the bias adjustment calculations has not
been ratified for the entirety of 2010 and may therefore be subject to change (see Table 3 and associated footnotes). Further details can be found in Appendix B.
Data capture rates for the continuous analysers at Acton Town Hall in August and November at Ealing Town Hall were low and so were excluded from the bias adjustment calculation. The September data for Blair Peach School (Southall) were rejected on the grounds of poor tube precision.
5 AEA Diffusion Tube Precision Accuracy Bias Spreadsheet. Downloaded from http://laqm1.defra.gov.uk/review/tools/no2/precision 14/02/2011.
6 London Air Quality Network Website: http://www.londonair.org.uk accessed 14/02/2011.
3 Results

AECOM Nitrogen Dioxide Diffusion Tube Survey: Annual Report 2010 7
Capabilities on project:
Environment
Table 4: Summary of Continuous Monitoring Data and Local Bias Adjustment Factors, 2010
Site Name Site Type Annual Mean NO2
Concentration (µg/m3)
Data Capture (%)
Bias Adjustment Factor
Ealing Town Hall Near Roadside 43.8 92.8 1.06
Acton Town Hall Roadside / Kerbside 53.7 93.1 1.02
Southall (Blair Peach School) Urban Background 30.1 99.1 1.01 Notes: Data from Ealing Town Hall and Acton Town Hall ratified to 18/02/2010;
Data from Southall ratified to 11/02/2010;
Bias adjustment factors were also sourced from the national Spreadsheet of Combined Bias Adjustment Factors 7
for comparison purposes. However, due to the acceptable data capture in the local co-location studies, the local bias adjustment factors in Table 3 have been applied to all of the raw diffusion tube data according to the site type designation.
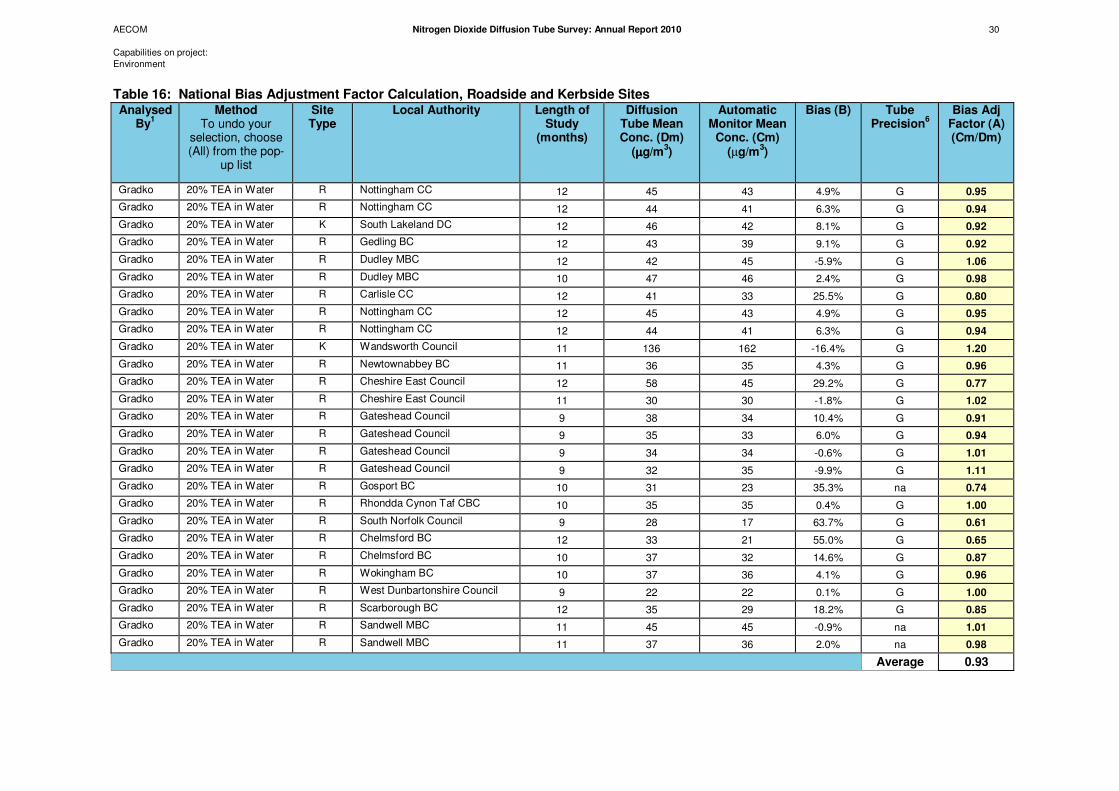
Table 5: Summary of National Bias Adjustment Factors, 2010
Site Type Designation Number of Studies Bias Adjustment
Factor
Roadside & Kerbside 27 0.93
Near Road (Urban Centre) 3 0.98
Urban Background 5 0.98
Note: Figures taken from Spreadsheet of Combined Bias Adjustment Factors (Version 04.2011).
Inputs used: Analysed By – Gradko International Ltd; Method – 20% TEA in Water; Year – 2010.
3.3 Annual Mean NO2 Concentrations
Bias adjusted annual mean NO2 concentrations during 2010 were highest at the roadside sites (56.8 µg/m3). Mean
kerbside site concentrations were slightly lower (56.6 µg/m3). Near Road sites showed the next highest annual
mean NO2 concentrations (49.2 µg/m3). The lowest concentrations, as expected, were recorded at the Urban
Background sites (37.3 µg/m3). The bias adjusted annual mean NO2 concentration across the entire network was
50.3 µg/m3. A summary of the bias adjusted results is presented in Table 6.
The 2010 results indicate that the annual mean NO2 objective of 40 µg/m3 continues to be exceeded throughout the
Borough of Ealing, particularly at roadside locations. In keeping with historical trends, the highest annual mean concentration was recorded at Fernlea House, Hangar Lane (82.8 µg/m
3; Site 56, Appendix A). The mean NO2
concentration across the entire network in 2010 was 4.1 µg/m3 higher than 2009. A contributing factor to the higher
concentrations may be the application of locally-derived bias adjustment factors to correct the raw diffusion tube data. The local bias adjustment factors used were higher than the national bias adjustment factors used to correct the raw data in the 2009 survey.
7 Spreadsheet of Diffusion Tube Bias Adjustment Factors Version 04.11. Downloaded from http://laqm.defra.gov.uk/bias-adjustment-
factors/national-bias.html on 04/04/2011.

AECOM Nitrogen Dioxide Diffusion Tube Survey: Annual Report 2010 8
Capabilities on project:
Environment
Table 6: Annual Mean NO2 Concentrations in Ealing, 2010
Site Type Bias Adjusted Annual Mean NO2 Concentration (µg/m
3)
Data Capture (%)
Kerbside 56.6 96.5
Roadside 56.8 93.8
Near Road 49.2 96.8
Urban Background 37.3 97.2
All Sites 50.3 95.7
3.4 Comparison With Objectives
As reported in section 3.3 the annual mean NO2 concentration for the whole of the Ealing diffusion tube network exceeded the annual mean NO2 objective during 2010. Table 7 shows the number of sites exceeding the annual mean NO2 objective. Sites with data capture rates of 75% and below have been excluded.
Table 7: Sites Exceeding Annual Mean NO2 Objective, 2010
Site Type Designation Total Number of Sites Number of Sites Exceeding
Objective
Kerbside 10 10
Roadside 36 30
Near Road 31 26
Urban Background 23 10
All Sites 100 76
It has been suggested in LAQM.TG(09) that sites where annual mean NO2 concentrations are higher than 60 µg/m3
it is likely that the hourly exceedances NO2 objective (hourly mean NO2 concentration of 200 µg/m3 not to be
exceeded on more than 18 occasions per year) may also be exceeded. A total of 15 sites in Ealing measured bias adjusted annual mean NO2 concentrations greater than 60 µg/m
3 and therefore have the potential to breach the
short-term objective. These are listed in Table 8.

AECOM Nitrogen Dioxide Diffusion Tube Survey: Annual Report 2010 9
Capabilities on project:
Environment
Table 8: Sites With Bias Adjusted Annual Mean NO2 Greater Than 60 µg/m3, 2010
Site Name / Location Bias Adjusted Annual Mean NO2 Concentration (µg/m
3)
Wendover Court, Western Avenue, W3, 2nd
Floor 68.4
Wendover Court, Western Avenue, W3, 1st Floor 68.8
Wendover Court, Western Avenue, W3, Ground Floor 67.4
18 Old Oak Common Lane, W3 76.0
Warple Road 61.6
Age Concern, Social Centre, High Street, Acton, W 64.9
17 Runnymede Gardens 79.3
8 The Broadway, Ealing, W5 66.4
143 Church Road, Northolt, UB5 65.8
11 Uxbridge Road, Southall, UB1 70.5
Fernlea House, Hanger Lane 82.8
2 Horsenden Lane South, Greenford, UB6 60.1
6 Western Avenue 79.8
Fernlea House, Hanger Lane (tri) 77.5
326 Western Avenue 62.6
3.5 Variation With Height At Wendover Court, Western Avenue diffusion tubes are exposed on each floor of the four-storey building allowing the change in NO2 concentration with height to be investigated. The bias adjusted results are presented in Table 9. It should be noted that there are no valid results for the top floor site from August to December, inclusive due to theft of the tubes, resulting in data capture of 58.3%, and so the data must be viewed with caution. However, these results indicate that there is no obvious decrease in NO2 concentrations with height.
Table 9: Annual Mean NO2 Concentrations in Ealing, 2010
Site Type Bias Adjusted Annual Mean NO2 Concentration (µg/m
3)
Data Capture (%)
Mean – All Floors 68.4 87.5
Top Floor 69.0 58.3
2nd
Floor 68.4 100
1st Floor 68.8 91.7
Ground Floor 67.4 100
3.6 Seasonal Variation
The seasonal variation in NO2 concentrations during 2010 are shown in Table 10. Due to seasonal variations in the bias adjustment that can occur at diffusion tube sites the results that have been presented are the raw concentrations with no bias adjustment applied.

AECOM Nitrogen Dioxide Diffusion Tube Survey: Annual Report 2010 10
Capabilities on project:
Environment
Table 10: Monthly Mean Raw NO2 Concentrations in Ealing, 2010
Site Type Jan Feb Mar Apr May Jun Jul Aug Sep Oct Nov Dec
Kerbside 74.5 66.3 54.8 53.0 53.5 52.4 42.3 46.7 56.0 51.0 59.8 55.8
Roadside 66.2 64.4 59.7 58.1 48.0 51.2 44.3 47.7 56.1 52.9 59.0 59.7
Near-Road 54.6 56.5 49.9 47.2 42.2 42.3 33.8 37.4 44.0 43.0 52.7 50.3
Urban Background 50.2 47.1 38.4 35.6 31.6 29.1 25.9 29.4 34.3 34.7 43.4 43.9
All 58.1 56.6 50.1 48.4 42.3 43.1 36.4 39.7 47.0 45.0 52.9 52.6
Table 11: Raw Winter and Summer Period Mean Concentrations in Ealing, 2010
Site Type Winter Mean Concentration (Jan – Mar, Oct – Dec)
(µg/m3)
Summer Mean Concentration
(Apr – Sep) (µg/m3)
Ratio Winter : Summer
Kerbside 60.4 50.7 1.19
Roadside 60.3 50.9 1.19
Near-Road 51.1 41.2 1.24
Urban Background 42.9 31.0 1.39
All 52.6 42.8 1.23
Considering all site types in the network, the highest monthly mean NO2 concentrations were measured in January followed by February. July and August displayed the lowest monthly mean NO2 concentrations. In all cases the winter mean NO2 concentrations (Jan – Mar and Oct – Dec) were higher than summer mean concentrations (Apr – Sep). The ratio of winter to summer mean concentrations ranged from 1.19 for kerbside and roadside site types to 1.39 for urban background sites. For all sites collectively the ratio of winter to summer mean NO2 concentration was 1.23.
3.7 Historical Trends in NO2
The annual mean NO2 concentrations since 2005 at 13 long-term monitoring locations in Ealing are shown in Figure 1. The results displayed are uncorrected for bias due to the change in the monitoring period in 2008 from April – March to January – December. Despite the results showing year to year variations there are few discernible upward or downward trends over time in uncorrected annual mean concentrations at any of the long-term sites.
At site 51, Ealing Town Hall annual mean NO2 concentrations increased from 2007 to 2009 before falling again in 2010 to approximately the 2007 level. At site 46, 143 Church Road Northolt NO2 concentrations show some evidence of a reduction since 2007. The annual mean NO2 concentration at site 53 Bond Street peaked in 2007 and has since fallen to concentrations similar to those observed in 2005.

AECOM Nitrogen Dioxide Diffusion Tube Survey: Annual Report 2010 11
Capabilities on project:
Environment
Figure 1: Historic NO2 Diffusion Tube Concentrations (Annual Mean, Uncorrected) in the London Borough of Ealing
10.0
20.0
30.0
40.0
50.0
60.0
70.0
80.0
90.0
100.0
110.0
2005 2006 2007 2008 2009 2010
An
nu
al
Mean
NO
2C
on
cen
trati
on
(µ
g/m
3)
Year
Site 45 INCO, Bashley Road, NW10 Site 46 143 Church Road, Northolt, UB5Site 47 Jubilee Gardens Library, Jubilee Gardens, UB1 Site 48 Brent Lodge, Church Road, W7Site 49 Health Centre, Netheravon Road, W7 Site 50 11 Uxbridge Road, Southall, UB1Site 51 Ealing Town Hall, New Broadway, W5 Site 52 Perceval House, 14/16 Uxbridge Road, W5Site 53 14/16 Bond Street, Ealing, W5 Site 54 South Ealing CemeterySite 55 Acton Town Hall, High Street, Acton, W3 6NE Site 56 Fernlea House, Hanger LaneSite 69 81 Whitton Ave East, Greenford, UB6

AECOM Nitrogen Dioxide Diffusion Tube Survey: Annual Report 2010 12
Capabilities on project:
Environment
The main conclusions of the 2010 Ealing Diffusion Tube Survey are as follows:
- The annual mean NO2 concentration for all sites in the network was 50.3 µg/m3. This represents an increase of
4.1 µg/m3 relative to 2009. This may be due to the use of local bias adjustment factors, which were higher than
the corresponding figures from the national spreadsheet of bias adjustment factors in 2009 and 2010
- Roadside sites showed the highest annual mean NO2 concentration (56.8 µg/m3) followed by kerbside sites
(56.6 µg/m3). This is consistent with 2009. However, annual mean concentrations in 2010 were higher than 2009
(Roadside 50.7 µg/m3 and kerbside 49.8 µg/m
3);
- The annual mean NO2 objective of 40 µg/m3 was exceeded at 76 sites;
- The maximum annual mean NO2 concentration was 82.8 µg/m3, recorded at Fernlea House, Hangar Lane
(Site 56); - 15 sites recorded annual mean NO2 concentrations of greater than 60 µg/m
3 making it likely that the hourly
objective for NO2 may have been exceeded at these locations; - Good data capture (greater than 90%) was achieved at 87 out of 100 sites; - Winter mean concentrations were higher than summer mean concentrations at all sites in the network. The ratio
of winter to summer concentrations was 1.23 for all sites.
On the basis of the findings of the 2010 survey the following recommendations are suggested:
- Continue the present level of monitoring within the Borough, in particular the long-term monitoring sites in order to preserve and continue historical trends;
- Relocate the tube at the top floor of Wendover Court, Western Avenue to reduce the incidence of tube theft; - Relocate a number of tubes that are currently mounted on lamp posts and street furniture to building facades
where possible to improve the representativeness of the results obtained.
4 Conclusions and Recommendations

AECOM Nitrogen Dioxide Diffusion Tube Survey: Annual Report 2010 13
Capabilities on project:
Environment
Appendix A: Diffusion Tube Sites Details

AECOM Nitrogen Dioxide Diffusion Tube Survey: Annual Report 2010 14
Capabilities on project:
Environment
Table 12: Ealing Diffusion Tube Network Monitoring Site Details, 2010
Site Number
Site Name Site
Designation Grid Reference
(X,Y)
Annual Mean NO2 Concentration
Data Capture
(%) Raw (µg/m3)
Local Bias Adjusted (µg/m
3)
National Bias
Adjusted (µg/m
3)
1 39 Old Oak Lane R 521587,182684 55.6 56.7 51.5 91.7
2 101 Wells House Road UB 521238,181942 36.5 36.9 35.6 100
3 Jenner Avenue R 520724,181552 51.9 52.9 48.1 91.7
4 5 Leamington Park R 520532,181517 46.6 47.5 43.2 100
5 John Perryn First and Middle School, Long Drive, W3 UB 521139,181436 40.7 41.1 39.8 100
6.1 Wendover Court, Western Avenue – Top Floor N 519997,182178 65.1 69.0 63.8 58.3
6.2 Wendover Court, Western Avenue – 2nd
Floor N 519997,182178 64.5 68.4 63.3 100
6.3 Wendover Court, Western Avenue – 1st Floor N 519997,182178 64.9 68.8 63.7 91.7
6.4 Wendover Court, Western Avenue – Ground Floor N 519997,182178 63.6 67.4 62.4 100
7 45 Park Avenue N 518600,183000 46.8 49.6 45.9 100
8 6 Brentmead Gardens UB 518970,182964 40.1 40.5 39.2 100
9 Iveagh Avenue N 519117,183379 46.7 49.5 45.8 91.7
10 57-75 Old Oak Common Lane (PO) R 521557,180996 55.4 56.5 51.4 100
11 2 St. Andrews Road, W3 R 521381,180946 49.7 50.7 46.1 100
12.1 18 Old Oak Common Lane, W3 (triplicate) R 521602,180856 75.3 76.9 69.9 91.7
12.2 18 Old Oak Common Lane, W3 (triplicate) R 521602,180856 73.7 75.2 68.3 100
12.3 18 Old Oak Common Lane, W3 (triplicate) R 521602,180856 74.5 76.0 69.1 100
13 East Acton Primary School, East Acton Lane N 521112,180617 35.6 37.8 34.9 100
14 First Avenue N 521761,180132 42.4 45.0 41.6 100
15 177 The Vale, W3 K 521088,180046 60.4 61.6 56.0 100
17 Maples Nursery, East Churchfield Road, W3 UB 520754,180316 37.8 38.1 36.9 100

AECOM Nitrogen Dioxide Diffusion Tube Survey: Annual Report 2010 15
Capabilities on project:
Environment
Site Number
Site Name Site
Designation Grid Reference
(X,Y)
Annual Mean NO2 Concentration
Data Capture
(%) Raw (µg/m3)
Local Bias Adjusted (µg/m
3)
National Bias
Adjusted (µg/m
3)
19 Lantry Court, Acton, W3 UB 519883,180459 33.1 33.4 32.3 100
20 Age Concern / Social Centre, High Street, Acton, W3 R 519928,180173 63.6 64.9 59.0 91.7
21 Acton Health Centre, Church Road, Acton, W3 N 520128,180016 37.3 39.6 36.6 100
22 Gunnersbury Unit, Acton Hospital, Gunnersbury Lane K 519547,179948 51.0 52.0 47.3 100
23 156 Horn Lane, W3 R 520180,180896 48.4 49.4 44.9 83.3
24 Peal Gardens R 516089,182400 38.3 39.1 35.5 100
25 17 Runnymede Gardens K 515255,183098 77.8 79.3 72.1 91.7
26 13 Blenheim Close N 514866,183116 45.5 48.3 44.7 100
27 203 Windmill Lane, Greenford, UB6 N 514259,182234 41.8 44.3 41.0 100
28 Social Services, Ruislip Road, Greenford, UB6 N 513182,182741 42.0 44.6 41.2 100
29 2 Shadwell Drive, Northolt, UB5 UB 512603,182837 41.7 42.1 40.7 91.7
30 Bengarth Road, Northolt, UB5 R 512108,183540 47.0 48.0 43.6 100
32 Lilliput Avenue, UB5 UB 512499,183805 41.7 42.1 40.7 100
33 Northolt Primary School, Compton Crescent, UB5 UB 512050,184073 51.0 51.6 49.8 100
34 8 The Broadway, Ealing, W5 K 517887,180914 65.1 66.4 60.4 100
35 Acton Town Medical Centre, Gunnersbury Lane, W3 K 519373,179593 50.1 51.1 46.4 100
36 Hanwell Nursery, 25A Laurel Gardens, W7 N 515242,180158 46.6 49.4 45.7 100
37 Ealing Hospital, St Bernard’s Wing, Uxbridge Road, UB1 UB 514705,180022 45.8 46.3 44.7 100
38 Hobbayne First School, Greenford Avenue, W7 UB 515477,181081 33.3 33.6 32.5 100
39 McDonalds Drive-Thru, Uxbridge Road, Southall R 512206,180522 40.4 41.2 37.4 100
40.1 Hambrough Primary and Nursery School, South Road, UB1 (triplicate)
N 512673,180069 50.7 53.7 49.7 100

AECOM Nitrogen Dioxide Diffusion Tube Survey: Annual Report 2010 16
Capabilities on project:
Environment
Site Number
Site Name Site
Designation Grid Reference
(X,Y)
Annual Mean NO2 Concentration
Data Capture
(%) Raw (µg/m3)
Local Bias Adjusted (µg/m
3)
National Bias
Adjusted (µg/m
3)
40.2 Hambrough Primary and Nursery School, South Road, UB1 (triplicate)
N 512673,180069 51.2 54.3 50.3 100
40.3 Hambrough Primary and Nursery School, South Road, UB1 (triplicate)
N 512673,180069 49.2 52.2 48.3 100
41 4 Merrick Road, Southall, UB2 N 512657,179712 43.1 45.7 42.3 100
44 Perivale Wood, r/o 36-38 Sunley Gardens, UB6 UB 516166,183578 25.4 25.7 24.8 91.7
45 INCO, Bashley Road, NW10 R 520915,182464 43.8 44.6 40.6 100
46 143 Church Road, Northolt, UB5 R 512690,183983 64.5 65.8 59.8 100
47 Jubilee Gardens Library, Jubilee Gardens, UB1 UB 513229,181513 36.0 36.3 35.1 83.3
48 Brent Lodge, Church Road, W7 UB 514740,180643 29.1 29.4 28.4 75.0
49 Health Centre, Netheravon Road, W7 N 515680,180360 39.5 41.9 38.7 100
50 11 Uxbridge Road, Southall, UB1 R 512768,180400 69.1 70.5 64.1 100
51.1 Ealing Town Hall, New Broadway, W5 (co-located triplicate) N 517534,180737 41.7 44.2 40.9 100
51.2 Ealing Town Hall, New Broadway, W5 (co-located triplicate) N 517534,180737 41.0 43.4 40.2 100
51.3 Ealing Town Hall, New Broadway, W5 (co-located triplicate) N 517534,180737 41.0 43.4 40.2 100
52 Perceval House, 14/16 Uxbridge Road, W5 N 517440,180677 40.6 43.1 39.9 100
53 14/16 Bond Street, Ealing, W5 R 517644,180613 53.2 54.3 49.4 83.3
54 South Ealing Cemetery, UB 517750,178860 32.3 32.6 31.6 100
55.1 Acton Town Hall, High Street, Acton, W3 6NE (co-located triplicate)
R 520306,180055 53.9 54.9 49.9 100
55.2 Acton Town Hall, High Street, Acton, W3 6NE (co-located triplicate)
R 520306,180055 52.8 53.9 49.0 100
55.3 Acton Town Hall, High Street, Acton, W3 6NE (co-located triplicate)
R 520306,180055 51.8 52.8 48.0 100
56 Fernlea House, Hanger Lane R 518540,182700 81.2 82.8 75.3 91.7

AECOM Nitrogen Dioxide Diffusion Tube Survey: Annual Report 2010 17
Capabilities on project:
Environment
Site Number
Site Name Site
Designation Grid Reference
(X,Y)
Annual Mean NO2 Concentration
Data Capture
(%) Raw (µg/m3)
Local Bias Adjusted (µg/m
3)
National Bias
Adjusted (µg/m
3)
57 106/116 St Pauls Close UB 518577,179865 39.9 40.3 39.0 100
58 44 Acton Lane, W4 K 520481,178826 56.1 57.2 52.0 100
59 Clayponds Hospital and Day Treatment Centre, Sterling Place UB 518153,178709 35.8 36.1 34.9 100
60 51/53 Old Oak Common Lane R 521573,180932 55.2 56.3 51.2 100
61 14 Balfour Road, W13 UB 516703,179728 35.5 35.9 34.7 100
62 Kirn Road/Drayton Green Road, W13 R 516700,180522 56.8 57.9 52.6 100
63 St David's Home, 12 Castlebar Hill, W5 UB 516992,181698 32.0 32.3 31.2 100
64 St John Fisher Primary School, Thirlmere Avenue, G UB 517072,182912 41.0 41.4 40.0 100
65 2 Horsenden Lane South, Greenford, UB6 R 516368,182978 58.9 60.1 54.6 100
66 57 Woodville Gardens, W5 N 518633,181314 52.8 56.0 51.8 91.7
67.1 Oldfield Primary School, Oldfield Lane North, Greenford (triplicate)
UB 514753,183342 41.4 41.8 40.4 100
67.2 Oldfield Primary School, Oldfield Lane North, Greenford (triplicate)
UB 514753,183342 40.9 41.3 39.9 100
67.3 Oldfield Primary School, Oldfield Lane North, Greenford (triplicate)
UB 514753,183342 38.1 38.5 37.2 100
68 Gainsboro Gardens, UB6 N 515395,185292 49.0 52.0 48.1 91.7
69 81 Whitton Ave East, Greenford, UB6 K 516858,184691 43.2 44.1 40.0 100
70 126 Petts Hill, Northolt, N 513794,185348 39.9 42.3 39.1 100
71 181 Castle Road, Northolt, UB5 R 514102,184521 35.1 35.9 32.6 83.3
72 2/4 Minterne Avenue R 513587,178915 42.0 42.8 38.9 100
73.1 Nr. Glebe Nursery School, Western Road, Southall, UB2 (triplicate)
K 511468,178898 53.5 54.6 49.6 100
73.2 Nr. Glebe Nursery School, Western Road, Southall, UB2 (triplicate)
K 511468,178898 55.5 56.6 51.4 91.7

AECOM Nitrogen Dioxide Diffusion Tube Survey: Annual Report 2010 18
Capabilities on project:
Environment
Site Number
Site Name Site
Designation Grid Reference
(X,Y)
Annual Mean NO2 Concentration
Data Capture
(%) Raw (µg/m3)
Local Bias Adjusted (µg/m
3)
National Bias
Adjusted (µg/m
3)
73.3 Nr. Glebe Nursery School, Western Road, Southall, UB2 (triplicate)
K 511468,178898 51.2 52.3 47.5 91.7
74 132 Brent Road, Southall, UB2 R 511173,179203 51.1 52.2 47.4 100
75 6 Boston Gardens Hanwell, W7 N 516277,178882 37.2 39.5 36.5 100
76 200 Boston Road, W7 K 516100,179300 46.0 46.9 42.6 83.3
77 7 Greenford Avenue, Southall N 512753,180478 37.0 39.2 36.3 100
78 119 Twyford Avenue, W3 R 519275,180869 38.9 39.7 36.1 91.7
79 Albert Dane Centre, 19-21 Western Road, Southall N 512234,179201 40.5 43.0 39.8 100
80 6 Western Avenue R 521549,180923 78.3 79.8 72.6 91.7
81 54 Western Avenue (Dental Surgery) N 521391,180922 54.3 57.6 53.3 100
82 98/100 Western Avenue N 521173,180981 53.9 57.1 52.9 100
83 171 Old Oak Road R 521646,180800 50.8 51.8 47.1 100
84 Southfields First and Middle School UB 521200,179500 35.8 36.1 34.9 83.3
85.1 Fernlea House, Hangar Lane (triplicate) R 518541,182707 76.3 77.9 70.8 100
85.2 Fernlea House, Hangar Lane (triplicate) R 518541,182707 77.1 78.6 71.5 100
85.3 Fernlea House, Hangar Lane (triplicate) R 518541,182707 74.6 76.1 69.2 100
86 27 Wells House Road UB 521305,181966 43.0 43.4 42.0 100
87 94 North Acton Road N 520780,182775 40.5 42.9 39.7 100
88 914 Greenford Road (Bennetts Avenue) R 514985,183770 42.3 43.2 39.2 100
89.1 Blair Peach School, Beaconsfield Road, Southall (co-located triplicate)
UB 511680,180071 31.0 31.3 30.3 100
89.2 Blair Peach School, Beaconsfield Road, Southall (co-located triplicate)
UB 511680,180071 30.2 30.5 29.5 100
89.3 Blair Peach School, Beaconsfield Road, Southall (co-located triplicate)
UB 511680,180071 27.7 28.0 27.1 100

AECOM Nitrogen Dioxide Diffusion Tube Survey: Annual Report 2010 19
Capabilities on project:
Environment
Site Number
Site Name Site
Designation Grid Reference
(X,Y)
Annual Mean NO2 Concentration
Data Capture
(%) Raw (µg/m3)
Local Bias Adjusted (µg/m
3)
National Bias
Adjusted (µg/m
3)
90.1 The Straight, opposite Randolph Road, Southall (triplicate) N 512514,179795 41.8 44.3 41.0 100
90.2 The Straight, opposite Randolph Road, Southall (triplicate) N 512514,179795 41.5 43.9 40.7 100
90.3 The Straight, opposite Randolph Road, Southall (triplicate) N 512514,179795 42.1 44.6 41.3 100
91.1 Manor Road (Opposite 40 Manor Rd) (triplicate) R 516405,180710 40.0 40.8 37.1 100
91.2 Manor Road (Opposite 40 Manor Rd) (triplicate) R 516405,180710 38.3 39.1 35.6 91.7
91.3 Manor Road (Opposite 40 Manor Rd) (triplicate) R 516405,180710 39.0 39.8 36.2 91.7
92.1 Ealing Horn Lane AQMS (co-located triplicate) R 520432,181428 58.4 59.6 54.2 100 (83.3)
92.2 Ealing Horn Lane AQMS (co-located triplicate) R 520432,181428 56.0 57.1 51.9 100 (83.3)
92.3 Ealing Horn Lane AQMS (co-located triplicate) R 520432,181428 57.5 58.6 53.3 100 (83.3)
93.1 Western Avenue AQMS (co-located triplicate) R 520430,181950 71.0 72.4 65.8 100 (75.0)
93.2 Western Avenue AQMS (co-located triplicate) R 520430,181950 71.7 73.1 66.4 100 (75.0)
93.3 Western Avenue AQMS (co-located triplicate) R 520430,181950 66.6 67.9 61.7 88.9 (66.7)
N1 326 Western Avenue N 520424,181957 59.0 62.6 57.9 83.3
N2 21 Haven LANE R 518023,181115 39.3 40.1 36.4 100
N3 1a Haven Green R 517747,180903 52.4 53.5 48.6 100
N4 Middle of Green N 517826,180981 48.1 51.0 47.2 83.3
N5 Woodvale Road R 517928,181089 41.9 42.7 38.8 100
N6 6 Castlebar Road K 517636,181079 56.2 57.3 52.1 100
N7 Gordon Road R 517707,180953 44.9 45.8 41.6 100
N8 Haven Green Court, Haven Green, Ealing N 517803,181082 40.0 42.4 39.2 100 (91.7)
N9 Sinton Andrews Estate Agent, Haven Green R 517747,180822 66.9 68.2 62.0 100 (58.3)

AECOM Nitrogen Dioxide Diffusion Tube Survey: Annual Report 2010 20
Capabilities on project:
Environment
Figure 2: Monitoring Sites in Ealing – Northolt and Greenford

AECOM Nitrogen Dioxide Diffusion Tube Survey: Annual Report 2010 21
Capabilities on project:
Environment
Figure 3: Monitoring Sites in Ealing – Southall and Hanwell

AECOM Nitrogen Dioxide Diffusion Tube Survey: Annual Report 2010 22
Capabilities on project:
Environment
Figure 4: Monitoring Sites in Ealing – Ealing Town and Haven Green

AECOM Nitrogen Dioxide Diffusion Tube Survey: Annual Report 2010 23
Capabilities on project:
Environment
Figure 5: Monitoring Sites in Ealing – South Ealing

AECOM Nitrogen Dioxide Diffusion Tube Survey: Annual Report 2010 24
Capabilities on project:
Environment
Figure 6: Monitoring Sites in Ealing – Acton Town and Surrounding Area

AECOM Nitrogen Dioxide Diffusion Tube Survey: Annual Report 2010 25
Capabilities on project:
Environment
Figure 7: Monitoring Sites in Ealing – North Acton and Park Royal

AECOM Nitrogen Dioxide Diffusion Tube Survey: Annual Report 2010 26
Capabilities on project:
Environment
Appendix B: Bias Adjustment Calculations

AECOM Nitrogen Dioxide Diffusion Tube Survey: Annual Report 2010 27
Capabilities on project:
Environment
Table 13: Local Bias Adjustment Factor Calculation, Ealing Town Hall
Pe
rio
d
Start Date
dd/mm/yyyy
End Date
dd/mm/yyyy
Tube 1
µgm -3
Tube 2
µgm -3
Tube 3
µgm - 3
Triplicate
Mean
Standard
Deviation
Coefficient
of Variation
(CV)
95% CI
of mean
Period
Mean
Data
Capture
(% DC)
Tubes
Precision
Check
Automatic
Monitor
Data 1 08/01/2010 05/02/2010 46.9 45.5 51.8 48 3.3 7 8.3 54.1 99.4047619 Good Good
2 05/02/2010 05/03/2010 47.8 46.6 46.9 47 0.6 1 1.6 54.6 99.25595238 Good Good
3 05/03/2010 01/04/2010 44.0 44.5 44.0 44 0.3 1 0.8 42.1 86.41975309 Good Good
4 01/04/2010 29/04/2010 44.3 40.7 41.9 42 1.8 4 4.6 45.3 99.70238095 Good Good
5 29/04/2010 04/06/2010 35.3 32.3 34.3 34 1.5 4 3.8 36.5 99.76851852 Good Good
6 04/06/2010 02/07/2010 39.5 36.0 33.8 36 2.9 8 7.2 33.0 85.26785714 Good Good
7 02/07/2010 05/08/2010 23.1 26.1 23.8 24 1.6 6 3.9 26.4 99.50980392 Good Good
8 05/08/2010 03/09/2010 28.8 30.0 30.2 30 0.7 2 1.8 27.9 98.99425287 Good Good
9 03/09/2010 01/10/2010 38.4 46.6 41.3 42 4.1 10 10.3 37.8 96.875 Good Good
10 01/10/2010 04/11/2010 43.8 40.3 41.5 42 1.8 4 4.4 48.3 88.84803922 Good Good
11 04/11/2010 01/12/2010 47.8 46.5 53.5 49 3.7 7 9.2 59.0 52.77777778 Good Poor Data Capture
12 01/12/2010 07/01/2011 60.7 56.5 48.7 55 6.1 11 15.1 64.3 99.54954955 Good Good
13
Overall survey -->Good
precision
Good
Overall DC
Precision
Accuracy (with 95% confidence interval) Accuracy (with 95% confidence interval)
without periods with CV larger than 20% WITH ALL DATA Without CV>20%With all data
Bias calculated using 11 periods of data Bias calculated using 11 periods of data -4% -4%
Bias factor A Bias factor A 6.7% 6.7%
Bias B Bias B
Diffusion Tubes Mean: 40 µgm-3
Diffusion Tubes Mean: 40 µgm-3
Mean CV (Precision): 5 Mean CV (Precision): 5
Automatic Mean: 43 µgm-3
Automatic Mean: 43 µgm-3
Data Capture for periods used: 96% Data Capture for periods used: 96% Jaume Targa
Adjusted Tubes Mean: µgm-3
Adjusted Tubes Mean: µgm-3
Version 03 - November 2006
(Check average CV & DC from
Accuracy calculations)12 out of 12 periods have a CV smaller than 20%Site Name/ ID: EA 1 Ealing Town Hall
Checking Precision and Accuracy of Triplicate Tubes
Diffusion Tubes Measurements Data Quality Check
It is necessary to have results for at least two tubes in order to calculate the precision of the measurements
Automatic Method
1.06 (0.99 - 1.14)
-5% (-12% - 1%)
43 (40 - 46)
-5% (-12% - 1%)
1.06 (0.99 - 1.14)
43 (40 - 46)
-50%
-25%
0%
25%
50%
Without CV>20% With all data
Diffusion Tube Bias B

AECOM Nitrogen Dioxide Diffusion Tube Survey: Annual Report 2010 28
Capabilities on project:
Environment
Table 14: Local Bias Adjustment Factor Calculation, Acton Town Hall
Pe
rio
d
Start Date
dd/mm/yyyy
End Date
dd/mm/yyyy
Tube 1
µgm -3
Tube 2
µgm -3
Tube 3
µgm - 3
Triplicate
Mean
Standard
Deviation
Coefficient
of Variation
(CV)
95% CI
of mean
Period
Mean
Data
Capture
(% DC)
Tubes
Precision
Check
Automatic
Monitor
Data 1 08/01/2010 05/02/2010 66.9 68.9 66.1 67 1.5 2 3.7 67.9 84.22619048 Good Good
2 05/02/2010 05/03/2010 66.7 69.3 66.4 67 1.6 2 3.9 61.3 92.55952381 Good Good
3 05/03/2010 01/04/2010 58.9 56.8 45.9 54 7.0 13 17.3 52.0 98.91975309 Good Good
4 01/04/2010 29/04/2010 59.5 59.7 53.7 58 3.4 6 8.4 63.9 99.70238095 Good Good
5 29/04/2010 04/06/2010 55.6 53.2 52.5 54 1.6 3 4.1 51.6 96.41203704 Good Good
6 04/06/2010 02/07/2010 49.7 43.4 48.5 47 3.3 7 8.3 46.6 97.4702381 Good Good
7 02/07/2010 05/08/2010 37.8 37.7 41.0 39 1.9 5 4.7 33.1 98.65196078 Good Good
8 05/08/2010 03/09/2010 40.8 45.1 43.8 43 2.2 5 5.4 41.1 62.78735632 Good Poor Data Capture
9 03/09/2010 01/10/2010 51.3 47.2 52.0 50 2.6 5 6.5 47.6 99.10714286 Good Good
10 01/10/2010 04/11/2010 41.4 42.5 49.8 45 4.6 10 11.4 51.4 99.50980392 Good Good
11 04/11/2010 01/12/2010 49.2 56.7 51.3 52 3.8 7 9.5 63.7 93.82716049 Good Good
12 01/12/2010 07/01/2011 68.4 53.4 50.1 57 9.8 17 24.3 66.0 82.20720721 Good Good
13
Overall survey -->Good
precision
Good
Overall DC
Precision
Accuracy (with 95% confidence interval) Accuracy (with 95% confidence interval)
without periods with CV larger than 20% WITH ALL DATA Without CV>20%With all data
Bias calculated using 11 periods of data Bias calculated using 11 periods of data -1% -1%
Bias factor A Bias factor A 7.4% 7.4%
Bias B Bias B
Diffusion Tubes Mean: 54 µgm-3
Diffusion Tubes Mean: 54 µgm-3
Mean CV (Precision): 7 Mean CV (Precision): 7
Automatic Mean: 55 µgm-3
Automatic Mean: 55 µgm-3
Data Capture for periods used: 95% Data Capture for periods used: 95% Jaume Targa
Adjusted Tubes Mean: µgm-3
Adjusted Tubes Mean: µgm-3
Version 03 - November 2006
1.02 (0.95 - 1.11)
-2% (-10% - 5%)
55 (51 - 60)
-2% (-10% - 5%)
1.02 (0.95 - 1.11)
55 (51 - 60)
(Check average CV & DC from
Accuracy calculations)12 out of 12 periods have a CV smaller than 20%Site Name/ ID: EA 2 Acton Town Hall
Checking Precision and Accuracy of Triplicate Tubes
Diffusion Tubes Measurements Data Quality Check
It is necessary to have results for at least two tubes in order to calculate the precision of the measurements
Automatic Method
-50%
-25%
0%
25%
50%
Without CV>20% With all data
Diffusion Tube Bias B

AECOM Nitrogen Dioxide Diffusion Tube Survey: Annual Report 2010 29
Capabilities on project:
Environment
Table 15: Local Bias Adjustment Factor Calculation, Southall (Blair Peach School)
Pe
rio
d
Start Date
dd/mm/yyyy
End Date
dd/mm/yyyy
Tube 1
µgm -3
Tube 2
µgm -3
Tube 3
µgm - 3
Triplicate
Mean
Standard
Deviation
Coefficient
of Variation
(CV)
95% CI
of mean
Period
Mean
Data
Capture
(% DC)
Tubes
Precision
Check
Automatic
Monitor
Data 1 08/01/2010 05/02/2010 43.1 42.8 36.4 41 3.8 9 9.4 44.5 99.70 Good Good
2 05/02/2010 05/03/2010 49.2 39.7 38.4 42 5.9 14 14.6 41.2 99.11 Good Good
3 05/03/2010 01/04/2010 28.4 28.0 28.3 28 0.2 1 0.5 28.7 99.69 Good Good
4 01/04/2010 29/04/2010 29.8 27.2 29.0 29 1.4 5 3.4 30.1 99.55 Good Good
5 29/04/2010 04/06/2010 23.9 24.4 24.9 24 0.5 2 1.3 22.0 97.34 Good Good
6 04/06/2010 02/07/2010 20.9 22.0 22.1 22 0.7 3 1.7 20.7 97.62 Good Good
7 02/07/2010 05/08/2010 20.1 21.1 19.1 20 1.0 5 2.5 16.4 99.39 Good Good
8 05/08/2010 03/09/2010 24.1 25.6 23.0 24 1.3 5 3.2 18.7 97.70 Good Good
9 03/09/2010 01/10/2010 29.1 29.4 16.2 25 7.5 30 18.7 26.3 100.00 Poor Precision Good
10 01/10/2010 04/11/2010 25.1 26.7 29.0 27 2.0 7 4.9 31.2 99.88 Good Good
11 04/11/2010 01/12/2010 39.3 37.4 29.3 35 5.3 15 13.3 39.5 100.00 Good Good
12 01/12/2010 07/01/2011 39.2 38.2 36.9 38 1.1 3 2.9 42.3 99.89 Good Good
13
Overall survey -->Good
precision
Good
Overall DC
Precision
Accuracy (with 95% confidence interval) Accuracy (with 95% confidence interval)
without periods with CV larger than 20% WITH ALL DATA Without CV>20%With all data
Bias calculated using 11 periods of data Bias calculated using 12 periods of data 2% 1%
Bias factor A Bias factor A 9.4% 8.8%
Bias B Bias B
Diffusion Tubes Mean: 30 µgm-3
Diffusion Tubes Mean: 30 µgm-3
Mean CV (Precision): 6 Mean CV (Precision): 8
Automatic Mean: 30 µgm-3
Automatic Mean: 30 µgm-3
Data Capture for periods used: 99% Data Capture for periods used: 99% Jaume Targa
Adjusted Tubes Mean: µgm-3
Adjusted Tubes Mean: µgm-3
Version 03 - November 2006
1.01 (0.93 - 1.12)
-1% (-11% - 8%)
30 (28 - 34)
-2% (-10% - 7%)
1.02 (0.93 - 1.12)
30 (28 - 33)
(Check average CV & DC from
Accuracy calculations)11 out of 12 periods have a CV smaller than 20%Site Name/ ID: EA 7 Southall (Blair Peach)
Checking Precision and Accuracy of Triplicate Tubes
Diffusion Tubes Measurements Data Quality Check
It is necessary to have results for at least two tubes in order to calculate the precision of the measurements
Automatic Method
-50%
-25%
0%
25%
50%
Without CV>20% With all data
Diffusion Tube Bias B
AECOM Nitrogen Dioxide Diffusion Tube Survey: Annual Report 2010 30
Capabilities on project:
Environment
Table 16: National Bias Adjustment Factor Calculation, Roadside and Kerbside Sites Analysed
By1
Method To undo your
selection, choose (All) from the pop-
up list
Site Type
Local Authority Length of Study
(months)
Diffusion Tube Mean Conc. (Dm)
(µµµµg/m3)
Automatic Monitor Mean
Conc. (Cm) (µg/m
3)
Bias (B) Tube Precision
6 Bias Adj
Factor (A) (Cm/Dm)
Gradko 20% TEA in Water R Nottingham CC 12 45 43 4.9% G 0.95
Gradko 20% TEA in Water R Nottingham CC 12 44 41 6.3% G 0.94
Gradko 20% TEA in Water K South Lakeland DC 12 46 42 8.1% G 0.92
Gradko 20% TEA in Water R Gedling BC 12 43 39 9.1% G 0.92
Gradko 20% TEA in Water R Dudley MBC 12 42 45 -5.9% G 1.06
Gradko 20% TEA in Water R Dudley MBC 10 47 46 2.4% G 0.98
Gradko 20% TEA in Water R Carlisle CC 12 41 33 25.5% G 0.80
Gradko 20% TEA in Water R Nottingham CC 12 45 43 4.9% G 0.95
Gradko 20% TEA in Water R Nottingham CC 12 44 41 6.3% G 0.94
Gradko 20% TEA in Water K Wandsworth Council 11 136 162 -16.4% G 1.20
Gradko 20% TEA in Water R Newtownabbey BC 11 36 35 4.3% G 0.96
Gradko 20% TEA in Water R Cheshire East Council 12 58 45 29.2% G 0.77
Gradko 20% TEA in Water R Cheshire East Council 11 30 30 -1.8% G 1.02
Gradko 20% TEA in Water R Gateshead Council 9 38 34 10.4% G 0.91
Gradko 20% TEA in Water R Gateshead Council 9 35 33 6.0% G 0.94
Gradko 20% TEA in Water R Gateshead Council 9 34 34 -0.6% G 1.01
Gradko 20% TEA in Water R Gateshead Council 9 32 35 -9.9% G 1.11
Gradko 20% TEA in Water R Gosport BC 10 31 23 35.3% na 0.74
Gradko 20% TEA in Water R Rhondda Cynon Taf CBC 10 35 35 0.4% G 1.00
Gradko 20% TEA in Water R South Norfolk Council 9 28 17 63.7% G 0.61
Gradko 20% TEA in Water R Chelmsford BC 12 33 21 55.0% G 0.65
Gradko 20% TEA in Water R Chelmsford BC 10 37 32 14.6% G 0.87
Gradko 20% TEA in Water R Wokingham BC 10 37 36 4.1% G 0.96
Gradko 20% TEA in Water R West Dunbartonshire Council 9 22 22 0.1% G 1.00
Gradko 20% TEA in Water R Scarborough BC 12 35 29 18.2% G 0.85
Gradko 20% TEA in Water R Sandwell MBC 11 45 45 -0.9% na 1.01
Gradko 20% TEA in Water R Sandwell MBC 11 37 36 2.0% na 0.98
Average 0.93

AECOM Nitrogen Dioxide Diffusion Tube Survey: Annual Report 2010 31
Capabilities on project:
Environment
Table 17: National Bias Adjustment Factor Calculation, Near-Road Sites Analysed
By1
Method To undo your
selection, choose (All) from the pop-
up list
Site Type
Local Authority Length of Study
(months)
Diffusion Tube Mean Conc. (Dm)
(mg/m3)
Automatic Monitor Mean
Conc. (Cm) (mg/m
3)
Bias (B) Tube Precision
6 Bias
Adjustment Factor
(A) (Cm/Dm)
Gradko 20% TEA in Water UC Nottingham CC 12 40 40 -1.0% G 1.01
Gradko 20% TEA in Water UC Nottingham CC 12 40 40 -1.0% G 1.01
Gradko 20% TEA in Water UC Belfast CC 11 38 35 8.4% P 0.92
Average 0.98
Table 18: National Bias Adjustment Factor Calculation, Urban Background Sites
Analysed By
1 Method
To undo your selection, choose (All) from the pop-
up list
Site Type
Local Authority Length of Study
(months)
Diffusion Tube Mean Conc. (Dm)
(µµµµg/m3)
Automatic Monitor Mean
Conc. (Cm) (µg/m
3)
Bias (B) Tube Precision
6 Bias
Adjustment Factor
(A) (Cm/Dm)
Gradko 20% TEA in Water UB Luton Borough Council 12 37 34 9.8% G 0.91
Gradko 20% Tea in Water UB Wandsworth Council 12 47 53 -9.9% P 1.11
Gradko 20% TEA in Water UB LB Ealing 10 39 41 -3.8% G 1.04
Gradko 20% TEA in Water UB Sandwell MBC 11 31 28 11.4% na 0.90
Gradko 20% TEA in Water UB Sandwell MBC 10 22 21 8.1% na 0.93
Average 0.98