nitrogen fertilizer use in california: assessing … fert use in calif rosenstock 2013...nitrogen...
TRANSCRIPT
ReseaRch aRticle
▼
68 CALIFORNIA AGRICULTURE • VOLUME 67, NUMBER 1
Nitrogen fertilizer use in California: Assessing the data, trends and a way forward
by Todd S. Rosenstock, Daniel Liptzin, Johan Six
and Thomas P. Tomich
Nitrogen fertilizer is an indispensable input to modern agriculture, but it also has been linked to environmental degradation and human health concerns. Recognition of these trade-offs has spurred debate over its use. However, data limitations and misinformation often constrain discussion, cooperative action and the development of solutions. To help inform the dialogue, we (1) evaluate existing data on nitrogen use, (2) estimate typical nitrogen fertilization rates for common crops, (3) analyze historical trends in nitrogen use, (4) compare typical nitrogen use to research-established guidelines and (5) identify cropping systems that have significant influence on the state’s nitrogen cycle. We conclude that a comprehensive grower self-monitoring system for nitrogen applications is required to improve nitrogen-use information and to better support evidence-based decision making. The discussion here presents a primer on the debate over nitrogen fertilizer use in California agriculture.
Nitrogen fertilizer is an essential re-source for agriculture, and its use
has undoubtedly benefited California and its citizens. However, overuse of nitro-gen fertilizer threatens the health of the state’s agricultural, human and natural re-sources. On the one hand, nitrogen is nec-essary for crop growth and development, and thus nitrogen fertilizer use supports California’s robust agricultural economy and rural society. On the other hand, ap-plying nitrogen in excess has been linked to water and air pollution, depletion of the ozone layer, climate change and numer-ous human health concerns (Galloway et
al. 2003; Millennium Ecosystem Assess-ment 2005).
The trade-offs that nitrogen fertilizer use present to society have been docu-mented in California for more than 50 years (Harding et al. 1963; Proebsting 1948). It is worth noting that fertilizer is just one way humans add reactive ni-trogen into the environment, and other activities such as fossil fuel combustion and waste discharge contribute to the aforementioned concerns. However, a forthcoming report indicates that inor-ganic nitrogen fertilizer use is responsible for the largest fraction, by far, of new ni-trogen introduced into California’s envi-ronment each year (Liptzin and Dahlgren, unpublished data).
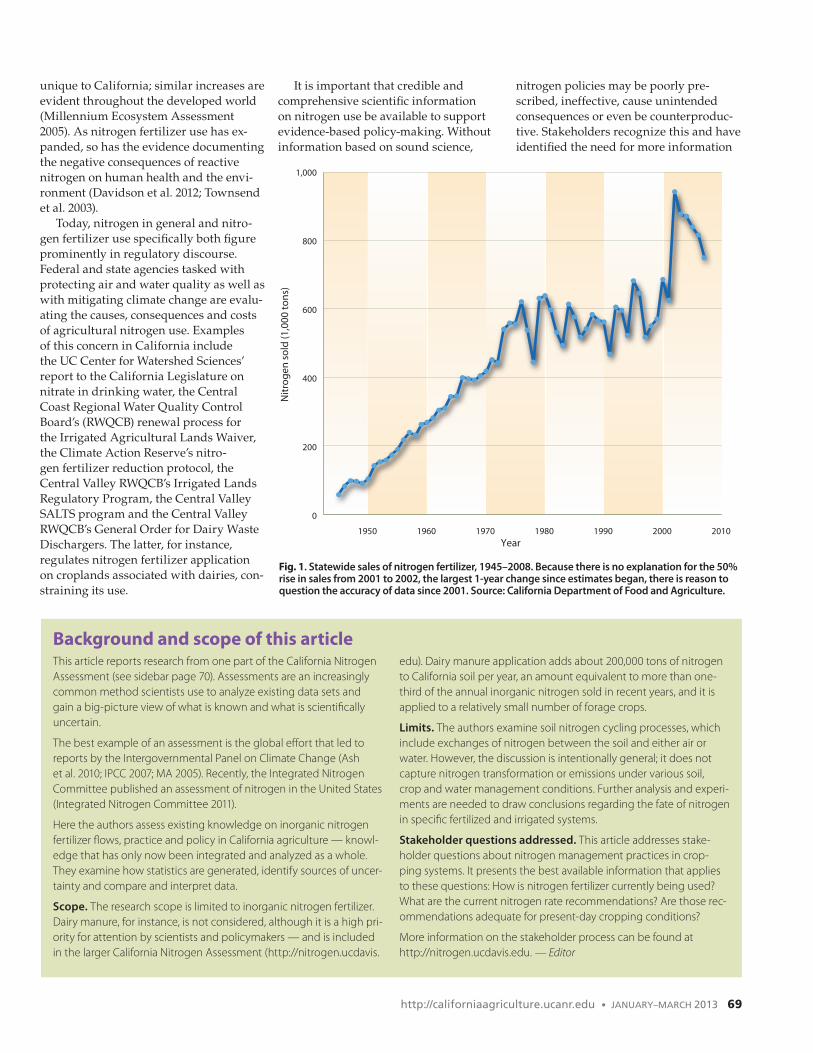
The amount of inorganic (chemical) nitrogen fertilizer sold in California has
risen dramatically over the past 70 years (fig. 1). By the 1970s, nitrogen fertilizer sales — and presumably use — exceeded 400,000 tons of nitrogen contained in inorganic fertilizer per year, and in the subsequent decade sales grew more than 25% to more than 500,000 tons of nitro-gen per year. Between 1980 and 2001, the average amount of nitrogen sold per year was no longer increasing significantly, but annual sales have surpassed 600,000 tons of nitrogen in some years. Large upward trends in fertilizer sales in the last half of the twentieth century are not
Online: http://californiaagriculture.ucanr.edu/ landingpage.cfm?article=ca.E.v067n01p68&fulltext=yes
DOI: 10.3733/ca.E.v067n01p68
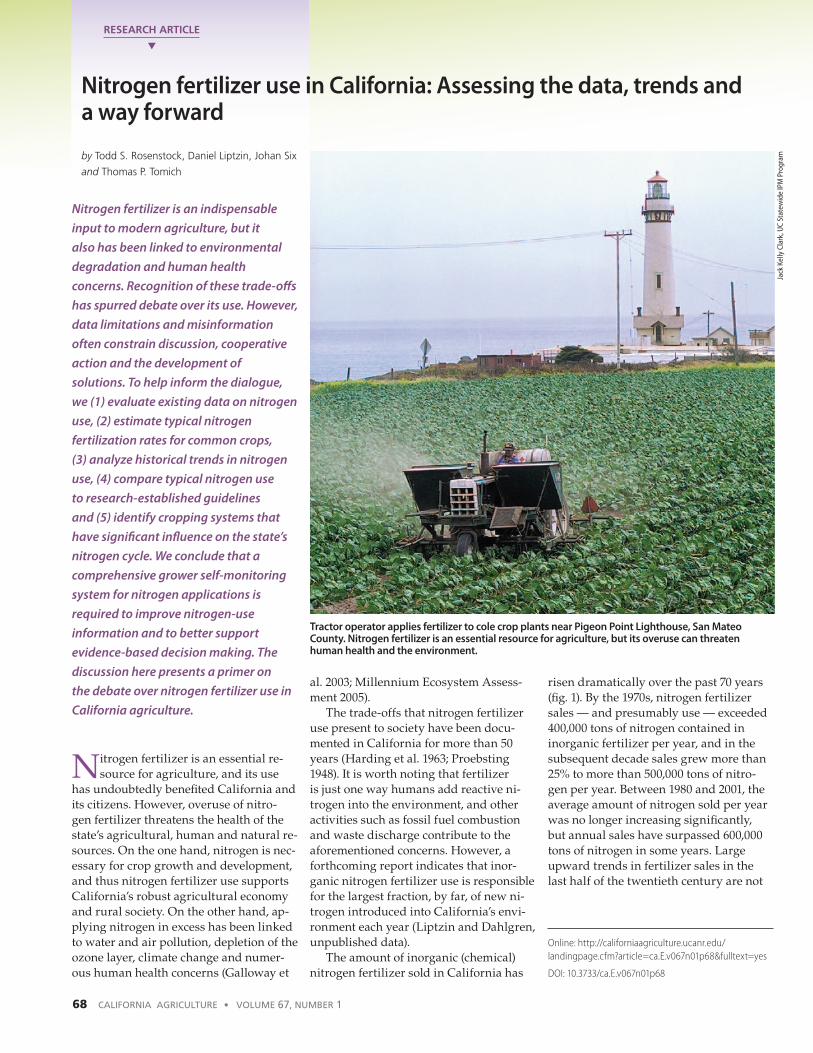
Tractor operator applies fertilizer to cole crop plants near Pigeon Point Lighthouse, San Mateo County. Nitrogen fertilizer is an essential resource for agriculture, but its overuse can threaten human health and the environment.
Jack
Kel
ly C
lark
, UC
Stat
ewid
e IP
M P
rogr
am
http://californiaagriculture.ucanr.edu • JaNUaRy–MaRch 2013 69
unique to California; similar increases are evident throughout the developed world (Millennium Ecosystem Assessment 2005). As nitrogen fertilizer use has ex-panded, so has the evidence documenting the negative consequences of reactive nitrogen on human health and the envi-ronment (Davidson et al. 2012; Townsend et al. 2003).
Today, nitrogen in general and nitro-gen fertilizer use specifically both figure prominently in regulatory discourse. Federal and state agencies tasked with protecting air and water quality as well as with mitigating climate change are evalu-ating the causes, consequences and costs of agricultural nitrogen use. Examples of this concern in California include the UC Center for Watershed Sciences’ report to the California Legislature on nitrate in drinking water, the Central Coast Regional Water Quality Control Board’s (RWQCB) renewal process for the Irrigated Agricultural Lands Waiver, the Climate Action Reserve’s nitro-gen fertilizer reduction protocol, the Central Valley RWQCB’s Irrigated Lands Regulatory Program, the Central Valley SALTS program and the Central Valley RWQCB’s General Order for Dairy Waste Dischargers. The latter, for instance, regulates nitrogen fertilizer application on croplands associated with dairies, con-straining its use.
It is important that credible and comprehensive scientific information on nitrogen use be available to support evidence-based policy-making. Without information based on sound science,
nitrogen policies may be poorly pre-scribed, ineffective, cause unintended consequences or even be counterproduc-tive. Stakeholders recognize this and have identified the need for more information
Fig. 1. Statewide sales of nitrogen fertilizer, 1945–2008. Because there is no explanation for the 50% rise in sales from 2001 to 2002, the largest 1-year change since estimates began, there is reason to question the accuracy of data since 2001. Source: California Department of Food and Agriculture.
1950 1960 1970 1980 1990 2000 2010
1,000
800
600
400
200
0
Year
Nitr
ogen
sol
d (1
,000
tons
)
Background and scope of this articleThis article reports research from one part of the California Nitrogen Assessment (see sidebar page 70). Assessments are an increasingly common method scientists use to analyze existing data sets and gain a big-picture view of what is known and what is scientifically uncertain.
The best example of an assessment is the global effort that led to reports by the Intergovernmental Panel on Climate Change (Ash et al. 2010; IPCC 2007; MA 2005). Recently, the Integrated Nitrogen Committee published an assessment of nitrogen in the United States (Integrated Nitrogen Committee 2011).
Here the authors assess existing knowledge on inorganic nitrogen fertilizer flows, practice and policy in California agriculture — knowl-edge that has only now been integrated and analyzed as a whole. They examine how statistics are generated, identify sources of uncer-tainty and compare and interpret data.
Scope. The research scope is limited to inorganic nitrogen fertilizer. Dairy manure, for instance, is not considered, although it is a high pri-ority for attention by scientists and policymakers — and is included in the larger California Nitrogen Assessment (http://nitrogen.ucdavis.
edu). Dairy manure application adds about 200,000 tons of nitrogen to California soil per year, an amount equivalent to more than one-third of the annual inorganic nitrogen sold in recent years, and it is applied to a relatively small number of forage crops.
Limits. The authors examine soil nitrogen cycling processes, which include exchanges of nitrogen between the soil and either air or water. However, the discussion is intentionally general; it does not capture nitrogen transformation or emissions under various soil, crop and water management conditions. Further analysis and experi-ments are needed to draw conclusions regarding the fate of nitrogen in specific fertilized and irrigated systems.
Stakeholder questions addressed. This article addresses stake-holder questions about nitrogen management practices in crop-ping systems. It presents the best available information that applies to these questions: How is nitrogen fertilizer currently being used? What are the current nitrogen rate recommendations? Are those rec-ommendations adequate for present-day cropping conditions?
More information on the stakeholder process can be found at http://nitrogen.ucdavis.edu. — Editor
70 CALIFORNIA AGRICULTURE • VOLUME 67, NUMBER 1
on inorganic nitrogen fertilizer use as a high priority task (http://nitrogen.ucda-vis.edu).
Accurate data on nitrogen fertilizer use are difficult to come by, however. Either nitrogen fertilizer use is simply not tracked at relevant scales, as is most often the case, or the data sources are inconsistent (see discussion of grower and expert surveys below). Despite the
fact that this data scarcity makes cur-rent estimates of nitrogen fertilizer use uncertain, the estimates still serve as an input to policy discussions. For example, the Intergovernmental Panel on Climate Change (IPCC) suggests that estimated application of nitrogen fertilizer to crop-land is a key parameter to use in approxi-mating cropland emissions of nitrous oxide, a potent greenhouse gas.
Because of the relationships among fertilizer use, crop yields, resource deg-radation and the current policy envi-ronment in California, information on nitrogen use is in high demand now and will become of even greater importance as
policies are developed in the future. The objective of this research is to assess the available information on nitrogen use in California by (1) identifying data sources and their limitations, (2) establishing aver-age nitrogen application rates by crop, (3) determining historical trends in nitrogen use (within the context of changes in crop yield) and (4) comparing how aver-age nitrogen application rates articulate
with nitrogen rate guidelines. We go on to show that these results identify crops that have significant influence on nitrogen use, and we suggest this information can then be used to set priorities for research, outreach or policy. This evaluation of the current state of knowledge on nitrogen fertilizer use is part of a broader as-sessment of nitrogen in California, the California Nitrogen Assessment (see box below).
Scientific assessments, such as the California Nitrogen Assessment, have become a common method scientists use to inform policymakers on complex social and environmental issues. Instead
of generating new research, these as-sessments analyze existing bodies of research, data and models. Assessments generate insights through the synthesis and integration of available information from multiple scientific disciplines to distinguish that which is known and well established from that which is unknown and scientifically uncertain. Assessments piece together the best available informa-tion to inform discussions, systematically calling out uncertainty. The assessment of nitrogen fertilizer use reported here relied on standard assessment methods, such as engaging stakeholders to frame the scientific question, aggregating avail-able information and identifying sources of uncertainty (Ash et al. 2010).
The nitrogen cycle
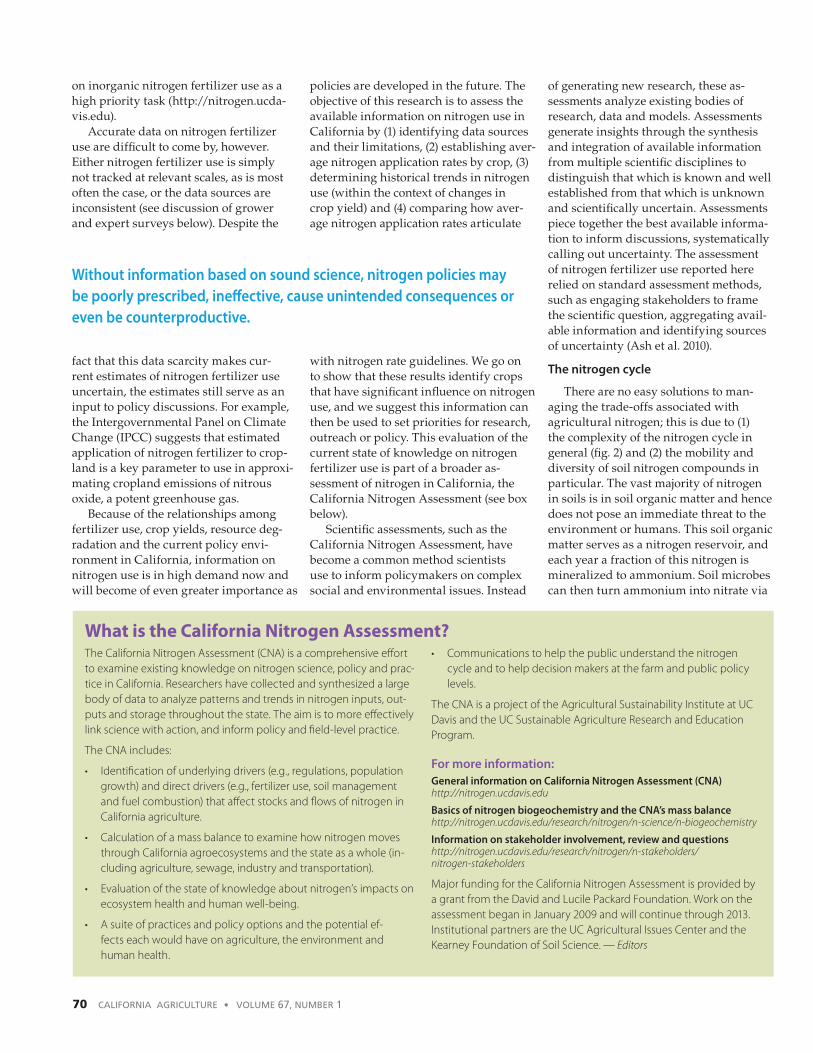
There are no easy solutions to man-aging the trade-offs associated with agricultural nitrogen; this is due to (1) the complexity of the nitrogen cycle in general (fig. 2) and (2) the mobility and diversity of soil nitrogen compounds in particular. The vast majority of nitrogen in soils is in soil organic matter and hence does not pose an immediate threat to the environment or humans. This soil organic matter serves as a nitrogen reservoir, and each year a fraction of this nitrogen is mineralized to ammonium. Soil microbes can then turn ammonium into nitrate via
What is the California Nitrogen Assessment?The California Nitrogen Assessment (CNA) is a comprehensive effort to examine existing knowledge on nitrogen science, policy and prac-tice in California. Researchers have collected and synthesized a large body of data to analyze patterns and trends in nitrogen inputs, out-puts and storage throughout the state. The aim is to more effectively link science with action, and inform policy and field-level practice.
The CNA includes:
• Identification of underlying drivers (e.g., regulations, population growth) and direct drivers (e.g., fertilizer use, soil management and fuel combustion) that affect stocks and flows of nitrogen in California agriculture.
• Calculation of a mass balance to examine how nitrogen moves through California agroecosystems and the state as a whole (in-cluding agriculture, sewage, industry and transportation).
• Evaluation of the state of knowledge about nitrogen’s impacts on ecosystem health and human well-being.
• A suite of practices and policy options and the potential ef-fects each would have on agriculture, the environment and human health.
• Communications to help the public understand the nitrogen cycle and to help decision makers at the farm and public policy levels.
The CNA is a project of the Agricultural Sustainability Institute at UC Davis and the UC Sustainable Agriculture Research and Education Program.
For more information:General information on California Nitrogen Assessment (CNA) http://nitrogen.ucdavis.edu
Basics of nitrogen biogeochemistry and the CNA’s mass balance http://nitrogen.ucdavis.edu/research/nitrogen/n-science/n-biogeochemistry
Information on stakeholder involvement, review and questions http://nitrogen.ucdavis.edu/research/nitrogen/n-stakeholders/nitrogen-stakeholders
Major funding for the California Nitrogen Assessment is provided by a grant from the David and Lucile Packard Foundation. Work on the assessment began in January 2009 and will continue through 2013. Institutional partners are the UC Agricultural Issues Center and the Kearney Foundation of Soil Science. — Editors
Without information based on sound science, nitrogen policies may be poorly prescribed, ineffective, cause unintended consequences or even be counterproductive.
http://californiaagriculture.ucanr.edu • JaNUaRy–MaRch 2013 71
Fig. 2. The nitrogen cycle. Nitrogen in the environment is mobile and readily transformed into various compounds by physical, chemical and biological processes. Arrows indicate major nitrogen-cycling processes, which continuously produce diverse nitrogen compounds in the environment.
Glossary: Nitrogen in soilsNitrogen may enter the soil through rainfall, lightning, nitrogen fixation by soil organisms, plant and animal decomposition, or manures and commercial fertilizers. It may be lost by plant removal, volatilization, leaching or erosion. It transforms continuously in soil, air and water.
Ammonification (mineralization): During decomposition of plant or animal material, specialized soil bacteria transform nitrogen to ammonia (NH3) or ammonium (NH4
+); the latter is useful to plants.
Ammonium (NH4+): This form of nitrogen can be used by plants,
or converted to nitrate by bacteria (and then taken up by plants). It is a positively charged ion (cation), attracted to negatively charged soil clay. For this reason, it is not leached to a great extent.
Denitrification: In this anaerobic process, other specialized bac-teria change nitrate back to nitrogen gas, reducing pollution of groundwater but increasing nitrogen oxides in the air. Denitrifica-tion occurs only when oxygen is low, such as during flooding and in clay soils. Because most California soils are coarse and weld-rained, denitrification occurs less often, and soils are more vulner-able to nitrate contamination of water supplies by leaching.
Nitrification, nitrite (NO2-) and nitrate (NO3
-): Specialized bacte-ria change ammonia to nitrite, and still others change nitrite to ni-trate. Both processes are nitrification, and they are aerobic, occuring only when oxygen is present. Nitrate is the principal form of nitro-gen used by plants. Because it is negatively charged (an anion) and
is not attracted to soil clay, it leaches easily and is a water pollutant. Nitrate-enriched groundwater can also contribute to algal blooms in streams, although most such blooms result from nitrogen- and phosphorus-enriched surface runoff.
Nitrogen gas (N2): Dinitrogen gas occurs when two nitrogen at-oms form a very strong trivalent chemical bond; it comprises 78% of the atmosphere. Although largely inert, nitrogen gas can be "fixed" into biologically useful forms in the soil (see first paragraph).
Nitrogen loss (leaching, erosion): Nitrogen losses from the soil system occur by plant removal, denitrification, leaching, volatiliza-tion and erosion. Plant removal by crops is fertilization. Erosion and leaching can contribute to ground and surface water pollution.
Nitrogen, organic (nitrogen in living or once-living things): “Organic nitrogen” originated in living material and is still part of a carbon-chain complex. It can enter soil as decomposed plant or animal tissue. It is not available to plants until microorganisms trans-form it to ammonium (NH4
+).
Nitrogen, reactive: Reactive nitrogen is all nitrogen other than dinitrogen gas (N2).
Volatilization: Soil microorganisms convert ammonium nitrogen to ammonia gas in soils with a high pH, that is a pH greater than 7.5. Such soils are not common in California.
Glossary sources include an article by Thomas Harter in the July/August 2009 Southwest Hydrology.— Janet White
Fossil fuelemissions
(NOX)
Precipitation
Lightning �xation(NO)
Gaseous atmosphericnitrogen store
(N2)
Bacteria �xation(organic N)
fertilizers(urea, NH3, NO3)
Gaseouslosses
(N2 & N2O)
Denitri�cation
Plantconsumption
Nitrates(NO3−)
Nitrites(NO2−)
Organic matter(R-HN2)
Ammonium(NH4+)
EutrophicationLeaching
Leaching
Runo�
Nitri�cation
Denitri�cation
Nitri�cation
Mineralization
GaseousNH3
Cour
tesy
of S
outh
wes
t Hyd
rolo
gy
72 CALIFORNIA AGRICULTURE • VOLUME 67, NUMBER 1
the process of nitrification. Both forms of nitrogen, ammonium and nitrate, are available for plant uptake. Mineralization supplies as much as half or more of the ni-trogen to crops (Gardner and Drinkwater 2009). The reverse process (immobi-lization) entails the integration of the inorganic nitrogen produced by mineral-ization into the living biomass of plants and microbes.
Nitrogen compounds can also be re-leased from the crop root zone through multiple processes. Leaching relates to the physical movement of nitrate downward through the soil profile. Volatilization is a physiochemical process that emits gaseous ammonia. Denitrification is a microbial-mediated release of inert dini-trogen gas and potentially nitrogen oxides including nitrous oxide. It is the emission of these nitrogen compounds that threat-ens the health of California’s environment and human population.
The rate at which nitrogen cycling oc-curs in soils is a function of a multitude of abiotic (precipitation and temperature), bi-otic (microbial communities) and human-mediated (such as tillage and nitrogen fertilizer application rate) factors.
Fertilizer and excess nitrogen
Adding inorganic nitrogen fertilizer to soil promotes high plant productivity and
long-term soil fertility (Ladha et al. 2011), but this can also cause large surpluses of nitrogen in the environment. This excess nitrogen can lead to environmental degra-dation by percolation (leaching) through the root zone and into groundwater, through surface runoff into waterways, or via emissions of nitrogen gases such as ammonia, nitric oxide or nitrous oxide into the atmosphere. Gaseous and water-borne nitrogen may be related to nitrogen fertilizer application rates in linear and nonlinear ways, which means applica-tion rates alone are not always enough to determine how much is lost to the
environment (Broadbent and Rauschkolb 1977; Hoben et al. 2011; Linquist et al. 2012). Recent evidence suggests that the best indicator of potential nitrogen loss into the environment is the “surplus” nitrogen, which is the difference between the nitrogen applied as fertilizer and the nitrogen taken up by the crop (Van Groenigen et al. 2010). Therefore, both nitrogen application rate and nitrogen surplus, which is calculated after the crops are harvested, are important factors for predicting where nitrogen loss should be highest.
Nitrogen-fertilizer-use data
Data on nitrogen fertilizer use in California are scarce and fragmented. Typically, data are less available and more variable at finer spatial resolutions. The following identifies the primary sources of data available for statewide and county nitrogen use and nitrogen application rates by crop, and discusses some of the inherent limitations of these data sources.
Statewide nitrogen fertilizer use. Fertilizer sales data are collected by the California Department of Food and Agriculture (CDFA) and reported at the state and county levels. Since fertilizer sales are only recorded when a licensed fertilizer dealer sells to an unlicensed buyer, these data provide a rough approx-imation of the total inorganic nitrogen applied statewide, assuming no stockpil-ing or interstate transfer of fertilizing materials (fig. 1). Annual data are avail-able dating back to 1945. However, there are additional reasons to question the accuracy of these data. Perhaps the most obvious is the unexplainable 50% jump
Colin
Bish
op
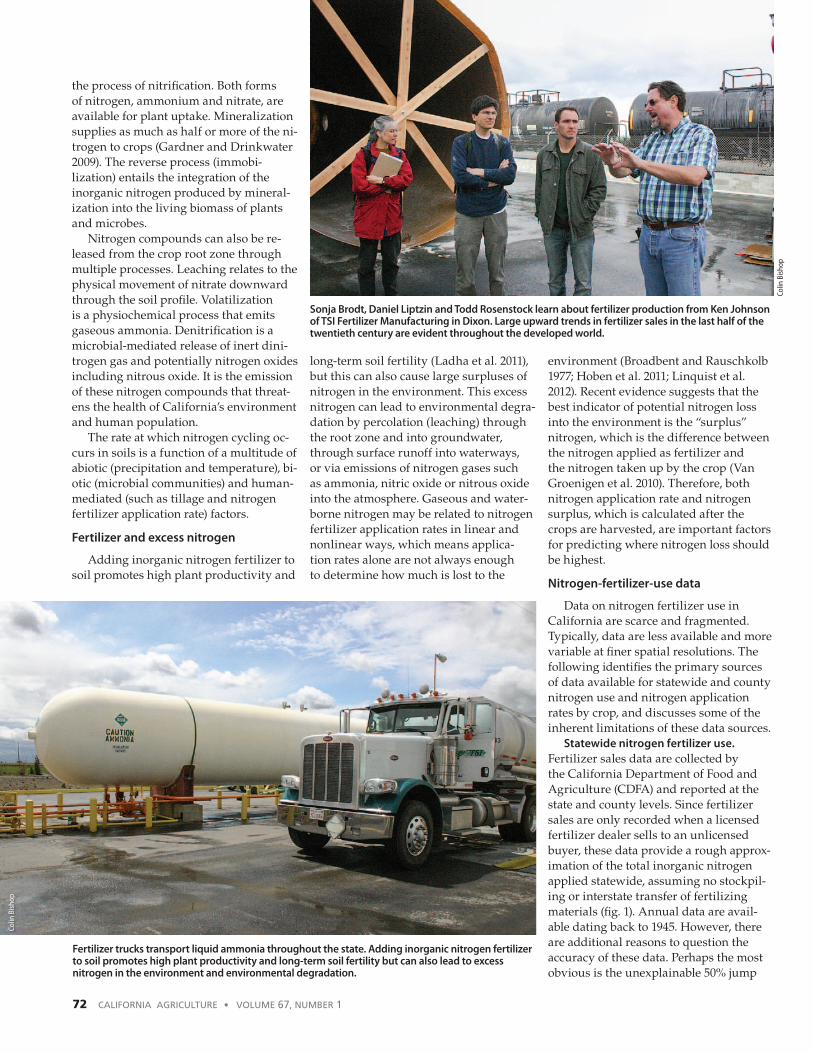
Sonja Brodt, Daniel Liptzin and Todd Rosenstock learn about fertilizer production from Ken Johnson of TSI Fertilizer Manufacturing in Dixon. Large upward trends in fertilizer sales in the last half of the twentieth century are evident throughout the developed world.
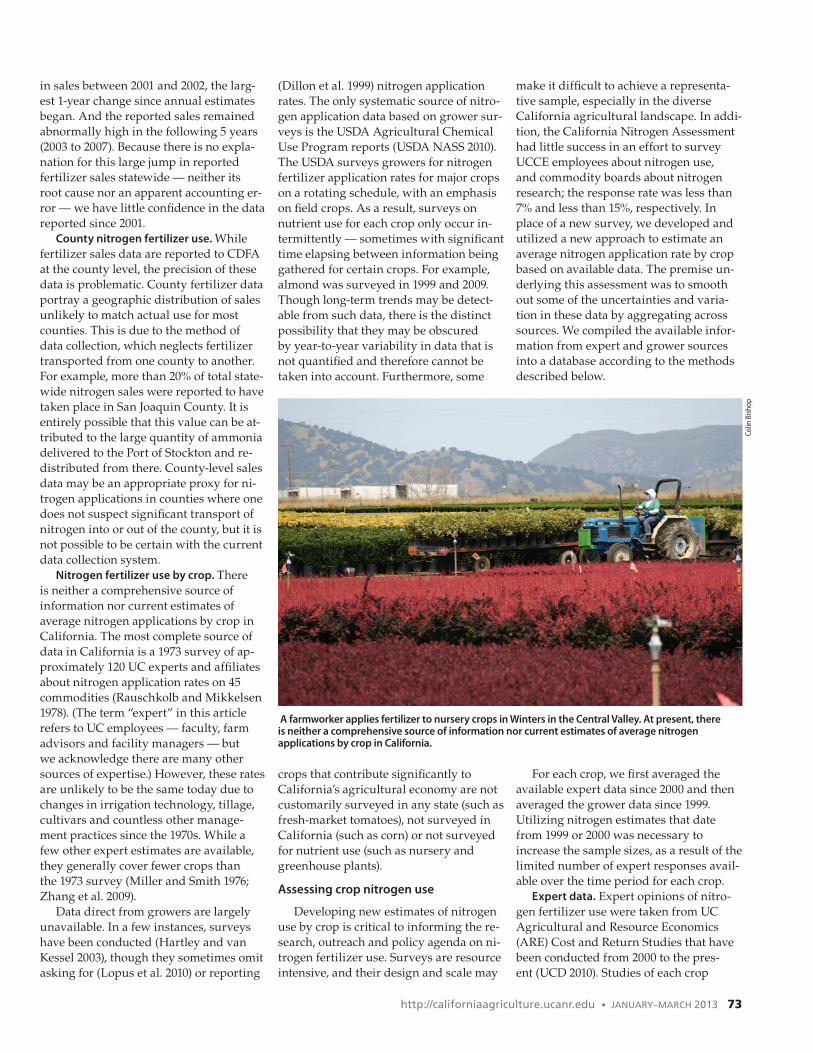
Fertilizer trucks transport liquid ammonia throughout the state. Adding inorganic nitrogen fertilizer to soil promotes high plant productivity and long-term soil fertility but can also lead to excess nitrogen in the environment and environmental degradation.
Colin
Bish
op
http://californiaagriculture.ucanr.edu • JaNUaRy–MaRch 2013 73
in sales between 2001 and 2002, the larg-est 1-year change since annual estimates began. And the reported sales remained abnormally high in the following 5 years (2003 to 2007). Because there is no expla-nation for this large jump in reported fertilizer sales statewide — neither its root cause nor an apparent accounting er-ror — we have little confidence in the data reported since 2001.
County nitrogen fertilizer use. While fertilizer sales data are reported to CDFA at the county level, the precision of these data is problematic. County fertilizer data portray a geographic distribution of sales unlikely to match actual use for most counties. This is due to the method of data collection, which neglects fertilizer transported from one county to another. For example, more than 20% of total state-wide nitrogen sales were reported to have taken place in San Joaquin County. It is entirely possible that this value can be at-tributed to the large quantity of ammonia delivered to the Port of Stockton and re-distributed from there. County-level sales data may be an appropriate proxy for ni-trogen applications in counties where one does not suspect significant transport of nitrogen into or out of the county, but it is not possible to be certain with the current data collection system.
Nitrogen fertilizer use by crop. There is neither a comprehensive source of information nor current estimates of average nitrogen applications by crop in California. The most complete source of data in California is a 1973 survey of ap-proximately 120 UC experts and affiliates about nitrogen application rates on 45 commodities (Rauschkolb and Mikkelsen 1978). (The term “expert” in this article refers to UC employees — faculty, farm advisors and facility managers — but we acknowledge there are many other sources of expertise.) However, these rates are unlikely to be the same today due to changes in irrigation technology, tillage, cultivars and countless other manage-ment practices since the 1970s. While a few other expert estimates are available, they generally cover fewer crops than the 1973 survey (Miller and Smith 1976; Zhang et al. 2009).
Data direct from growers are largely unavailable. In a few instances, surveys have been conducted (Hartley and van Kessel 2003), though they sometimes omit asking for (Lopus et al. 2010) or reporting
(Dillon et al. 1999) nitrogen application rates. The only systematic source of nitro-gen application data based on grower sur-veys is the USDA Agricultural Chemical Use Program reports (USDA NASS 2010). The USDA surveys growers for nitrogen fertilizer application rates for major crops on a rotating schedule, with an emphasis on field crops. As a result, surveys on nutrient use for each crop only occur in-termittently — sometimes with significant time elapsing between information being gathered for certain crops. For example, almond was surveyed in 1999 and 2009. Though long-term trends may be detect-able from such data, there is the distinct possibility that they may be obscured by year-to-year variability in data that is not quantified and therefore cannot be taken into account. Furthermore, some
crops that contribute significantly to California’s agricultural economy are not customarily surveyed in any state (such as fresh-market tomatoes), not surveyed in California (such as corn) or not surveyed for nutrient use (such as nursery and greenhouse plants).
Assessing crop nitrogen use
Developing new estimates of nitrogen use by crop is critical to informing the re-search, outreach and policy agenda on ni-trogen fertilizer use. Surveys are resource intensive, and their design and scale may
make it difficult to achieve a representa-tive sample, especially in the diverse California agricultural landscape. In addi-tion, the California Nitrogen Assessment had little success in an effort to survey UCCE employees about nitrogen use, and commodity boards about nitrogen research; the response rate was less than 7% and less than 15%, respectively. In place of a new survey, we developed and utilized a new approach to estimate an average nitrogen application rate by crop based on available data. The premise un-derlying this assessment was to smooth out some of the uncertainties and varia-tion in these data by aggregating across sources. We compiled the available infor-mation from expert and grower sources into a database according to the methods described below.
For each crop, we first averaged the available expert data since 2000 and then averaged the grower data since 1999. Utilizing nitrogen estimates that date from 1999 or 2000 was necessary to increase the sample sizes, as a result of the limited number of expert responses avail-able over the time period for each crop.
Expert data. Expert opinions of nitro-gen fertilizer use were taken from UC Agricultural and Resource Economics (ARE) Cost and Return Studies that have been conducted from 2000 to the pres-ent (UCD 2010). Studies of each crop
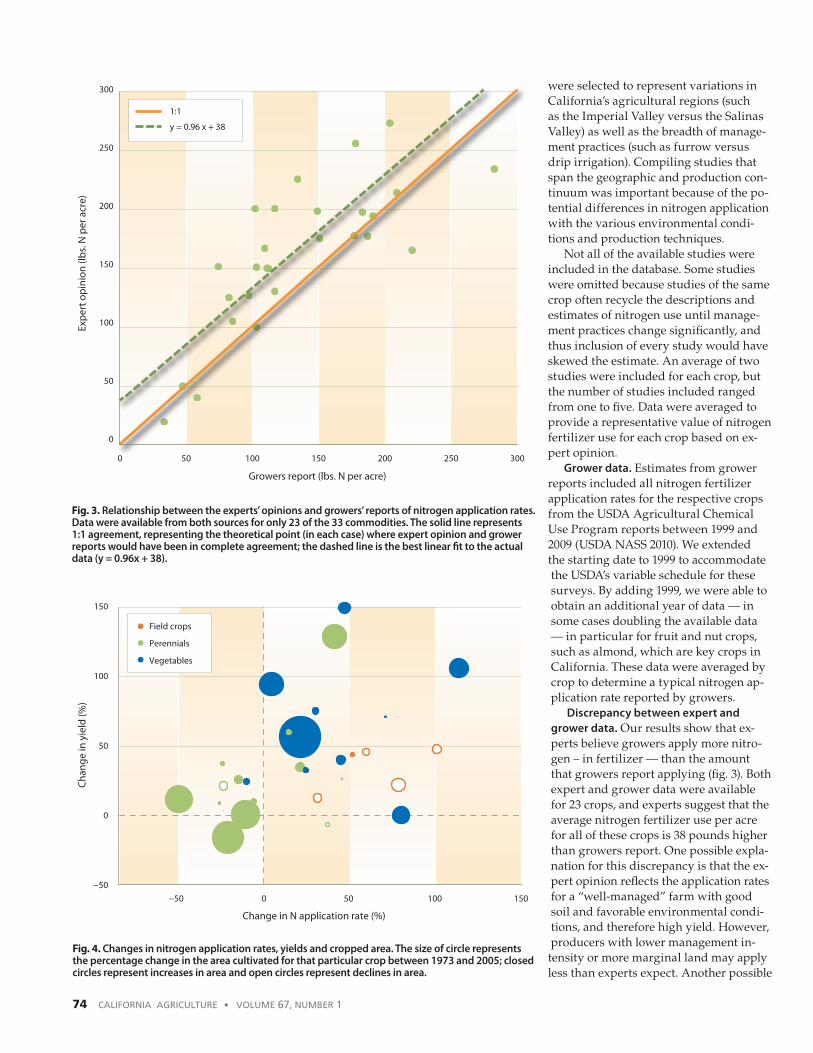
A farmworker applies fertilizer to nursery crops in Winters in the Central Valley. At present, there is neither a comprehensive source of information nor current estimates of average nitrogen applications by crop in California.
Colin
Bish
op
74 CALIFORNIA AGRICULTURE • VOLUME 67, NUMBER 1
were selected to represent variations in California’s agricultural regions (such as the Imperial Valley versus the Salinas Valley) as well as the breadth of manage-ment practices (such as furrow versus drip irrigation). Compiling studies that span the geographic and production con-tinuum was important because of the po-tential differences in nitrogen application with the various environmental condi-tions and production techniques.
Not all of the available studies were included in the database. Some studies were omitted because studies of the same crop often recycle the descriptions and estimates of nitrogen use until manage-ment practices change significantly, and thus inclusion of every study would have skewed the estimate. An average of two studies were included for each crop, but the number of studies included ranged from one to five. Data were averaged to provide a representative value of nitrogen fertilizer use for each crop based on ex-pert opinion.
Grower data. Estimates from grower reports included all nitrogen fertilizer application rates for the respective crops from the USDA Agricultural Chemical Use Program reports between 1999 and 2009 (USDA NASS 2010). We extended the starting date to 1999 to accommodate the USDA’s variable schedule for these surveys. By adding 1999, we were able to obtain an additional year of data — in some cases doubling the available data — in particular for fruit and nut crops, such as almond, which are key crops in California. These data were averaged by crop to determine a typical nitrogen ap-plication rate reported by growers.
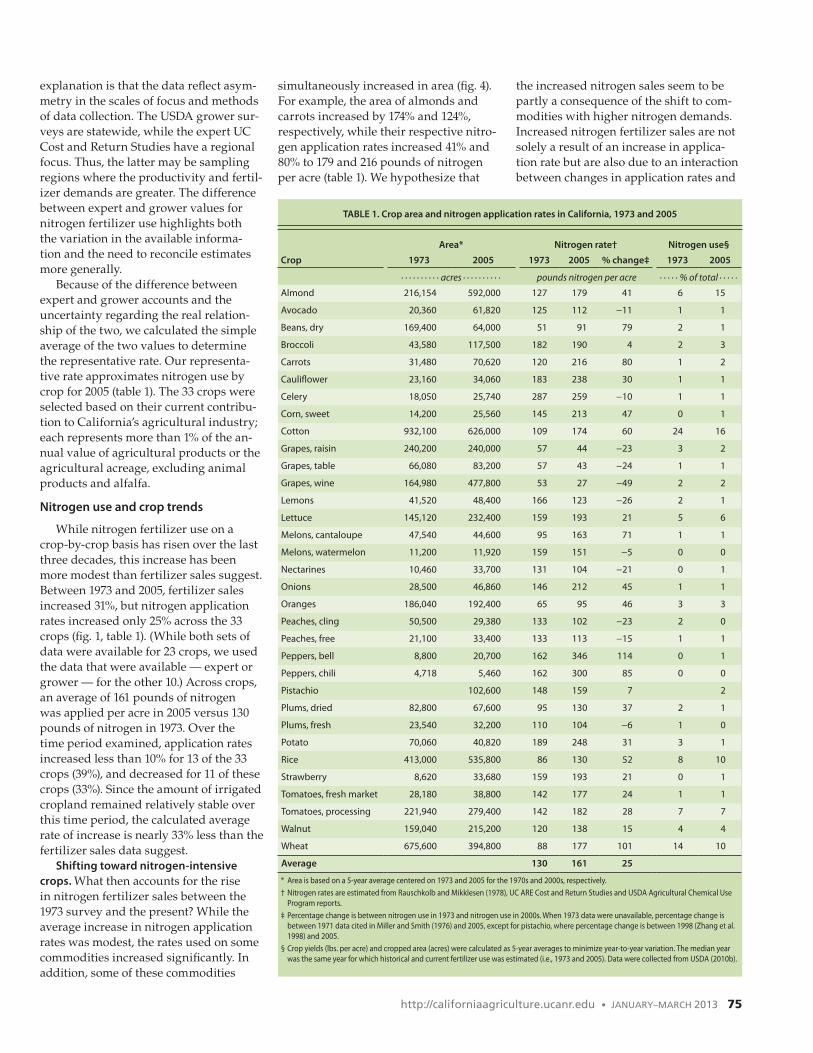
Discrepancy between expert and grower data. Our results show that ex-perts believe growers apply more nitro-gen – in fertilizer — than the amount that growers report applying (fig. 3). Both expert and grower data were available for 23 crops, and experts suggest that the average nitrogen fertilizer use per acre for all of these crops is 38 pounds higher than growers report. One possible expla-nation for this discrepancy is that the ex-pert opinion reflects the application rates for a “well-managed” farm with good soil and favorable environmental condi-tions, and therefore high yield. However, producers with lower management in-tensity or more marginal land may apply less than experts expect. Another possible
Fig. 3. Relationship between the experts’ opinions and growers’ reports of nitrogen application rates. Data were available from both sources for only 23 of the 33 commodities. The solid line represents 1:1 agreement, representing the theoretical point (in each case) where expert opinion and grower reports would have been in complete agreement; the dashed line is the best linear fit to the actual data (y = 0.96x + 38).
Fig. 4. Changes in nitrogen application rates, yields and cropped area. The size of circle represents the percentage change in the area cultivated for that particular crop between 1973 and 2005; closed circles represent increases in area and open circles represent declines in area.
Expe
rt o
pini
on (l
bs. N
per
acr
e)
Growers report (lbs. N per acre)
300
250
200
150
100
50
0
0 50 100 150 200 250 300
1:1
y = 0.96 x + 38
Change in N application rate (%)
Chan
ge in
yie
ld (%
)
−50
0
50
100
150
−50 0 50 100 150
Field crops
Perennials
Vegetables
http://californiaagriculture.ucanr.edu • JaNUaRy–MaRch 2013 75
explanation is that the data reflect asym-metry in the scales of focus and methods of data collection. The USDA grower sur-veys are statewide, while the expert UC Cost and Return Studies have a regional focus. Thus, the latter may be sampling regions where the productivity and fertil-izer demands are greater. The difference between expert and grower values for nitrogen fertilizer use highlights both the variation in the available informa-tion and the need to reconcile estimates more generally.
Because of the difference between expert and grower accounts and the uncertainty regarding the real relation-ship of the two, we calculated the simple average of the two values to determine the representative rate. Our representa-tive rate approximates nitrogen use by crop for 2005 (table 1). The 33 crops were selected based on their current contribu-tion to California’s agricultural industry; each represents more than 1% of the an-nual value of agricultural products or the agricultural acreage, excluding animal products and alfalfa.
Nitrogen use and crop trends
While nitrogen fertilizer use on a crop-by-crop basis has risen over the last three decades, this increase has been more modest than fertilizer sales suggest. Between 1973 and 2005, fertilizer sales increased 31%, but nitrogen application rates increased only 25% across the 33 crops (fig. 1, table 1). (While both sets of data were available for 23 crops, we used the data that were available — expert or grower — for the other 10.) Across crops, an average of 161 pounds of nitrogen was applied per acre in 2005 versus 130 pounds of nitrogen in 1973. Over the time period examined, application rates increased less than 10% for 13 of the 33 crops (39%), and decreased for 11 of these crops (33%). Since the amount of irrigated cropland remained relatively stable over this time period, the calculated average rate of increase is nearly 33% less than the fertilizer sales data suggest.
Shifting toward nitrogen-intensive crops. What then accounts for the rise in nitrogen fertilizer sales between the 1973 survey and the present? While the average increase in nitrogen application rates was modest, the rates used on some commodities increased significantly. In addition, some of these commodities
simultaneously increased in area (fig. 4). For example, the area of almonds and carrots increased by 174% and 124%, respectively, while their respective nitro-gen application rates increased 41% and 80% to 179 and 216 pounds of nitrogen per acre (table 1). We hypothesize that
the increased nitrogen sales seem to be partly a consequence of the shift to com-modities with higher nitrogen demands. Increased nitrogen fertilizer sales are not solely a result of an increase in applica-tion rate but are also due to an interaction between changes in application rates and
TABLE 1. Crop area and nitrogen application rates in California, 1973 and 2005
Area* Nitrogen rate† Nitrogen use§
Crop 1973 2005 1973 2005 % change‡ 1973 2005. . . . . . . . . . acres . . . . . . . . . . pounds nitrogen per acre . . . . . % of total . . . . .
Almond 216,154 592,000 127 179 41 6 15
Avocado 20,360 61,820 125 112 −11 1 1
Beans, dry 169,400 64,000 51 91 79 2 1
Broccoli 43,580 117,500 182 190 4 2 3
Carrots 31,480 70,620 120 216 80 1 2
Cauliflower 23,160 34,060 183 238 30 1 1
Celery 18,050 25,740 287 259 −10 1 1
Corn, sweet 14,200 25,560 145 213 47 0 1
Cotton 932,100 626,000 109 174 60 24 16
Grapes, raisin 240,200 240,000 57 44 −23 3 2
Grapes, table 66,080 83,200 57 43 −24 1 1
Grapes, wine 164,980 477,800 53 27 −49 2 2
Lemons 41,520 48,400 166 123 −26 2 1
Lettuce 145,120 232,400 159 193 21 5 6
Melons, cantaloupe 47,540 44,600 95 163 71 1 1
Melons, watermelon 11,200 11,920 159 151 −5 0 0
Nectarines 10,460 33,700 131 104 −21 0 1
Onions 28,500 46,860 146 212 45 1 1
Oranges 186,040 192,400 65 95 46 3 3
Peaches, cling 50,500 29,380 133 102 −23 2 0
Peaches, free 21,100 33,400 133 113 −15 1 1
Peppers, bell 8,800 20,700 162 346 114 0 1
Peppers, chili 4,718 5,460 162 300 85 0 0
Pistachio 102,600 148 159 7 2
Plums, dried 82,800 67,600 95 130 37 2 1
Plums, fresh 23,540 32,200 110 104 −6 1 0
Potato 70,060 40,820 189 248 31 3 1
Rice 413,000 535,800 86 130 52 8 10
Strawberry 8,620 33,680 159 193 21 0 1
Tomatoes, fresh market 28,180 38,800 142 177 24 1 1
Tomatoes, processing 221,940 279,400 142 182 28 7 7
Walnut 159,040 215,200 120 138 15 4 4
Wheat 675,600 394,800 88 177 101 14 10
Average 130 161 25
* Area is based on a 5-year average centered on 1973 and 2005 for the 1970s and 2000s, respectively. † Nitrogen rates are estimated from Rauschkolb and Mikklesen (1978), UC ARE Cost and Return Studies and USDA Agricultural Chemical Use
Program reports. ‡ Percentage change is between nitrogen use in 1973 and nitrogen use in 2000s. When 1973 data were unavailable, percentage change is
between 1971 data cited in Miller and Smith (1976) and 2005, except for pistachio, where percentage change is between 1998 (Zhang et al. 1998) and 2005.
§ Crop yields (lbs. per acre) and cropped area (acres) were calculated as 5-year averages to minimize year-to-year variation. The median year was the same year for which historical and current fertilizer use was estimated (i.e., 1973 and 2005). Data were collected from USDA (2010b).
76 CALIFORNIA AGRICULTURE • VOLUME 67, NUMBER 1
shifts toward a more nitrogen-intensive crop mix.
Using nitrogen more efficiently. Simply applying a greater amount of nitrogen fertilizer in and of itself is not necessar-ily harmful. It is the fraction of excess nitrogen applied that poses a threat to the environment. For almost every crop examined, yields and nitrogen uptake
increase with greater nitrogen supply (fig. 4). These data clearly show the posi-tive effect increased nitrogen use has had on California’s ability to produce food. Because the rate of change of yields is often greater than that of nitrogen use, these findings further suggest that grow-ers of the 33 commodities examined have, on average, become more agronomically
nitrogen-efficient (in the technical, not the economic, sense) than in 1973. For most crops, less nitrogen is applied per unit of product.
Judicious nitrogen use?
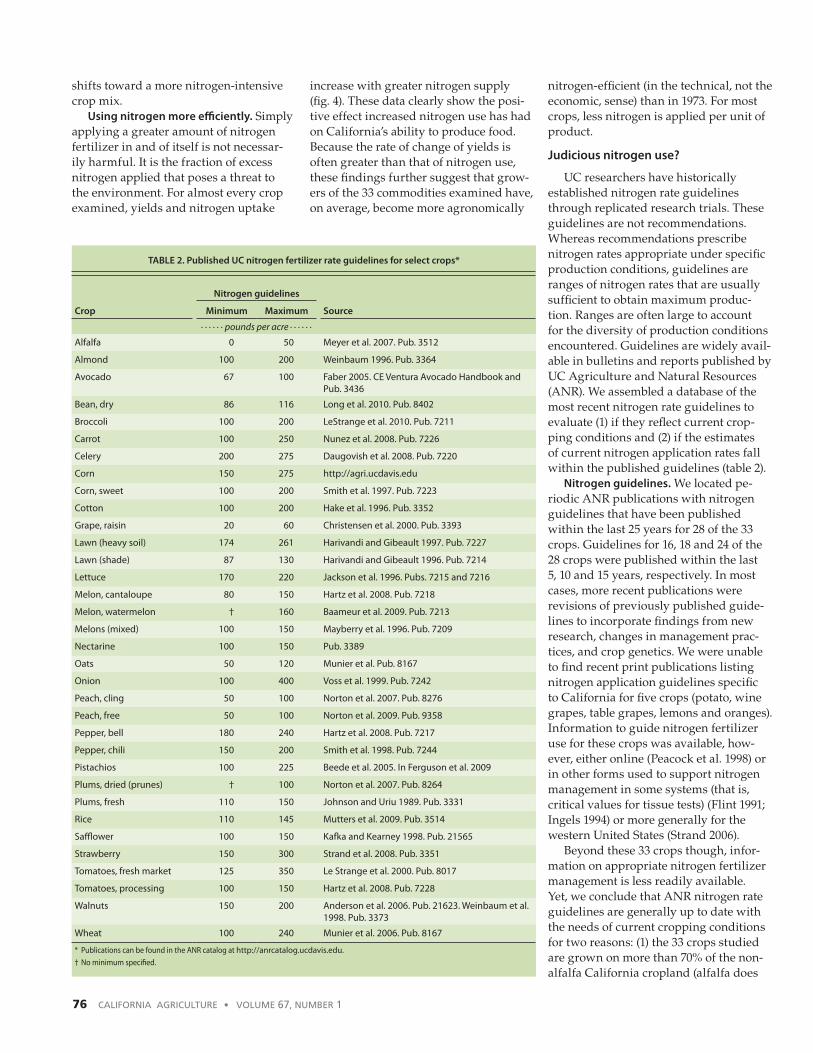
UC researchers have historically established nitrogen rate guidelines through replicated research trials. These guidelines are not recommendations. Whereas recommendations prescribe nitrogen rates appropriate under specific production conditions, guidelines are ranges of nitrogen rates that are usually sufficient to obtain maximum produc-tion. Ranges are often large to account for the diversity of production conditions encountered. Guidelines are widely avail-able in bulletins and reports published by UC Agriculture and Natural Resources (ANR). We assembled a database of the most recent nitrogen rate guidelines to evaluate (1) if they reflect current crop-ping conditions and (2) if the estimates of current nitrogen application rates fall within the published guidelines (table 2).
Nitrogen guidelines. We located pe-riodic ANR publications with nitrogen guidelines that have been published within the last 25 years for 28 of the 33 crops. Guidelines for 16, 18 and 24 of the 28 crops were published within the last 5, 10 and 15 years, respectively. In most cases, more recent publications were revisions of previously published guide-lines to incorporate findings from new research, changes in management prac-tices, and crop genetics. We were unable to find recent print publications listing nitrogen application guidelines specific to California for five crops (potato, wine grapes, table grapes, lemons and oranges). Information to guide nitrogen fertilizer use for these crops was available, how-ever, either online (Peacock et al. 1998) or in other forms used to support nitrogen management in some systems (that is, critical values for tissue tests) (Flint 1991; Ingels 1994) or more generally for the western United States (Strand 2006).
Beyond these 33 crops though, infor-mation on appropriate nitrogen fertilizer management is less readily available. Yet, we conclude that ANR nitrogen rate guidelines are generally up to date with the needs of current cropping conditions for two reasons: (1) the 33 crops studied are grown on more than 70% of the non-alfalfa California cropland (alfalfa does
TABLE 2. Published UC nitrogen fertilizer rate guidelines for select crops*
Nitrogen guidelines
Crop Minimum Maximum Source. . . . . . pounds per acre . . . . . .
Alfalfa 0 50 Meyer et al. 2007. Pub. 3512
Almond 100 200 Weinbaum 1996. Pub. 3364
Avocado 67 100 Faber 2005. CE Ventura Avocado Handbook and Pub. 3436
Bean, dry 86 116 Long et al. 2010. Pub. 8402
Broccoli 100 200 LeStrange et al. 2010. Pub. 7211
Carrot 100 250 Nunez et al. 2008. Pub. 7226
Celery 200 275 Daugovish et al. 2008. Pub. 7220
Corn 150 275 http://agri.ucdavis.edu
Corn, sweet 100 200 Smith et al. 1997. Pub. 7223
Cotton 100 200 Hake et al. 1996. Pub. 3352
Grape, raisin 20 60 Christensen et al. 2000. Pub. 3393
Lawn (heavy soil) 174 261 Harivandi and Gibeault 1997. Pub. 7227
Lawn (shade) 87 130 Harivandi and Gibeault 1996. Pub. 7214
Lettuce 170 220 Jackson et al. 1996. Pubs. 7215 and 7216
Melon, cantaloupe 80 150 Hartz et al. 2008. Pub. 7218
Melon, watermelon † 160 Baameur et al. 2009. Pub. 7213
Melons (mixed) 100 150 Mayberry et al. 1996. Pub. 7209
Nectarine 100 150 Pub. 3389
Oats 50 120 Munier et al. Pub. 8167
Onion 100 400 Voss et al. 1999. Pub. 7242
Peach, cling 50 100 Norton et al. 2007. Pub. 8276
Peach, free 50 100 Norton et al. 2009. Pub. 9358
Pepper, bell 180 240 Hartz et al. 2008. Pub. 7217
Pepper, chili 150 200 Smith et al. 1998. Pub. 7244
Pistachios 100 225 Beede et al. 2005. In Ferguson et al. 2009
Plums, dried (prunes) † 100 Norton et al. 2007. Pub. 8264
Plums, fresh 110 150 Johnson and Uriu 1989. Pub. 3331
Rice 110 145 Mutters et al. 2009. Pub. 3514
Safflower 100 150 Kafka and Kearney 1998. Pub. 21565
Strawberry 150 300 Strand et al. 2008. Pub. 3351
Tomatoes, fresh market 125 350 Le Strange et al. 2000. Pub. 8017
Tomatoes, processing 100 150 Hartz et al. 2008. Pub. 7228
Walnuts 150 200 Anderson et al. 2006. Pub. 21623. Weinbaum et al. 1998. Pub. 3373
Wheat 100 240 Munier et al. 2006. Pub. 8167
* Publications can be found in the ANR catalog at http://anrcatalog.ucdavis.edu.† No minimum specified.
http://californiaagriculture.ucanr.edu • JaNUaRy–MaRch 2013 77
not need nitrogen fertilizer because it fixes its own nitrogen) and (2) most guide-lines were published within a reasonably recent period. This is not to suggest that there is no longer a need to perform nitro-gen rate trials. Replicated research trials to refine current practices and to account for any future changes in various man-agement practices are still required.
Nitrogen use. Do growers apply nitro-gen in accordance with research results? We compared our 2005 estimates, which can be said to represent typical applica-tions by growers for a particular crop, to the published UC nitrogen rate guidelines (table 3). We found that the maximum values of the guideline ranges were nearly double the minimum values, a range that should be sufficient to account for heterogeneous cropping conditions. Our representative application rates were within the guidelines for 17 crops (61%), indicating that nitrogen is generally ap-plied in line with research guidelines and, in that sense, can be considered “best management” practice. For nine of the crops (32%), typical application rates exceeded the maximum value in the guidelines. Vegetables and annual fruits accounted for the largest percentage of crops that fell within that category, with 42% of the crops receiving more nitrogen than suggested by guidelines. Whereas the majority of crops appear to be fertil-ized appropriately, the latter results sug-gest that in nearly one-third of California cropping systems, either the research underestimates nitrogen requirements for on-farm cropping conditions or the producers, on average, overapply nitrogen fertilizer.
Nitrogen management
The need to balance the benefits of nitrogen fertilizer use (such as increased food supply) with the costs (such as water and air pollution) is clear. However, un-certainty about basic questions on nitro-gen use obstructs substantive discourse and cooperation among stakeholders toward workable solutions. While still not devoid of uncertainty, the typical nitro-gen application rates established in this research can be used to identify priorities for nitrogen research, outreach and policy.
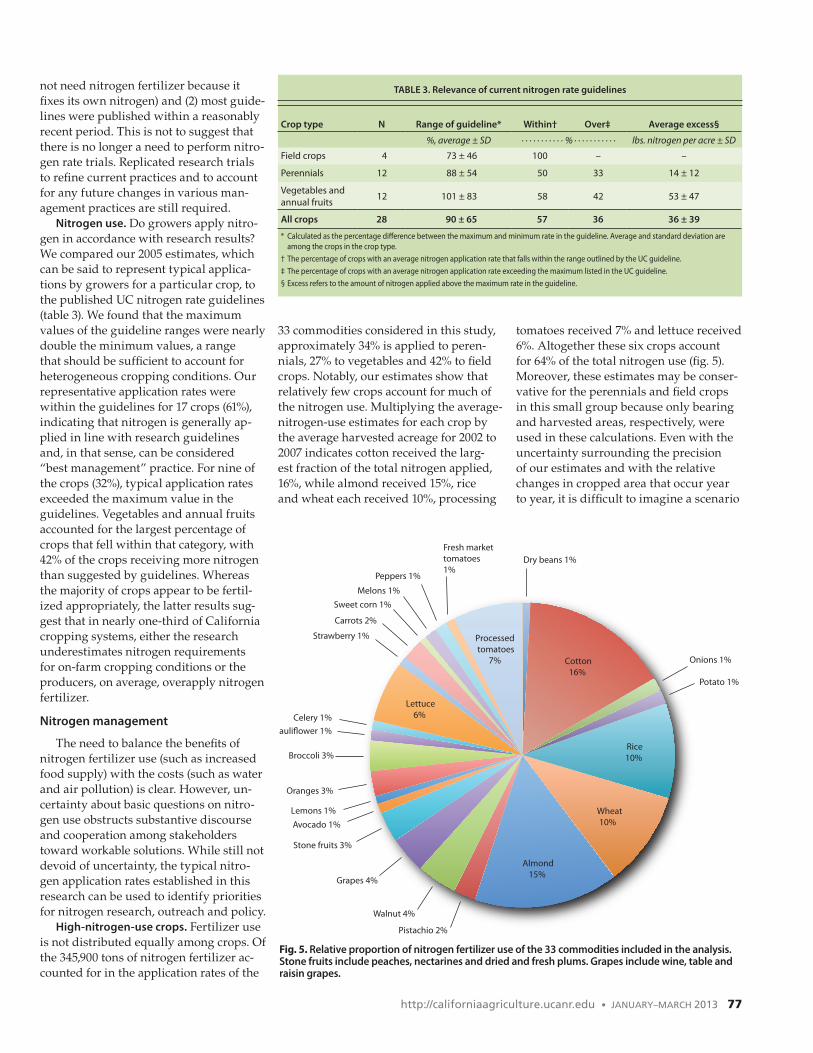
High-nitrogen-use crops. Fertilizer use is not distributed equally among crops. Of the 345,900 tons of nitrogen fertilizer ac-counted for in the application rates of the
33 commodities considered in this study, approximately 34% is applied to peren-nials, 27% to vegetables and 42% to field crops. Notably, our estimates show that relatively few crops account for much of the nitrogen use. Multiplying the average-nitrogen-use estimates for each crop by the average harvested acreage for 2002 to 2007 indicates cotton received the larg-est fraction of the total nitrogen applied, 16%, while almond received 15%, rice and wheat each received 10%, processing
tomatoes received 7% and lettuce received 6%. Altogether these six crops account for 64% of the total nitrogen use (fig. 5). Moreover, these estimates may be conser-vative for the perennials and field crops in this small group because only bearing and harvested areas, respectively, were used in these calculations. Even with the uncertainty surrounding the precision of our estimates and with the relative changes in cropped area that occur year to year, it is difficult to imagine a scenario
Dry beans 1%
Cotton16%
Onions 1%
Potato 1%
Rice10%
Wheat10%
Almond15%
Pistachio 2%
Walnut 4%
Grapes 4%
Stone fruits 3%
Avocado 1% Lemons 1%
Oranges 3%
Broccoli 3%
Cauliflower 1% Celery 1%
Lettuce6%
Processed tomatoes
7%
Fresh markettomatoes1%
Peppers 1%
Melons 1%Sweet corn 1%
Carrots 2%
Strawberry 1%
Fig. 5. Relative proportion of nitrogen fertilizer use of the 33 commodities included in the analysis. Stone fruits include peaches, nectarines and dried and fresh plums. Grapes include wine, table and raisin grapes.
TABLE 3. Relevance of current nitrogen rate guidelines
Crop type N Range of guideline* Within† Over‡ Average excess§
%, average ± SD . . . . . . . . . . . % . . . . . . . . . . . lbs. nitrogen per acre ± SD
Field crops 4 73 ± 46 100 – –
Perennials 12 88 ± 54 50 33 14 ± 12
Vegetables and annual fruits 12 101 ± 83 58 42 53 ± 47
All crops 28 90 ± 65 57 36 36 ± 39
* Calculated as the percentage difference between the maximum and minimum rate in the guideline. Average and standard deviation are among the crops in the crop type.
† The percentage of crops with an average nitrogen application rate that falls within the range outlined by the UC guideline. ‡ The percentage of crops with an average nitrogen application rate exceeding the maximum listed in the UC guideline. § Excess refers to the amount of nitrogen applied above the maximum rate in the guideline.
78 CALIFORNIA AGRICULTURE • VOLUME 67, NUMBER 1
where other crops could account for as much total inorganic nitrogen fertilizer use in the state, at least in the short term.
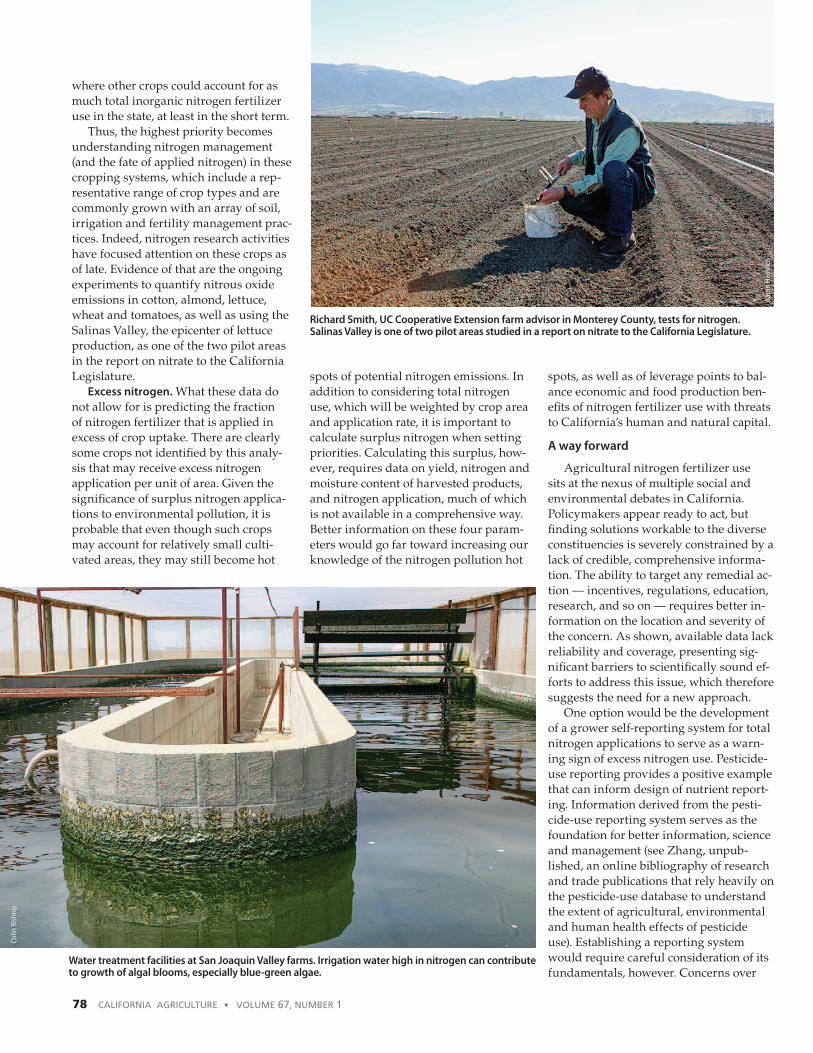
Thus, the highest priority becomes understanding nitrogen management (and the fate of applied nitrogen) in these cropping systems, which include a rep-resentative range of crop types and are commonly grown with an array of soil, irrigation and fertility management prac-tices. Indeed, nitrogen research activities have focused attention on these crops as of late. Evidence of that are the ongoing experiments to quantify nitrous oxide emissions in cotton, almond, lettuce, wheat and tomatoes, as well as using the Salinas Valley, the epicenter of lettuce production, as one of the two pilot areas in the report on nitrate to the California Legislature.
Excess nitrogen. What these data do not allow for is predicting the fraction of nitrogen fertilizer that is applied in excess of crop uptake. There are clearly some crops not identified by this analy-sis that may receive excess nitrogen application per unit of area. Given the significance of surplus nitrogen applica-tions to environmental pollution, it is probable that even though such crops may account for relatively small culti-vated areas, they may still become hot
spots of potential nitrogen emissions. In addition to considering total nitrogen use, which will be weighted by crop area and application rate, it is important to calculate surplus nitrogen when setting priorities. Calculating this surplus, how-ever, requires data on yield, nitrogen and moisture content of harvested products, and nitrogen application, much of which is not available in a comprehensive way. Better information on these four param-eters would go far toward increasing our knowledge of the nitrogen pollution hot
spots, as well as of leverage points to bal-ance economic and food production ben-efits of nitrogen fertilizer use with threats to California’s human and natural capital.
A way forward
Agricultural nitrogen fertilizer use sits at the nexus of multiple social and environmental debates in California. Policymakers appear ready to act, but finding solutions workable to the diverse constituencies is severely constrained by a lack of credible, comprehensive informa-tion. The ability to target any remedial ac-tion — incentives, regulations, education, research, and so on — requires better in-formation on the location and severity of the concern. As shown, available data lack reliability and coverage, presenting sig-nificant barriers to scientifically sound ef-forts to address this issue, which therefore suggests the need for a new approach.
One option would be the development of a grower self-reporting system for total nitrogen applications to serve as a warn-ing sign of excess nitrogen use. Pesticide-use reporting provides a positive example that can inform design of nutrient report-ing. Information derived from the pesti-cide-use reporting system serves as the foundation for better information, science and management (see Zhang, unpub-lished, an online bibliography of research and trade publications that rely heavily on the pesticide-use database to understand the extent of agricultural, environmental and human health effects of pesticide use). Establishing a reporting system would require careful consideration of its fundamentals, however. Concerns over
Aaro
n He
inric
h
Richard Smith, UC Cooperative Extension farm advisor in Monterey County, tests for nitrogen. Salinas Valley is one of two pilot areas studied in a report on nitrate to the California Legislature.
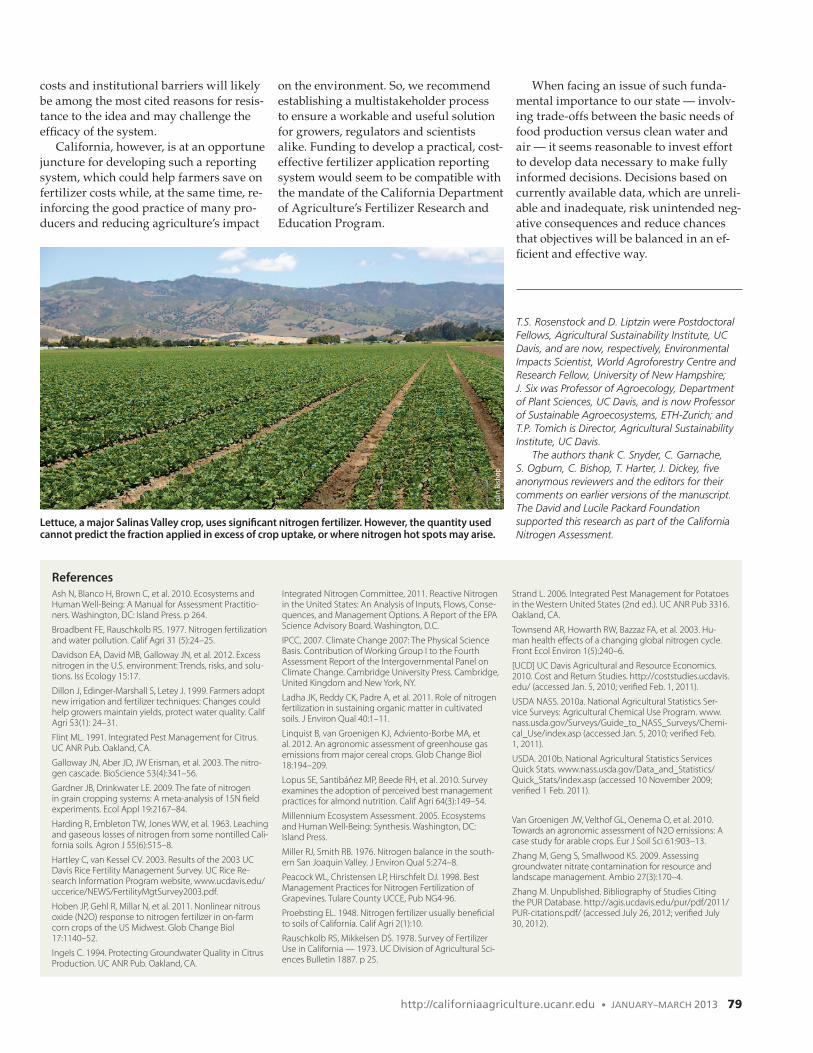
Water treatment facilities at San Joaquin Valley farms. Irrigation water high in nitrogen can contribute to growth of algal blooms, especially blue-green algae.
Colin
Bish
op
http://californiaagriculture.ucanr.edu • JaNUaRy–MaRch 2013 79
costs and institutional barriers will likely be among the most cited reasons for resis-tance to the idea and may challenge the efficacy of the system.
California, however, is at an opportune juncture for developing such a reporting system, which could help farmers save on fertilizer costs while, at the same time, re-inforcing the good practice of many pro-ducers and reducing agriculture’s impact
on the environment. So, we recommend establishing a multistakeholder process to ensure a workable and useful solution for growers, regulators and scientists alike. Funding to develop a practical, cost-effective fertilizer application reporting system would seem to be compatible with the mandate of the California Department of Agriculture’s Fertilizer Research and Education Program.
When facing an issue of such funda-mental importance to our state — involv-ing trade-offs between the basic needs of food production versus clean water and air — it seems reasonable to invest effort to develop data necessary to make fully informed decisions. Decisions based on currently available data, which are unreli-able and inadequate, risk unintended neg-ative consequences and reduce chances that objectives will be balanced in an ef-ficient and effective way.
T.S. Rosenstock and D. Liptzin were Postdoctoral Fellows, Agricultural Sustainability Institute, UC Davis, and are now, respectively, Environmental Impacts Scientist, World Agroforestry Centre and Research Fellow, University of New Hampshire; J. Six was Professor of Agroecology, Department of Plant Sciences, UC Davis, and is now Professor of Sustainable Agroecosystems, ETH-Zurich; and T.P. Tomich is Director, Agricultural Sustainability Institute, UC Davis.
The authors thank C. Snyder, C. Garnache, S. Ogburn, C. Bishop, T. Harter, J. Dickey, five anonymous reviewers and the editors for their comments on earlier versions of the manuscript. The David and Lucile Packard Foundation supported this research as part of the California Nitrogen Assessment.
ReferencesAsh N, Blanco H, Brown C, et al. 2010. Ecosystems and Human Well-Being: A Manual for Assessment Practitio-ners. Washington, DC: Island Press. p 264.
Broadbent FE, Rauschkolb RS. 1977. Nitrogen fertilization and water pollution. Calif Agri 31 (5):24–25.
Davidson EA, David MB, Galloway JN, et al. 2012. Excess nitrogen in the U.S. environment: Trends, risks, and solu-tions. Iss Ecology 15:17.
Dillon J, Edinger-Marshall S, Letey J. 1999. Farmers adopt new irrigation and fertilizer techniques: Changes could help growers maintain yields, protect water quality. Calif Agri 53(1): 24–31.
Flint ML. 1991. Integrated Pest Management for Citrus. UC ANR Pub. Oakland, CA.
Galloway JN, Aber JD, JW Erisman, et al. 2003. The nitro-gen cascade. BioScience 53(4):341–56.
Gardner JB, Drinkwater LE. 2009. The fate of nitrogen in grain cropping systems: A meta-analysis of 15N field experiments. Ecol Appl 19:2167–84.
Harding R, Embleton TW, Jones WW, et al. 1963. Leaching and gaseous losses of nitrogen from some nontilled Cali-fornia soils. Agron J 55(6):515–8.
Hartley C, van Kessel CV. 2003. Results of the 2003 UC Davis Rice Fertility Management Survey. UC Rice Re-search Information Program website, www.ucdavis.edu/uccerice/NEWS/FertilityMgtSurvey2003.pdf.
Hoben JP, Gehl R, Millar N, et al. 2011. Nonlinear nitrous oxide (N2O) response to nitrogen fertilizer in on-farm corn crops of the US Midwest. Glob Change Biol 17:1140–52.
Ingels C. 1994. Protecting Groundwater Quality in Citrus Production. UC ANR Pub. Oakland, CA.
Integrated Nitrogen Committee, 2011. Reactive Nitrogen in the United States: An Analysis of Inputs, Flows, Conse-quences, and Management Options. A Report of the EPA Science Advisory Board. Washington, D.C.
IPCC, 2007. Climate Change 2007: The Physical Science Basis. Contribution of Working Group I to the Fourth Assessment Report of the Intergovernmental Panel on Climate Change. Cambridge University Press. Cambridge, United Kingdom and New York, NY.
Ladha JK, Reddy CK, Padre A, et al. 2011. Role of nitrogen fertilization in sustaining organic matter in cultivated soils. J Environ Qual 40:1–11.
Linquist B, van Groenigen KJ, Adviento-Borbe MA, et al. 2012. An agronomic assessment of greenhouse gas emissions from major cereal crops. Glob Change Biol 18:194–209.
Lopus SE, Santibáñez MP, Beede RH, et al. 2010. Survey examines the adoption of perceived best management practices for almond nutrition. Calif Agri 64(3):149–54.
Millennium Ecosystem Assessment. 2005. Ecosystems and Human Well-Being: Synthesis. Washington, DC: Island Press.
Miller RJ, Smith RB. 1976. Nitrogen balance in the south-ern San Joaquin Valley. J Environ Qual 5:274–8.
Peacock WL, Christensen LP, Hirschfelt DJ. 1998. Best Management Practices for Nitrogen Fertilization of Grapevines. Tulare County UCCE, Pub NG4-96.
Proebsting EL. 1948. Nitrogen fertilizer usually beneficial to soils of California. Calif Agri 2(1):10.
Rauschkolb RS, Mikkelsen DS. 1978. Survey of Fertilizer Use in California — 1973. UC Division of Agricultural Sci-ences Bulletin 1887. p 25.
Strand L. 2006. Integrated Pest Management for Potatoes in the Western United States (2nd ed.). UC ANR Pub 3316. Oakland, CA.
Townsend AR, Howarth RW, Bazzaz FA, et al. 2003. Hu-man health effects of a changing global nitrogen cycle. Front Ecol Environ 1(5):240–6.
[UCD] UC Davis Agricultural and Resource Economics. 2010. Cost and Return Studies. http://coststudies.ucdavis.edu/ (accessed Jan. 5, 2010; verified Feb. 1, 2011).
USDA NASS. 2010a. National Agricultural Statistics Ser-vice Surveys: Agricultural Chemical Use Program. www.nass.usda.gov/Surveys/Guide_to_NASS_Surveys/Chemi-cal_Use/index.asp (accessed Jan. 5, 2010; verified Feb. 1, 2011).
USDA. 2010b. National Agricultural Statistics Services Quick Stats. www.nass.usda.gov/Data_and_Statistics/Quick_Stats/index.asp (accessed 10 November 2009; verified 1 Feb. 2011).
Van Groenigen JW, Velthof GL, Oenema O, et al. 2010. Towards an agronomic assessment of N2O emissions: A case study for arable crops. Eur J Soil Sci 61:903–13.
Zhang M, Geng S, Smallwood KS. 2009. Assessing groundwater nitrate contamination for resource and landscape management. Ambio 27(3):170–4.
Zhang M. Unpublished. Bibliography of Studies Citing the PUR Database. http://agis.ucdavis.edu/pur/pdf/2011/PUR-citations.pdf/ (accessed July 26, 2012; verified July 30, 2012).
Lettuce, a major Salinas Valley crop, uses significant nitrogen fertilizer. However, the quantity used cannot predict the fraction applied in excess of crop uptake, or where nitrogen hot spots may arise.
Colin
Bish
op