nitrogen recovery and response of kentucky bluegrass to
TRANSCRIPT
Nitrogen Recovery and Response of Kentucky Bluegrass to Stabilized or Controlled-Release Urea-N Fertilizers
Date: 29 December, 2014
Submitted to: The Pennsylvania Turfgrass Council
Submitted by: Max Schlossberg, Ph.D., Assoc. Prof. Turfgrass Nutrition; Ryan L. Sebring, MS Agronomy Candidate; Kyle R. Hivner, Res. Assoc.; Center for Turfgrass Science, The Pennsylvania State Univ.
Introduction Quality expectations exert significant daily pressure on turfgrass managers and superintendents to provide exceptional playing conditions. Under greater usage and scrutiny regarding frequent ‘chemical’ applications to sports fields and golf courses, the modern turfgrass manager has become increasingly reliant on controlled-release nitrogen fertilizers to optimize appearance, growth, and resilience of turfgrass over greater durations. However, the continuously-increasing number of ‘enhanced-efficiency’ nitrogen fertilizer products available complicates appropriate selection. The same difficulty selecting appropriate fertilizers affects managers of the estimated 40 million acres of home-lawns and sod fields in the US. Considering this market, turfgrass comprises both an environmentally- and economically-important land use.
Many turfgrass managers seek results of applied, replicated agronomic research conducted by Land-grant University personnel. Enhanced heritable color and shoot density traits of newer Kentucky bluegrass and perennial ryegrass cultivars limit the resolution of visual turfgrass color and/or quality ratings. Direct measurement of turfgrass growth rate (clipping yield) and leaf nitrogen content afford researchers quantifiable and continuous measures of N offtake or apparent N recovery (ANR) in lbs N / area. Apparent N recovery values facilitate calculation of fertilizer N offtake and percent fertilizer N use efficiency (%FNUE). These measurements prove useful in comprehensive turfgrass fertilizer evaluation. Objectives To comprehensively and systematically evaluate over an 18-week period the influence of enhanced-efficiency and controlled-release granular nitrogen fertilizers on Kentucky bluegrass vigor/yield, density, color, and fertilizer N use efficiency; to that provided by traditional urea and/or urea-formaldehyde reaction N fertilizer products currently available in the marketplace. Materials and Methods A Hagerstown silt loam (fine, mixed, semiactive, mesic Typic Hapludalfs) was established by Kentucky bluegrass sod in Sept. 2012 and subsequently maintained within the PSU Valentine Turfgrass Research Center (University Park, PA). From May to October 2013 and April to May 2014, the mowing frequency was every 6±4 days (1.2” height of cut) with clippings removed. Analysis of soil collected from the upper 6” of the profile in early April 2014 indicated neutral soil pH (7.0) and limited availability of soil nitrate and/or ammonium. In late April, a maintenance granular fertilizer application delivered 2.0 lbs K2O, 1.0 lbs Mg, and 2 lbs S / M (1000 ft2). Beginning in May, the experimental area was mowed twice each week using a dedicated 22” rotary deck-mower and bagger (clippings removed). Following the described mowing on 13 May, a randomized complete block design of forty-five (45) plots in five (5) blocks was installed. All 6x4-ft plots were separated by a minimum distance of 0.5- or 2-feet on their respective long or short boundary.
2
MJ Schlossberg, RL Sebring, and KR Hivner – 2014 – PSU Center for Turfgrass Science
Granular urea-based N fertilizers were applied to randomly-selected plots at a rate of 0.9 or 1.8 lbs N / 1000 ft2 or M (Table 1). An unfertilized control plot (0 lbs N / M) was maintained in each block. Pre-weighed rates of each fertilizer were prepared in five HDPE snap vials and used to uniformly distribute the contents over each plot. Following application of all fertilizer treatments, the experimental area was flagged to prevent inadvertent mowing by facility personnel. The granular fertilizer applications were later activated by approximately 0.4” of rainfall on 13 May 2014. Table 1. Descriptions of urea-based nitrogen fertilizer products evaluated in the field study.
Nitrogen (N) fertilizer treatment Rate Components / Enhancement(s) / Stabilizer(s) Name Grade per 1000 ft2 Description, % inclusion
Urea 46–0–0 0.9 lbs N 100% water soluble urea-nitrogen
UMAXX 46–0–0 0.9 lbs N 100% water soluble urea-nitrogen, dicyandiamide, 1-5% (by mass); N-butyl-thiophosphoric triamide, <0.1% (by mass); N-methyl-2-pyrrolidone, <0.1% (by mass)
XCU 43–0–0 0.9 lbs N 100% sulfur/polymer-coated controlled release urea-nitrogen; sulfur 4% (by mass)
Duration 45 44–0–0 0.9 lbs N 100% polymer-coated controlled release urea-nitrogen
Nutralene 40–0–0 1.8 lbs N 35% water-insoluble methylene urea-nitrogen
Duration 90 44–0–0 1.8 lbs N 100% polymer-coated controlled release urea-nitrogen
Duration 120 43–0–0 1.8 lbs N 100% polymer-coated controlled release urea-nitrogen
Polyon 43 43–0–0 1.8 lbs N 100% polymer-coated controlled release urea-nitrogen
A fabricated chute and ‘micro-bagger’ was installed on the 22” rotary mower to collect clipping yields from the centers of each plot on 20 and 27 May (7 and 14 DAT); 4, 10, 17, and 26 June (22, 28, 35, and 44 DAT); 4, 11, 20, and 29 July (52, 59, 68, and 77 DAT); 8, 17, and 27 August (87, 96, and 106 DAT); and 3, 10, and 17 Sept. 2014 (113, 120, and 127 DAT). The micro-bagger was replaced with the ‘stock’ bagger following clipping yield collections, and all remaining turf was mowed (clippings removed). The plots remained flagged continuously and were not otherwise mowed.
Clippings were dried to constant mass in a forced-air oven (140 F) and transferred to desiccators for storage. The mass of dry clipping samples was determined at 1-mg resolution and recorded. For every plot, a 0.5-g clipping subsample of the first and second yields, third and fourth yields, and ultimately 15th and 16th yields; were pooled and ground to pass a 0.5-mm sieve, then analyzed for total nitrogen by medium temperature furnace combustion (EA-1110 CHNS analyzer, CE Instruments, Milan, Italy). Thus, N offtake (lbs N / M) was calculated as the product of each yield collection and its pooled tissue N (equal to the earlier or later collected date) on a per-plot basis. Nitrogen offtake represents the apparent N recovery for the period of time from the last mowing event, either 0 DAT or more recent clipping yield collection. Control-adjusted fertilizer N offtake (lbs FN / M) for each plot was calculated by subtracting control plot offtake on a per block basis. These values were divided by fertilizer N application rate (0.9 or 1.8 lbs N / M) as percent fertilizer N use efficiency (%FNUE).
Approximately each week of the described study (as weather permitted), simultaneous measures of 660– and 850–nm reflectance from the canopy of each plot were recorded in triplicate using an ambient light-excluding FieldScout TCM–500 turfgrass chlorophyll meter (Spectrum Technologies Inc., Plainfield, IL). Reflectance data was used to calculate normalized differential vegetative indices (NDVI). On an identical
3
MJ Schlossberg, RL Sebring, and KR Hivner – 2014 – PSU Center for Turfgrass Science
PSU Schlossberg 2014 Valentine Research Center Weather
5/5/14 5/19/14 6/2/14 6/16/14 6/30/14 7/14/14 7/28/14 8/11/14 8/25/14 9/8/14 9/22/14
24-h
our
reco
rded
val
ue
40
45
50
55
60
65
70
75
80
85
90
95
100
24-hour precipitation (inches)
0.0
0.5
1.0
1.5
2.0
2.5
Min. temp (F)
Max. temp (F)
Rainfall (inches)
frequency, a color meter (FieldScout TCM-500-RGB) was employed to collect triplicate measures of green, red, and blue canopy reflectance. These data were converted to hue, saturation, and brightness levels to determine dark green color index (DGCI; Karcher & Richardson, 2003). These NDVI and DGCI indices provide dependably-reproducible measures of turfgrass canopy density and dark green color respectively (Zhu et al., 2012).
Statistical Analysis Turfgrass canopy quality, growth, fertilizer N offtake, and percent fertilizer N use efficiency parameters were individually modeled by effects and interaction of fertilizer treatment and DAT using the mixed procedure (SAS Institute, v. 8.2). As described by Hsu (1992), statistical separations were made using Dunnett’s ‘one-tailed’ tests to separate, as applicable, the mean of each fertilizer treatment level from a ‘control fertilizer’ treatment level. For fertilizers applied at the 0.9 lbs N / M rate, urea was designated the ‘control fertilizer.’ For fertilizers applied at the 1.8 lbs N / M rate, Nutralene was designated. Operationally, a difftype adjustment was specified to test whether non-control fertilizer response significantly exceeded that elicited by urea or Nutralene fertilizer treatment. An alpha level of 0.05 was employed in all cases.
Monthly mean fertilizer N use efficiencies were calculated on a per-plot basis and modeled by the main effects and interaction of fertilizer and month after treatment (MAT). Component means of this significant interaction were parsed by traditional pairwise analysis using Fisher’s least significant difference (LSD, alpha=0.05).
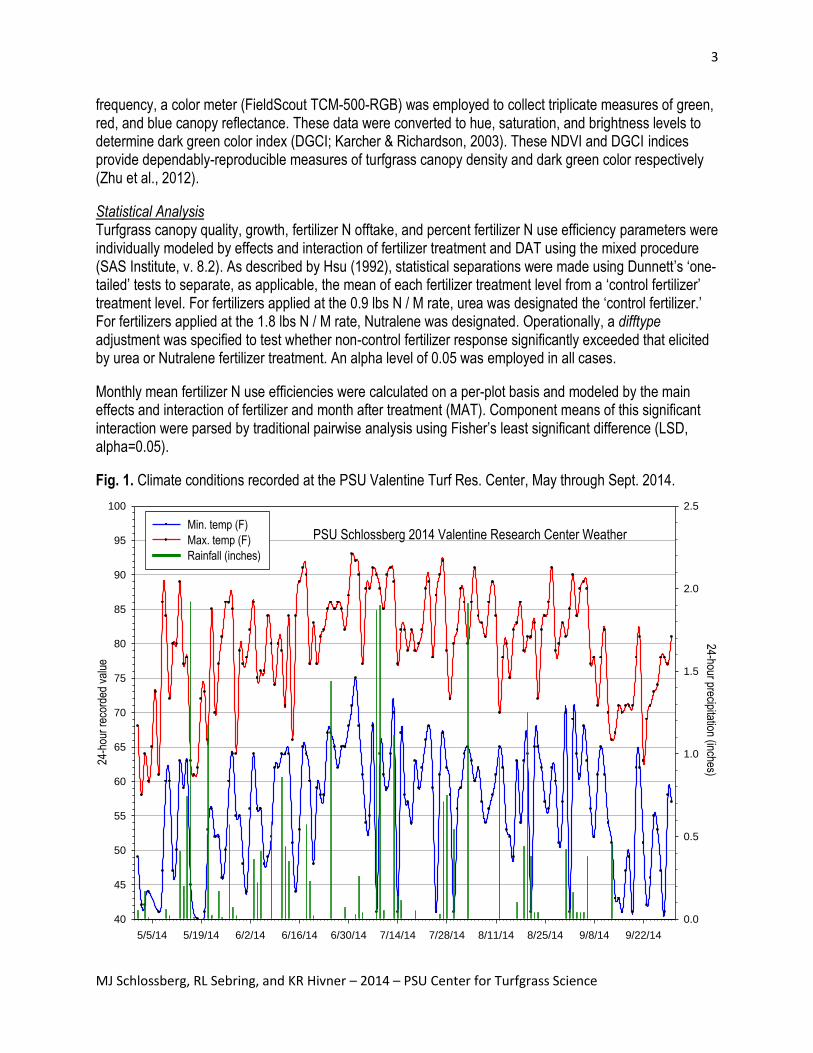
Fig. 1. Climate conditions recorded at the PSU Valentine Turf Res. Center, May through Sept. 2014.
4
MJ Schlossberg, RL Sebring, and KR Hivner – 2014 – PSU Center for Turfgrass Science
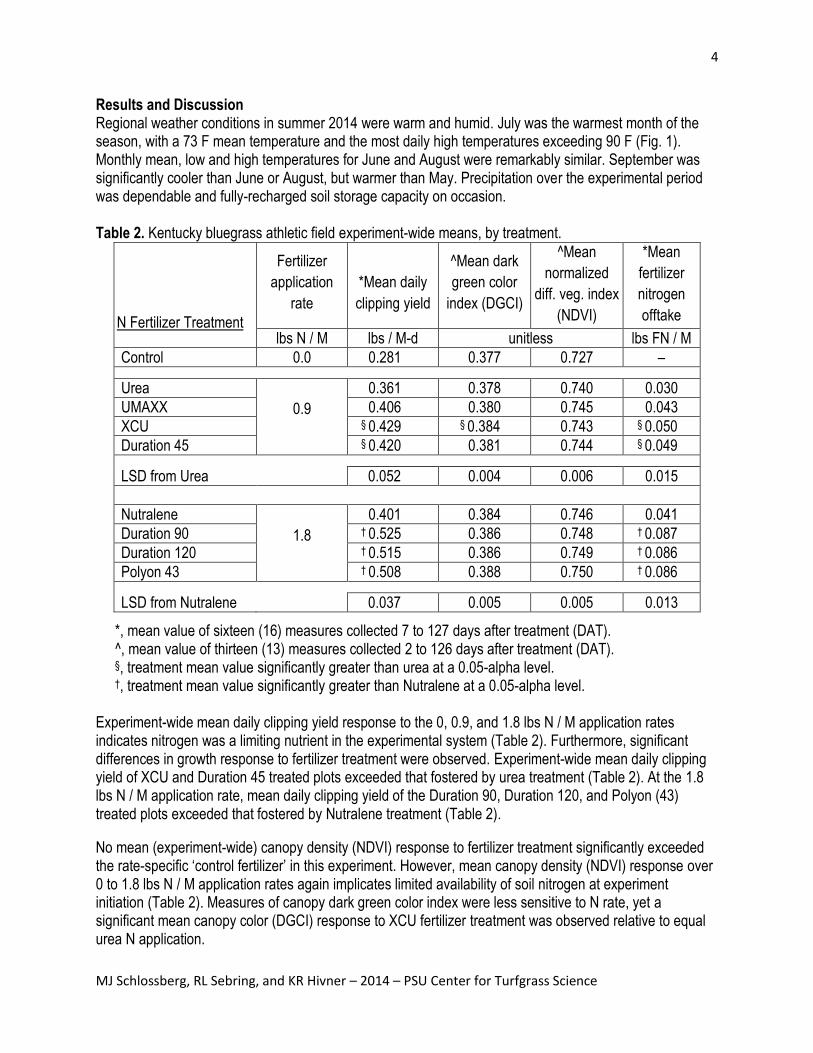
Results and Discussion Regional weather conditions in summer 2014 were warm and humid. July was the warmest month of the season, with a 73 F mean temperature and the most daily high temperatures exceeding 90 F (Fig. 1). Monthly mean, low and high temperatures for June and August were remarkably similar. September was significantly cooler than June or August, but warmer than May. Precipitation over the experimental period was dependable and fully-recharged soil storage capacity on occasion. Table 2. Kentucky bluegrass athletic field experiment-wide means, by treatment.
N Fertilizer Treatment
Fertilizer
application
rate
*Mean daily
clipping yield
^Mean dark
green color
index (DGCI)
^Mean
normalized
diff. veg. index
(NDVI)
*Mean
fertilizer
nitrogen
offtake
lbs N / M lbs / M-d unitless lbs FN / M
Control 0.0 0.281 0.377 0.727 –
Urea
0.9
0.361 0.378 0.740 0.030
UMAXX 0.406 0.380 0.745 0.043
XCU § 0.429 § 0.384 0.743 § 0.050
Duration 45 § 0.420 0.381 0.744 § 0.049
LSD from Urea 0.052 0.004 0.006 0.015
Nutralene
1.8
0.401 0.384 0.746 0.041
Duration 90 † 0.525 0.386 0.748 † 0.087
Duration 120 † 0.515 0.386 0.749 † 0.086
Polyon 43 † 0.508 0.388 0.750 † 0.086
LSD from Nutralene 0.037 0.005 0.005 0.013
*, mean value of sixteen (16) measures collected 7 to 127 days after treatment (DAT). ^, mean value of thirteen (13) measures collected 2 to 126 days after treatment (DAT). §, treatment mean value significantly greater than urea at a 0.05-alpha level. †, treatment mean value significantly greater than Nutralene at a 0.05-alpha level.
Experiment-wide mean daily clipping yield response to the 0, 0.9, and 1.8 lbs N / M application rates indicates nitrogen was a limiting nutrient in the experimental system (Table 2). Furthermore, significant differences in growth response to fertilizer treatment were observed. Experiment-wide mean daily clipping yield of XCU and Duration 45 treated plots exceeded that fostered by urea treatment (Table 2). At the 1.8 lbs N / M application rate, mean daily clipping yield of the Duration 90, Duration 120, and Polyon (43) treated plots exceeded that fostered by Nutralene treatment (Table 2).
No mean (experiment-wide) canopy density (NDVI) response to fertilizer treatment significantly exceeded the rate-specific ‘control fertilizer’ in this experiment. However, mean canopy density (NDVI) response over 0 to 1.8 lbs N / M application rates again implicates limited availability of soil nitrogen at experiment initiation (Table 2). Measures of canopy dark green color index were less sensitive to N rate, yet a significant mean canopy color (DGCI) response to XCU fertilizer treatment was observed relative to equal urea N application.
5
MJ Schlossberg, RL Sebring, and KR Hivner – 2014 – PSU Center for Turfgrass Science
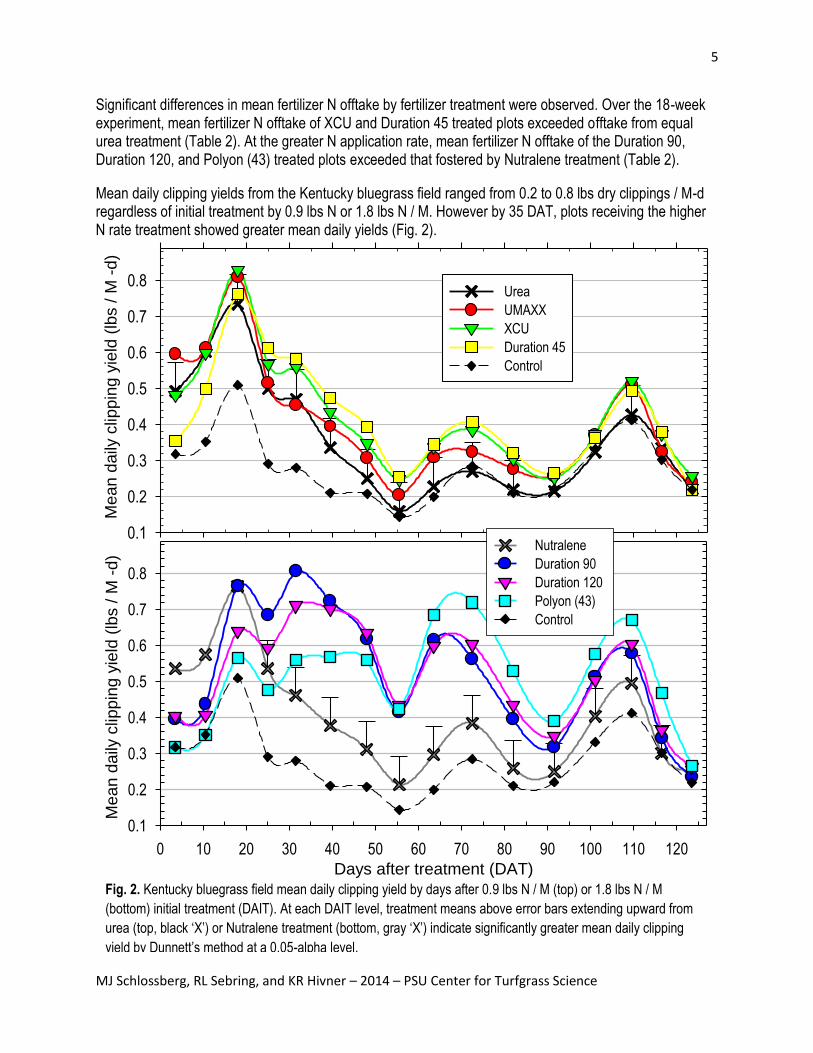
Fig. 2. Kentucky bluegrass field mean daily clipping yield by days after 0.9 lbs N / M (top) or 1.8 lbs N / M
(bottom) initial treatment (DAIT). At each DAIT level, treatment means above error bars extending upward from
urea (top, black ‘X’) or Nutralene treatment (bottom, gray ‘X’) indicate significantly greater mean daily clipping
yield by Dunnett’s method at a 0.05-alpha level.
Me
an
daily
clip
pin
g y
ield
(lb
s /
M -
d)
0.1
0.2
0.3
0.4
0.5
0.6
0.7
0.8Urea
UMAXX
XCU
Duration 45
Control
Days after treatment (DAT)
0 10 20 30 40 50 60 70 80 90 100 110 120
Me
an
daily
clip
pin
g y
ield
(lb
s /
M -
d)
0.1
0.2
0.3
0.4
0.5
0.6
0.7
0.8
Nutralene
Duration 90
Duration 120
Polyon (43)
Control
Significant differences in mean fertilizer N offtake by fertilizer treatment were observed. Over the 18-week experiment, mean fertilizer N offtake of XCU and Duration 45 treated plots exceeded offtake from equal urea treatment (Table 2). At the greater N application rate, mean fertilizer N offtake of the Duration 90, Duration 120, and Polyon (43) treated plots exceeded that fostered by Nutralene treatment (Table 2).
Mean daily clipping yields from the Kentucky bluegrass field ranged from 0.2 to 0.8 lbs dry clippings / M-d regardless of initial treatment by 0.9 lbs N or 1.8 lbs N / M. However by 35 DAT, plots receiving the higher N rate treatment showed greater mean daily yields (Fig. 2).

6
MJ Schlossberg, RL Sebring, and KR Hivner – 2014 – PSU Center for Turfgrass Science
Fig. 3. Kentucky bluegrass field measures of (top) canopy normalized differential vegetative (NDVI) and dark
green color (DGCI) indices (bottom) by days after 0.9 lbs N / M treatment (DAT). Treatment means above error
bars extending upward from urea treatment (black ‘X’) indicate significantly higher mean canopy color (DGCI)
and/or density (NDVI) by Dunnett’s method at a 0.05-alpha level.
Days after treatment (DAT)
0 10 20 30 40 50 60 70 80 90 100 110 120 130
Canopy c
olo
r (D
GC
I units)
C
anopy d
ensity (
ND
VI units)
0.32
0.34
0.36
0.38
0.40
0.42
0.70
0.72
0.74
0.76
0.78
Urea
UMAXX
XCU
Duration 45
Control
Fertilizer treatments applied at 0.9 lbs N / M resulted in eleven (of 16) events where mean clipping yield(s) statistically exceeded that of plots equally-treated by urea (Fig. 2). The only 100% water soluble fertilizers evaluated were UMAXX and urea, and UMAXX fostered significantly greater mean daily yield than urea on the first, ninth, and fourteenth collections. The XCU treatment fostered significantly greater mean daily yield than urea on nine of the last fourteen collection events. The Duration 45 treatment showed significantly greater mean daily yield than urea on eight of the last thirteen yield collection event. No significant differences between urea and the other fertilizer treatments were observed on the last two clipping yield collections (Fig. 2), likely due to exhausted availability of the 0.9 lbs N applied 16 weeks earlier.
Fertilizer treatments applied at 1.8 lbs N / M resulted in twelve (of 16) events where clipping yield(s) exceeded that of Nutralene (Fig. 2). Clipping yields from plots treated by Duration 90, Duration 120, and Polyon (43) significantly exceeded Nutralene from 29 to 87 DAT (Fig. 2).
Canopy density and color measures of the Kentucky bluegrass field plots treated by 0.9 lbs N / M were highest the first month of the experiment (Fig. 3). While no treatment resulted in significantly higher experiment-wide canopy density than urea (Table 2), UMAXX and Duration 45 treatments fostered significantly higher canopy density measures than urea 58 and 87 DAT. By 90 DAT, fertilizer N imparted no influence on canopy density, as measured levels of treated and control plots converged to unity.
7
MJ Schlossberg, RL Sebring, and KR Hivner – 2014 – PSU Center for Turfgrass Science
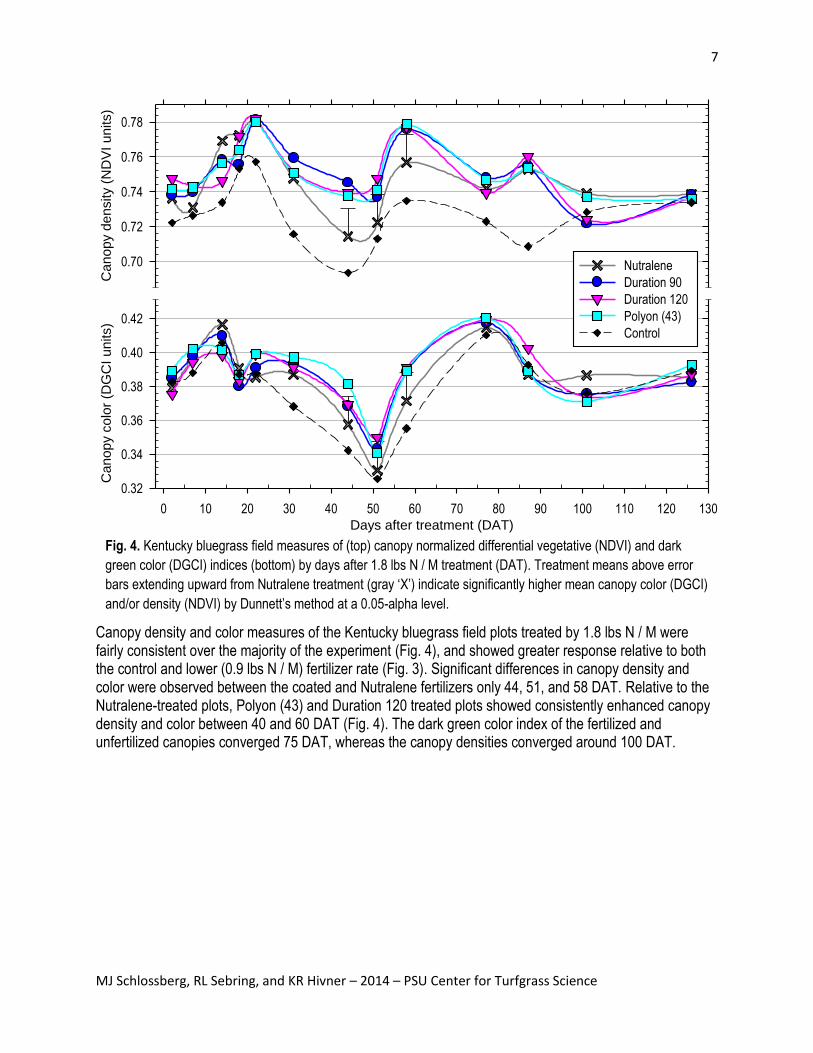
Fig. 4. Kentucky bluegrass field measures of (top) canopy normalized differential vegetative (NDVI) and dark
green color (DGCI) indices (bottom) by days after 1.8 lbs N / M treatment (DAT). Treatment means above error
bars extending upward from Nutralene treatment (gray ‘X’) indicate significantly higher mean canopy color (DGCI)
and/or density (NDVI) by Dunnett’s method at a 0.05-alpha level.
Days after treatment (DAT)
0 10 20 30 40 50 60 70 80 90 100 110 120 130
Canopy c
olo
r (D
GC
I units)
C
anopy d
ensity (
ND
VI units)
0.32
0.34
0.36
0.38
0.40
0.42
0.70
0.72
0.74
0.76
0.78
Nutralene
Duration 90
Duration 120
Polyon (43)
Control
Canopy density and color measures of the Kentucky bluegrass field plots treated by 1.8 lbs N / M were fairly consistent over the majority of the experiment (Fig. 4), and showed greater response relative to both the control and lower (0.9 lbs N / M) fertilizer rate (Fig. 3). Significant differences in canopy density and color were observed between the coated and Nutralene fertilizers only 44, 51, and 58 DAT. Relative to the Nutralene-treated plots, Polyon (43) and Duration 120 treated plots showed consistently enhanced canopy density and color between 40 and 60 DAT (Fig. 4). The dark green color index of the fertilized and unfertilized canopies converged 75 DAT, whereas the canopy densities converged around 100 DAT.

8
MJ Schlossberg, RL Sebring, and KR Hivner – 2014 – PSU Center for Turfgrass Science
In the spirit of simplification, consecutive weekly measures of fertilizer N offtake (lbs FN / M) were pooled by month after treatment (MAT) and standardized by original fertilizer N application as percent fertilizer nitrogen use efficiency, or %FNUE (Figs. 5 & 6). Pairwise mean separations of the reduced data, determined for both components of the significant ‘fertilizer by MAT’ interaction, are shown. Likewise, 31-day averages of daily mean temperature, calculated from experiment initiation rather than calendar months, are shown for each MAT in the topmost panel (Figs. 5 & 6).
The 0.9 lbs N / M applications of 100% water-soluble urea and UMAXX resulted in similarly-distributed %FNUE curves by MAT (Fig. 5). Each fertilizer treatment showed significantly greater %FNUE in Month 1 than in Month 2, and gradual declines in %FNUE over the remainder of the experiment. Furthermore, %FNUE of the two fertilizer treatments was statistically equivalent each MAT (Fig. 5). Yet at experiment end, a total of 15.9% more fertilizer N was recovered in clippings collected from UMAXX-treated than urea-treated plots (contrast P-value = 0.17).
The XCU fertilizer treatment showed significantly less %FNUE in Month 2 than Month 1, and again in Month 3 relative to Month 2 (Fig. 5). Observed levels of %FNUE between Month 3 and Month 4 were statistically equivalent. The gradually-decreasing 4-month nitrogen release pattern resulting from the XCU treatment is not dissimilar to that of the 100% water-soluble urea treatments, yet the recovery of N in Months 2 & 3 significantly exceeded that of urea. This delayed release of N in Month 3, relative to urea, distinguishes XCU as a controlled-release N fertilizer.
The 4-month nitrogen release pattern resulting from Duration 45 application was unique among the urea-based fertilizers applied at 0.9 lbs N / M (Fig. 5). Only 27% of the fertilizer N supplied by Duration 45 was recovered in Month 1, significantly lesser %FNUE than simultaneously observed of UMAXX or XCU. Yet recovery of Duration 45 fertilizer-N in Month 2 was statistically-equivalent to that observed the previous month, providing an 8-week period of metered N-release in support of turfgrass growth/vigor.
Likewise, the N-release observed in Month 2 significantly exceeded levels resulting from urea or UMAXX application. While monthly %FNUE of Duration 45 decreased significantly from Month 2 to Month 3 and again from Month 3 to Month 4, N recovery observed in Month 3 significantly exceeded levels resulting from urea or UMAXX application. Month 4 %FNUE levels of all 0.9 lbs N / M fertilizer applications were observed over a range of 3.6 to 11%, yet did not significantly differ by fertilizer treatment (Fig. 5). Given intensively-maintained hybrid Kentucky bluegrass requires 0.4 to 0.8 lbs N / M per growing month (Carrow et al., 2001), it seems safe to presume the 0.9 lbs N application was exhausted over the initial 3 months of the study. Of greater interest to managers is likely the 87% or 90% fertilizer N use efficiency observed over the 4-month period following a single application of XCU or Duration 45 respectively (Fig. 5).

9
MJ Schlossberg, RL Sebring, and KR Hivner – 2014 – PSU Center for Turfgrass Science
10
20
30
40
Month after treatment1 2 3 4
10
20
30
40
10
20
30
40
Fert
ilizer
N u
se e
ffic
iency (
% N
applie
d)
10
20
30
40
Duration 45: 86.8% Fert N Use Efficiency
XCU: 88.9% Fert N Use Efficiency
UMAXX: 68.8% Fert N Use Efficiency
Urea: 52.9% Fert N Use Efficiency
AB C C ns
A BC BC ns
A AB AB ns
B A A ns
*
*
**
* *
Month after treatment1 2 3 4
Mean a
ir tem
p. (F
)59
63
67
71
75
Fig. 5. Kentucky bluegrass field mean fertilizer N use efficiency (% fertilizer N applied) by months after 0.9 lbs N / M
treatment (MAT). All values adjusted for control plot offtake. For months 1-3, fertilizer treatment mean efficiencies
designated by common letters are not significantly different at a 0.05-alpha level. For each fertilizer treatment,
monthly mean efficiencies separated by a white asterisk are significantly different (alpha=0.05).
10
MJ Schlossberg, RL Sebring, and KR Hivner – 2014 – PSU Center for Turfgrass Science
Month after treatment1 2 3 4
Mean a
ir tem
p. (F
)59
63
67
71
75
10
20
30
40
10
20
30
40
10
20
30
40
Month after treatment1 2 3 4
Fert
ilizer
N u
se e
ffic
iency (
% N
applie
d)
10
20
30
40
Duration 90: 77.6% Fert N Use Efficiency
Duration 120: 76.3% Fert N Use Efficiency
Polyon (43): 76.2% Fert N Use Efficiency
A A B BC
* * *
* * *
* * *
B A B AB
C B A A
A C C C
Nutralene: 36.7% Fert N Use Efficiency
*
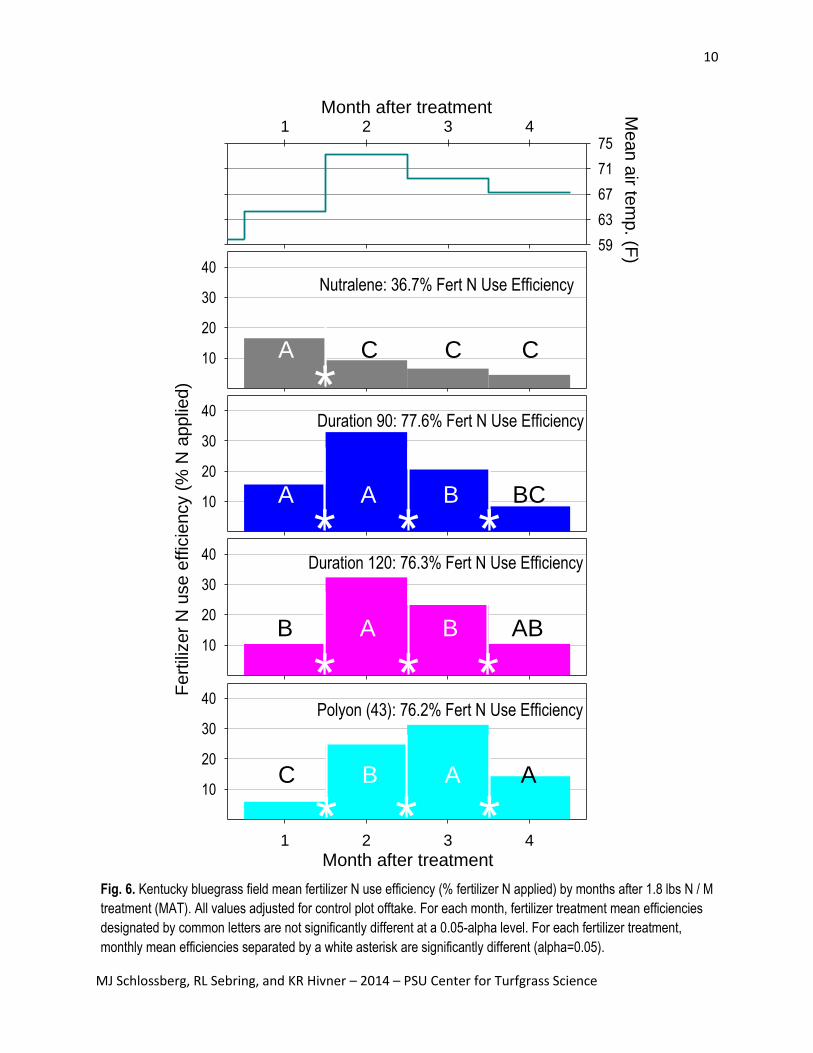
Fig. 6. Kentucky bluegrass field mean fertilizer N use efficiency (% fertilizer N applied) by months after 1.8 lbs N / M
treatment (MAT). All values adjusted for control plot offtake. For each month, fertilizer treatment mean efficiencies
designated by common letters are not significantly different at a 0.05-alpha level. For each fertilizer treatment,
monthly mean efficiencies separated by a white asterisk are significantly different (alpha=0.05).

11
MJ Schlossberg, RL Sebring, and KR Hivner – 2014 – PSU Center for Turfgrass Science
The 1.8 lbs N / M application of Nutralene resulted in a monthly %FNUE distribution not dissimilar from UMAXX or urea (Figs. 5 & 6). The Nutralene fertilizer treatment showed significantly greater %FNUE in Month 1 than in Month 2, and diminishing %FNUE over the remainder of the experimental period. This was not surprising considering the majority (65%) of Nutralene-N is comprised of urea and water-soluble methylene-urea chains. While Month 1 %FNUE resulting from Nutralene treatment was in the highest statistical grouping of fertilizers applied at 1.8 lbs N / M, its Month 1 %FNUE was a mere 16.5%. At experiment end, the total percentage of fertilizer N recovered in clippings collected from the Nutralene-treated plots was 36.7% (Fig. 6).
Distribution of %FNUE by month, following a 1.8 lbs N / M application, was similar for Duration 90 and Duration 120 fertilizers (Fig. 6). Both fertilizers were observed to release approximately one-third of their fertilizer N in Month 2 (32.4 to 32.9% FNUE), comprising the top statistical grouping among fertilizers applied at the high N rate. Each month these fertilizers showed a %FNUE statistically different from the month previous. Specifically, increasing %FNUE from Month 1 to Month 2, followed by diminished %FNUE from Month 2 to Month 3 and again from Month 3 to Month 4 (Fig. 6). Duration 90 and Duration 120 fertilizers also showed similar total %FNUE values at experiment end, 77.6 and 76.3% respectively. The primary difference between the Duration 90 and Duration 120 fertilizer-N availabilities was %FNUE observed in Month 1, 15.6 and 10.4% respectively. Relative to Nutralene, greater %FNUE from Duration 90 and Duration 120 was observed in both Months 2 and 3. Only Duration 120 showed significantly lesser %FNUE than Nutralene in Month 1, and significantly greater %FNUE than Nutralene in Month 4 (Fig. 6).
The 4-month nitrogen release pattern resulting from Polyon (43) application was unique among all 1.8 lbs N / M fertilizer treatments (Fig. 6). Over the experimental period, application of Polyon (43) fertilizer resulted in significantly different monthly %FNUE levels. Specifically, a consistent increase in %FNUE from Month 1 to Month 2 to Month 3, followed by a reduction in %FNUE from Month 3 to Month 4 (Fig. 6). Polyon (43) was the only fertilizer to release significantly more N from Month 2 to Month 3, indicating a controlled-release mechanism that may be governed more by time than temperature. While the %FNUE of Polyon (43) was significantly less than all fertilizers in Month 1, and less than Duration 90 and Duration 120 in Month 2, its %FNUE in Months 3 and 4 resided in the highest statistical grouping (Fig. 6). At experiment end, the total %FNUE from Polyon (43) treatment reached 76.2%; a level statistically-equivalent to that observed of Duration 90 and Duration 120, yet significantly greater than Nutralene. Summary and Conclusions The results of the described field experiment support the convention that, over a 7-week period following a one-time application, fully water-soluble N fertilizers do not foster consistent Kentucky bluegrass growth as effectively as controlled-release N fertilizers. Likewise, plant-availability of N delivered by 100% water-soluble N fertilizers is typically exhausted within 8 weeks of application; even on fine-textured, OM-rich soils. The described findings showcase both recent and notable advancements in granular N fertilizer controlled-release technology. Such technologies now afford turfgrass managers an array of granular fertilizers featuring 2- to 4-month nitrogen-release patterns.
Under the described conditions and application rates; and relative to traditional substrate-decay patterns demonstrated by stabilized- and/or methylene-urea fertilizers herein, the latest generation of coated urea-N fertilizers comprise unique and powerful tools in support of turfgrass management and culture. The described study is being repeated at Penn State University in Spring/Summer 2015. Detailed guidance on selection and use of the described fertilizers will be derived from results of the combined analysis, and published in early 2016.
12
MJ Schlossberg, RL Sebring, and KR Hivner – 2014 – PSU Center for Turfgrass Science
Acknowledgements The authors thank The Pennsylvania Turfgrass Council and Agrium Advanced Technologies for their support of this field research; and appreciate the technical assistance provided by Mr. Derek Pruyne, John Spargo, Thomas Bettle, Roy Knupp, and support personnel of the PSU Agricultural Analytical Services Laboratory (PSU–AASL). Disclaimer Trade and/or manufacturer’s names mentioned in this report are for information only and do not constitute endorsement, recommendation, or exclusion by the authors or the Pennsylvania State University. Above-mentioned turfgrass responses resulted from treatment applications to specific sites SOLELY AS DESCRIBED herein, and as allowed by regulations governing agronomic use of such materials. References Carrow, R.N., D.V. Waddington, and P.E. Rieke. 2001. Turfgrass Soil Fertility and Chemical Problems:
Assessment and Management. John Wiley & Sons, Inc. Hoboken, NJ, USA.
Hsu, J.C. 1992. The factor analytic approach to simultaneous inference in the general linear model. J. Comp. Graph. Stats. 1:151–168.
Karcher, D.E., and M.D. Richardson. 2003. Quantifying turfgrass color using digital image analysis. Crop Sci. 43:943–951.
Zhu, Q., M.J. Schlossberg, R.B. Bryant, and J.P. Schmidt. 2012. Creeping bentgrass putting green response to foliar nitrogen fertilization. Agron. J. 104:1589–1594.