nitrogen use efficiency of sugarbeet under tile … use efficiency of sugarbeet under tile-drained...
TRANSCRIPT
Nitrogen Use Efficiency of Sugarbeet under Tile-drained Condition
Amitava Chatterjee, R. Awale, H. Kandel, N. Cattanach Sugarbeet Soil Management, Soil Science, NDSU
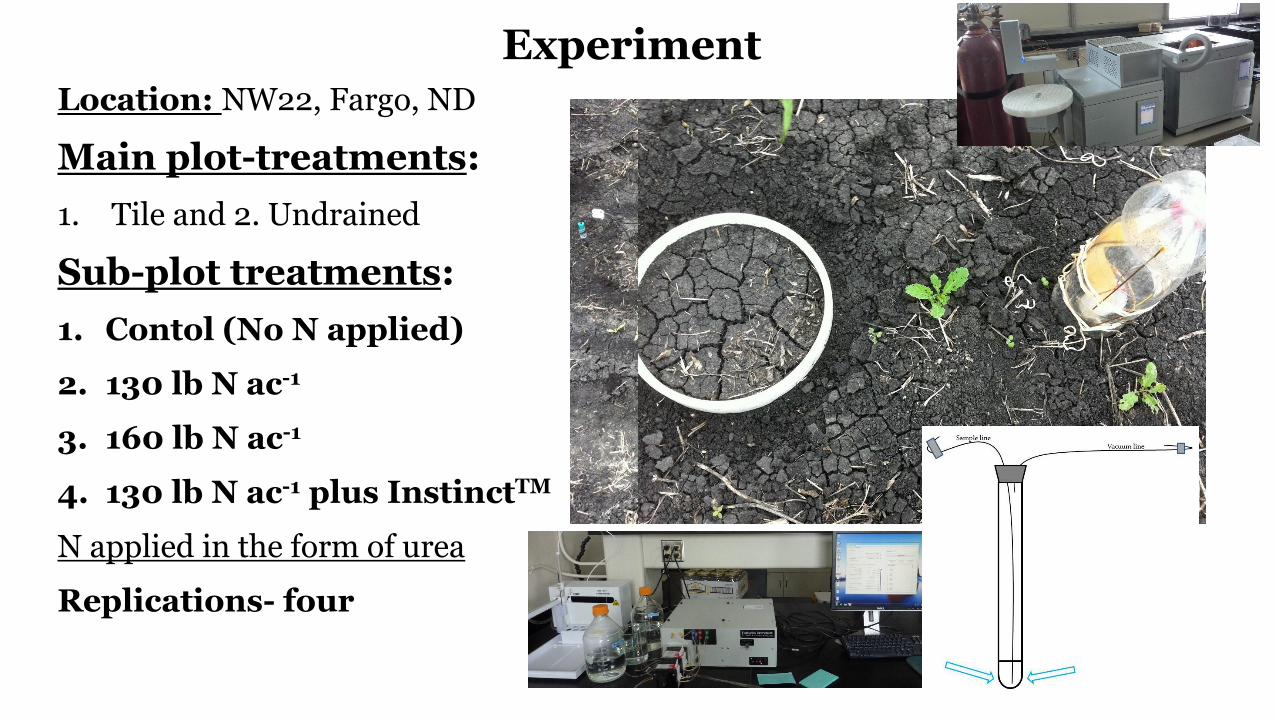
Location: NW22, Fargo, ND
Main plot-treatments:
1. Tile and 2. Undrained
Sub-plot treatments:
1. Contol (No N applied)
2. 130 lb N ac-1
3. 160 lb N ac-1
4. 130 lb N ac-1 plus InstinctTM
N applied in the form of urea
Replications- four
Experiment

Month
Precipitation (mm) Temperature (°C)
32-Year Growing seasons 32-Year Growing seasons
Average 2012 2013 Average 2012 2013
April 35 29 43 7 9 1
May 71 43 141 14 16 14
June 99 57 199 19 21 19
July 71 30 26 22 25 22
August 65 21 12 21 21 22
September 65 1 106 15 15 18
October 55 62 112 8 7 7
Total 461 244 641 †15 †16 †15
Weather during 2012-2013 Growing Season in Fargo, ND

2012
2013
Sugarbeet Yield and Quality did not Response to Fertilizer-N

Surface Soil N Availability Reduced under Drained but not Significantly
N-fertilizer’ †2012 2013
Undrained Drained
Control ǂ86 ± 26 c 88 ± 8 b 76 ± 21 c
130 lb N ac-1 182 ± 31 b 198 ± 19 a 157 ± 62 b
160 lb N ac-1 290 ± 47 a 304 ± 75 a 292 ± 36 a
130 lb N ha-1 + Instinct 249 ± 31 ab 214 ± 4 a 186 ± 30 b
LSD (P<0.10) 73 101 52
†Drainage effects in this year was not considered; ǂ Values are means ± standard errors (2012: n=8; 2013: n=4).

Soil Solution Nitrate Declined under Drained at 4’ depth
Capital letters indicate the significance level (0.05) of tile effect on nitrate leaching for the same N treatment Small letters indicate the significance level (0.05) of N-fertilizer effect on leaching for the same drainage
N-fertilizer Drainage
LSD (P<0.10) Undrained Drained
----Cumulative NO3-N (mg L-1)---
Control †138 ± 42 b 112 ± 11 c n.s.
130 lb N ac-1 379 ± 39 aA 203 ± 61 bB 116
160 lb N ac-1 343 ± 83 a 229 ± 40 ab n.s.
130 lb N ha-1 + Instinct 423 ± 151 a 327 ± 12 a n.s.
LSD (P<0.10) 198 103 -

Winter Spring Summer Fall
Frozen soil
Vulnerable Leaching period
Annual Crop Soil Nitrogen
Utilization Rate
Relative Monthly Precipitation Pattern
(Adapted from Power et al. 1998, Dinnes et al. 2002)
Vulnerable Period of Leaching Loss

b
b
a a a
a
0.0
0.4
0.8
1.2
1.6
2.0
Undrained Drained
Cu
mu
lati
ve
NH
3-N
loss
(k
g/h
a)
Drainage management
Control 146 kg/ha 180 kg/ha
Higher fertilizer-N Increased Volatilization-N Loss
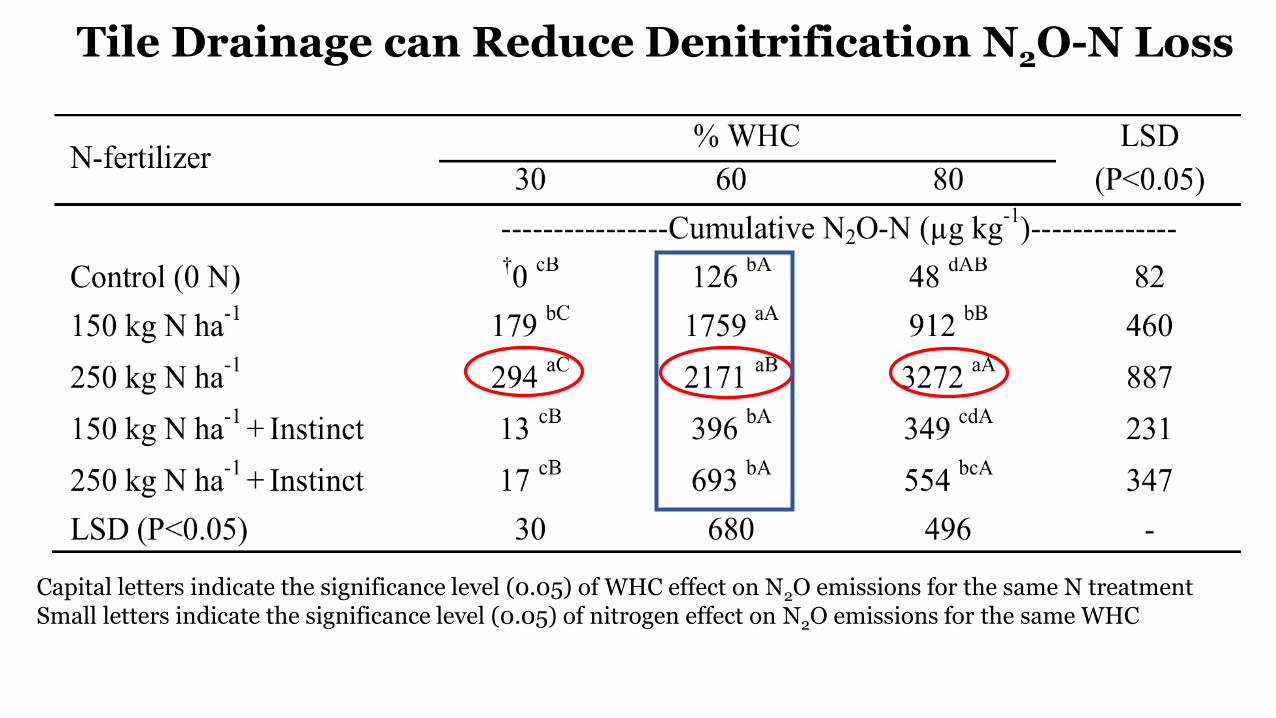
Tile Drainage can Reduce Denitrification N2O-N Loss
Capital letters indicate the significance level (0.05) of WHC effect on N2O emissions for the same N treatment Small letters indicate the significance level (0.05) of nitrogen effect on N2O emissions for the same WHC

10.0
13.4 13.3 13.4
19.9 15.0
23.1
18.3
24.2
17.3
35.6
28.7
17.1 16.4
24.3
28.3
0
10
20
30
40
50
60
35 42 54 73
N2O
-N (
g h
a-1
d-1
)
Days after N-application
Control
146 kg/ha N
180 kg/ha N
146 kg/ha N + Instinct
High N-fertilizer Rate may Increase Denitrification Loss
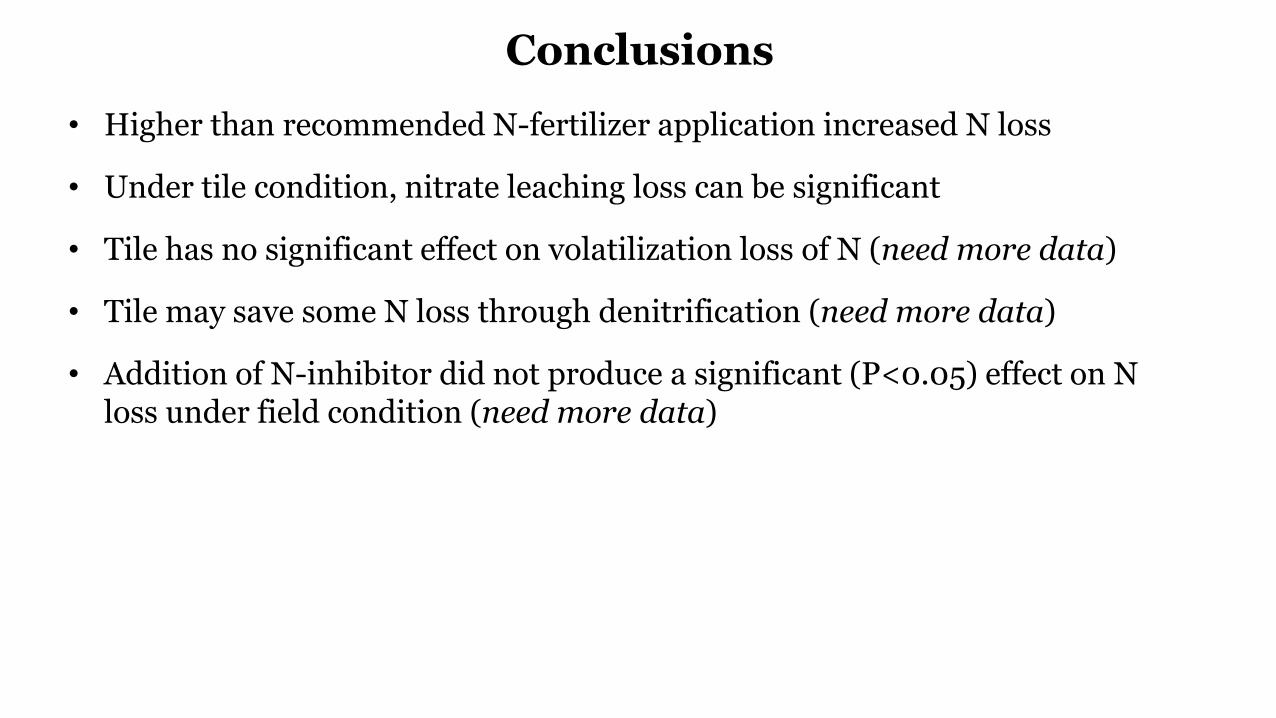
Conclusions
• Higher than recommended N-fertilizer application increased N loss
• Under tile condition, nitrate leaching loss can be significant
• Tile has no significant effect on volatilization loss of N (need more data)
• Tile may save some N loss through denitrification (need more data)
• Addition of N-inhibitor did not produce a significant (P<0.05) effect on N loss under field condition (need more data)
Potassium (K) Response in Corn
Amitava Chatterjee, M. Rakkar, D. Franzen Sugarbeet Soil Management, Soil Science, NDSU
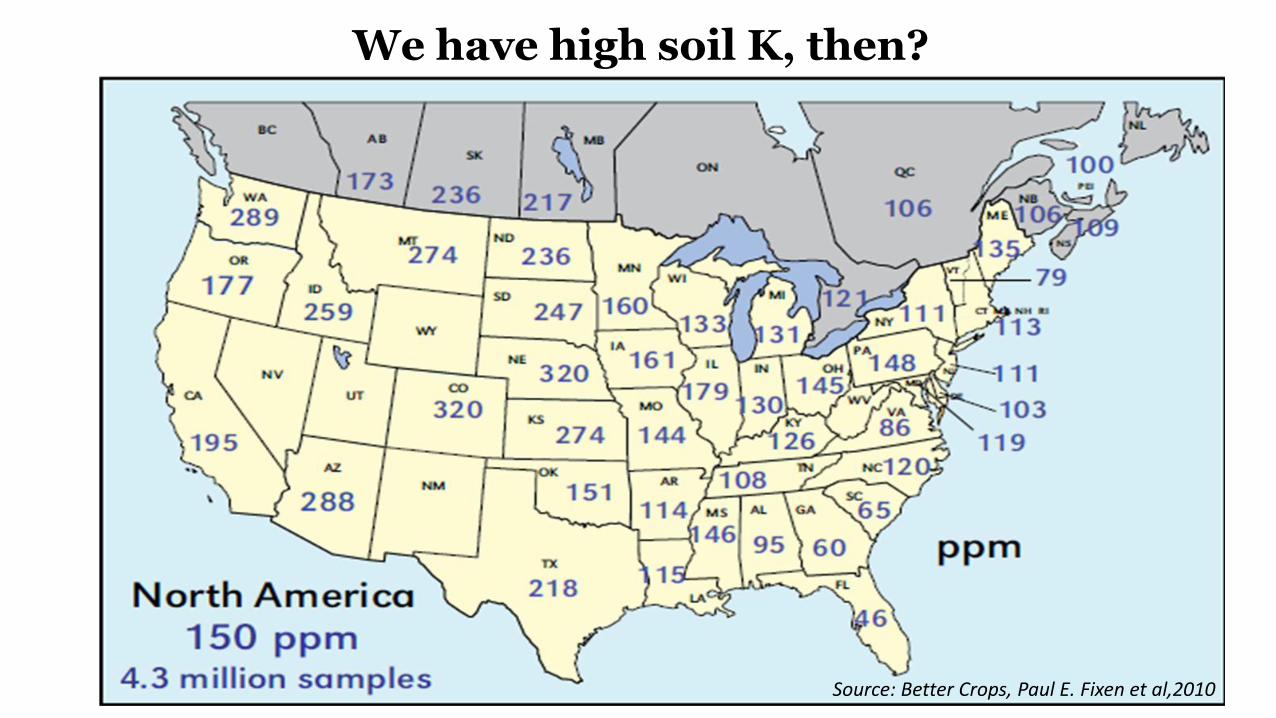
We have high soil K, then?
Source: Better Crops, Paul E. Fixen et al,2010
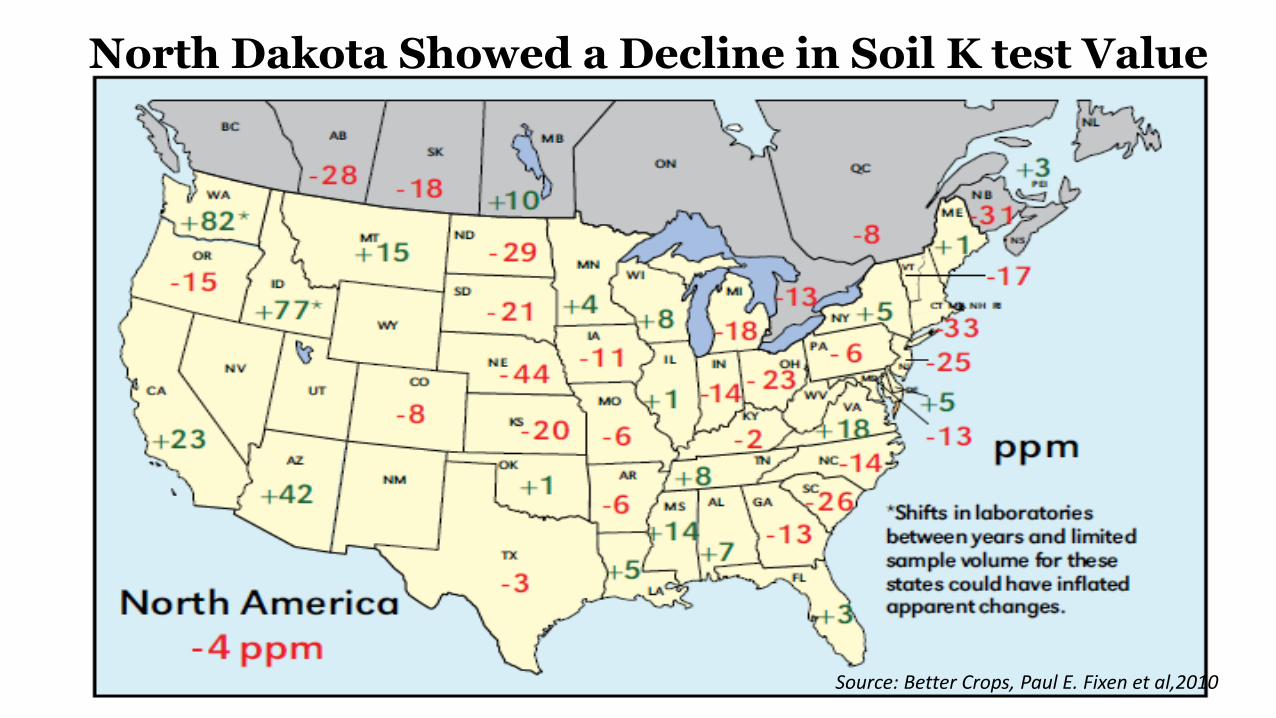
North Dakota Showed a Decline in Soil K test Value
Source: Better Crops, Paul E. Fixen et al,2010

‘Dry Test Overestimates Soil K’ – may be linked with the decline in Soil K over time
0
50
100
150
200
250
Ada Valley Gardner (1) Gardner(2)
K (
pp
m)
Field - moist
Air - dried
Dry soil K Content = 1.8 (Moist Soil K content)

Deficiency Symptoms in Experimental Plots
Ada Gardner Valley City
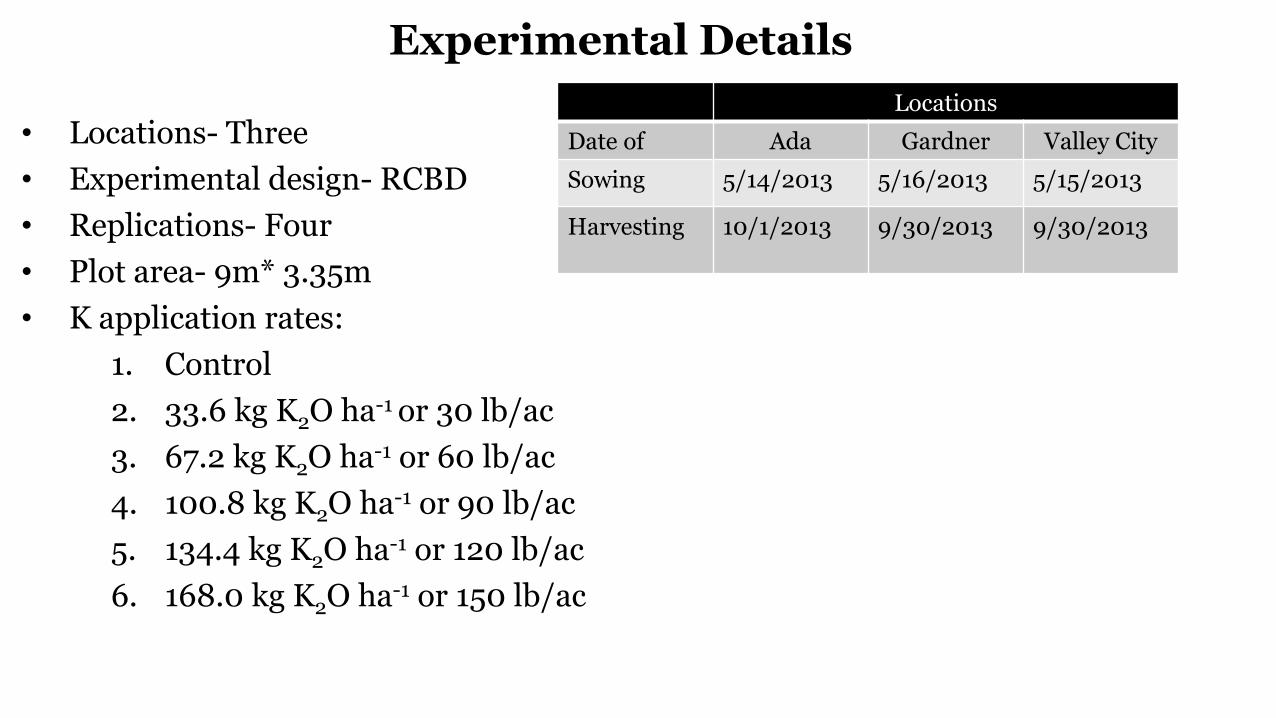
Experimental Details
Locations
Date of Ada Gardner Valley City
Sowing 5/14/2013 5/16/2013 5/15/2013
Harvesting 10/1/2013 9/30/2013 9/30/2013
• Locations- Three
• Experimental design- RCBD
• Replications- Four
• Plot area- 9m* 3.35m
• K application rates:
1. Control
2. 33.6 kg K2O ha-1 or 30 lb/ac
3. 67.2 kg K2O ha-1 or 60 lb/ac
4. 100.8 kg K2O ha-1 or 90 lb/ac
5. 134.4 kg K2O ha-1 or 120 lb/ac
6. 168.0 kg K2O ha-1 or 150 lb/ac

40.4C BC AB AB
A 65.7A
0
20
40
60
80
100
120
140
0 30 60 90 120 150
Co
rn
yie
ld (
Bu
/ac
)
Ada
106
111 110
117
0 30 60 90 120 150
Valley City
52 50 51 46 47 51
0 30 60 90 120 150
Fert-K (lb/ac)
Gardner
Corn-K Yield Response Limited to Only Ada, MN
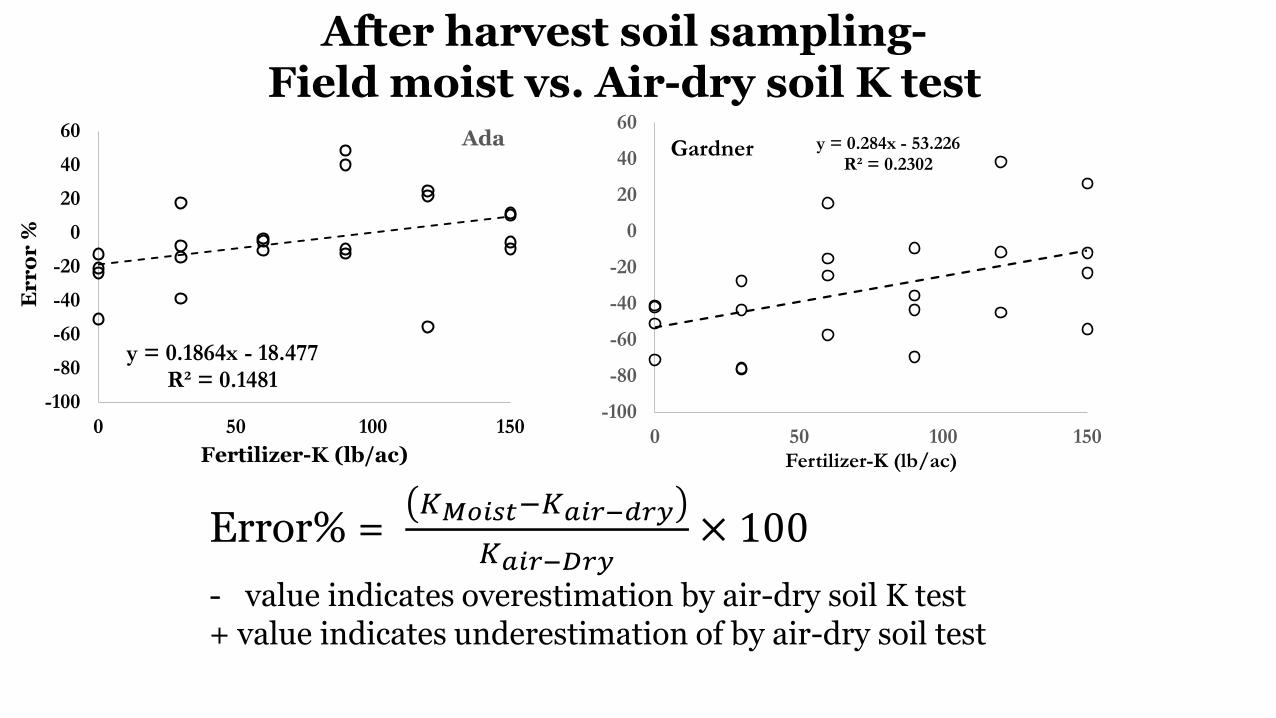
Error% = 𝐾𝑀𝑜𝑖𝑠𝑡−𝐾𝑎𝑖𝑟−𝑑𝑟𝑦
𝐾𝑎𝑖𝑟−𝐷𝑟𝑦× 100
- value indicates overestimation by air-dry soil K test + value indicates underestimation of by air-dry soil test
After harvest soil sampling- Field moist vs. Air-dry soil K test
y = 0.1864x - 18.477 R² = 0.1481
-100
-80
-60
-40
-20
0
20
40
60
0 50 100 150
Er
ro
r %
Fertilizer-K (lb/ac)
Ada y = 0.284x - 53.226 R² = 0.2302
-100
-80
-60
-40
-20
0
20
40
60
0 50 100 150Fertilizer-K (lb/ac)
Gardner

Conclusion
Corn K recommendation needs to be updated based on soil K test.
Soil sample moisture has significant influence on K test.
Need more data (location, year, soil type)!