nitrous oxide emissions from a fertile grassland in
TRANSCRIPT
ORIGINAL ARTICLE
Nitrous oxide emissions from a fertile grassland in WesternNorway following the application of inorganic and organicfertilizers
Sissel Hansen • Marie-Eve Bernard •
Phillipe Rochette • Joann K. Whalen •
Peter Dorsch
Received: 28 July 2013 / Accepted: 2 January 2014 / Published online: 14 January 2014
� Springer Science+Business Media Dordrecht 2014
Abstract In Norway, 65 % of the agricultural land is
under grassland for feeding ruminants. The objective of
the present study was to quantify N2O emissions from
grassland on a fertile sandy loam in Western Norway,
and to estimate the response of seasonal N2O emissions
to added inorganic N, cattle slurry (CS) N and clover N.
Ammonium nitrate (AN) and CS were applied manually
at annual rates of 0, 100, 150, 200 and 250 kg AN-
N ha-1, 80 kg CS-N ha-1 or as a combination of
200 kg AN-N ha-1 and 80 kg CS-N ha-1. Background
N2O emissions were five times higher in summer season
2009 than in 2010, but the relative amount of N2O
derived from AN was constant in both periods,
amounting to 0.11 % of applied N. CS had no measur-
able impact on N2O emissions in 2009, but 0.15 % of
CS-N was emitted as N2O during summer 2010. In the
warm year of 2009, which included a drought period,
1–24 % of the N2O emissions were attributed to the
effect of clover depending on fertilization. Clover had
no effect on N2O fluxes in the cool and moist year 2010.
Our results suggest that N2O emissions in fertile
Norwegian grasslands are to a great extent controlled
by inter-annual variations in background emissions and
variable contribution of biologically fixed N and CS-N.
Keywords N2O � Background emission �Emission intensity � Ammonium nitrate �Cattle slurry � Clover
Introduction
Grasslands cover 22 % of agricultural land in Europe
(Soussana et al. 2007) and differ widely in manage-
ment, ranging from extensive cultivation with no
Electronic supplementary material The online version ofthis article (doi:10.1007/s10705-014-9597-x) contains supple-mentary material, which is available to authorized users.
S. Hansen (&)
Organic Food and Farming Division, Bioforsk, Norwegian
Institute for Agricultural and Environmental Research,
6630 Tingvoll, Norway
e-mail: [email protected]
M.-E. Bernard � P. Rochette
Crops and Soil Research and Development Centre,
Agriculture and Agri-Food Canada, 2560 Hochelaga
Blvd, Quebec, QC G1V 2J3, Canada
e-mail: [email protected]
P. Rochette
e-mail: [email protected]
M.-E. Bernard � J. K. Whalen
Department of Natural Resource Sciences, McGill
University, Macdonald Campus, 21 111 Lakeshore Road,
Ste-Anne-de-Bellevue, QC H9X 3V9, Canada
e-mail: [email protected]
P. Dorsch
Institute for Environmental Sciences, Norwegian
University of Life Sciences, 1432 As, Norway
e-mail: [email protected]; [email protected]
123
Nutr Cycl Agroecosyst (2014) 98:71–85
DOI 10.1007/s10705-014-9597-x
reseeding and fertilization to intensive cultivation with
regular fertilizer inputs, irrigation and periodic
ploughing and reseeding. In Norway, 65 % of the
agricultural land is under grassland production for
feeding cows and sheep. Along the West coast of
Norway, where grass is the dominant crop, precipita-
tion is often high, summers are cool, and animal
husbandry is dense. Animal manures (liquid or solid)
are commonly returned to the fields, in addition to
NPK fertilizer at total rates of up to 300 kg N ha-1
year-1. Reported N2O emissions in temperate grass-
land in Europe range from 0 to 51 kg N2O-N ha-1-
year-1 (Clayton et al. 1997; Jones et al. 2005; Flechard
et al. 2007; Kim et al. 2010; Rees et al. 2013). This
large variation appears to be related to site-specific
differences in soil inorganic N content and aeration
(e.g. Clayton et al. 1997; Smith et al. 2012; Rees et al.
2013), which, in turn, are heavily influenced by soil
type, local climate and farm management.
Emissions of N2O increase with increasing N fertil-
ization rates in agricultural soils (arable and grasslands;
Bouwman 1996; Roelandt et al. 2005; Stehfest and
Bouwman 2006). However, quantifying fertilizer-
induced emissions (FIE) in mixed-species grasslands is
complicated by a long growing period, absence of annual
tillage, high internal N cycling with carry over between
years, and the difficulty to quantify the contribution of
biological nitrogen fixation. In particular, large varia-
tions in background emissions were reported in mixed
swards containing legumes (Rees et al. 2013). The only
study carried out on a grassland in Western Norway
reported high N2O emissions after fertilization, with
highest rates in compacted soil (Sitaula et al. 2000). No
whole-growing season study on N2O emissions has been
reported for Norwegian grasslands.
Nitrous oxide emissions from grasslands are often
reported as N2O-N loss per area or as percentage of N
applied, without taking account of the magnitude and
quality of the commodity produced. Because there is a
need to minimize the emission per produced unit, N2O
emissions from forage production should also be
expressed as a function of dry matter (DM) yield or
foliar N-content (emission intensity, N2O emitted as a
portion of N-uptake by the above-ground crop). Schils
et al. (2008) reported emission intensities of 0.29 % for
a grass sward on a sandy soil that was fertilized with
calcium ammonium nitrate (CAN) and cattle slurry
(CS), and 0.17 % when CAN was the only fertilizer.
This was substantially lower than the emission
intensities of 0.8–1.5 % of total N accumulated in the
above ground biomass calculated for arable crops
(maize, wheat, potato, onion, rice) based on 19 studies
summarized by Van Groenigen et al. (2010). Per date, it
is not known whether grasslands have systematically
lower emission intensities than arable crops, and how
they are influenced by edaphic and management factors.
The objectives of the present study were (1) to
quantify N2O emissions in a fertile grassland in
Western Norway, (2) to partition total emissions
between background and emissions induced by N
additions [ammonium nitrate (AN) and/or CS and
biologically fixed clover N (BfcN)], and (3) to
estimate the N2O emission intensity of the grassland.
Materials and methods
Site description
The experiment was conducted in a managed grassland
in its 4th and 5th year (in 2009 and 2010) situated on a
south-facing slope (6 % inclination) at Tingvoll
(62�5404200N, 08�1202400E, elevation 27 m asl), Wes-
tern Norway. The long-term annual mean precipitation
(1961–1990) is 1,160 mm and the mean daily air
temperatures (1995–2009) is 1 �C in January and
15 �C in July. The atmospheric deposition of N in the
region is \0.3 g N m2 year-1 (Aas et al. 2012). The
soil is a well-structured sandy-loam overlaying a dense
layer of marine clay, classified as a Haplic Stagnosol
(Ruptic) (WRB 2006). Soil texture and relevant
chemical and physical properties are given in Table 1.
The field has been under grassland for more than
20 years, harvested twice a year, ploughed and resee-
ded every 5–6 years. The ley consisted of grass, clover
and dicotyledonous weeds (mainly dandelion, Tarax-
acum officinale). The dominant grass species were
smooth meadow-grass (Poa pratensis), meadow fes-
cue (Festuca pratensis) and timothy (Phleum pra-
tense). Clovers were white (Trifolium repens) and red
clover (Trifolium pratense), with large heterogeneity
in coverage (Supplementary material, Table S1). There
was no tractor traffic on the field during the experiment.
Treatments
The field experiment followed a completely random-
ized block design with seven N application rates
72 Nutr Cycl Agroecosyst (2014) 98:71–85
123
replicated four times in 2 9 8 m plots. Fertilizer
treatments are given as total kg N added as NH4NO3
(AN) in or/and CS per ha and year. AN alone was
applied in treatments 100AN, 150AN, 200AN and
250AN, CS alone in the treatment 80CS (75 kg total
N ha-1 in 2009 and 80 kg total N ha-1 in 2010), and
AN and CS together in the treatment 280ANCS
(200 kg N ha-1 as AN both years plus 75 kg total
N ha-1 in CS in 2009 and 80 kg total N ha-1 in 2010).
Fertilizers were broadcast manually on the surface of
the plots. One treatment remained unfertilized as a
zero-N control (0N).
Cattle slurry was applied once in spring (April 22nd
2009 and April 29th, 2010), diluted with water to
200 % of the original volume to facilitate spreading by
can with a spreading plate (In total 5 dm3 m-2). The
CS was obtained from a local farm and contained, on
average, 6.8 % DM, 3.1 g kg-1 of N, 1.9 g kg-1
NH4-N, 0.34 g kg-1 P, 4.0 g kg-1 of K, and had a
C:N ratio of 23.5 at the time of application. The AN
was spread by hand and the application was split, with
60 % applied in spring (April 22nd 2009 and May 10th
2010) and 40 % after first harvest (June 19th 2009 and
June 28th 2010). The AN was applied as a mixed
fertilizer containing 22-2-12 (NPK) in 2009 and 25-2-
6 in 2010. The water provided by CS was not
compensated for in the other treatments. However,
the CS application did not significantly affect soil
moisture content in 0–20 cm depth (Fisher t test, data
not shown).
Ancillary variables
Hourly air temperature was monitored continuously in
the field and rainfall was measured daily at a weather
station on an adjacent field 600 m away from the trial
(Table 2). Air temperature in the chambers used for
gas flux sampling were monitored every minute using
a data logger (USB-500, MCC, Norton, MA, USA)
placed in one of the closed chambers.
Flux sampling and calculations
Soil N2O flux was measured using static chambers
adapted from Rochette and Bertrand (2008). In spring
2009, one aluminium frame (52 9 52 9 25 cm) per
plot was inserted to a depth of 10–12 cm. The frames
had a groove filled with water to ensure air-tight
connection with 20-cm high vented aluminium cham-
ber. An extra frame (55 9 55 9 33 cm) was added
when the grasses were taller than 25 cm. A 16-mL air
sample was taken from the chamber headspace at
regular intervals (0, 15, 30, 45 min), using a 20-mL
air-tight polypropylene syringe. The samples were
injected into pre-evacuated 12-mL glass vials, (Model
10-CV-Crimp, Chromacol, Herts, UK) and analyzed
by a gas chromatograph (GC) (Model 7890A, Agilent,
Santa Clara, CA, US), using a 20-m wide-bore
Poraplot Q (0.53 mm) column at 38 �C with backflu-
shing and He as carrier gas. The electron captor
detector (ECD) conditions were 375 �C with
17 mL min-1 ArCH4 (90/10 %vol) as makeup gas.
Soil-surface N2O fluxes were measured weekly
during the snow free period from April 2009 to the end
of August 2010. The first 2 weeks after fertilizer
applications, flux measurements were carried out
every fourth day. Soil surface N2O fluxes (lg N2O-
N m-2 h-1) were calculated according to Rochette
and Hutchinson (2005):
FN2O ¼dCN2O
dt� VC
A�Mm
Vm
ð1Þ
where dCN2O (ppm N2O h-1) is the rate of change in
gas concentration in the chamber headspace, Vc is the
chamber volume (L), A is the surface area covered by
the chamber (m2), Mm is the molecular weight of N in
Table 1 Soil texture and physico-chemical properties at the
study site in a fertile grassland in Tingvoll, Norway
Texturea and chemical properties (0–20 cm)
Sand (g kg-1) 710
Clay (g kg-1) 70
Silt (g kg-1) 210
Soil pHb 5.8
Soil C (mg g-1) 44
Physical properties (7–11 cm ± SD, n = 6)
Soil bulk density (g cm-3) 1.1 ± 0.1
Soil porosity (% vol) 59 ± 4
WFPS at field capacity (%) 52 ± 7
Air permeability (lm2) 19 ± 8
a Soil texture was analysed according to Stokes law of the
sedimentation of spherical particles as described ‘by (Elonen
1971)b Soil pH was measured on samples taken in spring and
summer of 2009 and 2010 and in the autumn of 2009 (1:2
soil:distilled water)
Nutr Cycl Agroecosyst (2014) 98:71–85 73
123
N2O (28 g N mol-1) and Vm is the molecular volume
of the gas at the average temperature during chamber
deployment (L mol-1).
Calculations of cumulative N2O losses, FIE
and estimates of BfcN
Cumulative N2O losses (g N2O-N ha-1) were calcu-
lated by linear interpolation for the following selected
periods: ‘‘early spring’’ (before AN fertilization; 2010
only), ‘‘spring’’ (from AN fertilization until 1st
harvest), ‘‘summer’’ (from 1st harvest to 2nd harvest),
‘‘fall’’ (from 2st harvest to 3rd harvest; 2009 only) and
‘‘late fall’’ (after 3rd harvest; 2009 only). The summer
season was defined as the sum of spring and summer
periods. Because of cooler weather in 2010, the plots
were fertilized and harvested later than in 2009,
resulting in slightly different observation periods
between the years. The periods are shown in the
footnote of Table 4.
Fertilizer-induced emissions were calculated for
every period as the slope of the linear relationship
between total N applied and cumulative N2O-N emit-
ted. The impact of N applied as NH4NO3 (FIEAN), cattle
slurry (FIECS) and non-harvested biologically fixed
clover N (FIEBfcN) was estimated by multiple linear
regression of the overall N2O emission response and the
respective N amounts applied (Eq. 2). Background
emission is given as the intercept of the regression.
Y ¼ z þ x1AN þ x2CS þ x3BfcN ð2Þ
where Y = g N2O-N ha-1 emitted in the given
period, Z = g N2O-N ha-1 background emission,
X1,2,3 = g N2O-N ha-1 emitted per kg N applied as
AN, CS or non-harvested, biologically fixed clover
nitrogen (BfcN) in the previous period ha-1. No
correction was made for NH3 volatilization.
Biologically fixed clover nitrogen was estimated for
each period from measured clover DM and N content
according to Høgh-Jensen et al. (2004) using Eq. 3:
BfcN ¼ DMclover � N% � Pfix
� 1þ Prootþstubble þ Ptranssoil þ Pimmobileð Þð3Þ
where DMclover is the harvested clover DM in Mg DM
ha-1, N % the average N concentration in clover in
percent of dry weight (n = 4), Pfix the proportion of N
in the shoot DM of clover that is fixed from the
atmosphere in percent, Proot?stubble the fixed N2 in the
root and stubble, Ptrans soil the below-ground transfer of
BfcN to grasses, and Pimmobile the BfcN immobilized
in soil. The proportion of non-harvested N from BfcN
was assumed to be 55 % of aboveground BfcN where
Proot?stubble, Ptrans soil and Pimmobile were assumed to
amount to 25, 5 and 25 %, respectively. DMclover was
measured in all treatments in both years, whereas data
for N % in DM (3.8 % N for 1st harvest and 3.4 % N
for later harvests) were only available for 2010. We
assumed the same N concentration in DMclover in 2009
and 2010 based on results from a related field trial at
the same site, which found similar N contents in clover
2009 and 2010 (unpublished data). Pfix was assumed to
be 80 % for treatments fertilized with more than
100 kg N (150AN, 200AN, 250AN and 280ANCS)
and 95 % for the rest. The high level of assumed Pfix in
plots receiving low N inputs was based on the low
level of soil mineral nitrogen for these treatments
(Fig. 1), and the work of Carlsson et. al (2009), who
observed that in a mixed grass-clover sward, the
grasses take up N more efficiently than clover,
resulting in higher Pfix than in monoculture. In grass-
clover mixtures, N-fertilization will decrease the
proportion of clover before Pfix will be reduced, as
observed by many authors (e.g. Nesheim and Øyen
1994). Our assumption that Pfix was not affected at the
lowest fertilization levels, is supported by the findings
of Oberson et al. (2013) who observed that N input of
up to 150 kg N ha-1 did not affect Pfix. Of the
available field trials that investigated Pfix in a grass
clover sward, the field at Vagønes (Nesheim and Øyen
1994) was the one with climatic conditions closest to
our site. They reported a Pfix of 95 % at the lowest
fertilization levels.
Since values for Pfix, Proot?stubble, Ptrans soil and
Pimmobile were based on literature values, our estimates
of BfcN are inherently uncertain. We therefore
estimated the effect of clover on N2O emissions both
based on percentage of clover at the end of the growth
period (Supplementary material, Table S4), and based
on the amount of non-harvested BfcN calculated for
the previous growth period (Eq. 3, Table 5). The
percentage of clover is given in Table S1 and non-
harvested BfcN in Table S3. The data is split into
periods in the regression analyses, so that the 2 years
can be compared. We assumed that most of BfcN was
released after the sward was cut, because N release is
enhanced when the plant is cut, and only a small
74 Nutr Cycl Agroecosyst (2014) 98:71–85
123
amount of N is released from fresh residue (Carter and
Ambus 2006). BfcN was not included in the regression
analysis for early spring 2010, assuming that biolog-
ical fixation was negligible in early spring before
fertilization, and that no carry over of N from BfcN
from the previous year occurred. For the spring
periods (from 1st AN fertilization until 1st harvest),
the non-harvested BfcN in the same period was used.
Regression analyses based on clover % showed no
effect of clover on N2O emissions neither in early
spring 2010 nor in the periods from spring until 1st
harvest in 2009 and 2010 (Table S4).
Harvest method and analysis
Above-ground biomass was harvested manually three
times in 2009 (10 June, 4 August, 18th September) and
twice in 2010 (23 June, 18 August) from both a 5 m2
sub-plot and from inside each permanent frame used
for N2O flux measurements. Sub-samples were dried
at 60 �C to obtain DM yield. The botanical compo-
sition (grass, legumes and weeds) was determined for
each plot by hand-sorting freshly harvested samples.
For each harvest in 2010, the N content in grass
samples from the permanent frame was determined for
two replicates of each treatment using a ThermoFinn-
igan Flash EA 1112 CN analyzer (Carlo Erba, Milan,
Italy).
Soil sampling and analysis
Soil samples (0–20 cm) were collected at every gas
sampling date. In 2009, all soil samples from the same
treatment were pooled before the analysis. In 2010,
one sample per plot and gas sampling date was
analysed. Gravimetric soil moisture content (u, g
water g soil-1) was determined by drying 60 g fresh
soil at 105 �C for 24 h.
Water filled pore space was calculated as:
WFPS %ð Þ ¼ u � BDð Þ = 1� BD=PDð Þð Þ ð4Þ
where BD is the bulk density (Mg m-3), and PD is the
particle density (Mg m-3) calculated as
2.66–0.014 * ignition loss (Riley 1996).
Bulk density, soil porosity and air permeability,
reported in Table 1, were determined in undisturbed
100 mL cylinders cores taken at 7–10 cm depth on 11
June 2009 shortly after 1st harvest (n = 6) and on 19
August 2010, shortly after second harvest (n = 12).
Soil porosity was calculated from the ratio of bulk
density (BD) and estimated particle density (PD). Air
permeability was measured at -10 kPa tension
(assumed field capacity), as described by (Green and
Fordham 1975).
Soil mineral N (NH4?, NO3
-) was extracted using
2 M KCl (1:2.5 field moist soil:KCl). Extracts were
stored at -20 �C until analysis by automated color-
imetry (Model QuickChem 8000 FIA?, Lachat
Instruments Ltd, Loveland, CO, USA).
Data treatment and statistical analysis
After log-transformation (y = log10(x ? 10)), mea-
sured N2O fluxes were analysed by repeated-measures
ANOVA using PROC GLM method of SAS (version
9.2, SAS statistical software, Cary, NC, USA) to test for
differences between treatment and sampling dates.
Multiple linear regression was used to estimate the
effect of applied N as NH4NO3, cattle slurry or BfcN on
cumulative N2O emissions for each growth period (for
details, see chapter 2.5). As the cumulative N2O
emissions and DM yields were normally distributed,
no log-transformation was applied to these data. The
relationship between N2O flux and soil parameters
(mineral-N (NH4-N, NO3-N), precipitation, air tem-
perature and WFPS) was analysed by Pearson’s corre-
lation using PROC CORR method (SAS). Treatment
means were compared using an LSD test at a = 0.05.
Differences in soil mineral N in 2010 were analyzed by
ANOVA using PROC GLM method in SAS.
Results and discussion
Environmental conditions
Mean daily temperatures from April to September ranged
from 4 to 23 �C in 2009 (Fig. 1d) and from -12 to 20 �C
in 2010 (Fig. 2d), on average 2.9 �C warmer in the 2009
growing season than in 2010. Likewise, the average daily
temperature in 2009 was higher than the long-term
average (11 �C), measured at the Tingvoll weather
station (Table 2). Spring came earlier than usual in
2009, whereas there was a late snowfall (2 cm) that
covered the field from May 2–4 in 2010. In 2009, there
was a water deficit (evaporation minus precipitation)
during the summer because of high evaporation and
limited precipitation (Fig. 1), whereas in the summer of
Nutr Cycl Agroecosyst (2014) 98:71–85 75
123
2010, water was in excess. This resulted in greater water-
filled pore space (WFPS) values in 2010 (50–70 %) as
compared with those in 2009 (20–57 %) (Figs. 1d, 2d).
The winter preceding the 2009 growing season was
mild and short with average monthly air temperatures
during the period December to March of 0.5, 1.4, -1.0
and 3.6 �C. In contrast, the winter preceding the 2010
growing season was colder with average monthly air
temperatures of -0.3, -4.4, -5.0 and 1.0 �C during
the same period.
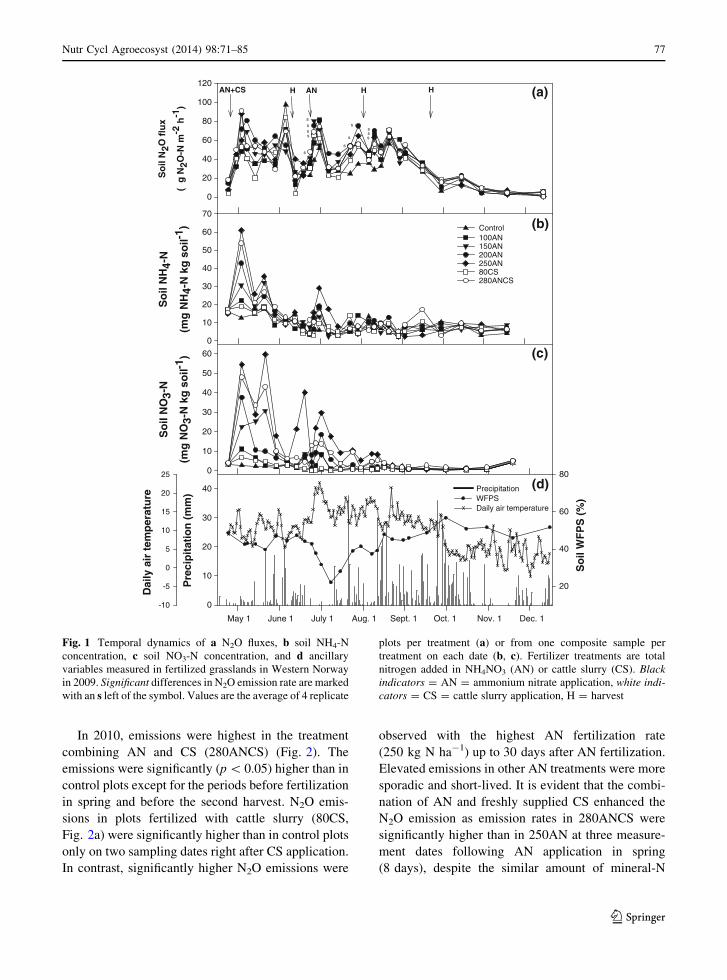
N2O flux rates
In 2009, N2O flux rates in the control plots (0N) varied
from slightly negative values to 97 ± 15 (SE) lg
N2O-N m-2 h-1. At one occasion (5th June 2009), the
control treatment even had higher N2O emissions than
the fertilized treatments. However, this was not
significant, and at all other measurement dates, N2O
emissions from the control plots are at the lower range
of values or the lowest value.
Flux dynamics were characterized by short transient
peaks during summer, while rates levelled off to values
around 20 lg N2O-N m-2 h-1 in the period Sept.–Oct.
(Fig. 1a). The N2O emission rates measured in the
unfertilized grassland during summer 2009 are greater
than those reported in many other studies (Clayton et al.
1997; Glatzel and Stahr 2001; Tilsner et al. 2003) but of
the same magnitude as rates measured in intensively
managed grassland by Chadwick et al. 2000 (up to
100 lg N2O-N m-2 h-1).
In 2010, N2O emission rates in the control plots
(0–14 ± 2 lg N m-2 h-1) were one order of magni-
tude smaller than in 2009 and no pronounced N2O
emission peaks were observed (Fig. 2a). While soil
mineral N concentrations in the control plots ranged
from 10 to 20 mg N kg soil-1 from April to June in
2009, they were near the detection limit throughout
2010 (Figs. 1b, c, 2b, c). Higher flux rates in 2009 than
in 2010 could be explained by the mild winter and
warm spring that likely resulted in early season N
mineralization rates exceeding plant uptake and thus
increased the availability of soil mineral N for N2O
producing processes (Fig. 1). The low emissions in
spring 2010 are consistent with Roelandt et al. (2005)
and Dechow and Freibauer (2011) who found in their
meta-analysis of grasslands that N2O emissions were
greater after a mild than after a cold winter.
Ammonium nitrate applied in 2009 tended to
increase N2O flux, but the impact was small (Fig. 1;
Table 4). Cattle slurry had no significant effect on
N2O emissions in 2009. Emissions from fertilized
plots were seldom higher than from control plots in
2009, except shortly after second AN fertilization and
in late July and early August, when heavy rainfall
events increased WFPS from 20 to 45 % (Fig. 1). This
rewetting likely increased the anoxic volume and
redistributed inorganic N in the soil. We attribute the
lack of N2O response to N fertilization in 2009 to the
good aeration of the soil, and to the high availability of
soil mineral N (mainly NH4-N) in all treatments
(Fig. 1) after several years of intensive cattle slurry
and inorganic N fertilization prior to 2009.
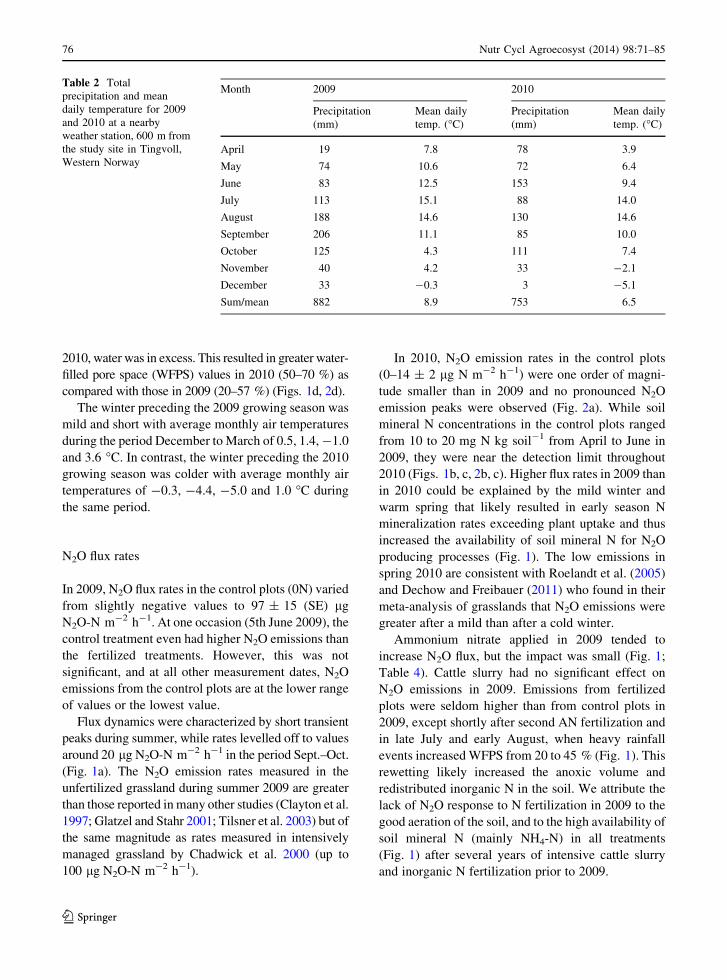
Table 2 Total
precipitation and mean
daily temperature for 2009
and 2010 at a nearby
weather station, 600 m from
the study site in Tingvoll,
Western Norway
Month 2009 2010
Precipitation
(mm)
Mean daily
temp. (�C)
Precipitation
(mm)
Mean daily
temp. (�C)
April 19 7.8 78 3.9
May 74 10.6 72 6.4
June 83 12.5 153 9.4
July 113 15.1 88 14.0
August 188 14.6 130 14.6
September 206 11.1 85 10.0
October 125 4.3 111 7.4
November 40 4.2 33 -2.1
December 33 -0.3 3 -5.1
Sum/mean 882 8.9 753 6.5
76 Nutr Cycl Agroecosyst (2014) 98:71–85
123
In 2010, emissions were highest in the treatment
combining AN and CS (280ANCS) (Fig. 2). The
emissions were significantly (p \ 0.05) higher than in
control plots except for the periods before fertilization
in spring and before the second harvest. N2O emis-
sions in plots fertilized with cattle slurry (80CS,
Fig. 2a) were significantly higher than in control plots
only on two sampling dates right after CS application.
In contrast, significantly higher N2O emissions were
observed with the highest AN fertilization rate
(250 kg N ha-1) up to 30 days after AN fertilization.
Elevated emissions in other AN treatments were more
sporadic and short-lived. It is evident that the combi-
nation of AN and freshly supplied CS enhanced the
N2O emission as emission rates in 280ANCS were
significantly higher than in 250AN at three measure-
ment dates following AN application in spring
(8 days), despite the similar amount of mineral-N
May 1 June 1 July 1 Aug. 1Sept. 1Oct. 1Nov. 1Dec. 1
So
il N
2O f
lux
( µg
N2O
-N m
-2 h
-1)
0
20
40
60
80
100
120
May 1 June 1 July 1 Aug. 1Sept. 1Oct. 1Nov. 1Dec. 1
So
il N
H4-
N
(mg
NH
4-N
kg
so
il-1)
0
10
20
30
40
50
60
70
Control100AN150AN200AN250AN80CS280ANCS
May 1 June 1 July 1 Aug. 1Sept. 1Oct. 1Nov. 1Dec. 1
So
il N
O3-
N
(mg
NO
3-N
kg
so
il-1)
0
10
20
30
40
50
60
May 1 June 1 July 1 Aug. 1 Sept. 1 Oct. 1 Nov. 1 Dec. 1
Pre
cip
itat
ion
(m
m)
0
10
20
30
40
So
il W
FP
S (
%)
20
40
60
80
Dai
ly a
ir t
emp
erat
ure
-10
-5
0
5
10
15
20
25
PrecipitationWFPSDaily air temperature
sss
s
s
s
s
s
sss
AN+CS H AN H H (a)
(b)
(c)
(d)
Fig. 1 Temporal dynamics of a N2O fluxes, b soil NH4-N
concentration, c soil NO3-N concentration, and d ancillary
variables measured in fertilized grasslands in Western Norway
in 2009. Significant differences in N2O emission rate are marked
with an s left of the symbol. Values are the average of 4 replicate
plots per treatment (a) or from one composite sample per
treatment on each date (b, c). Fertilizer treatments are total
nitrogen added in NH4NO3 (AN) or cattle slurry (CS). Black
indicators = AN = ammonium nitrate application, white indi-
cators = CS = cattle slurry application, H = harvest
Nutr Cycl Agroecosyst (2014) 98:71–85 77
123
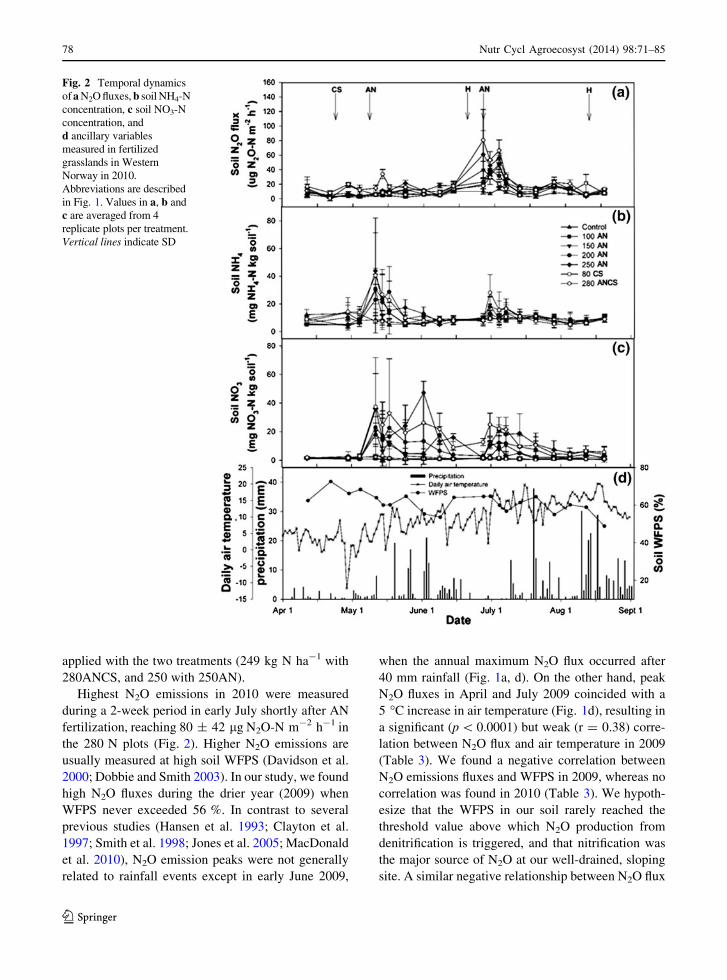
applied with the two treatments (249 kg N ha-1 with
280ANCS, and 250 with 250AN).
Highest N2O emissions in 2010 were measured
during a 2-week period in early July shortly after AN
fertilization, reaching 80 ± 42 lg N2O-N m-2 h-1 in
the 280 N plots (Fig. 2). Higher N2O emissions are
usually measured at high soil WFPS (Davidson et al.
2000; Dobbie and Smith 2003). In our study, we found
high N2O fluxes during the drier year (2009) when
WFPS never exceeded 56 %. In contrast to several
previous studies (Hansen et al. 1993; Clayton et al.
1997; Smith et al. 1998; Jones et al. 2005; MacDonald
et al. 2010), N2O emission peaks were not generally
related to rainfall events except in early June 2009,
when the annual maximum N2O flux occurred after
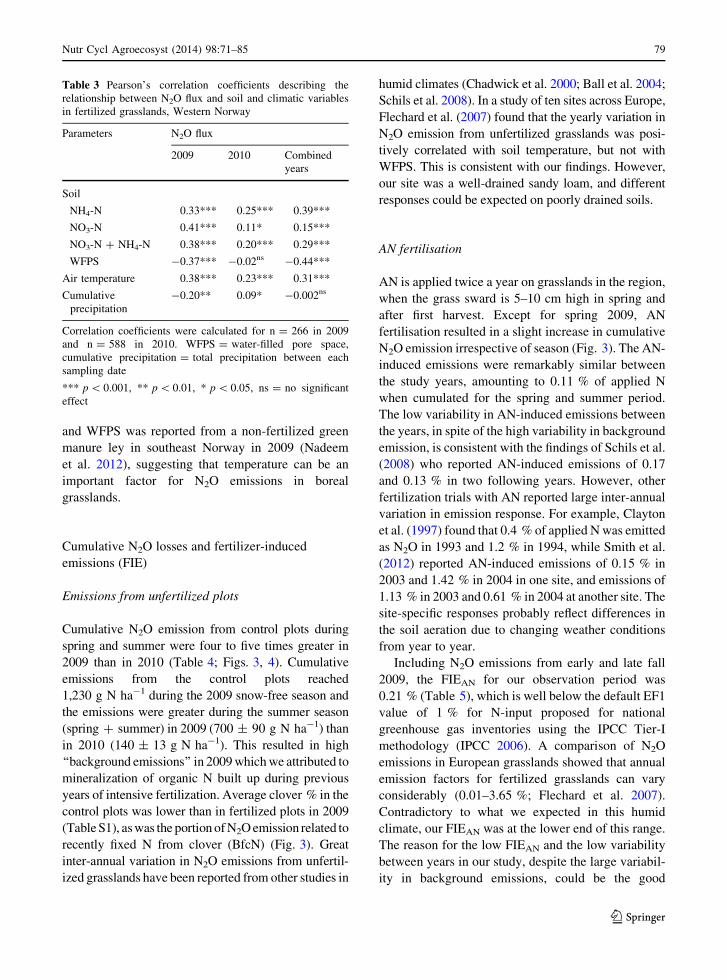
40 mm rainfall (Fig. 1a, d). On the other hand, peak
N2O fluxes in April and July 2009 coincided with a
5 �C increase in air temperature (Fig. 1d), resulting in
a significant (p \ 0.0001) but weak (r = 0.38) corre-
lation between N2O flux and air temperature in 2009
(Table 3). We found a negative correlation between
N2O emissions fluxes and WFPS in 2009, whereas no
correlation was found in 2010 (Table 3). We hypoth-
esize that the WFPS in our soil rarely reached the
threshold value above which N2O production from
denitrification is triggered, and that nitrification was
the major source of N2O at our well-drained, sloping
site. A similar negative relationship between N2O flux
Fig. 2 Temporal dynamics
of a N2O fluxes, b soil NH4-N
concentration, c soil NO3-N
concentration, and
d ancillary variables
measured in fertilized
grasslands in Western
Norway in 2010.
Abbreviations are described
in Fig. 1. Values in a, b and
c are averaged from 4
replicate plots per treatment.
Vertical lines indicate SD
78 Nutr Cycl Agroecosyst (2014) 98:71–85
123
and WFPS was reported from a non-fertilized green
manure ley in southeast Norway in 2009 (Nadeem
et al. 2012), suggesting that temperature can be an
important factor for N2O emissions in boreal
grasslands.
Cumulative N2O losses and fertilizer-induced
emissions (FIE)
Emissions from unfertilized plots
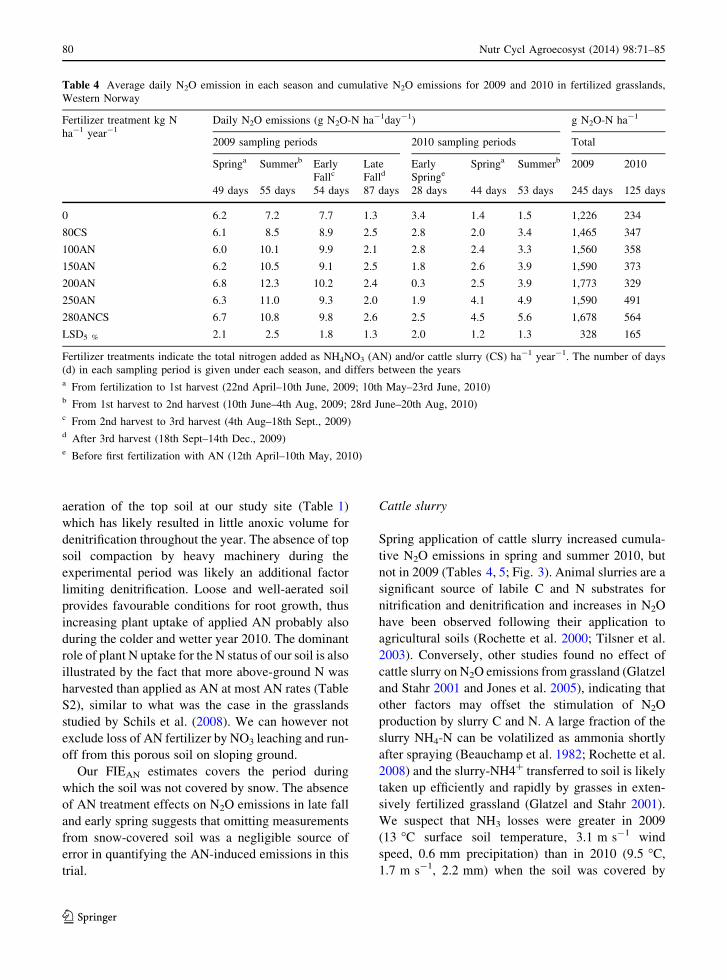
Cumulative N2O emission from control plots during
spring and summer were four to five times greater in
2009 than in 2010 (Table 4; Figs. 3, 4). Cumulative
emissions from the control plots reached
1,230 g N ha-1 during the 2009 snow-free season and
the emissions were greater during the summer season
(spring ? summer) in 2009 (700 ± 90 g N ha-1) than
in 2010 (140 ± 13 g N ha-1). This resulted in high
‘‘background emissions’’ in 2009 which we attributed to
mineralization of organic N built up during previous
years of intensive fertilization. Average clover % in the
control plots was lower than in fertilized plots in 2009
(Table S1), as was the portion of N2O emission related to
recently fixed N from clover (BfcN) (Fig. 3). Great
inter-annual variation in N2O emissions from unfertil-
ized grasslands have been reported from other studies in
humid climates (Chadwick et al. 2000; Ball et al. 2004;
Schils et al. 2008). In a study of ten sites across Europe,
Flechard et al. (2007) found that the yearly variation in
N2O emission from unfertilized grasslands was posi-
tively correlated with soil temperature, but not with
WFPS. This is consistent with our findings. However,
our site was a well-drained sandy loam, and different
responses could be expected on poorly drained soils.
AN fertilisation
AN is applied twice a year on grasslands in the region,
when the grass sward is 5–10 cm high in spring and
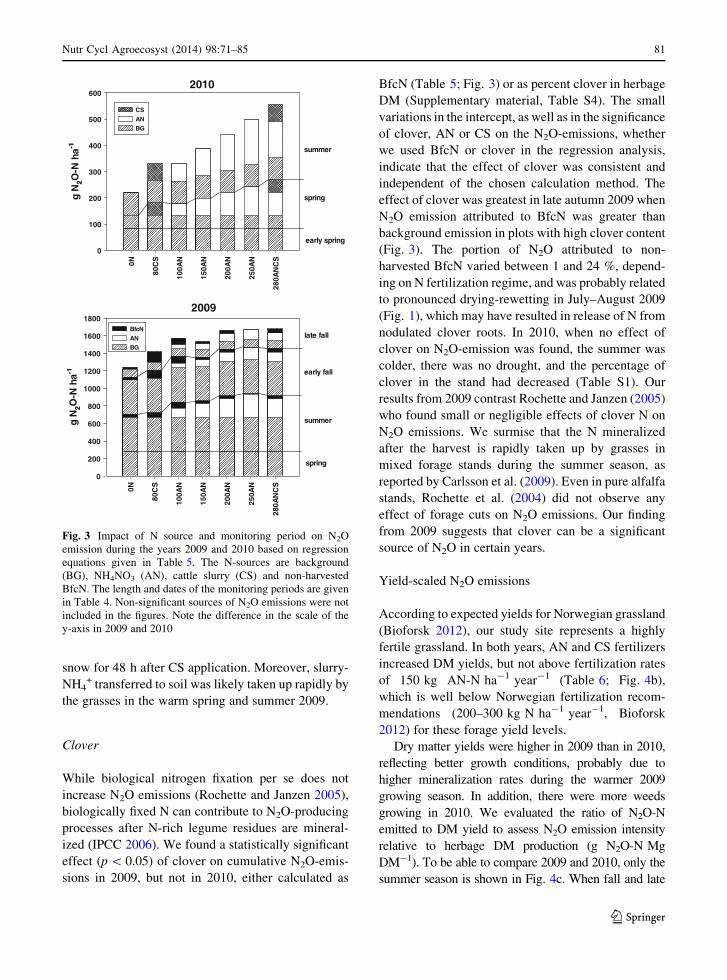
after first harvest. Except for spring 2009, AN
fertilisation resulted in a slight increase in cumulative
N2O emission irrespective of season (Fig. 3). The AN-
induced emissions were remarkably similar between
the study years, amounting to 0.11 % of applied N
when cumulated for the spring and summer period.
The low variability in AN-induced emissions between
the years, in spite of the high variability in background
emission, is consistent with the findings of Schils et al.
(2008) who reported AN-induced emissions of 0.17
and 0.13 % in two following years. However, other
fertilization trials with AN reported large inter-annual
variation in emission response. For example, Clayton
et al. (1997) found that 0.4 % of applied N was emitted
as N2O in 1993 and 1.2 % in 1994, while Smith et al.
(2012) reported AN-induced emissions of 0.15 % in
2003 and 1.42 % in 2004 in one site, and emissions of
1.13 % in 2003 and 0.61 % in 2004 at another site. The
site-specific responses probably reflect differences in
the soil aeration due to changing weather conditions
from year to year.
Including N2O emissions from early and late fall
2009, the FIEAN for our observation period was
0.21 % (Table 5), which is well below the default EF1
value of 1 % for N-input proposed for national
greenhouse gas inventories using the IPCC Tier-I
methodology (IPCC 2006). A comparison of N2O
emissions in European grasslands showed that annual
emission factors for fertilized grasslands can vary
considerably (0.01–3.65 %; Flechard et al. 2007).
Contradictory to what we expected in this humid
climate, our FIEAN was at the lower end of this range.
The reason for the low FIEAN and the low variability
between years in our study, despite the large variabil-
ity in background emissions, could be the good
Table 3 Pearson’s correlation coefficients describing the
relationship between N2O flux and soil and climatic variables
in fertilized grasslands, Western Norway
Parameters N2O flux
2009 2010 Combined
years
Soil
NH4-N 0.33*** 0.25*** 0.39***
NO3-N 0.41*** 0.11* 0.15***
NO3-N ? NH4-N 0.38*** 0.20*** 0.29***
WFPS -0.37*** -0.02ns -0.44***
Air temperature 0.38*** 0.23*** 0.31***
Cumulative
precipitation
-0.20** 0.09* -0.002ns
Correlation coefficients were calculated for n = 266 in 2009
and n = 588 in 2010. WFPS = water-filled pore space,
cumulative precipitation = total precipitation between each
sampling date
*** p \ 0.001, ** p \ 0.01, * p \ 0.05, ns = no significant
effect
Nutr Cycl Agroecosyst (2014) 98:71–85 79
123
aeration of the top soil at our study site (Table 1)
which has likely resulted in little anoxic volume for
denitrification throughout the year. The absence of top
soil compaction by heavy machinery during the
experimental period was likely an additional factor
limiting denitrification. Loose and well-aerated soil
provides favourable conditions for root growth, thus
increasing plant uptake of applied AN probably also
during the colder and wetter year 2010. The dominant
role of plant N uptake for the N status of our soil is also
illustrated by the fact that more above-ground N was
harvested than applied as AN at most AN rates (Table
S2), similar to what was the case in the grasslands
studied by Schils et al. (2008). We can however not
exclude loss of AN fertilizer by NO3 leaching and run-
off from this porous soil on sloping ground.
Our FIEAN estimates covers the period during
which the soil was not covered by snow. The absence
of AN treatment effects on N2O emissions in late fall
and early spring suggests that omitting measurements
from snow-covered soil was a negligible source of
error in quantifying the AN-induced emissions in this
trial.
Cattle slurry
Spring application of cattle slurry increased cumula-
tive N2O emissions in spring and summer 2010, but
not in 2009 (Tables 4, 5; Fig. 3). Animal slurries are a
significant source of labile C and N substrates for
nitrification and denitrification and increases in N2O
have been observed following their application to
agricultural soils (Rochette et al. 2000; Tilsner et al.
2003). Conversely, other studies found no effect of
cattle slurry on N2O emissions from grassland (Glatzel
and Stahr 2001 and Jones et al. 2005), indicating that
other factors may offset the stimulation of N2O
production by slurry C and N. A large fraction of the
slurry NH4-N can be volatilized as ammonia shortly
after spraying (Beauchamp et al. 1982; Rochette et al.
2008) and the slurry-NH4? transferred to soil is likely
taken up efficiently and rapidly by grasses in exten-
sively fertilized grassland (Glatzel and Stahr 2001).
We suspect that NH3 losses were greater in 2009
(13 �C surface soil temperature, 3.1 m s-1 wind
speed, 0.6 mm precipitation) than in 2010 (9.5 �C,
1.7 m s-1, 2.2 mm) when the soil was covered by
Table 4 Average daily N2O emission in each season and cumulative N2O emissions for 2009 and 2010 in fertilized grasslands,
Western Norway
Fertilizer treatment kg N
ha-1 year-1Daily N2O emissions (g N2O-N ha-1day-1) g N2O-N ha-1
2009 sampling periods 2010 sampling periods Total
Springa Summerb Early
FallcLate
FalldEarly
SpringeSpringa Summerb 2009 2010
49 days 55 days 54 days 87 days 28 days 44 days 53 days 245 days 125 days
0 6.2 7.2 7.7 1.3 3.4 1.4 1.5 1,226 234
80CS 6.1 8.5 8.9 2.5 2.8 2.0 3.4 1,465 347
100AN 6.0 10.1 9.9 2.1 2.8 2.4 3.3 1,560 358
150AN 6.2 10.5 9.1 2.5 1.8 2.6 3.9 1,590 373
200AN 6.8 12.3 10.2 2.4 0.3 2.5 3.9 1,773 329
250AN 6.3 11.0 9.3 2.0 1.9 4.1 4.9 1,590 491
280ANCS 6.7 10.8 9.8 2.6 2.5 4.5 5.6 1,678 564
LSD5 % 2.1 2.5 1.8 1.3 2.0 1.2 1.3 328 165
Fertilizer treatments indicate the total nitrogen added as NH4NO3 (AN) and/or cattle slurry (CS) ha-1 year-1. The number of days
(d) in each sampling period is given under each season, and differs between the yearsa From fertilization to 1st harvest (22nd April–10th June, 2009; 10th May–23rd June, 2010)b From 1st harvest to 2nd harvest (10th June–4th Aug, 2009; 28rd June–20th Aug, 2010)c From 2nd harvest to 3rd harvest (4th Aug–18th Sept., 2009)d After 3rd harvest (18th Sept–14th Dec., 2009)e Before first fertilization with AN (12th April–10th May, 2010)
80 Nutr Cycl Agroecosyst (2014) 98:71–85
123
snow for 48 h after CS application. Moreover, slurry-
NH4+ transferred to soil was likely taken up rapidly by
the grasses in the warm spring and summer 2009.
Clover
While biological nitrogen fixation per se does not
increase N2O emissions (Rochette and Janzen 2005),
biologically fixed N can contribute to N2O-producing
processes after N-rich legume residues are mineral-
ized (IPCC 2006). We found a statistically significant
effect (p \ 0.05) of clover on cumulative N2O-emis-
sions in 2009, but not in 2010, either calculated as
BfcN (Table 5; Fig. 3) or as percent clover in herbage
DM (Supplementary material, Table S4). The small
variations in the intercept, as well as in the significance
of clover, AN or CS on the N2O-emissions, whether
we used BfcN or clover in the regression analysis,
indicate that the effect of clover was consistent and
independent of the chosen calculation method. The
effect of clover was greatest in late autumn 2009 when
N2O emission attributed to BfcN was greater than
background emission in plots with high clover content
(Fig. 3). The portion of N2O attributed to non-
harvested BfcN varied between 1 and 24 %, depend-
ing on N fertilization regime, and was probably related
to pronounced drying-rewetting in July–August 2009
(Fig. 1), which may have resulted in release of N from
nodulated clover roots. In 2010, when no effect of
clover on N2O-emission was found, the summer was
colder, there was no drought, and the percentage of
clover in the stand had decreased (Table S1). Our
results from 2009 contrast Rochette and Janzen (2005)
who found small or negligible effects of clover N on
N2O emissions. We surmise that the N mineralized
after the harvest is rapidly taken up by grasses in
mixed forage stands during the summer season, as
reported by Carlsson et al. (2009). Even in pure alfalfa
stands, Rochette et al. (2004) did not observe any
effect of forage cuts on N2O emissions. Our finding
from 2009 suggests that clover can be a significant
source of N2O in certain years.
Yield-scaled N2O emissions
According to expected yields for Norwegian grassland
(Bioforsk 2012), our study site represents a highly
fertile grassland. In both years, AN and CS fertilizers
increased DM yields, but not above fertilization rates
of 150 kg AN-N ha-1 year-1 (Table 6; Fig. 4b),
which is well below Norwegian fertilization recom-
mendations (200–300 kg N ha-1 year-1, Bioforsk
2012) for these forage yield levels.
Dry matter yields were higher in 2009 than in 2010,
reflecting better growth conditions, probably due to
higher mineralization rates during the warmer 2009
growing season. In addition, there were more weeds
growing in 2010. We evaluated the ratio of N2O-N
emitted to DM yield to assess N2O emission intensity
relative to herbage DM production (g N2O-N Mg
DM-1). To be able to compare 2009 and 2010, only the
summer season is shown in Fig. 4c. When fall and late
0N
80C
S
100A
N
150A
N
200A
N
250A
N
2 80A
NC
S
gN
2O-N
ha-1
0
100
200
300
400
500
600
CS
AN
BG
early spring
spring
summer
2010
0N
80C
S
100A
N
1 50A
N
200A
N
250 A
N
280A
NC
S
gN
2O-N
ha-1
0
200
400
600
800
1000
1200
1400
1600
1800BfcNANBG
spring
summer
early fall
late fall
2009
Fig. 3 Impact of N source and monitoring period on N2O
emission during the years 2009 and 2010 based on regression
equations given in Table 5. The N-sources are background
(BG), NH4NO3 (AN), cattle slurry (CS) and non-harvested
BfcN. The length and dates of the monitoring periods are given
in Table 4. Non-significant sources of N2O emissions were not
included in the figures. Note the difference in the scale of the
y-axis in 2009 and 2010
Nutr Cycl Agroecosyst (2014) 98:71–85 81
123
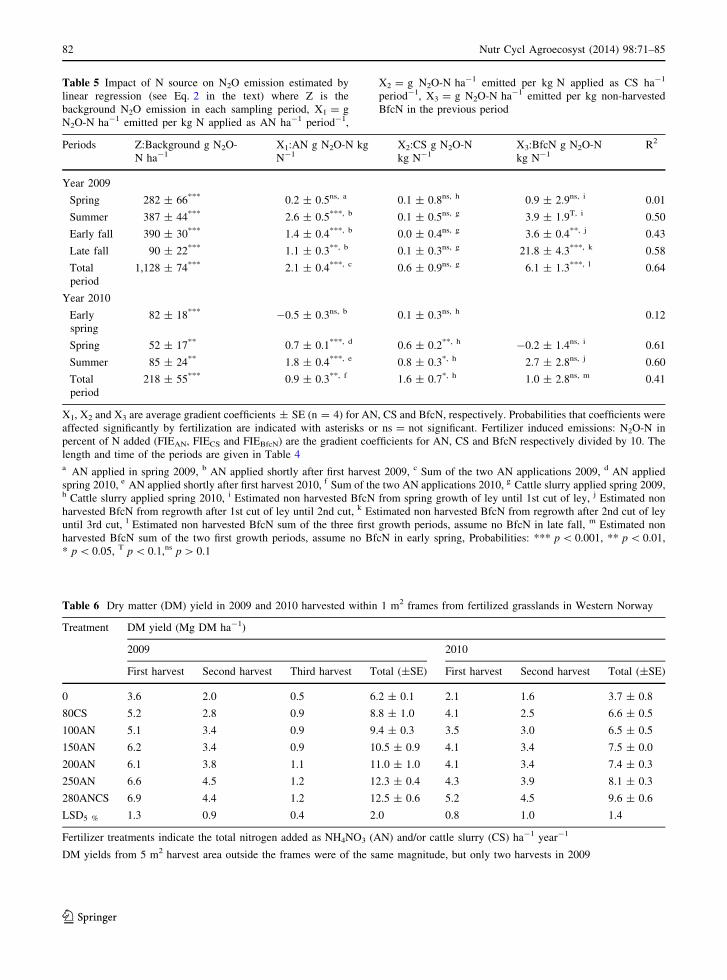
Table 5 Impact of N source on N2O emission estimated by
linear regression (see Eq. 2 in the text) where Z is the
background N2O emission in each sampling period, X1 = g
N2O-N ha-1 emitted per kg N applied as AN ha-1 period-1,
X2 = g N2O-N ha-1 emitted per kg N applied as CS ha-1
period-1, X3 = g N2O-N ha-1 emitted per kg non-harvested
BfcN in the previous period
Periods Z:Background g N2O-
N ha-1X1:AN g N2O-N kg
N-1X2:CS g N2O-N
kg N-1X3:BfcN g N2O-N
kg N-1R2
Year 2009
Spring 282 ± 66*** 0.2 ± 0.5ns, a 0.1 ± 0.8ns, h 0.9 ± 2.9ns, i 0.01
Summer 387 ± 44*** 2.6 ± 0.5***, b 0.1 ± 0.5ns, g 3.9 ± 1.9T, i 0.50
Early fall 390 ± 30*** 1.4 ± 0.4***, b 0.0 ± 0.4ns, g 3.6 ± 0.4**, j 0.43
Late fall 90 ± 22*** 1.1 ± 0.3**, b 0.1 ± 0.3ns, g 21.8 ± 4.3***, k 0.58
Total
period
1,128 ± 74*** 2.1 ± 0.4***, c 0.6 ± 0.9ns, g 6.1 ± 1.3***, l 0.64
Year 2010
Early
spring
82 ± 18*** -0.5 ± 0.3ns, b 0.1 ± 0.3ns, h 0.12
Spring 52 ± 17** 0.7 ± 0.1***, d 0.6 ± 0.2**, h -0.2 ± 1.4ns, i 0.61
Summer 85 ± 24** 1.8 ± 0.4***, e 0.8 ± 0.3*, h 2.7 ± 2.8ns, j 0.60
Total
period
218 ± 55*** 0.9 ± 0.3**, f 1.6 ± 0.7*, h 1.0 ± 2.8ns, m 0.41
X1, X2 and X3 are average gradient coefficients ± SE (n = 4) for AN, CS and BfcN, respectively. Probabilities that coefficients were
affected significantly by fertilization are indicated with asterisks or ns = not significant. Fertilizer induced emissions: N2O-N in
percent of N added (FIEAN, FIECS and FIEBfcN) are the gradient coefficients for AN, CS and BfcN respectively divided by 10. The
length and time of the periods are given in Table 4a AN applied in spring 2009, b AN applied shortly after first harvest 2009, c Sum of the two AN applications 2009, d AN applied
spring 2010, e AN applied shortly after first harvest 2010, f Sum of the two AN applications 2010, g Cattle slurry applied spring 2009,h Cattle slurry applied spring 2010, i Estimated non harvested BfcN from spring growth of ley until 1st cut of ley, j Estimated non
harvested BfcN from regrowth after 1st cut of ley until 2nd cut, k Estimated non harvested BfcN from regrowth after 2nd cut of ley
until 3rd cut, l Estimated non harvested BfcN sum of the three first growth periods, assume no BfcN in late fall, m Estimated non
harvested BfcN sum of the two first growth periods, assume no BfcN in early spring, Probabilities: *** p \ 0.001, ** p \ 0.01,
* p \ 0.05, T p \ 0.1,ns p [ 0.1
Table 6 Dry matter (DM) yield in 2009 and 2010 harvested within 1 m2 frames from fertilized grasslands in Western Norway
Treatment DM yield (Mg DM ha-1)
2009 2010
First harvest Second harvest Third harvest Total (±SE) First harvest Second harvest Total (±SE)
0 3.6 2.0 0.5 6.2 ± 0.1 2.1 1.6 3.7 ± 0.8
80CS 5.2 2.8 0.9 8.8 ± 1.0 4.1 2.5 6.6 ± 0.5
100AN 5.1 3.4 0.9 9.4 ± 0.3 3.5 3.0 6.5 ± 0.5
150AN 6.2 3.4 0.9 10.5 ± 0.9 4.1 3.4 7.5 ± 0.0
200AN 6.1 3.8 1.1 11.0 ± 1.0 4.1 3.4 7.4 ± 0.3
250AN 6.6 4.5 1.2 12.3 ± 0.4 4.3 3.9 8.1 ± 0.3
280ANCS 6.9 4.4 1.2 12.5 ± 0.6 5.2 4.5 9.6 ± 0.6
LSD5 % 1.3 0.9 0.4 2.0 0.8 1.0 1.4
Fertilizer treatments indicate the total nitrogen added as NH4NO3 (AN) and/or cattle slurry (CS) ha-1 year-1
DM yields from 5 m2 harvest area outside the frames were of the same magnitude, but only two harvests in 2009
82 Nutr Cycl Agroecosyst (2014) 98:71–85
123
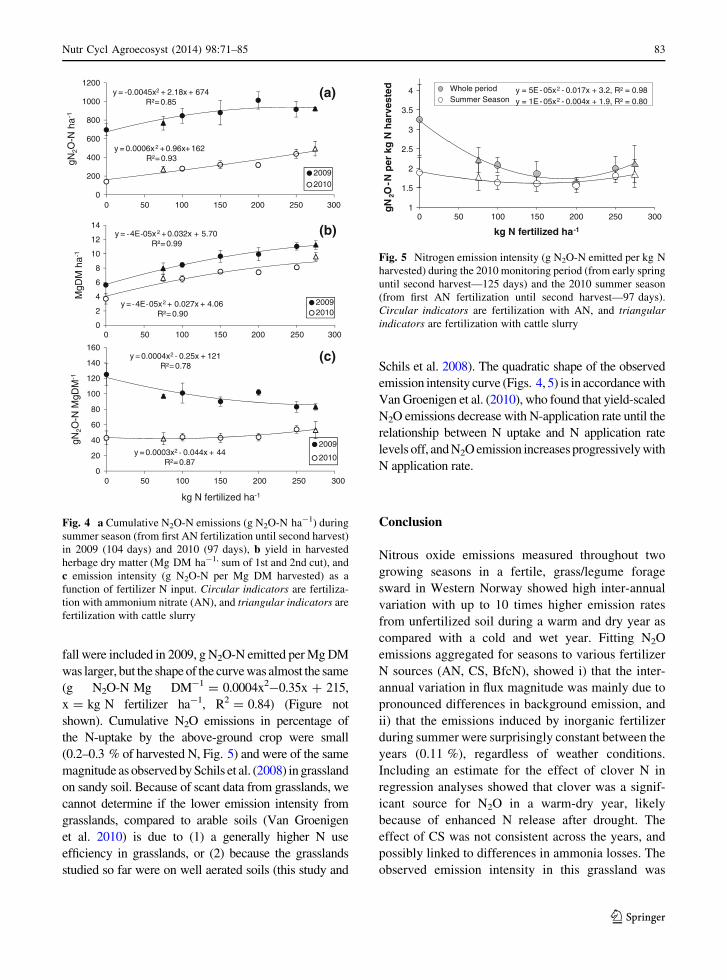
fall were included in 2009, g N2O-N emitted per Mg DM
was larger, but the shape of the curve was almost the same
(g N2O-N Mg DM-1 = 0.0004x2-0.35x ? 215,
x = kg N fertilizer ha-1, R2 = 0.84) (Figure not
shown). Cumulative N2O emissions in percentage of
the N-uptake by the above-ground crop were small
(0.2–0.3 % of harvested N, Fig. 5) and were of the same
magnitude as observed by Schils et al. (2008) in grassland
on sandy soil. Because of scant data from grasslands, we
cannot determine if the lower emission intensity from
grasslands, compared to arable soils (Van Groenigen
et al. 2010) is due to (1) a generally higher N use
efficiency in grasslands, or (2) because the grasslands
studied so far were on well aerated soils (this study and
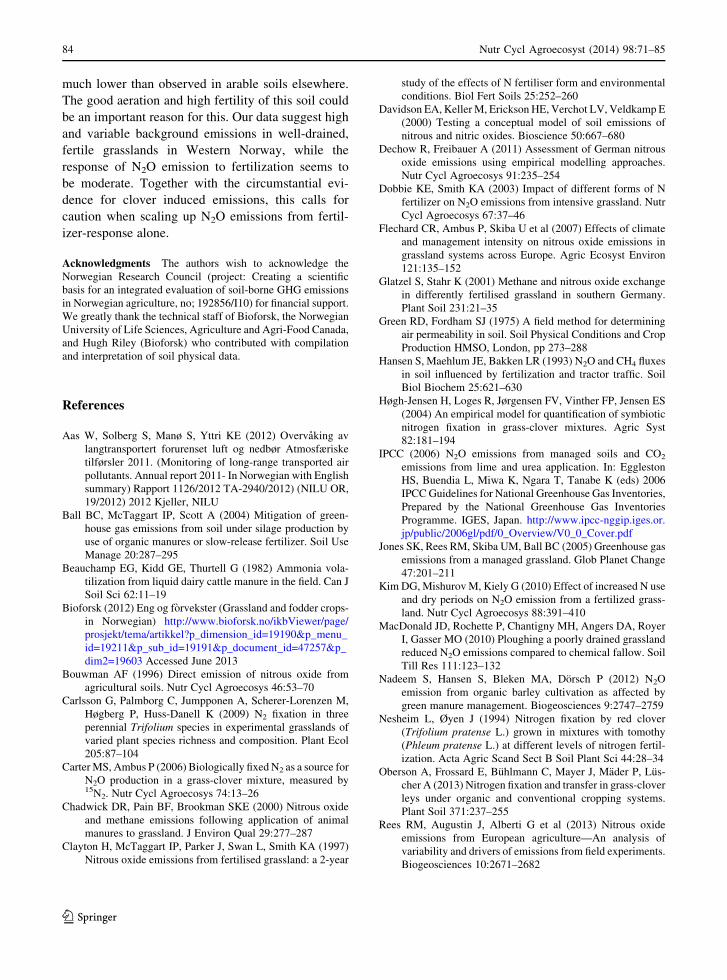
Schils et al. 2008). The quadratic shape of the observed
emission intensity curve (Figs. 4, 5) is in accordance with
Van Groenigen et al. (2010), who found that yield-scaled
N2O emissions decrease with N-application rate until the
relationship between N uptake and N application rate
levels off, and N2O emission increases progressively with
N application rate.
Conclusion
Nitrous oxide emissions measured throughout two
growing seasons in a fertile, grass/legume forage
sward in Western Norway showed high inter-annual
variation with up to 10 times higher emission rates
from unfertilized soil during a warm and dry year as
compared with a cold and wet year. Fitting N2O
emissions aggregated for seasons to various fertilizer
N sources (AN, CS, BfcN), showed i) that the inter-
annual variation in flux magnitude was mainly due to
pronounced differences in background emission, and
ii) that the emissions induced by inorganic fertilizer
during summer were surprisingly constant between the
years (0.11 %), regardless of weather conditions.
Including an estimate for the effect of clover N in
regression analyses showed that clover was a signif-
icant source for N2O in a warm-dry year, likely
because of enhanced N release after drought. The
effect of CS was not consistent across the years, and
possibly linked to differences in ammonia losses. The
observed emission intensity in this grassland was
y = 0.0045x2 + 2.18x + 674R²= 0.85
y = 0.0006x 2 +0.96x+162R²= 0.93
0
200
400
600
800
1000
1200gN
2O-N
ha-
1
(a)
20092010
y = 4E 05x 2 + 0.032x + 5.70R²= 0.99
y = 4E 05x2 + 0.027x + 4.06R²= 0.90
0
2
4
6
8
10
12
14
MgD
M h
a-1
(b)
20092010
y = 0.0004x2 0.25x + 121R²= 0.78
y = 0.0003x2 0.044x + 44R²= 0.87
0
20
40
60
80
100
120
140
160
0 50 100 150 200 250 300
0 50 100 150 200 250 300
0 50 100 150 200 250 300
gN2O
-N M
gDM
-1
kg N fertilized ha-1
(c)
2009
2010
Fig. 4 a Cumulative N2O-N emissions (g N2O-N ha-1) during
summer season (from first AN fertilization until second harvest)
in 2009 (104 days) and 2010 (97 days), b yield in harvested
herbage dry matter (Mg DM ha-1, sum of 1st and 2nd cut), and
c emission intensity (g N2O-N per Mg DM harvested) as a
function of fertilizer N input. Circular indicators are fertiliza-
tion with ammonium nitrate (AN), and triangular indicators are
fertilization with cattle slurry
y = 5E -05x2 - 0.017x + 3.2, R² = 0.98y = 1E -05x2 - 0.004x + 1.9, R² = 0.80
1
1.5
2
2.5
3
3.5
4
0 50 100 150 200 250 300
gN
2O-N
per
kg
N h
arve
sted
kg N fertilized ha-1
Whole periodSummer Season
Fig. 5 Nitrogen emission intensity (g N2O-N emitted per kg N
harvested) during the 2010 monitoring period (from early spring
until second harvest—125 days) and the 2010 summer season
(from first AN fertilization until second harvest—97 days).
Circular indicators are fertilization with AN, and triangular
indicators are fertilization with cattle slurry
Nutr Cycl Agroecosyst (2014) 98:71–85 83
123
much lower than observed in arable soils elsewhere.
The good aeration and high fertility of this soil could
be an important reason for this. Our data suggest high
and variable background emissions in well-drained,
fertile grasslands in Western Norway, while the
response of N2O emission to fertilization seems to
be moderate. Together with the circumstantial evi-
dence for clover induced emissions, this calls for
caution when scaling up N2O emissions from fertil-
izer-response alone.
Acknowledgments The authors wish to acknowledge the
Norwegian Research Council (project: Creating a scientific
basis for an integrated evaluation of soil-borne GHG emissions
in Norwegian agriculture, no; 192856/I10) for financial support.
We greatly thank the technical staff of Bioforsk, the Norwegian
University of Life Sciences, Agriculture and Agri-Food Canada,
and Hugh Riley (Bioforsk) who contributed with compilation
and interpretation of soil physical data.
References
Aas W, Solberg S, Manø S, Yttri KE (2012) Overvaking av
langtransportert forurenset luft og nedbør Atmosfæriske
tilførsler 2011. (Monitoring of long-range transported air
pollutants. Annual report 2011- In Norwegian with English
summary) Rapport 1126/2012 TA-2940/2012) (NILU OR,
19/2012) 2012 Kjeller, NILU
Ball BC, McTaggart IP, Scott A (2004) Mitigation of green-
house gas emissions from soil under silage production by
use of organic manures or slow-release fertilizer. Soil Use
Manage 20:287–295
Beauchamp EG, Kidd GE, Thurtell G (1982) Ammonia vola-
tilization from liquid dairy cattle manure in the field. Can J
Soil Sci 62:11–19
Bioforsk (2012) Eng og forvekster (Grassland and fodder crops-
in Norwegian) http://www.bioforsk.no/ikbViewer/page/
prosjekt/tema/artikkel?p_dimension_id=19190&p_menu_
id=19211&p_sub_id=19191&p_document_id=47257&p_
dim2=19603 Accessed June 2013
Bouwman AF (1996) Direct emission of nitrous oxide from
agricultural soils. Nutr Cycl Agroecosys 46:53–70
Carlsson G, Palmborg C, Jumpponen A, Scherer-Lorenzen M,
Høgberg P, Huss-Danell K (2009) N2 fixation in three
perennial Trifolium species in experimental grasslands of
varied plant species richness and composition. Plant Ecol
205:87–104
Carter MS, Ambus P (2006) Biologically fixed N2 as a source for
N2O production in a grass-clover mixture, measured by15N2. Nutr Cycl Agroecosys 74:13–26
Chadwick DR, Pain BF, Brookman SKE (2000) Nitrous oxide
and methane emissions following application of animal
manures to grassland. J Environ Qual 29:277–287
Clayton H, McTaggart IP, Parker J, Swan L, Smith KA (1997)
Nitrous oxide emissions from fertilised grassland: a 2-year
study of the effects of N fertiliser form and environmental
conditions. Biol Fert Soils 25:252–260
Davidson EA, Keller M, Erickson HE, Verchot LV, Veldkamp E
(2000) Testing a conceptual model of soil emissions of
nitrous and nitric oxides. Bioscience 50:667–680
Dechow R, Freibauer A (2011) Assessment of German nitrous
oxide emissions using empirical modelling approaches.
Nutr Cycl Agroecosys 91:235–254
Dobbie KE, Smith KA (2003) Impact of different forms of N
fertilizer on N2O emissions from intensive grassland. Nutr
Cycl Agroecosys 67:37–46
Flechard CR, Ambus P, Skiba U et al (2007) Effects of climate
and management intensity on nitrous oxide emissions in
grassland systems across Europe. Agric Ecosyst Environ
121:135–152
Glatzel S, Stahr K (2001) Methane and nitrous oxide exchange
in differently fertilised grassland in southern Germany.
Plant Soil 231:21–35
Green RD, Fordham SJ (1975) A field method for determining
air permeability in soil. Soil Physical Conditions and Crop
Production HMSO, London, pp 273–288
Hansen S, Maehlum JE, Bakken LR (1993) N2O and CH4 fluxes
in soil influenced by fertilization and tractor traffic. Soil
Biol Biochem 25:621–630
Høgh-Jensen H, Loges R, Jørgensen FV, Vinther FP, Jensen ES
(2004) An empirical model for quantification of symbiotic
nitrogen fixation in grass-clover mixtures. Agric Syst
82:181–194
IPCC (2006) N2O emissions from managed soils and CO2
emissions from lime and urea application. In: Eggleston
HS, Buendia L, Miwa K, Ngara T, Tanabe K (eds) 2006
IPCC Guidelines for National Greenhouse Gas Inventories,
Prepared by the National Greenhouse Gas Inventories
Programme. IGES, Japan. http://www.ipcc-nggip.iges.or.
jp/public/2006gl/pdf/0_Overview/V0_0_Cover.pdf
Jones SK, Rees RM, Skiba UM, Ball BC (2005) Greenhouse gas
emissions from a managed grassland. Glob Planet Change
47:201–211
Kim DG, Mishurov M, Kiely G (2010) Effect of increased N use
and dry periods on N2O emission from a fertilized grass-
land. Nutr Cycl Agroecosys 88:391–410
MacDonald JD, Rochette P, Chantigny MH, Angers DA, Royer
I, Gasser MO (2010) Ploughing a poorly drained grassland
reduced N2O emissions compared to chemical fallow. Soil
Till Res 111:123–132
Nadeem S, Hansen S, Bleken MA, Dorsch P (2012) N2O
emission from organic barley cultivation as affected by
green manure management. Biogeosciences 9:2747–2759
Nesheim L, Øyen J (1994) Nitrogen fixation by red clover
(Trifolium pratense L.) grown in mixtures with tomothy
(Phleum pratense L.) at different levels of nitrogen fertil-
ization. Acta Agric Scand Sect B Soil Plant Sci 44:28–34
Oberson A, Frossard E, Buhlmann C, Mayer J, Mader P, Lus-
cher A (2013) Nitrogen fixation and transfer in grass-clover
leys under organic and conventional cropping systems.
Plant Soil 371:237–255
Rees RM, Augustin J, Alberti G et al (2013) Nitrous oxide
emissions from European agriculture—An analysis of
variability and drivers of emissions from field experiments.
Biogeosciences 10:2671–2682
84 Nutr Cycl Agroecosyst (2014) 98:71–85
123
Riley H (1996) Estimation of physical properties of cultivated
soils in southeast Norway from readily available soil
information. Nor J Agric Sci 25:5–55
Rochette P, Bertrand N (2008) Soil-surface gas emissions. In:
Gregorich EG (ed) Carter, MR. Soil Sampling and Methods
of analysis CRC Press, Boca Raton, pp 851–863
Rochette P, Hutchinson GL (2005) Measurement of soil respi-
ration in situ: Chamber techniques. In: Hatfield JL, Baker
JM (eds) Micrometeorology in agricultural systems
American Society of Agronomy. Madison, WI
Rochette P, Janzen HH (2005) Towards a revised coefficient for
estimating N2O emissions from legumes. Nutr Cycl Ag-
roecosys 73:171–179
Rochette P, Van Bochove E, Prevost D, Angers DA, Cote D,
Bertrand N (2000) Soil carbon and nitrogen dynamics
following application of pig slurry for the 19th consecutive
year: II Nitrous oxide fluxes and mineral nitrogen. Soil Sci
Soc Am J 64:1396–1403
Rochette P, Angers DA, Belanger G, Chantigny MH, Prevost D,
Levesque G (2004) Emissions of N2O from alfalfa and
soybean crops in Eastern Canada. Soil Sci Soc Am J
68:493–506
Rochette P, Guilmette D, Angers DA et al (2008) Ammonia
emissions following application of liquid hog manure to
forage grasses using different application systems. Can J
Soil Sci 88:585–593
Roelandt C, Van Wesemael B, Rounsevell M (2005) Estimating
annual N2O emissions from agricultural soils in temperate
climates. Glob Change Biol 11:1701–1711
Schils RLM, Van Groenigen JW, Velthof GL, Kuikman PJ
(2008) Nitrous oxide emissions from multiple combined
applications of fertiliser and cattle slurry to grassland. Plant
Soil 310:89–101
Sitaula BK, Hansen S, Sitaula JIB, Bakken LR (2000) Effects of
soil compaction on N2O emissions in agricultural soils.
Chemosphere Glob Change Sci 2:67–371
Smith KA, McTaggart IP, Dobbie KE, Conen F (1998) Emis-
sions of N2O from scottish agricultural soils, as a function
of fertilizer N. Nutr Cycl Agroecosys 52:123–130
Smith KA, Dobbie KE, Thorman R, Watson CJ, Chadwick D,
Yamulki S, Ball BC (2012) The effect of N fertilizer forms
on nitrous oxide emissions from UK arable land and
grassland. Nutr Cycl Agroecosys 93:127–149
Soussana JF, Allard V, Pilegaard K et al (2007) Full accounting
of the greenhouse gas (CO2, N2O, CH4) budget of nine
European grassland sites. Agric Ecosyst Environ
121:121–134
Stehfest E, Bouwman L (2006) N2O and NO emission from
agricultural fields and soils under natural vegetation:
summarizing available measurement data and modelling of
global annual emissions. Nutr Cycl Agroecosys
74:207–228
Tilsner J, Wrage N, Lauf J, Gebauer G (2003) Emission of
gaseous nitrogen oxides from an extensively managed
grassland in NE Bavaria, Germany I Annual budgets of
N2O and NOx emissions. Biogeochemistry 63:229–247
Van Groenigen JW, Velthof GL, Oenema O, Van Groenigen KJ,
Van Kessel C (2010) Towards an agronomic assessment of
N2O emissions: a case study for arable crops. Eur J Soil Sci
61:903–913
WRB (2006) World reference base for soil resources 2006: a
framework for international classification, correlation and
communication. World soil resources reports no 103 FAO,
Rome
Nutr Cycl Agroecosyst (2014) 98:71–85 85
123