nj school performance reports reference guide 2017-2018 · 2019-03-18 · nj school performance...
TRANSCRIPT

NJ School Performance Reports Reference Guide 1
NJ School Performance Reports Reference Guide
Introduction ................................................................................................................................ 3 Acknowledgments ............................................................................................................... 3
Questions to Consider While Reviewing the Reports ................................................................. 3 District and School Leaders ................................................................................................ 4
Teachers and Educators ..................................................................................................... 4
Parents and Community Members ...................................................................................... 4
Key Terms ................................................................................................................................. 4
About the Data ........................................................................................................................... 5
Navigation Guide ....................................................................................................................... 6 Searching for Reports ......................................................................................................... 6
Download the Data ............................................................................................................. 8
Navigating the School Performance Reports ...................................................................... 9
Report Sections .................................................................................................................11
Overview ...................................................................................................................................11 Contact Information ...........................................................................................................12
Unique to District-Level Reports: “Schools in this District” Table ........................................12
Student Demographics ..............................................................................................................13 Enrollment Trends by Grade ..............................................................................................13
Enrollment Trends by Student Group .................................................................................14
Enrollment by Racial and Ethnic Group .............................................................................15
Enrollment by Home Language ..........................................................................................15
Enrollment Trends by Full and Shared Time ......................................................................15
PreK and K Full and Half Day ............................................................................................16
Student Growth .........................................................................................................................17 Student Growth Table ........................................................................................................17
Student Growth by Performance Level ..............................................................................18
Student Growth by Grade ..................................................................................................19
Academic Achievement .............................................................................................................20 State Assessments ............................................................................................................20
Alternate Assessments (DLM and ACCESS for ELLs 2.0) .................................................25
New Jersey Science Assessments ....................................................................................28
National Assessment of Educational Progress (NAEP) .............................................................28

NJ School Performance Reports Reference Guide 2
National Assessment Educational Progress (NAEP) Data Notes .......................................29
College and Career Readiness .................................................................................................29 PSAT, SAT, and ACT Exams .............................................................................................29
Advanced Coursework .......................................................................................................32
Career and Technical Education ........................................................................................35
Course Participation ..........................................................................................................40
Seal of Biliteracy ................................................................................................................42
Visual and Performing Arts ................................................................................................42
Graduation and Postsecondary .................................................................................................44 Graduation Rates ...............................................................................................................44
Postsecondary Enrollment .................................................................................................47
Climate and Environment ..........................................................................................................50 Chronic Absenteeism Data ................................................................................................50
Incident and Discipline Data...............................................................................................53
Learning Environment ........................................................................................................56
Per-Pupil Expenditures ......................................................................................................58
Staff ..........................................................................................................................................59 School and District Staff Information ..................................................................................59
Statewide Educator Equity Data ................................................................................................63 Statewide Educator Equity Data Notes ..............................................................................63
Accountability ............................................................................................................................64 Comprehensive Status (School-Level Reports)..................................................................64
Targeted Status (School-Level Reports) ............................................................................65
Schools Identified as Requiring Comprehensive or Targeted Support (District- and State-
Level Reports) ...................................................................................................................65
Accountability Indicator Scores and Summative Rating .....................................................66
ESSA Accountability Indicators and Weights .....................................................................66
Summative Score ..............................................................................................................68
Accountability Summary by Student Group (School-Level Reports) ...................................68
Accountability Summary by Student Group (District-Level Reports) ...................................69
Narrative ...................................................................................................................................71 Narrative Data Notes .........................................................................................................71
School Performance Report Additional Resources ....................................................................71
Learn more ...............................................................................................................................72
*Acceda a esta Guía de Referencia en Español

NJ School Performance Reports Reference Guide 3
Introduction
The School Performance Reports reflect the New Jersey Department of Education (NJDOE)’s extensive efforts to engage with parents, students, and school communities and share the information that is most valuable in providing a picture of overall school performance. Use these reports to:
• Learn more about a school by exploring all sections of the reports
• Start conversations with school community members and ask questions
• Engage with your school communities to identify where schools are doing well and where
they can improve
The 2017-18 New Jersey School Performance Reports are available in several versions:
• Detail Performance Reports: These reports are available for all schools, districts, and the state and provide detailed information about schools across many areas:
o Student and Staff Demographics o Statewide Assessment Results and Student Growth o College and Career Readiness, Graduation, and Postsecondary o Climate and Environment o ESSA Accountability Results o School and District Narratives
• One-page summary reports: The summary reports are available for schools and districts and provide parents, educators, and communities highlights from the district, along with a high-level summary of how well a school or district is performing by addressing the following questions:
o How did students perform on assessments? o Are students at risk based on chronic absenteeism rates? o How does student growth in a school compare to other schools in the district? o Are students graduating? o Are students college and career ready?
All reports and resource documents, including this guide, are available in Spanish.
Acknowledgments The NJDOE would like to thank our partners for reviewing this School Performance Reports
Reference Guide as well as the other School Performance Reports resource documents:
• Rose Acerra and New Jersey Parent Teacher Association
• Mary-Alice Baratta and the Black Horse Pike Regional School District
• Tatsiana DaGrosa and the Statewide Parent Advocacy Network
• Marc Mancinelli and the South Jersey Data Leaders Partnership
• Cynthia Rice and Advocates for Children of New Jersey
Questions to Consider While Reviewing the Reports
The NJDOE recognizes that stakeholders in a school and district community are best positioned
to identify the unique needs of students. To most effectively prioritize the needs of each
community’s unique student populations, education stakeholders should be engaged in all steps
of the annual planning process for analyzing the data in the reports, assessing needs and
identifying root causes, and writing and implementing local plans of support and improvement.
The NJDOE has developed a guide for district and school leaders to engage local education
stakeholders to address the needs of students in an ongoing and meaningful way.

NJ School Performance Reports Reference Guide 4
The NJDOE encourages families, educators and broader community members to use the
performance reports to help start conversations by asking questions such as, “How is our school
doing relative to other schools?” or “Are all of our students making progress from last year?”
Here are some additional questions that stakeholders may want to consider as they review the
School Performance Reports:
District and School Leaders 1. How has the student population changed over the last three years and have programs,
policies, and instruction changed along with demographic shifts?
2. Are teachers in my school and district effective at improving student learning?
3. Does performance vary by grade or student group?
4. Are students chronically absent?
5. Are students safe in my schools and on their way to school?
Teachers and Educators 1. How are students performing on state assessments relative to the rest of the district or
state?
2. Is each student mastering content standards at the rate necessary to prepare that
student for success?
3. In what ways am I challenging students who are clearly being successful in my school?
4. In what ways can I support my colleagues in their students’ learning?
5. Is each student group making adequate progress from last year?
Parents and Community Members 1. What is the graduation rate for the high school my child will attend?
2. Do students in this school go on to college after high school?
3. Does my child’s school offer academic coursework such as special education, visual and
performing arts, Advanced Placement (AP), International Baccalaureate (IB), dual
enrollment, or Career and Technical Education (CTE) and differentiated learning
opportunities to meet his or her individual needs?
4. Do all student groups have equitable access to challenging and supportive educational
experiences?
5. How did the students in this school perform on the state English Language Arts/Literacy
(ELA) or Mathematics assessment relative to the rest of the district?
6. What percentage of students took the Scholastic Assessment Test (SAT), American
College Test (ACT), or Preliminary Scholastic Assessment Test (PSAT) in my school
last year?
7. How does median student growth in this school compare to the district and to the state?
Key Terms
Below are some defined common terms that appear throughout the School Performance
Reports Reference Guide and the School Performance Reports themselves.
• Accountable School: In about 95% of all cases, the school a student attends and the
student’s accountable school are the same. However, there are rare instances where the
accountable school may not be the attending school. For example, a student attending

NJ School Performance Reports Reference Guide 5
an approved private school for students with disabilities will have his or her attendance
reported by the public school they would otherwise attend. If a student cannot be
assigned to an accountable school for any reason, the student will be assigned to a
district and included in a district report but not in an individual school report.
• Accountability Indicator: Values that are used to measure student performance for the
purpose of identifying what schools require the greatest levels of support. New Jersey
uses academic proficiency, graduation rates, academic growth, progress toward English
language proficiency, and chronic absenteeism as indicators for its Every Student
Succeeds Act (ESSA) accountability system.
• Enrollment: The number of students that attend a school as reported by the school
district at the end of the school year.
• NJ SMART: A secure data transfer and reporting site that districts use to submit data
and information to the NJDOE.
Partnership for Assessment of Readiness for College and Careers (PARCC)
assessments: The statewide assessment in New Jersey from 2014-2018. New Jersey
transitioned to the PARCC exams in English Language Arts (ELA) and mathematics
beginning in the 2014-15 school year. The PARCC assessments measure the higher-
level skills developed under the New Jersey Student Learning Standards and provide
parents and educators with meaningful information to improve teaching and learning. For
more information about the PARCC assessment, visit the NJDOE’s Assessment site.
Please note that beginning with the Spring 2019 administration, students will no longer
take the PARCC and will instead take the New Jersey Student Learning Assessment in
English Language Arts and Mathematics (NJSLA-ELA and Math).
• Every Student Succeeds Act (ESSA): a federal law that was passed in December
2015 and replaced the No Child Left Behind Act (NCLB) of 2002. The purpose of this law
is to ensure that all students have equitable access to high-quality educational resources
and opportunities, and to close educational achievement gaps.
About the Data
Most of the data reported in the School Performance Reports is based on data submitted by
school districts through NJ SMART data collections. For assessments and exams scored
through outside vendors, such as PARCC assessments or SAT exams, student performance
data is provided by the outside vendor.
Information in the School Performance Reports is reported at the student group, school, and
district-level, but is based on student-level data. NJDOE has applied data privacy rules
throughout the reports to protect student privacy under the federal Family Educational Rights
Privacy Act (FERPA). Symbols you see throughout the reports are:
• An * indicates that data was available for too few students to report the given information, or the data represents a small percentage of students. There may be some additional cases where the data was kept private because the data could be used to potentially identify individual students.

NJ School Performance Reports Reference Guide 6
• An ** indicates that data was not available for the minimum 20 students, the requirednumber for a student group to be included in New Jersey’s Every Student Succeeds Act(ESSA) accountability system. This will only appear in sections of the report related toESSA accountability.
• A N indicates that no data was available to report. This happens when there are nostudents enrolled in a particular student group or if no data was submitted by the district.
For more general information about data privacy rules used in the School Performance Reports,
see New Jersey’s Data Privacy Rules document. For specific information about how data
privacy rules were applied to each data table, see the Data Privacy notes at the end of each
section of this guide.
In general, student information is reported based on the school a student attends. For data
related to New Jersey’s ESSA accountability system, such as state assessment results, student
growth, chronic absenteeism, and graduation rates, data is reported based on a student’s
accountable school. In most cases, a student’s accountable school will be the same as the
school they attend. However, in some cases, another school may be accountable for a student’s
performance. For example, a student attending an approved private school for students with
disabilities will have his or her attendance reported by the public school they would otherwise
attend.
Students who share their time between two different schools, such as a county vocational high
school and their resident high school, may be reported differently depending on the data
element. For many data elements, these students will be reported at both schools they attend,
but for some data elements (such as course enrollment), these students will only be reported
based on the school that reports the specific data.
Navigation Guide
Searching for Reports On the New Jersey School Performance Reports home page, you will find options to search for
school, district, and state-level School Performance Reports.
You can search for reports by:
• School Year

NJ School Performance Reports Reference Guide 7
• Report Type (school-, district-, or state-level)
• School/District/County dropdowns
• School or District Name
• Zip Code
After you run a search, you will have the option to download the “Detail Report” or a “Summary
Report.” Translated Spanish versions of both reports and resources will also be available on the
Run Report page. The availability of reports will depend on your search filters, including school
year, school type, and school, district, or state report type.
The menu at the left will contain links to:
• Resource Documents
o Reference Guide (this document)
o Summary Report Guide
o Frequently Asked Questions
o Videos and Other Resources
o Data Privacy Rules (FERPA)
• Feedback Survey
o Share feedback on what you like and do not like about the reports, suggest
improvements, and request additional information in future reports
• Download the Data
o See next section for more information about our School Performance Reports
database

NJ School Performance Reports Reference Guide 8
Download the Data Use the Download the Data link at the bottom of the menu to access a database containing all
the information included in the School Performance Reports.
On the Download the Data page, you will be able to download the 2017-18 School Performance
Reports databases. Data from school-level reports and data from district- and state-level reports
are available in separate files. All files are available in Excel, Excel-zipped, and Access formats.
At the bottom of the page are links to databases from prior years.
All the information included in the reports are organized within worksheets in the databases.
The database file layouts explain the data included in each tab of the database.
NJ School Performance Reports Reference Guide 9
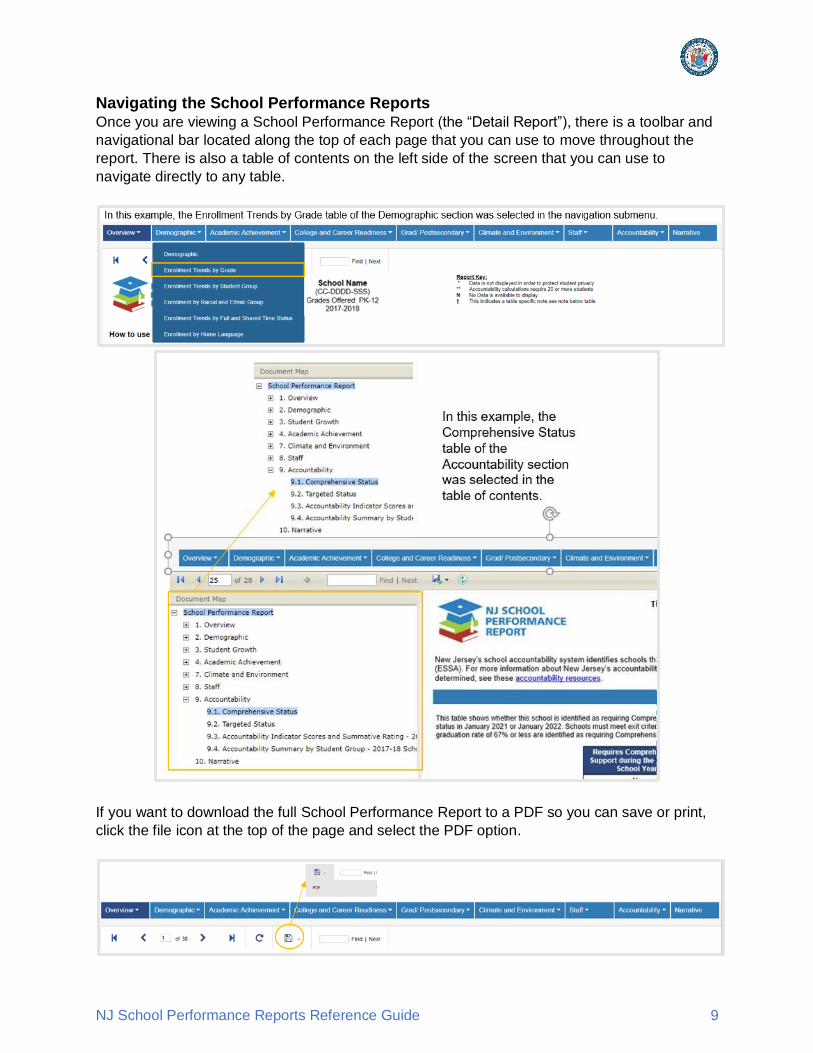
Navigating the School Performance Reports Once you are viewing a School Performance Report (the “Detail Report”), there is a toolbar and
navigational bar located along the top of each page that you can use to move throughout the
report. There is also a table of contents on the left side of the screen that you can use to
navigate directly to any table.
If you want to download the full School Performance Report to a PDF so you can save or print,
click the file icon at the top of the page and select the PDF option.

NJ School Performance Reports Reference Guide 10
There is a keyword search function at the top of the page that will let you search for specific text
within the report. Type in the text you are looking for and click “Find” and you will be redirected
to the next occurrence of that word in the report.
You can use the navigational menu bar at the top of the page to move to a specific section of
the report. See the next section (Report Elements) for more information about the sections that
will appear in each report.
Within each section of the report, there may be multiple pages. Once you are in a section, you
can use the page filters at the top of the page to move between pages.

NJ School Performance Reports Reference Guide 11
Report Sections The New Jersey School Performance Reports contain ten possible sections, which you will see
in the navigational menu across the top of the reports.
The sections included in each report are based on the grades served by the school or district
and the type of report selected (school, district, or state). Schools and districts are grouped into
four major report types:
• PK-2: Schools and districts that only serve students in grades Pre-K through 2
• PK-8: Schools and districts that serve students in grades Pre-K through 8
• 9-12: Schools and districts that serve students in grades 9-12
• Not Tested: Special service, alternate, shared time vocational, and other non-testing
schools and districts
Schools with grade spans that don’t directly apply to the above categories, such as schools
serving grades 6 through 12, may fall into multiple categories.
Some sections of the report will appear for all schools and districts, but others will only appear
for certain schools and districts. The ten sections, and the report types that have these sections,
are:
• Overview: All reports
• Demographics: All reports
• Student Growth: PK-8 only
• Academic Achievement: PK-2, PK-8, and 9-12 only
• College and Career Readiness: PK-8, 9-12, and some schools/districts in the Not
Tested category
• Grad/Postsecondary: 9-12 only
• Climate and Environment: All reports
• Staff: All reports
• Accountability: PK-8 and 9-12 only
• Narrative: All reports
The state-level School Performance Report will include all sections except for the Narrative. The rest of this guide will cover each table in the School Performance Reports. The Data Notes table at the end of each section of this guide will include more details about whether the reports for each school and district type will include each table or section.
Overview
The Overview page of the report gives a brief overview of the reports and how to use them,
explains how to navigate through the reports, and provides links to other resources that may be
helpful as you review the reports.

NJ School Performance Reports Reference Guide 12
Figure 1 - Overview
Contact Information
The contact information table provides ways to contact each school or district. It includes
principal or superintendent name, address, phone number, and email address. It also includes
website, Facebook, and Twitter pages if available. This information is provided by districts
through the NJDOE’s school directory system and the NJ SMART Performance Reports
Submission.
Figure 2 - Contact Information
Unique to District-Level Reports: “Schools in this District” Table Available only in the district-level performance reports, the “Schools in this District” page
provides the ability to access the school-level report for each school within the district.
Figure 3 - Schools in this District

NJ School Performance Reports Reference Guide 13
Student Demographics
The Demographic section of the New Jersey School Performance Reports provides information
about student enrollment and demographics. The tables in this section show the student
enrollment by different student characteristics such as grade level, student group, and racial and
ethnic group.
Figure 4 - Demographics
Enrollment Trends by Grade
This table shows the number of students enrolled by grade for the past three school years. Grade is based on the grade level reported by the district. If students were reported in grades
not served by the school, the total enrollment may not equal the sum of the enrollment by grade
because the total enrollment includes all students enrolled.
Figure 5 - Enrollment Trends by Grade

NJ School Performance Reports Reference Guide 14
Enrollment Trends by Student Group This table shows the percentage of students by student group who were enrolled for the past
three years. Each percentage is calculated by taking the total number of students identified in
each student group and dividing by the overall PK-12 enrollment. Students may be counted in
more than one student group.
Figure 6 - Enrollment Trends by Student Group
• Economically Disadvantaged Students are students who are eligible for free or
reduced lunch.
• Students with Disabilities are students who are classified for special education.
• English Language Learners (ELL) are students identified by the district as needing
English language proficiency services and/or a program that includes students served in
a language assistance program.
• Homeless Students are students who lack a fixed, regular, and adequate nighttime
residence.
• Students in Foster Care are students who were identified as receiving foster care
based on data provided by the Department of Children and Families (DCF).
• Military-Connected Students are students who have a parent or guardian who is on
active duty, in the National Guard, or in the Reserve components of the United States
military services.
• Migrant Student are students who are 21 years of age or younger, who are or whose
parent/guardian are a migratory fisher, dairy worker, or agricultural worker, and who
have moved from one school district to another in the preceding 36 months for the
workers to obtain temporary or seasonal employment.

NJ School Performance Reports Reference Guide 15
Enrollment information for homeless students, students in foster care, military-connected
students, and migrant students is not available for the 2015-16 school year.
Enrollment by Racial and Ethnic Group This table shows the percentage of students by racial and ethnic group for the past three years.
The percentage is calculated by taking the number of students in each racial and ethnic group
and dividing by the total PK-12 enrollment. Students are counted in only one racial and ethnic
group.
Figure 7 - Enrollment by Racial and Ethnic Group
Enrollment by Home Language This table shows the percentage of students enrolled by the primary language spoken in their
homes, or “home language,” including English. The table shows the top five languages and only
shows languages spoken by at least 1% of students in the school. Students with home
languages other than those listed are counted in the Other Languages category.
The percentage is calculated by taking the number of students based on their home language
and dividing by the total PK-12 enrollment.
Figure 8 - Enrollment by Home Language
Enrollment Trends by Full and Shared Time This table shows the number of students who are full time, shared time, and the full time
equivalent count for the last three school years.

Demographics Data Notes
Category Demographics Data Notes
• Demographic information is based on end-of-year enrollmentdata (collected on June 29, 2018) submitted by schooldistricts through NJ SMART.
o Note: this information may differ from the enrollmentdata posted on the NJDOE Enrollment data page,which is based on fall enrollment data (collected onOctober 15, 2017).
Source of information
Changes for the 2017-18 reports
• Enrollment by Racial and Ethnic group now includes threeyears of data.
NJ School Performance Reports Reference Guide 16
Full time students are students who attend the school for more than one half of the school day.
Shared time students attend the school for one half of the school day or less. An example
would be students that split time between a vocational school and their home school. Full time
equivalency is calculated by adding the number of full-time students plus the number of shared
time students multiplied by 0.50.
Figure 9 - Enrollment Trends by Full and Shared Time
PreK and K Full and Half Day This table shows the number of students who were enrolled in full day or half day Pre-
Kindergarten (PK) or Kindergarten (K) over the past three years. This count is based on the
primary program of instruction reported by school districts.
Figure 10 - PreK and K Full Day and Half Day

NJ School Performance Reports Reference Guide 17
Category Demographics Data Notes
Which reports include this information
• The Enrollment Trends by Full and Shared Time Statustable will only appear in reports for schools that serve highschool grades.
• The PK and K – Full Day and Half Day table will onlyappear in reports for schools that serve grades Pre-K orKindergarten.
• Other tables will appear for all schools and districts.
2017-18 Performance Reports Database
• Worksheets include: (1) EnrollmentTrendsByGrade, (2)EnrollmentTrendsByStudentGroup, (3)EnrollmentByRacialEthnicGroup, (4)EnrollmentByHomeLanguage, (5)EnrollmentTrendsFullSharedTime, & (6) PreKAndK-FullDayHalfDay
Student Growth
The Student Growth section of the New Jersey School Performance Reports appears only in
reports for elementary and middle schools and reports on median Student Growth Percentiles
(mSGP) for schools, districts, and student groups.
Each student gets a student growth percentile (SGP) from 1 to 99 for ELA (grades 4 to 8) and
Math (grades 4 to 7) that explains their progress compared to other students who had similar
state assessment scores in the past. Math SGPs for grade 8 are not calculated because many
8th graders take the Algebra I End-of-Course assessment instead of the 8th Grade Math
assessment.
A student’s SGP falls between 1 and 99 and can be grouped into three levels:
• Under 35: Low Growth
• Between 35 and 65: Typical Growth
• Over 65: High Growth
If the student growth percentiles for all students in the student group, school, or district are
ordered from smallest to largest, the median student growth percentile (mSGP) is the
percentile in the middle of the list.
A short video explaining how student growth percentiles and median student growth percentiles
are calculated is available on the NJDOE Student Performance page.
Student Growth Table The “Student Growth” table shows the mSGP for ELA and for Math both overall and for each
student group. It also provides comparisons to the district mSGP and the state mSGP. The table
also shows whether each student group met the annual target mSGP under ESSA
accountability.

NJ School Performance Reports Reference Guide 18
Figure 11 - Student Growth
Annual targets for student growth were set by the Commissioner of Education and reflect
whether a school or student group met the standard for growth with an mSGP of 40-59.5 or
exceeded the standard with an mSGP of 60 or higher.
Student Growth by Performance Level The “Student Growth by Performance Level” chart (Figure 12) shows student growth by PARCC
performance level. This information could help identify whether students at any PARCC
performance level are showing higher or lower levels of growth than other students in the
school.
Figure 12 - Student Growth by Performance Level

NJ School Performance Reports Reference Guide 19
For the “Student Growth by Performance Level” chart (Figure 12), students are classified into
student growth levels as defined above and into PARCC performance levels based on their
2016-17 PARCC assessment scores. The PARCC performance levels are:
• Level 1: Did Not Yet Meet Expectations
• Level 2: Partially Met Expectations
• Level 3: Approached Expectations
• Level 4: Met Expectations
• Level 5: Exceeded Expectations
Each bar on this chart (Figure 12) represents students from a particular PARCC performance
level. The data axis on the left side of the chart (% of Students in the PARCC level) measures
the percentage of students in the overall school that fall into that particular PARCC level. The
different colors and data labels on each bar measure the percentage of students in that
particular PARCC level that fall into each of the three growth levels of low, typical, and high.
It is important to note that growth levels do not correspond directly to PARCC performance. For
example, it is possible for a student with a high growth score to still score below expectations on
PARCC because performance against standards in one year is different than the growth made
by the student since the last year. SGP is a calculation of a student’s growth compared to their
academic peer group. A student that has made rapid gains over his or her peer group could
have high growth but still have not yet met expectations.
Student Growth by Grade The “Student Growth by Grade” chart (Figure 13) shows the median Student Growth Percentile
(mSGP) for students in each grade level in the school for both English Language Arts/Literacy
(ELA) and Mathematics.
Figure 13 - Student Growth by Grade
Student Growth Percentiles are calculated for ELA for students in grades 4 through 8 and they
are calculated for Math for students in grades 4 through 7. The “Student Growth by Grade” chart
(Figure 13) is helpful to see whether student growth varies by grade level.

NJ School Performance Reports Reference Guide 20
Student Growth Data Notes
Category Student Growth Data Notes
Source of information
• Student Growth Percentiles are based on PARCCperformance results from the reported school year and priorschool years.
• PARCC performance levels in the "Student Growth byPerformance Level" table are based on 2016-17 PARCCperformance levels.
Which reports include this information
• Student Growth data is only included in reports for schoolsand districts that serve grades 4 through 8.
Data privacy
• If the number of valid scores is fewer than 10 for a school,student group, or grade level, the mSGP data will not bedisplayed for that group.
• If the number of students scoring in any PARCC performancelevel is fewer than 10, growth data for that PARCCperformance level will not be displayed.
2017-18 Performance Reports Database
• Worksheets include: (1) StudentGrowth, (2)StudentGrowthByPerformLevel, & (3)StudentGrowthByGrade
Academic Achievement
The Academic Achievement section of the New Jersey School Performance Reports provides
information about student performance in English Language Arts/Literacy (ELA) and
Mathematics as measured by the Partnership for Assessment of Readiness for College and
Careers assessment, also known as the PARCC test. The data displays PARCC results overall,
by grade or test, and by school year.
This section also includes information about student performance on other assessments,
including the Dynamic Learning Maps Alternate (DLM) assessment, the ACCESS for ELLs 2.0
assessment which measures English proficiency, and the New Jersey Student Learning
Assessment-Science (NJSLA-S)
State Assessments New Jersey transitioned to the PARCC exams in Math and ELA beginning in the 2014-15
school year. The PARCC assessments measure the higher-level skills developed under the
New Jersey Student Learning Standards and provide parents and educators with meaningful
information to improve teaching and learning. For more information about the PARCC
assessment, visit the NJDOE’s Assessment site. Please note that beginning with the Spring
2019 administration, students will no longer take the PARCC and will instead take the New
Jersey Student Learning Assessment in English Language Arts and Mathematics (NJSLA-ELA
and Math).
PARCC exams are scored using a scale score. A scale score is a numerical value that
summarizes student performance, and ranges from 650 to 850. These scale scores are then
stratified into performance levels. For more information about the PARCC assessment, the
NJDOE website has PARCC Resources for Parents and PARCC Resources for Districts.

NJ School Performance Reports Reference Guide 21
The Academic Achievement section of the performance reports includes PARCC test results
reported several ways. Results are provided at the school-, district-, or state-level both overall
and by student group.
English Language Arts and Mathematics Assessment – Participation and
Performance The first table of both the ELA and Math sections of the report provides information on the
students that took that particular section of the state assessment. The tables for ELA and Math
will be displayed on separate pages.
Figure 14 - English Language Arts Assessment - Participation and Performance
Figure 15 - Mathematics Assessment - Participation and Performance
The middle section of this table (Figure 15) shows the percentage of testers who have met or
exceeded expectations. This is calculated by dividing the number of students scoring at either

NJ School Performance Reports Reference Guide 22
Level 4 or 5 on the PARCC assessment or Level 3 or 4 on the DLM assessment by the total
number of testers within the school, district, and state. The DLM assessment is an alternate
assessment for students with the most significant cognitive disabilities in English Language
Arts/Literacy (ELA) and Mathematics.
The last three columns show the Proficiency Rate for Federal Accountability, the 2017-18
Annual Target, and whether the Annual Target was met as required by the Every Student
Succeeds Act (ESSA).
The Proficiency Rate for Federal Accountability is the percentage of students who scored at
either Level 4 or 5 on the PARCC assessment or Level 3 or 4 on the DLM. The denominator for
this calculation is the number of testers if the percentage of students participating in the test was
95% or higher. If the percentage of students participating in the test was less than 95%, the
denominator is 95% of the students enrolled in testing grades. Students who have not attended
the same school for at least half a year are excluded from calculations.
The 2017-18 Annual Target is the percentage of students that are expected to score at either
Level 4 or 5 on the PARCC assessment or Level 3 or 4 on the DLM to ensure the school or
student group is on track to meet the long-term academic achievement goal of 80% of students
meeting or exceeding assessment expectations by 2030. Student groups with the annual target
section grayed out or student groups with fewer than 20 students do not have annual targets
displayed.
2015-16 testing data were used as a baseline to determine Annual Targets. If data was not
available in 2015-16, the most recent year where data was available will be used as a baseline
for annual targets. Therefore, schools or student groups that did not have data available prior to
2017-18 may not see a target until 2018-19.
The Met 2017-18 Annual Target field indicates whether the school or student group met the
2017-18 Annual Target. A school or student group has met the target if the proficiency rate for
federal accountability is equal to or greater than the target. A school or student group has met
the goal if the proficiency rate for federal accountability is equal to or greater than the long-term
academic achievement goal of 80%.
English Language Arts/Literacy and Mathematics Assessments – Performance by
Grade The next set of tables in the report, “English Language Arts/Literacy (ELA) and Mathematics
Assessment – Performance by Grade,” show performance information by student group for
students who took the PARCC exam for each tested grade and subject area. These
performance distribution charts (Figures 16 and 17) are provided for grade-level ELA exams, as
well as for the Math grade-level and end-of-course exams. Reports only include tables relevant
to the tested grades and subject areas in a specific school or district. Additionally, eleventh
grade students who took AP or IB English are exempt from the eleventh grade PARCC ELA
exam and their performance may not be reflected in these results.

NJ School Performance Reports Reference Guide 23
Figure 16 - English Language Arts/Literacy Assessment- Performance by Grade - Grade 06
Figure 17 - Mathematics Assessment- Performance by Grade - Grade 06
For each student group and for the entire school, district, or state population, the table shows
the number of valid scores, the mean scale scores, the percentage of students scoring at each
performance level, the percentage of students who met or exceeded expectations, and the
statewide percentage of students who met or exceeded expectations.
The range of scale scores on the PARCC exam is 650 to 850. The mean scale score is the
average scale score for the school, district, or state. The district and state mean scale scores
are the average scale scores for all students in the district and state, respectively, for each
grade level exam or end of course exam.
The PARCC Performance Levels are:
• Level 1: Did not yet meet expectations
• Level 2: Partially met expectations
• Level 3: Approached Expectations

NJ School Performance Reports Reference Guide 24
• Level 4: Met Expectations
• Level 5: Exceeded Expectations
PARCC ELA and Math Assessment Performance Trends The Academic Achievement section also shows information on performance trends for PARCC
exams. The “PARCC Performance Trends” graphs display the percentage of students who have
met or exceeded expectations on the PARCC ELA or Math exams over the past three school
years by grade level exam and/or end-of-course exam.
Figure 18 - PARCC ELA Assessment Performance Trends
Figure 19 - PARCC Math Assessment Performance Trends

NJ School Performance Reports Reference Guide 25
PARCC Assessment Data Notes
Category PARCC Assessment Data Notes
Source of information • PARCC performance results are based on performance data
reported directly to the NJDOE (not collected from schooldistricts).
Changes for the 2017-18 reports
• No changes for 2017-18.
Which reports include this information
• PARCC performance data will only appear in reports forschools and districts that have tested grades.
• PARCC performance by grade tables will only appear for thegrades offered by the school or district.
• This section will not appear for “Not Tested” schools anddistricts.
Data privacy
• If the number of valid scores for any school, district, studentgroup, or grade level is less than 10, data will not bedisplayed for that group.
• If the percentage of students that met or exceededexpectations or the Proficiency Rate for FederalAccountability is less than 10%, that percentage will not bedisplayed.
• If the number of test scores for any school, district, or studentgroup is less than 20, accountability targets will not beincluded. The reports will show “**” if the number of studentsis less than 20.
2017-18 Performance Reports Database
• Worksheets include: (1) ELALiteracyParticipationPerform, (2)MathParticipationPerform, (3)ELALiteracyPerformanceByGrade, (4)MathPerformanceByGradeTest, (5) ELAPerformanceTrends,& (6) MathPerformanceTrends
Alternate Assessments (DLM and ACCESS for ELLs 2.0) The next two tables in the Academic Achievement section present information on additional or
alternate assessments.
Dynamic Learning Maps (DLM) Assessment – Participation The “Alternate Assessments – Participation” table shows information about students taking the
Dynamic Learning Maps (DLM) assessment. The DLM assessment is an alternate assessment
for students with the most significant cognitive disabilities in English Language Arts/Literacy
(ELA) and Mathematics. For more information on the DLM, go to the Dynamic Learning Maps
New Jersey website.
The table shows the number of students, by grade level, who took the ELA and Math sections of
the Dynamic Learning Maps Alternate Assessment.

NJ School Performance Reports Reference Guide 26
Figure 20 - DLM Alternate Assessment - Participation
English Language Progress to Proficiency This table provides information about the progress that English Learners are demonstrating on
the ACCESS for ELLs 2.0 Assessment for English Language. ACCESS for ELLs 2.0 test is an
English language proficiency assessment for Grades K-12. This test is administered every year
to help school districts monitor the English language development of students identified as
ELLs. You can learn more about ACCESS for ELLs 2.0 on the WIDA website.
Figure 21 - English Language Progress to Proficiency
The percent of English Language Learners making expected growth to proficiency represents
the percentage of K-12 students that either score a 4.5 or higher in their initial year of
administration of the ACCESS for ELLs test or demonstrated the expected amount of growth
over two years of ACCESS for ELLs assessment results. Expected growth is based on a
student’s starting level of proficiency in 2016-17 and represents the yearly amount of growth
needed for a student to meet the proficient cut score within five years.
The 2017-18 Target is the 2017-18 ESSA accountability target for the percentage of students
that demonstrate expected growth. This target varies based on the grades served by a school.
Schools or districts can:
• Exceed the target if the percentage of students demonstrating expected growth exceeds
the target by more than a standard deviation,
• Meet the target if the percentage is above the target,

NJ School Performance Reports Reference Guide 27
• Meet the target within one standard deviation if the percentage is within one standard
deviation of the target, or
• Not meet the target if the percentage is below one standard deviation of the target.
The targets were determined based on the average percentage of English Learners that met the
expected growth across the state. The standard deviation is a measure of the variability of
those percentages and how different they were from the average.
English Language Proficiency Test – Participation and Performance The “English Language Proficiency Test – Participation and Performance” table shows
information about the ACCESS for ELLs 2.0 test.
Scores from the ACCESS for ELLs 2.0 are used to determine if a student is eligible to exit an
English language support program. Students identified as ELLs will take the test every year until
his/her scores meet the criteria to exit the language support program. Students must receive an
overall score of 4.5 or higher to be considered for proficient status.
This table shows, by number of years in the district, the number of ELL students who took the
ACCESS for ELLs 2.0 Assessment during the reported school year and what percentage of
those students had an overall score below 4.5 or 4.5 or higher.
Figure 22 - English Language Proficiency Test - Participation and Performance
Alternate Assessment Data Notes
Category Alternate Assessment Data Notes
Source of information • DLM and ACCESS for ELLs participation and performance
data is based on data reported directly to the NJDOE (notcollected from school districts).
Changes for the 2017-18 reports
• English Language Progress to Proficiency is new for 2017-18.
Which reports include this information
• The Dynamic Learning Maps (DLM) Assessment –Participation table will only appear for schools and districtsthat serve grades 3 through 11
• This section will not appear for “Not Tested” schools anddistricts.
Data privacy • If the number of valid scores for any given grade or years in
district is fewer than 10, data will not be shown.

NJ School Performance Reports Reference Guide 28
Category Alternate Assessment Data Notes
• If the number of students scoring below 4.5 or scoring 4.5 and above is fewer than 10 students, data will not be displayed.
• If the percentage of students scoring 4.5 and above is less than 10%, data will not be displayed.
2017-18 Performance Reports Database
• Worksheets include: (1) AlternateAssessmentParticipation, (2) EnglishLanguageProgress, & (3) EnglishLanguageProficiencyTest
New Jersey Science Assessments The New Jersey Student Learning Assessment for Science (NJSLA-S) measures student
proficiency with the New Jersey Student Learning Standards for Science. All students in grade
5, grade 8, and grade 11 were administered the NJSLA-Science field test in 2017-18.
New Jersey transitioned to NJSLA-S in 2017-18 to align to new science standards. Results of
field tests in 2017-18 will not be reported, but results of NJSLA-S will be added to the
performance reports in 2018-19.
Science Assessment Data Notes
Category Science Assessment Data Notes
Changes for the 2017-18 Reports
• NJSLA-S results will not be reported for 2017-18.
National Assessment of Educational Progress (NAEP)
The National Assessment of Educational Progress (NAEP) is the largest national
assessment of what US students know and can do. NAEP assesses fourth, eighth, and twelfth-
grade students in subjects such as Reading, Math, Science, and Writing. The reporting of NAEP
scores on state report cards is a federal mandate. The results of NAEP are also published as
the Nation's Report Card.
This table shows the state and national NAEP scores for grades 4 and 8 from the 2017 Reading
and Math tests and the 2015 Science test, which is the most recent scores published. For more
information, visit the NAEP website. NAEP scores are not provided at a school or district level.
Figure 23 - National Assessment of Educational Progress

NJ School Performance Reports Reference Guide 29
National Assessment Educational Progress (NAEP) Data Notes
Category National Assessment of Educational Progress (NAEP) Data
Notes
Source of information • NAEP results are based on performance data reported
directly to the NJDOE (not collected from school districts).
Which reports include this information
• NAEP results are included only in the state-level schoolperformance report.
2017-18 Performance Reports Database
• Worksheet includes: (1) NAEP
College and Career Readiness
The College and Career Readiness section of the New Jersey School Performance Reports
provides information about student behaviors that correlate with greater success in college and
career. These behaviors include taking college entrance exams, taking advanced coursework,
participating in visual and performing arts courses, and participating in career and technical
education programs.
Figure 24 - College and Career Readiness
PSAT, SAT, and ACT Exams This page of the report shows information about student participation and performance on the
PSAT, SAT, and ACT exams.
The PSAT exam helps students prepare for the SAT exam and can also qualify students for the
National Merit Scholarship Competition. PSAT data in this section of the report is limited to the
PSAT 10 and PSAT NMSQT exams and does not include performance on the PSAT 8/9 exam.
Students typically take the PSAT 10 exam in grade 10 and the NMSQT exam in grades 10 or
11. PSAT participation and performance is based on tests taken during the reported school
year.
The SAT and ACT exams are national exams that may be used for college admissions or to
qualify for scholarships. SAT and ACT participation and performance in this report are based on
12th graders taking the test this year or in prior school years.

NJ School Performance Reports Reference Guide 30
PSAT, SAT, and ACT participation and performance is based on data provided by the College
Board and ACT. For more information on the PSAT and the SAT, please visit The College
Board. For more information on the ACT, please visit the ACT website.
PSAT/SAT/ACT – Participation The “PSAT/SAT/ACT – Participation” table shows the percentage of students taking the PSAT,
SAT, and/or ACT college readiness exams.
Figure 25 - PSAT/SAT/ACT - Participation
The first row of the table displays the percentage of 10th and 11th grade students who took the
PSAT exam in the reported school year along with a comparison to the state percentage. This is
calculated by taking the number of students taking the PSAT 10 or PSAT NMSQT exam as
reported by College Board and dividing by the total end-of-year enrollment for grades 10 and
11.
The second and third rows of the table show the percentage of 12th graders who have taken the
SAT and/or ACT exam this year and prior years. Students may choose to take only the SAT,
only the ACT, or both tests. If a student took both tests, they will be counted in the percentages
for both tests.
To calculate the percentage of students taking the SAT, the number of 12th graders who took
the SAT test during the 2017-18 school year or prior school years is divided by the total end-of-
year enrollment for grade 12. To calculate the percentage of students taking the ACT, the
number of 12th graders who have a valid ACT score for the last four years is divided by the total
end-of-year enrollment for grade 12.
PSAT/SAT/ACT – Performance The “PSAT/SAT/ACT – Performance” table shows how students have performed and whether
they have met college readiness benchmarks for the PSAT, SAT, and ACT exams by subject
area.

NJ School Performance Reports Reference Guide 31
Figure 26 - PSAT/SAT/ACT - Performance
The first two columns of this table show the average score for each exam by subject area with a
comparison to the statewide average score. PSAT and SAT have two subject areas: Reading
and Writing and Math. The ACT has four subject areas: Reading, English, Math, and Science.
The next three columns show information about College Readiness benchmarks. PSAT and
SAT College Readiness benchmarks are defined by College Board and students scoring at or
above the benchmarks are likely to be on track to be ready for college when they graduate high
school. ACT benchmarks are defined by ACT and are the minimum scores required for students
to have a high probability of success in credit-bearing college courses.
Benchmarks for PSAT vary based on a student’s grade level. For students in grade 10,
benchmarks are 430 for Reading and Writing and 480 for Math. For students in grade 11,
benchmarks are 460 for Reading and Writing and 510 for Math. The last two columns show the
percentage of students who scored at or above the benchmarks with a comparison to the
statewide rate.
SAT benchmarks are 480 for Reading and Writing and 530 for Math. For more information on
SAT scores and benchmarks, please visit College Readiness, Understanding Scores. ACT
benchmarks are 22 for Reading, 18 for English, 22 for Math, and 23 for Science. The last two
columns show the percentage of students who score at or above these benchmarks with a
comparison to the statewide rate. For more information on ACT scores and benchmarks, please
visit Understanding your ACT Scores.
For all PSAT, SAT, and ACT data, if students took the test more than once, only the most recent
score is used. The format of the SAT exam changed beginning with the March 2016
administration. Students who took the SAT prior to March 2016 were scored on the old SAT
test’s 2400-point scale. Scores from the old test were converted using concordance tables
provided by College Board. Concordance tables show the relationship between two scores on
different assessments that measure similar (but not the same) concepts or constructs. These
concordance tables (linked above) are used to compare scores on the old SAT form to the new
SAT form.

NJ School Performance Reports Reference Guide 32
PSAT/SAT/ACT Data Notes
Category PSAT/SAT/ACT Data Notes
Source of information
• PSAT and SAT participation and performance information is based on data provided by the College Board and is not collected from school districts.
• ACT participation and performance information is based on data provided by ACT and is not collected from school districts.
Changes for the 2017-18 reports
• SAT performance data is based on a new file from College Board that allows for alignment with reporting and report performance of 12th graders across multiple school years.
Which reports include this information
• This section will only appear in reports for schools and districts that serve students in grades 10, 11, and 12 for the reported school year.
• This section will not appear for “Not Tested” schools and districts.
Data privacy
• If number of students taking any test is fewer than 10, data for that test will not be displayed.
• If the percentage of students scoring at or above benchmark is less than 10%, that percentage will not be displayed.
2017-18 Performance Reports Database
• Worksheets include: (1) PSAT-SAT-ACTParticipation & (2) PSAT-SAT-ACTPerformance
Advanced Coursework This section of the report includes information about student participation and performance in
Advanced Placement (AP) courses and exams, International Baccalaureate (IB) courses and
exams, and Dual Enrollment courses. An Advanced Placement or AP course is a high school
course that culminates in an AP test for which the student can earn college credit. An
International Baccalaureate or IB courses are part of a program that gives high school
students an opportunity to pursue college-level studies while still in high school. Courses
identified as dual enrollment are college level dual enrollment/dual credit courses that may be
taught by staff assigned to a school or staff outside of the school district.
AP/IB Coursework – Participation and Performance The “AP/IB Coursework – Participation and Performance” chart (Figure 27) shows information
about student participation and performance in Advanced Placement (AP) courses and exams
and International Baccalaureate (IB) courses and exams.
Figure 27 - AP/IB Coursework - Participation and Performance

NJ School Performance Reports Reference Guide 33
The first set of bars shows the percentage of students in grades 11 and 12 who were enrolled in
one or more AP or IB course with a comparison to the statewide percentage. This percentage is
calculated by taking the count of all students in grades 11 or 12 that were enrolled in one more
AP or IB course during the reported school year and dividing it by the total end-of-year
enrollment for grades 11 and 12. Students that took more than one course are only counted
once.
The next set of bars shows the percentage of students in grades 11 and 12 who took one or
more AP or IB exam with a comparison to the statewide percentage. This percentage is
calculated by taking the count of students in grades 11 or 12 that took one or more AP or IB
exam during the reported school year and dividing it by the total end-of-year enrollment for
grades 11 and 12. Students taking more than one exam would only be counted once.
The last set of bars shows the percentage of students in grades 11 and 12 who took one or
more exam and received a score of 3 or higher on AP exams or a score of 4 or higher on IB
exams with a comparison to the statewide percentage. This is calculated by taking the count of
all students in grades 11 or 12 with one or more AP scores of 3 or higher or IB scores of 4 or
higher and dividing by the total end-of-year enrollment for grades 11 and 12. Students with more
than one test with these scores would only be counted once.
Many colleges and universities grant credit and placement based on AP or IB scores, however,
each institution decides which scores it will accept.
AP exams are scored on a 5-point scale as follows:
• 5 = extremely well qualified;
• 4 = well qualified;
• 3 = qualified;
• 2 = possibly qualified;
• 1 = no recommendation
IB subject exams are scored on a 7-point scale:
• 7 = Excellent;
• 6 = Very Good;
• 5 = Good;
• 4 = Satisfactory;
• 3 = Mediocre;
• 2 = Poor;
• 1 = Very poor
For more information about AP Scores, visit the College Board’s About AP Scores page. For
more information about the IB scores, visit IB’s Understanding DP assessment page.
Dual Enrollment Coursework – Participation The “Dual Enrollment Coursework - Participation” chart (Figure 28) shows information about
student enrollment in dual enrollment courses. Dual enrollment courses allow high school
students to enroll in college courses for credit prior to their high school graduation.

NJ School Performance Reports Reference Guide 34
Figure 28 - Dual Enrollment Coursework - Participation
This chart (Figure 28) shows the percentage of students in grades 11 and 12 who enrolled in
one or more dual enrollment course with a comparison to the statewide percentage. This
percentage is calculated by taking the count of students in grades 11 or 12 who enrolled in one
or more courses identified by the school district as college level and dividing by the total end-of-
year enrollment for grades 11 and 12.
AP/IB Courses Offered The “AP/IB Courses Offered” table (Figure 29) shows the number of students enrolled and
number students taking tests by AP and IB course. This table will show all the AP and IB
courses that either were offered by a school or had students take the corresponding exam.
Figure 29 - AP/IB Courses Offered
For each AP/IB course, the Students Enrolled column shows the number of students, regardless of grade level, who enrolled in that course for the reported school year. The Students Tested column shows the number of students who took the AP or IB exam that corresponds to the course. Students do not need to take a course to take the corresponding exam, and not all students enrolled in a course take the exam. There may be more than one exam that corresponds to a course and some courses do not have a corresponding exam. The last two rows show the total number of exams taken and the number of exams that had scores of 3 or higher on AP exams or a score of 4 or higher on IB exams. The last two columns are based on exams taken, not students, so students taking multiple exams are counted more than once.

NJ School Performance Reports Reference Guide 35
Advanced Coursework Data Notes
Category Advanced Coursework Data Notes
Source of information
• AP, IB, and Dual Enrollment course participation is based on course enrollment data reported by school districts at the end of the reported school year. Identification of courses as AP, IB, and Dual Enrollment is based on the course codes that schools use to program their courses.
• AP test participation and performance are based on data provided directly to the NJDOE by the College Board (not collected from school districts).
• IB test participation and performance is based on data provided directly to the NJDOE by IB (not collected from school districts).
Changes for 2017-18
• Percentages of students participating in AP, IB, or Dual Enrollment courses and AP or IB exams are restricted to students in grades 11 and 12 only to ensure accurate comparisons across schools.
Which reports include this information
• Advanced coursework tables will only appear in reports for schools and districts that serve students in grades 10, 11, and 12 for the reported school year.
• This section will not appear for “Not Tested” schools and districts.
Data privacy
• If the number of students enrolled in AP, IB, or dual enrollment courses or total enrollment is fewer than 10, data will not be displayed.
• If the number of AP exams scoring at least 3 and IB exams scoring at least 4 is less than 10, that data will not be displayed.
2017-18 Performance Reports Database
• Worksheets include: (1) APIBCourseworkPartPerf & (2) APIBCoursesOffered
Career and Technical Education Career and Technical Education (CTE) provides students with opportunities to learn academic,
technical, and professional skills that are vital for today’s learners. For more information about
Career and Technical Education programs and programs of study in New Jersey Schools, visit
the NJDOE’s Career & Technical Education page.
Career and Technical Education Key Terms
Below find key terms related to Career and Technical Education (CTE) that are used in this
section of the guide:
• Career Cluster® is a grouping of occupations and broad industries based on
commonalities. Expectations at the Career Cluster level represent the skills and
knowledge, both academic and technical, that all students within the Career Cluster
should achieve regardless of their pathway.
• CTE Participants are students who have completed only one course in an approved
CTE program as of the reported school year.

NJ School Performance Reports Reference Guide 36
• CTE Concentrators are students who have completed two or more courses in a single
approved CTE program and/or completed the entire CTE program as of the reported
school year.
• Industry-valued credential is defined as “a recognized degree, diploma, certificate or
certification awarded for an occupation.” These credentials are:
o Valued and demanded by employers
o Portable – skills learned are transferable and provide broad opportunities
o Stackable – skills learned may lead to opportunities for continuous or advanced
training and education
o Lead to higher wages, career advancement, and/or increased job security
• Structured Learning Experience (SLE) means experiential, supervised, in-depth
learning experiences aligned to the New Jersey Student Learning Standards that are
designed to offer students the opportunity to more fully explore career interests within
one or more of the Career Clusters®.
Structured Learning Experience (SLE) means experiential, supervised, in-depth learning
experiences aligned to the New Jersey Student Learning Standards that are designed to
offer students the opportunity to more fully explore career interests within one or more of
the Career Clusters. SLEs are designed as rigorous activities that are integrated into the
curriculum and that provide students with opportunities to demonstrate and apply a high
level of academic, and/or technical skills, and develop personal, academic, and career
goals.
SLEs can include work-based learning programs, internships, apprenticeships, and
service learning experiences and can be paid or unpaid. Participation in Structured
Learning Experiences (SLEs) may be part of a CTE program, but students who are not
enrolled in CTE programs may also participate in SLEs. To learn more, visit the
NJDOE’s Structured Learning Experiences webpage.
Career and Technical Education Participation
The “Career and Technical Education Participation” chart (Figure 30) shows the percentage of
students who were enrolled in courses in approved CTE programs during the reported school
year with a comparison to the statewide percentage. Students enrolled in shared time CTE
programs in a county vocational school district are included in both the county vocational school
and their sending school.

NJ School Performance Reports Reference Guide 37
Figure 30 - Career and Technical Education Participation
Percentages in the Career and Technical Education Participation tables are calculated by taking
the number of students that are identified as CTE participants or CTE concentrators and
dividing that by the total end-of-year enrollment for grades 9 through 12.
Structured Learning Experiences Participation The “Structured Learning Experiences Participation” graph (Figure 31) shows the percentage of
students in grades 9 through 12 who were enrolled in courses during the reported school year
that were identified as SLEs by the school district with a comparison to the statewide
percentage. This is calculated by taking the number of students enrolled in one or more courses
identified as SLEs during the reported school year and dividing by the total end-of-year
enrollment for grades 9 through 12.
Figure 31 - Structured Learning Experiences Participation
Industry-Valued Credentials The “Industry-Valued Credentials” table (Figure 32) shows the percentage of students within the school and state who earned one or more industry-valued credential during the reported school year.
Figure 32 - Industry Valued Credentials

NJ School Performance Reports Reference Guide 38
Industry-Valued Credentials by Career Cluster Students may enroll in an approved CTE program across 16 Career Clusters. The NJDOE
currently recognizes students’ ability to earn Industry-Valued Credentials across 9 Career
Clusters. Students may earn multiple credentials within a single cluster and may earn
credentials across more than one Career Cluster. These nine Career Clusters are:
• Architecture & Construction
• Business Management & Administration
• Heath Science
• Hospitality & Tourism
• Human Services
• Information Technology
• Law, Public Safety, Corrections & Security
• Manufacturing
• Transportation, Distribution & Logistics
The “Industry-Valued Credentials Earned” table (Figure 33) shows the number of students enrolled in an approved CTE program, the number of students who earned at least one industry-valued credential, and the number of credentials earned in each Career Cluster and across all clusters. Career Clusters without approved industry-valued credentials are grayed out. For a given school or district, only Career Clusters that have at least one student enrolled or at least one industry-valued credential earned will be shown, other Career Clusters will be hidden.
Figure 33 - Industry-Valued Credentials Earned
Students earning credentials in more than one Career Cluster will be counted in multiple Cluster
rows, but each student will only be counted once in the Total (All Clusters) row.

NJ School Performance Reports Reference Guide 39
Career and Technical Education Data Notes
Category Career and Technical Education Data Notes
Source of information
• CTE participation and industry-valued credentials earned is based on CTE information submitted by school districts at the end of the school year.
• SLE participation is based on course enrollment data submitted by school districts at the end of the school year. Identification of courses as SLE is based on the course codes that schools use to program their courses.
Changes for the 2017-18 reports
• Industry-Valued Credentials table is new for the 2017-18 reports.
• Industry-Valued Credentials by Career Cluster table now includes information about students enrolled in approved CTE programs within each cluster.
Which reports include this information
• CTE tables will only appear in reports for schools and districts serving grades 9 through 12.
• CTE data will appear for shared time vocational schools, but not other “Not Tested” schools.
Data privacy
• If the number of students enrolled in any program is fewer than 10, data for that program will not be displayed.
• If the number of students earning a credential for any Career Cluster or overall is fewer than 10, student and industry-valued credential counts will not be displayed.
2017-18 Performance Reports Database
• Worksheets include: (1) CTE_SLEParticipation & (2) IndustryValuedCredentialsEarned

NJ School Performance Reports Reference Guide 40
Course Participation New Jersey has defined graduation requirements that all school districts must adopt that
prepare students for success in post-secondary degree programs, careers, and civic life in the
21st century. This section of the reports provides information about the courses that students
take in Mathematics, Science, Social Studies, World Languages, and Visual and Performing
Arts. Participation in ELA is not noted here because all students are required to take four years
of ELA. Further, participation in Comprehensive Health and Physical Education (CHPE) is not
noted here because all students are required to enroll in CHPE courses annually.
To provide a state-endorsed diploma, the district’s expectations for high school graduation must
meet the state’s minimum requirements (N.J.A.C. 6A: 8-5.1). You can find out more about New
Jersey Student Learning Standards on the NJDOE website.
The Course Participation tables in this section show the number of students enrolled by subject
area and grade level for the 2017-18 school year. The subject area is based on the subject and
course codes reported by school districts. The Mathematics and World Languages tables will be
included in reports for schools or districts that serve students in any grades 6 through 12. The
Science and Social Studies and History tables will be included in reports for schools or districts
that serve students in any grades 9 through 12.
Figure 34 - Course Participation
For schools and districts that serve students in grades 9 through 12, the tables will also include
a row to show the number of students enrolled in at least one Advanced Placement (AP) or
International Baccalaureate (IB) course and at least one dual enrollment course by subject area.
Any subject areas that do not offer AP/IB courses will be grayed out. See the Advanced
Coursework page of the School Performance Reports for more information about the types of
AP/IB courses offered at each school.
For all four tables, students enrolled in more than one course within a subject area would only
be counted once in that total. If a student is enrolled in courses in more than one subject area,
they will be counted in multiple columns. Students enrolled in courses in subject areas not listed

NJ School Performance Reports Reference Guide 41
will be counted in the “Other” columns. For example, if a student was enrolled in both a
Geography and a Government course, those are both categorized as Other Social Studies or
History, and the student would only be counted once in that column. If a student is enrolled in
both Algebra I and Geometry, then the student would be counted in both the Algebra I and
Geometry columns of the Mathematics table.
Figure 35 - Social Studies - Course Participation
The “World Language – Course Participation” table (Figure 36) also shows the number of
students enrolled in a level 3 or higher language course, such as French III or French IV.
Figure 36 - World Languages - Course Participation (9-12)
Course Participation Data Notes
Category Course Participation Data Notes
Source of information
• Course participation is based on course enrollment data submitted by school districts at the end of the school year. Identification of courses in subject areas is based on the course codes that schools use to program their courses.
Changes for the 2017-18 reports
• Information about students enrolled in dual enrollment courses is new for 2017-18.
Which reports include this information
• Mathematics and World Language course participation tables will only appear in reports for schools and districts that serve students in any grades 6 through 12.
• Science and Social Studies course participation tables will only appear in reports for schools and districts that serve students in any grades 9 through 12.
• This section will not appear for “Not Tested” schools and districts.
2017-18 Performance Reports Database
• Worksheets include: (1) MathCourseParticipation, (2) ScienceCourseParticipation, (3)

NJ School Performance Reports Reference Guide 42
Category Course Participation Data Notes
SocStudiesHistoryCourseParticipation, & (4) WorldLanguagesCourseParticipation
Seal of Biliteracy The New Jersey Department of Education State Seal of Biliteracy identifies graduating high
school students who demonstrate proficiency in English in addition to one or more languages.
Visit the NJDOE Seal of Biliteracy website for more information.
This table (Figure 37) shows, by language, the number of Seals of Biliteracy earned. Students
may be counted more than once if they earned Seals across more than one language. Only
languages where Seals were earned will be displayed, other languages will be hidden.
Figure 37 - Seal of Biliteracy
Seal of Biliteracy Data Notes
Category Seal of Biliteracy Data Notes
Source of information • Seal of Biliteracy information is based on data submitted by
school districts through a yearly submission.
Changes for the 2017-18 reports
• This table is new for 2017-18.
Which reports include this information
• This table will only appear in reports for schools and districts that serve students in grades 9 through 12.
• This section will not appear for “Not Tested” schools and districts.
Data privacy • If the count of students that earned a Seal of Biliteracy is
fewer than 10 for any language, that data will not be displayed.
2017-18 Performance Reports Database
• Worksheet includes: (1) SealofBiliteracy
Visual and Performing Arts This section shows student participation in visual and performing arts courses. The visual and
performing arts have been a part of the state’s academic standards and graduation
requirements since 1996. You can contact your school to learn what visual and performing arts
courses were offered.
To learn more about arts education in New Jersey schools, you can also visit the Arts Ed NJ
page and learn about the 2017 NJ Arts Education Census, which was created in partnership
with the NJDOE.
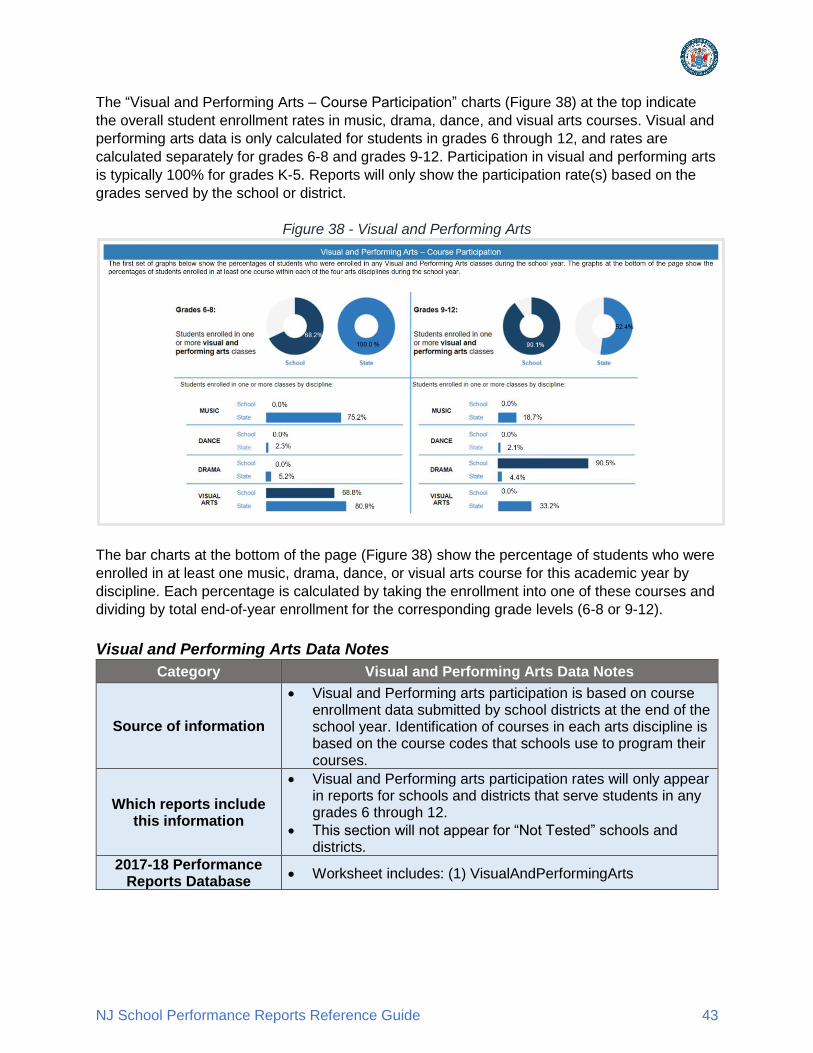
NJ School Performance Reports Reference Guide 43
The “Visual and Performing Arts – Course Participation” charts (Figure 38) at the top indicate
the overall student enrollment rates in music, drama, dance, and visual arts courses. Visual and
performing arts data is only calculated for students in grades 6 through 12, and rates are
calculated separately for grades 6-8 and grades 9-12. Participation in visual and performing arts
is typically 100% for grades K-5. Reports will only show the participation rate(s) based on the
grades served by the school or district.
Figure 38 - Visual and Performing Arts
The bar charts at the bottom of the page (Figure 38) show the percentage of students who were
enrolled in at least one music, drama, dance, or visual arts course for this academic year by
discipline. Each percentage is calculated by taking the enrollment into one of these courses and
dividing by total end-of-year enrollment for the corresponding grade levels (6-8 or 9-12).
Visual and Performing Arts Data Notes
Category Visual and Performing Arts Data Notes
Source of information
• Visual and Performing arts participation is based on course enrollment data submitted by school districts at the end of the school year. Identification of courses in each arts discipline is based on the course codes that schools use to program their courses.
Which reports include this information
• Visual and Performing arts participation rates will only appear in reports for schools and districts that serve students in any grades 6 through 12.
• This section will not appear for “Not Tested” schools and districts.
2017-18 Performance Reports Database
• Worksheet includes: (1) VisualAndPerformingArts

NJ School Performance Reports Reference Guide 44
Graduation and Postsecondary
The Graduation and Postsecondary section of the performance reports provides data on four-
year and five-year graduation rates, high school dropout rates, and enrollment in postsecondary
institutions. This section of the reports is only included in reports for schools and districts that
serve high school grades and had graduating 12th graders in 2017-18.
Figure 39 - Grad/Postsecondary
Graduation Rates Graduation rates are calculated based on data submitted by each school district. New Jersey
uses the Adjusted Cohort graduation rate formula that is mandated by the federal government.
Four-year graduation rates are calculated by dividing the number of students who graduated
within four years of entering the 9th grade by the total number of students who started high
school four years earlier. Five-year graduation rates are calculated by dividing the number of
students who graduated within five years of entering the 9th grade by the total number of
students who started high school five years earlier.
Graduation rates are adjusted for students who have transferred in or out of the district during
this time. For more information on this methodology, please visit the NJDOE’s Adjusted Cohort
Graduation Rate Information.
Graduation Rates Table The “Graduation Rates” table (Figure 40) shows four-year graduation rates for the Class of 2018
and Class of 2017 and five-year graduation rates for the Class of 2017 and the Class of 2016,
both overall and by student group. The most recent graduation rates, Class of 2018 four-year
and Class of 2017 five-year, are compared to the statewide graduation rates.

NJ School Performance Reports Reference Guide 45
Figure 40 - Graduation Rates
The Class of 2017 four-year and Class of 2016 five-year graduation rates are indicators under
New Jersey’s ESSA accountability plan. For each of these rates, the table also includes the
2017-18 annual target and whether the target was met overall and for each student group. For
more information about New Jersey’s ESSA Accountability plan, please visit the NJDOE’s
ESSA website plan or other NJDOE Accountability resources.
Graduation rate annual targets are the percentage of students in each cohort who are expected
to graduate each year in order to meet the state’s long-term four-year graduation rate goal of
95% and the long-term five-year graduation rate goal of 96% by 2030.
Annual targets were calculated through the year 2030 for all districts, schools, and student
groups, based on Class of 2015 four-year graduation rates and Class of 2014 five-year
graduation rates. They were calculated to ensure that the 2030 long-term goal would be met
while differentiating for baseline performance. Although schools and student groups have
different starting points and annual targets, the long-term goal is the same for all schools and
student groups.
A school, district, or student group has met its target if the graduation rate is equal to or higher
than the annual target. A school, district, or student group has met the long-term goal if the four-
year graduation rate is 95% or higher or the five-year graduation rate is 96% or higher.
Graduation Rate Trends The “Graduation Rate Trends” table (Figure 41) shows the four-year and five-year graduation
rates by graduating class for the last three years. Five-year graduation rates for the Class of
2018 are not yet available, so that field will not show any data.
Figure 41 - Graduation Rate Trends

NJ School Performance Reports Reference Guide 46
Graduation Pathways This table (Figure 42) shows information on how Class of 2018 graduates met high school
graduation requirements for ELA and Math.
The table shows for both ELA and Math the percentage of Class of 2018 graduates that met
graduation requirements through each of four graduation pathways: PARCC Assessment,
Substitute Competency Test, Portfolio Appeals Process, or Alternate Requirements specified in
IEP.
Figure 42 - Graduation Pathways
Graduation Rate Data Notes
Category Graduation Rate Data Notes
Source of information • Graduation rate data is based on graduation data submitted
by school districts.
Changes for the 2017-18 reports
• Graduation Pathways data is new for the 2017-18 reports.
Which reports include this information
• Graduation rate tables will only appear in reports for schools and districts serving students in grade 12 for the reported school year.
• This section will not appear for “Not Tested” schools and districts.
Data privacy
• If the number of students in any school, district, or student group cohort is fewer than 10, graduation rates and pathways will not be displayed.
• If any graduation rate is less than 10%, that data will not be displayed.
• Annual Targets will not be displayed for schools or student groups with fewer than 20 students. If the number of students is fewer than 20, the table will show ** for that student group.
2017-18 Performance Reports Database
• Worksheets include: (1) GraduationRates, (2) GraduationRateTrends, & (3) GraduationPathways
Dropout Rate Trends The “Dropout Rate Trends” table shows the percentage of students in grades 9 through 12 that
dropped out during each of the last three school years. This rate is calculated by taking all
students in grades 9 to 12 who have dropped out during each school year and dividing by the
total end-of-year enrollment for grades 9 to 12 for that school year.

NJ School Performance Reports Reference Guide 47
Figure 43 - Dropout Rate Trends
Dropout Rate Data Notes
Category Dropout Rate Data Notes
Source of information • Dropout data is based on inactive students reported by
school districts at the end of the school year.
Which reports include this information
• Dropout data will only appear in reports for schools and districts serving students in grade 12 for the reported school year.
• This section will not appear for “Not Tested” schools and districts.
Data privacy • If the number of students enrolled in grades 9-12 for any
school or district is fewer than 10, dropout rates will not be displayed.
2017-18 Performance Reports Database
• Worksheet includes: (1) DropoutRateTrends
Postsecondary Enrollment This page of the reports shows rates of enrollment in colleges and universities after graduation
from high school. This information is collected from the National Student Clearinghouse, which
collects data from at least 95% of higher education institutions nationwide. Information is not
available for students that enroll in postsecondary institutions outside of the United States.
Postsecondary Enrollment Rates: Fall This table (Figure 44) shows the percentage of Class of 2018 high school graduates that were
enrolled in any type of postsecondary institution at any point by fall 2018. The “% Enrolled in
Any Institution” column shows the students in the state, schoolwide or districtwide, and by
student group that were enrolled in any postsecondary institution. The next two columns show
the percentage of those students that were enrolled by a two-year or four-year institution.

NJ School Performance Reports Reference Guide 48
Figure 44 - Postsecondary Enrollment Rates: Fall
The first rate is calculated by taking the total number of Class of 2018 graduates that were
enrolled in any institution at any point by fall 2018 and dividing by the total number of Class of
2018 graduates. The next two columns are calculated by taking the total number of Class of
2018 graduates enrolled in the corresponding institution type (two-year or four-year) by fall 2018
and dividing by the total number of Class of 2018 graduates that were enrolled in any institution
by fall 2018.
Postsecondary Enrollment Rates: 16 Month This table (Figure 45) shows the percentage of Class of 2017 high school graduates that were
enrolled in any postsecondary institution at any point by fall 2018, sixteen months after
graduation. The “% Enrolled in Any Institution” column shows the students in the state,
schoolwide or districtwide, and by student group that were enrolled in any postsecondary
institution. The next sets of columns show the percentage of those students that were enrolled
by a 2-year or 4-year institution, public or private institution, and in-state or out-of-state
institution.
Enrollment is based on whether a student was enrolled at any time between graduation and fall
2018, not whether students have been enrolled in college for two years. Graduates that enrolled
in college directly after graduation but are no longer enrolled in fall 2018 will be included in
these rates. Graduates that did not enroll in college in fall 2017 but enrolled for the first time in
fall 2018 will be included in these rates.

NJ School Performance Reports Reference Guide 49
Figure 45 - Postsecondary Enrollment Rates: 16 Month
The first rate is calculated by taking the total number of Class of 2017 graduates that were
enrolled in any institution by fall 2018 and dividing by the total number of Class of 2017
graduates. The next sets of columns are calculated by taking the total number of Class of 2017
graduates enrolled in the corresponding institution type by fall 2018 and dividing by the total
number of Class of 2017 graduates that were enrolled in any institution by fall 2018.
Postsecondary Enrollment Data Notes
Category Postsecondary Enrollment Data Notes
Source of information • Postsecondary enrollment data is based on information
provided by the National Student Clearinghouse.
Which reports include this information
• Postsecondary enrollment data will only appear in reports for schools and districts serving students in grade 12 for the reported school year.
• This section will not appear for “Not Tested” schools and districts.
Data privacy • If the number of graduates for any school, district, or student
group is fewer than 10, postsecondary enrollment rates will not be displayed.
2017-18 Performance Reports Database
• Worksheets include: (1) PostsecondaryEnrRatesFall & (2) PostsecondaryEnrRates16mos

NJ School Performance Reports Reference Guide 50
Climate and Environment
The Climate and Environment section of the School Performance Reports provides information
about student absenteeism, incident and discipline data, and other information about the school
climate and learning environment.
Figure 46 - Climate and Environment
Chronic Absenteeism Data
Chronic absenteeism provides important information about a school’s culture and climate. In
addition, it is widely acknowledged that students who are in school are likely to be learning more
than those who are absent. Chronic absenteeism has been identified by New Jersey as an
indicator of school quality and student success for ESSA accountability.
Chronic absenteeism is an indicator of whether students are regularly attending school. A
student is considered chronically absent if they are not present (referred to as “Cumulative Days
Present”) for 10% or more of the days in which they are enrolled at a school during the school
year (referred to as “Cumulative Days in Membership”).
An absence is defined as when a student is not physically in school or not participating in instruction or instruction-related activities at an approved off-grounds location. Whether a student absence is due to illness, disciplinary action, or other reason, the student is not considered present at school unless home instruction is received. The only time a student can be absent and not be counted as having a day in membership, and therefore not counted towards chronic absenteeism, is for the following reasons:
• Religious observance (N.J.A.C. 6A:32-8.3(h));
• A college visit (up to 3 days per school year, only for students in grades 11 and 12);
• “Take Our Children to Work Day” (pursuant to the memo issued by the Commissioner to all districts on April 25, 2017) or other rule issued by the Commissioner;
• Participation in observance of Veterans Day (N.J.S.A. 18A: 36-13.2) or district board of election membership activities (N.J.S.A.18A: 36-33); or
• The closure of a busing district that prevents a student from having transportation to the receiving school.
Each student’s absentee rate is calculated as the total “Cumulative Days in Membership” minus
“Cumulative Days Present” divided by “Cumulative Days in Membership”. If a student’s

NJ School Performance Reports Reference Guide 51
absentee rate is equal to or greater than 10%, the student is chronically absent. The school or
district chronic absenteeism rate is calculated by taking the number of chronically absent
students and dividing by the total number of students in grades K-12 enrolled at the school or
district. Refer to the Guidance for Reporting Student Absences and Calculating Chronic
Absenteeism for more information.
When concerns with student attendance are identified, there are many actions schools can take to reverse the trend. Resources on strategies for addressing chronic absenteeism are available on the NJDOE’s Attendance, Truancy and Chronic Absenteeism webpage, including Getting Students to School: Strategies for Improving Attendance and Reducing Chronic Absenteeism.
For the following three tables in the Chronic Absenteeism section, students are included in the
calculations only if they meet the following criteria:
a) they were enrolled in the school at the end of the school year;
b) they were enrolled at the school for 45 or more days; and
c) they were in grades K to 12. (Preschool students are not included in the
calculation of school and district accountability scores for chronic absenteeism.
However, preschool chronic absenteeism rates are displayed in the “Chronic
Absenteeism by Grade” table in the school performance report.)
Chronic absenteeism is calculated based on a student’s accountable school, not attending
school. In about 95% of all cases, the attending and accountable school are the same but there
are rare instances where the accountable school may not be the attending school. For example,
a student attending an approved private school for students with disabilities will have his or her
attendance reported by the public school they would otherwise attend. If a student cannot be
assigned to an accountable school for any reason, the student will be assigned to a district and
included in a district report but not in an individual school report.
Chronic Absenteeism Table The “Chronic Absenteeism” table (Figure 47) shows the number and percentage of students in
grades K-12 who were chronically absent schoolwide and by student group. This table also
shows the target for 2017-18 ESSA accountability, which is based on the state average, and
whether the school and each student group met that target.
Figure 47 - Chronic Absenteeism

NJ School Performance Reports Reference Guide 52
When establishing the 2017-18 state average (target) chronic absenteeism rate, the grades
offered at a school are considered and the rate is calculated by averaging the chronic
absenteeism rate for each grade offered at the school. For example, for a school with grades 9
through 12, the target would be the average of the chronic absenteeism rates of grades 9
through 12. If a school’s chronic absenteeism rate is equal to or below the 2017-18 state
average, the school is considered to have met the target. The target for each student group is
the same as the schoolwide target for each school. The chronic absenteeism rate for a student
group is only compared to the state average if a student group has 20 or more students.
Days Absent The “Days Absent” graph (Figure 48) displays the schoolwide percentage of students in grades K-12 by the number of days they were absent during the reported year.
Figure 48 - Days Absent
Chronic Absenteeism by Grade The “Chronic Absenteeism by Grade” graph (Figure 49) shows the percentage of students who
were chronically absent along with a comparison to the state percentage for each grade level. If
a school offers a Pre-K grade, this is the only table that would display the chronic absenteeism
rate for Pre-K students.
Figure 49 - Chronic Absenteeism by Grade

NJ School Performance Reports Reference Guide 53
Chronic Absenteeism Data Notes
Category Chronic Absenteeism Data Notes
Source of information • Chronic Absenteeism calculations are based on attendance
and student group information submitted by school districts at the end of the school year.
Changes for the 2017-18 reports
• The Chronic Absenteeism table now includes counts of students that were chronically absent.
Which reports include this information
• This section will not appear for “Not Tested” schools and districts.
Data privacy
• If the number of students enrolled in any school, student group, or grade level is fewer than 10, the count and percentage of students that were chronically absent will not be displayed.
• If the rate of chronic absenteeism is greater than 90%, the rate will not be displayed.
• If the number of students enrolled in any school or student group is fewer than 20, accountability targets will not be included, and the table will show **.
2017-18 Performance Reports Database
• Worksheets include: (1) ChronicAbsenteeism, (2) DaysAbsent, & (3) ChronicAbsByGrade
Incident and Discipline Data The data shown in this section was collected from districts through the Student Safety Data
System (SSDS).
Violence, Vandalism, HIB, and Substance Offenses This table (Figure 50) shows the number of incidents reported by type and the total unique
incidents. A single incident may be included under multiple types, so the sum of incidents
across types may not equal the Total Unique Incidents. The last row shows a rate of incidents
for every 100 students enrolled based on end-of-year enrollment.
Figure 50 - Violence, Vandalism, HIB, and Substance Offenses
Police Notifications This table (Figure 51) shows, by incident type, the number of cases where an incident led to
police notification. Incidents that led to police notification includes any action by which a
student is reported to any law enforcement agency or official, including a school police unit, for
an incident that occurs on school grounds, regardless of whether official action is taken.

NJ School Performance Reports Reference Guide 54
Citations, tickets, court referrals, and school-related arrests are considered reports to law
enforcement.
Figure 51 - Police Notifications
Harassment, Intimidation, and Bullying (HIB) Investigations This table (Figure 52) shows, by HIB Nature or Protected Category, the count of alleged,
confirmed, and total Harassment, Intimidation, and Bullying (HIB) investigations.
The HIB nature of an incident may include bullying of a student for one characteristic (actual or
perceived) or for multiple characteristics. The multiple characteristics are also called “protected
categories”. These protected categories are identified in N.J.S.A.18A:37-14.
A single incident may be counted in multiple rows of the table if the investigation was associated
with multiple protected categories. All confirmed incidents must have an identified nature.
Figure 52 - Harassment, Intimidation, and Bullying (HIB) Investigations
Student Disciplinary Removals This table shows, by removal type, the number and percentage of students who received
disciplinary removals during the school year. The removal types are:

NJ School Performance Reports Reference Guide 55
• In-school suspension: Indicates that the student was temporarily removed from his or
her regular classroom(s) for at least half a day for disciplinary purposes but remains
under the direct supervision of school personnel.
• Out-of-school suspension: Indicates that the student was temporarily removed from
his or her regular classroom(s) for at least half a day for disciplinary purposes to another
setting (e.g. home).
• Any suspension: Indicates that the student received an in-school or out-of-school
suspension, or both.
• Removal to other education program: Indicates that the student was removed from
his or her regular school for disciplinary purposes for the remainder of the school year or
longer and placed in another regular school, an alternative education program or
alternative school, or another placement where the student continues to receive
educational services.
• Expulsion: Indicates that the district discontinued all educational services or
discontinued payment for all educational services for the student, which means that the
student was not placed or recommended for placement in a program or services
provided by the district or other agency (per N.J.A.C. 6A:16-1.3).
• Arrest: Indicates the arrest of a student for any incident on school grounds or due to a
referral by any school official. All school-related arrests are considered incidents that
were reported to police.
Each percentage is calculated by dividing the number of students by the total end-of-year
enrollment for the school or district.
The table on the right (Figure 53) shows the total number of days missed due to out-of-school
suspension for all students during the school year.
Figure 53 - Student Disciplinary Referrals
Incident and Discipline Data Notes
Category Incident and Discipline Data Notes
Source of information • Incident and Discipline data is collected from school districts
through the Student Safety Data System (SSDS)

NJ School Performance Reports Reference Guide 56
Category Incident and Discipline Data Notes
Changes for the 2017-18 reports
• Police Notifications and Harassment, Intimidation, and Bullying (HIB) are new tables for 2017-18.
• The Student Disciplinary Removals table replaces the suspensions and expulsions data from previous years.
Which reports include this information
• This section appears in all reports
Data privacy • If the number of students receiving any type of disciplinary
removal is less than 10, the count and rate will not be displayed.
2017-18 Performance Reports Database
• Worksheets include: (1) ViolenceVandalismHIBSubstanceOf, (2) PoliceNotifications, (3) HIBInvestigations, & (4) DisciplinaryRemovals
Learning Environment The other tables in the Climate and Environment section of the report provide information about
school day, device ratios, and financial information about school districts.
School Day The “School Day” table (Figure 54) shows information about the overall time and instructional
time for a typical student at this school.
Figure 54 - School Day
The start and end times for a typical student at this school are based on information submitted
by school districts to the state CDS system. The length of school day is calculated based on
these start and end times. This time includes both instructional and non-instructional activities.
Instructional time is the amount of time a typical student was engaged in instructional activities
under the supervision of a certified teacher. This differs from the length of the school day
because it only counts the time students spend in instructional activities and does not include
time spent in non-instructional activities, such as lunch.
Instructional time is reported for both full time and shared time students. Shared time students
split time between two schools, such as a vocational high school and a comprehensive high
school. Some schools may only have full time or shared time students, so not all schools will
show instructional time for both full time and shared time students.

NJ School Performance Reports Reference Guide 57
Device Ratios This table includes information collected from the NJTRAx database. The NJDOE established
the NJTRAx Digital Learning Readiness database to gauge the technology readiness of New
Jersey schools and districts for online testing as well as to provide a tool to assist schools in
determining readiness for digital learning. For more information about NJTRAx, visit the New
Jersey Digital Learning and Assessment Portal.
Through NJTRAx, districts were asked to report on grades 3 through 11. There may be some
districts that reported on other grades (PK-2 and 12).
Figure 55 - Device Ratios
This table shows the student to device ratio, which is the number of students in grades 3-11 per
device. The count includes only reported instructional devices (i.e., tablets or laptops) that meet
nationally recommended specifications for digital learning in grades 3-11.
The NJTRAx survey is optional for schools, so data may not be available for all schools.
Additionally, schools that have adopted a Bring Your Own Device policy may appear to have a
very low Student to Device ratio due to this policy decision. Additionally, this table may show an
N if the school’s devices do not meet the recommended specifications.
Learning Environment Data Notes
Category Learning Environment Data Notes
Source of information
• School start and end times and instructional time are submitted by school districts through the CDS system. Device ratios are based on information submitted by school districts through the NJTRAx system at the beginning of the school year.
Changes for the 2017-18 reports
• The Device Ratio data has been adjusted to only include devices that meet nationally recommended specifications for digital learning in grades 3-12.
Which reports include this information
• Learning Environment tables will only appear in school-level reports as data is school-specific and cannot be rolled up for district and state level reports.
• The Device Ratios table will not appear for schools that only serve grades PK-2 or “Not Tested” schools.
2017-18 Performance Reports Database
• Worksheets include: (1) SchoolDay & (2) DeviceRatios

NJ School Performance Reports Reference Guide 58
Per-Pupil Expenditures The “Per-Pupil Expenditures (District-Level)” table (Figure 56) displays the total current
expenses per student for regular and special education students educated within the district’s
schools. The cost includes expenditures for instruction, support services, administration,
operations and maintenance, extracurricular activities, and community services.
Figure 56 - Per-Pupil Expenditures (District-Level)
This data is reported for the 2016-17 school year, which is the year prior to the reporting year of the School Performance Reports. This data is reported at the district-level, not at the individual school-level. Data will not be available for Education Service Commissions (ESCs)/Jointures and County Special Service Districts (CSSDs). Current expenditures include the instructional costs of regular and special programs offered to students, as well as the normal operating costs of the district. The measure includes costs for governance, support, and instruction that are considered common to all school districts and are generally uniform among them. Examples of included expenses are salaries and fringe benefits for staff, textbooks, supplies and materials, rentals, insurance, legal fees, and other purchased professional, technical, and property services. Expenses that are omitted from the per pupil expenditure include:
• Pension costs paid by the state on behalf of districts;
• Tuition payments;
• Transportation costs;
• Costs for students in residential programs;
• Local contributions to special revenue;
• Interest payments on the lease purchase of buildings;
• Payments resulting from judgments against the school district;
• Equipment purchases;
• Facilities acquisition and construction services; and
• Debt service expenditures. More information about district and charter school spending can be found using districts’ User Friendly Budget, or the NJDOE Finance District Report Search of the Comprehensive Annual Financial Reports (CAFRs) and Auditor's Management Reports (AMRs).
Per-Pupil Expenditures Data Notes
Category Per-Pupil Expenditures Data Notes
Source of information
• Expenditure Data comes from district audit summary data. Expenditure amounts are taken from districts’ actual expenditures as reported in the audit summary application (Audsum), which are certified by the district’s business

NJ School Performance Reports Reference Guide 59
Category Per-Pupil Expenditures Data Notes
administrator and an independent auditor. Amounts reported in the Audsum correspond to the amounts in each district’s Comprehensive Annual Financial Report.
• Enrollment Data (used for the denominator in the calculation) is based on each district’s Average Daily Enrollment, as reported by districts in the School Register Summary (SRS). The enrollment includes only those students who are being educated within the district’s schools. Students who are sent out of district via tuition arrangements, as well as those who attend charter schools, choice districts, or residential programs, are not included in the average daily enrollment of their resident district.
Which reports include this information
• This table appears in all reports.
2017-18 Performance Reports Database
• Worksheet includes: (1) PerPupilExpenditures
Staff
The Staff section of the New Jersey School Performance Reports provides information about
staff assigned to the school, district, and state. This section of the report will reference several
categories of staff members:
• Faculty: All classroom teachers and educational services personnel (such as Librarians,
Nurses, Counselors, and Child Study Team members).
• Teachers: All classroom teachers
• Administrators: Principals, assistant principals, supervisors, coordinators, directors,
superintendents, and other central-office and district-level administrators.
Figure 57 - Staff
School and District Staff Information
Teachers – Experience & Administrators - Experience The “Teachers – Experience” and “Administrators – Experience” tables (Figure 58) show
information about experience for teachers and administrators with comparisons to statewide

NJ School Performance Reports Reference Guide 60
data. The data used in both tables are provided by the Staff Certification Report. Information in
the teacher table is reported at the school-level and the information in the administrator table is
reported at the district-level. Administrator data is reported at the district-level because many
schools only have one administrator.
Figure 58 - Teachers - Experience & Administrators - Experience
The “average years experience in public schools” row shows the average number of years that
teachers/administrators have held positions in one or more public schools, both in New Jersey
and outside of the state. The “average years experience in district” row shows the average
number of years that teachers/administrators have held positions within their current school
district. The “teachers/administrators in district for 4 or more years” row shows the percentage of
teachers/administrators that have held positions in their current school district for four or more
years.
Student to Staff Ratios The “Student to Staff Ratios” table (Figure 59) shows ratios of students and staff members in
the school and district. Separate ratios are calculated for Teachers, Administrators,
Librarian/Media Specialists, Nurses, Counselors, and Child Study Team members. Child Study
Team members include psychologists, school social workers, and learning disability teacher
consultants.
Figure 59 - Student to Staff Ratios

NJ School Performance Reports Reference Guide 61
Ratios for librarians, nurses, counselors, and child study team members are reported at the
district-level only because many staff members in these job titles are assigned only to the
district and not to individual schools. Because these individuals are not assigned to individual
schools but are attributed to districts, ratios are not provided at the school-level.
Student to staff ratios are calculated by taking the total end-of-year enrollment for the school or
district and dividing by the number of staff in the corresponding staff type. The Teachers to
Administrators ratio is calculated by taking the total number of teachers and dividing by the total
number of administrators.
Teachers and Administrators – Level of Education The “Teachers and Administrators – Level of Education” chart (Figure 60) displays the highest
level of education attained by teachers and administrators. The Bachelor’s Degree and Master’s
Degree categories for teachers may include non-instructional degrees or certificates such as
educational services certificates or specialized degrees. Administrators are required to have a
master’s degree or higher, so the Bachelor’s Degree category will show N/A for Administrators.
Figure 60 - Teachers and Administrators – Level of Education
Teacher and Administrators – One-Year Retention The “Teacher and Administrators – One-Year Retention” table (Figure 61) shows the
percentage of teachers and administrators assigned to the district or state during the 2016-17
school year that are still assigned to the same district in 2017-18. Staff who are not retained
may have changed districts or no longer work for the state (including retirements).
Figure 61 - Teacher and Administrators - One-Year Retention

NJ School Performance Reports Reference Guide 62
Faculty Attendance The “Faculty Attendance” table (Figure 62) shows the percentage of days school faculty were
present during the school year. To calculate faculty attendance, the sum of faculty days present
is divided by the sum of faculty days possible. Approved professional days, personal days, staff
training days, bereavement days, jury duty, and absences are not counted against days
present, and faculty members on long-term leave or disability are excluded from this calculation.
Figure 62 - Faculty Attendance
Teachers and Administrators – Demographics This table (Figure 63) shows the percentages of teachers and administrators by gender and by
racial and ethnic group. Each rate is calculated by taking the total number of staff members in
each category and dividing by the total number of staff members. Each teacher or administrator
is identified in only one racial or ethnic group.
Figure 63 - Teachers and Administrators - Demographics
School and District Staff Data Notes
Category School and District Staff Data Notes
Source of information
• All staff data, except Faculty Attendance, is based on staff data submitted by school districts in October of each school year.
• Staff are identified as teachers, administrators, and other staff types based on the job codes that are assigned to staff by school districts in the information that they submit.
• Enrollment data for ratios is based on end-of-year student enrollment data submitted by school districts.

NJ School Performance Reports Reference Guide 63
Category School and District Staff Data Notes
• Faculty Attendance data is based on information submitted by school districts at the end of the school year.
Changes for the 2017-18 reports
• Teacher to Administrator ratios are new for 2017-18.
• Teacher and Administrator Demographics is new to the 2017-18 reports.
Which reports include this information
• This section appears in all reports.
2017-18 Performance Reports Database
• Worksheets include: (1) TeachersExperienceCertification, (2) AdministratorsExperience, (3) StudentToStaffRatios, (4) TeachersAdminsLevelOfEducation, (5) TeachersAdminsOneYearRetention, (6) FacultyAttendance, & (7) TeachersAdminsDemographics
Statewide Educator Equity Data
The “Statewide Educator Equity Data” table is available only in the state-level School
Performance Reports. The table shows the percentages of students with at least one teacher
who is out-of-field, ineffective, and/or inexperienced based on years teaching in a given district.
A teacher is out-of-field if they are teaching outside of their area of certification as determined
by NJDOE. A teacher is ineffective if they receive an annual summative evaluation rating of
“ineffective” on the AchieveNJ evaluation system, mandated by the TEACHNJ law. A teacher is
inexperienced if they have fewer than four years of prior experience within a given district.
The table (Figure 64) shows comparisons between Low Income Students in Title I schools and
Non-Low Income Students in Non-Title I schools and between Minority Students in Title I
schools and Non-Minority Students in Non-Title I schools to show possible educator equity gaps
across New Jersey.
Figure 64 - Statewide Educator Equity Data
Low-income students are students eligible for free or reduced lunch, identified as
“economically disadvantaged.” Minority students are students of color, which includes the
following student groups: American Indian or Alaska Native, Asian, Black or African American,
Hispanic/Latino, Native Hawaiian or Other Pacific Islander, and two or more races.
Statewide Educator Equity Data Notes

NJ School Performance Reports Reference Guide 64
Category Statewide Educator Equity Data Notes
Source of information
• Educator equity data is based on student enrollment, course enrollment, and certified staff data submitted by school districts, as well as teacher certification data. Staff are identified as teachers based on the job codes that are assigned to staff by school districts in the information that they submit.
• Evaluation data is based on information submitted by districts through the Evaluation Score Certification Tool.
Which reports include this information
• The Statewide Educator Equity Data table only appears in the state-level school performance report.
2017-18 Performance Reports Database
• Worksheet includes: (1) StatewideEducatorEquity
Accountability
The Every Student Succeeds Act (ESSA) was passed in December 2015 and replaced the No
Child Left Behind Act (NCLB) of 2002. The purpose of this law is to ensure that all students
have equitable access to high-quality educational resources and opportunities, and to close
educational achievement gaps.
As required by this law, New Jersey has developed a state plan for how states will identify the
schools in need of the most comprehensive and targeted support. ESSA requires states to use
a set of indicators to measure the performance of all schools. More information about how New
Jersey is meeting these requirements is available in the New Jersey ESSA plan overview.
Additional resources about how schools are identified for support are available on the NJDOE
School and District Accountability page.
Comprehensive Status (School-Level Reports)
This table (Figure 65) shows whether the school is identified as requiring Comprehensive
Support and Improvement during the 2019-20 school year and whether the school is eligible to
exit comprehensive status in January 2021 or January 2022. Schools must meet exit criteria to
exit status.
Schools identified as requiring Comprehensive Support and Improvement are schools
with a summative score in the bottom 5% of Title I schools or with a four-year graduation rate of
67% or less.
Figure 65 - Comprehensive Status

NJ School Performance Reports Reference Guide 65
Targeted Status (School-Level Reports) This table shows whether one or more student groups in the school has been identified as
requiring Targeted Support and Improvement during the 2019-20 school year and whether the
school will be eligible to exit targeted status in January 2021 or January 2022.
Schools identified as requiring Targeted Support and Improvement are schools where any
student group has a summative score that would be in the bottom 5% of schools and/or with
student groups that missed annual targets for all indicators for two years in a row.
Schools identified as requiring Comprehensive Support may have student groups identified as
needing target support in this table as reference, but the date at which they are eligible to exit
status is based on their comprehensive status.
Figure 66 - Targeted Status
Schools Identified as Requiring Comprehensive or Targeted Support (District-
and State-Level Reports) This table appears in district-level reports and the statewide report and provides the list of
schools in the district or across the state that are identified as requiring Comprehensive or
Targeted Support and Improvement during the 2019-20 school year.
Schools identified as requiring Comprehensive Support and Improvement are schools
with a summative score in the bottom 5% of Title I schools or with a four-year graduation rate of
67% or less. Schools identified as requiring Targeted Support and Improvement are
schools where any student group has a summative score that would be in the bottom 5% of all
schools and/or with any student groups that missed annual targets for all indicators for two
years in a row.
If a school requires Targeted Support and Improvement, the last column of the table lists the
student groups that were identified. Schools requiring Comprehensive Support may also be
shown as requiring Targeted Support in this table to help schools identify student groups that
may need additional support. The date at which they are eligible to exit status is based on when
they were identified for Comprehensive Support.

NJ School Performance Reports Reference Guide 66
The schools on this list may have been identified based on data from either the 2016-17 or
2017-18 school year; see the school-level performance reports for more details.
Figure 67 - Schools Identified as Requiring Comprehensive or Targeted Support
Accountability Indicator Scores and Summative Rating The “Accountability Indicator Scores and Summative Rating” table shows the indicator scores
for each indicator included in the ESSA accountability system and the weights that each
indicator received in the overall Summative Score. Indicator scores were only calculated if data
was available for at least 20 students. Weights may have been redistributed if an indicator score
was not available and those weights will be flagged by a †.
Figure 68 – Accountability Indicator Scores and Summative Rating
The indicators included in the ESSA accountability system, as well as the weights applied to
each indicator, vary based on school grade configuration. In developing the weights for the
indicators in ESSA, the NJDOE followed a set of principles that reflected the diverse needs of
New Jersey students, the pervasive achievement gaps, and input from stakeholders.
Different indicators and weights were used for elementary and middle schools with no high
school grades, high-schools, and schools with mixed grade configurations that serve both high
school and elementary/middle school grades. For the 2018 reports, they are as follows:
ESSA Accountability Indicators and Weights

NJ School Performance Reports Reference Guide 67
Weights for schools with 20 or more English Learners
Indicator Group Indicator
Indicator Weights for Elementary and Middle Schools*
Indicator Weights for
High Schools*
Indicator Weights for
Schools with Mixed Grade
Configurations*
Academic Achievement
ELA Proficiency 15% 15% 10%
Academic Achievement
Mathematics Proficiency
15% 15% 10%
Academic Progress ELA Growth 20% n/a 12.5%
Academic Progress Mathematics Growth 20% n/a 12.5%
Graduation Rate 4-year Graduation
Rate n/a 20% 12.5%
Graduation Rate 5-year Graduation
Rate n/a 20% 12.5%
English Language Proficiency
Progress to English Language
Proficiency (ELP) 20% 20% 20%
School Quality or Student Success
Chronic Absenteeism 10% 10% 10%
Weights for schools with fewer than 20 English Learners
Indicator Group Indicator
Indicator Weights for Elementary and Middle Schools*
Indicator Weights for
High Schools*
Indicator Weights for
Schools with Mixed Grade
Configurations*
Academic Achievement
ELA Proficiency 17.5% 17.5% 12.5%
Academic Achievement
Mathematics Proficiency
17.5% 17.5% 12.5%
Academic Progress ELA Growth 25% n/a 15%
Academic Progress Mathematics Growth 25% n/a 15%
Graduation Rate 4-year Graduation
Rate n/a 25% 15%
Graduation Rate 5-year Graduation
Rate n/a 25% 15%
English Language Proficiency
Progress to English Language
Proficiency (ELP) n/a n/a n/a
School Quality or Student Success
Chronic Absenteeism 15% 15% 15%
*Indicator weights may have been adjusted for individual schools if data were not available for
20 or more students for one or more indicator.
The “Accountability Indicator Scores and Summative Rating” table only shows the indicators
that apply to each school based on grades served. The Progress Towards English Language
Proficiency is new for 2017-18.
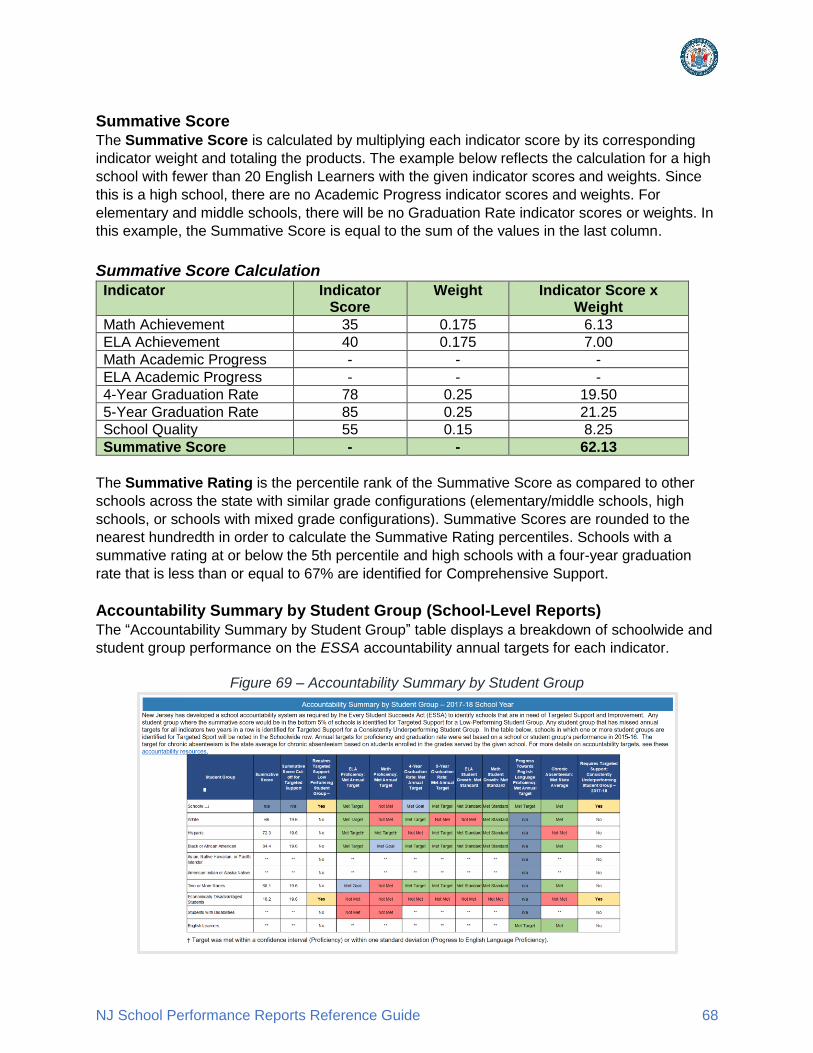
NJ School Performance Reports Reference Guide 68
Summative Score The Summative Score is calculated by multiplying each indicator score by its corresponding
indicator weight and totaling the products. The example below reflects the calculation for a high
school with fewer than 20 English Learners with the given indicator scores and weights. Since
this is a high school, there are no Academic Progress indicator scores and weights. For
elementary and middle schools, there will be no Graduation Rate indicator scores or weights. In
this example, the Summative Score is equal to the sum of the values in the last column.
Summative Score Calculation
Indicator Indicator Score
Weight Indicator Score x Weight
Math Achievement 35 0.175 6.13
ELA Achievement 40 0.175 7.00
Math Academic Progress - - -
ELA Academic Progress - - -
4-Year Graduation Rate 78 0.25 19.50
5-Year Graduation Rate 85 0.25 21.25
School Quality 55 0.15 8.25
Summative Score - - 62.13
The Summative Rating is the percentile rank of the Summative Score as compared to other
schools across the state with similar grade configurations (elementary/middle schools, high
schools, or schools with mixed grade configurations). Summative Scores are rounded to the
nearest hundredth in order to calculate the Summative Rating percentiles. Schools with a
summative rating at or below the 5th percentile and high schools with a four-year graduation
rate that is less than or equal to 67% are identified for Comprehensive Support.
Accountability Summary by Student Group (School-Level Reports)
The “Accountability Summary by Student Group” table displays a breakdown of schoolwide and
student group performance on the ESSA accountability annual targets for each indicator.
Figure 69 – Accountability Summary by Student Group

NJ School Performance Reports Reference Guide 69
Annual targets for proficiency and graduation rate are based on school and student group
baseline performance in 2015-16. ELA and Math proficiency annual targets reflect the
percentage of students who must score at either Level 4 or 5 on the PARCC assessment or
Level 3 or 4 on the DLM to ensure the school or student group is on track to meet the long-term
academic achievement goal of 80% by 2030.
The four-year and five-year graduation annual targets reflect the percentage of students in the
graduation cohort who must graduate to be on track to meet the long-term four-year graduation
rate goal of 95% and the long-term five-year graduation rate goal of 96% by 2030.
Annual targets for student growth were set by the NJDOE and reflect whether a school or
student group met the standard for growth with a median Student Growth Percentile (mSGP) of
40-59.5 or exceeded the standard with an mSGP of 60 or higher.
The target for Progress Towards English Language Proficiency represents the mean
percentage of English Language Learners (ELLs) meeting progress. Separate means or targets
were defined for schools that end in grade 5 or lower and all other schools.
Targets for chronic absenteeism reflect the statewide average for all student enrolled in the
grades represented in the school who were absent for more than 10% of the days for which they
were enrolled.
The table shows the summative score for each student group and the summative score cut-off
for schools to be identified as requiring comprehensive support. If any student group in the
school has a Summative Score below that cut-off, the school will be identified as requiring
targeted support for a low performing student group. Summative scores were rounded to the
nearest hundredth to identify schools requiring Targeted Support. The schoolwide row indicates
whether one or more student groups in the school were identified for targeted support for a low
performing student group.
The next set of columns in the table shows whether the school or student group met 2017-18
targets for each indicator. Schools in which one or more student groups have missed annual
targets for all indicators for two years in a row are identified as requiring targeted support for a
consistently underperforming student group.
Accountability Summary by Student Group (District-Level Reports) Within the district-level School Performance Reports, the “Accountability Summary by Student Group” table displays a breakdown of districtwide and student group performance on the accountability indicator targets.

NJ School Performance Reports Reference Guide 70
Figure 70 - Accountability Summary by Student Group (District Level)
More details about the specific goals for each indicator can be found in the corresponding
sections of this Reference Guide:
Academic Achievement (ELA and Math proficiency) Student Growth (ELA and Math mSGP) Chronic Absenteeism Graduation Rates (four-year and five-year)
Accountability Data Notes
Category Accountability Data Notes
Source of information • See specific information for each indicator in this guide for
information the source of data used to calculate each indicator.
Changes for the 2017-18 reports
• The Comprehensive Status, Targeted Status, and Schools Identified as Requiring Comprehensive or Targeted Support tables are new for 2017-18.
• Progress to English Language Proficiency is now included in accountability tables.
Which reports include this information
• The Accountability section will not be included for “Not Tested” schools and districts.
• The “Comprehensive Status”, “Targeted Status”, and "Accountability Indicator Scores and Summative Rating" tables will only appear in school-level reports.
• The “Schools Identified as Requiring Comprehensive or Targeted Support” table will only appear in district-level and state-level reports.
Minimum Number of Students Required for ESSA accountability
• The minimum number of students (n-size) required for all accountability purposes and calculations is 20. This n-size is applied to calculations at district, school, and student group levels for all indicators. A ** will appear in the reports if the group size is less than 20.
2017-18 Performance Reports Database
• Worksheets include: (1) CompTargeted, (2) CompTargetedList, (3) AccountabilityIndicator, & (4) AccountabilitySummary

NJ School Performance Reports Reference Guide 71
Narrative
The Narrative section allows schools and districts to share highlights, achievements, and other
important information about programs, activities, and services that are offered. Schools and
districts are provided the opportunity to offer insight into areas not limited to their mission,
curriculum, clubs and athletics, and parent involvement.
Schools and districts were able to choose the categories that would be included in their report.
Any questions about the information included in the narrative should be directed to the school or
district.
Figure 71 – Narrative
Narrative Data Notes
Category Narrative Data Notes
Source of information • Narrative data was submitted by school districts through a
collection at the end of the school year.
Changes for the 2017-18 reports
• New categories were added for 2017-18: School Safety, Technology and STEM, Early Childhood Education.
Which reports include this information
• Narrative data is available for school- and district-level reports only (not state-level).
2017-18 Performance Reports Database
• Worksheet includes: (1) Narrative
School Performance Report Additional Resources
What to do if… Action
I want to give feedback, suggest improvements, or request additional data for future reports?
Fill out our Feedback Survey or contact the NJDOE Report Card.
I want more data about my child or school that is not in this report?
Contact your school.
I’m having technical issues with the reports? Contact the NJ SMART Helpdesk.

NJ School Performance Reports Reference Guide 72
What to do if… Action
I’m a school/district employee and I want to flag an issue with the data?
Contact the NJ SMART Helpdesk.
I have questions about how to understand the data in the reports?
Contact the NJ SMART Helpdesk.
I want to know how my school/district is addressing performance?
Contact your school or district.
I’m looking for previous year reports? Choose your school year of choice from the Search for Reports page.
I want to know what courses/programs are offered at my school?
Contact your school.
I’m looking for a list of schools in the state? View the NJ School Directory.
I’m a researcher and I want to request data for a research project?
Contact the NJDOE Report Card.
Learn more
Click the links below to learn more about each of the topics listed:
‐ Demographics and Enrollment
‐ New Jersey State Assessments
‐ DLM Assessment (Alternate Assessment)
‐ ACCESS for ELLs 2.0 English Language Proficiency Test
‐ NJASK Science Assessment Data
‐ New Jersey Student Learning Assessment - Science
‐ Student Growth Percentiles (SGP)
‐ PSAT/SAT Data
‐ ACT Data
‐ Advanced Placement (AP) Courses/Tests
‐ International Baccalaureate (IB) Courses/Tests
‐ New Jersey Student Learning Standards
‐ Seal of Biliteracy
‐ Visual and Performing Arts
‐ Career and Technical Education (CTE)
‐ Structured Learning Experiences (SLE)
‐ Graduation Rates
‐ Dropout Rates
‐ Postsecondary Enrollment
‐ Attendance/Absenteeism Data
‐ Length of School Day
‐ Suspensions and Expulsions

NJ School Performance Reports Reference Guide 73
‐ Violence, Vandalism, and Substance Abuse
‐ New Jersey Digital Learning and Assessment
‐ New Jersey User Friendly Budgets
‐ NJDOE Finance District Report Search
‐ Staff Certification
‐ New Jersey’s ESSA state plan