nj1 j/~, - agecon searchageconsearch.umn.edu/bitstream/171866/2/tb1438.pdfillinois, urbana, aided in...
TRANSCRIPT

--
2 8 2 5 1111
W ~~ w 2 ~ I~ ~
L 11 u e~
11u ---1~middot8
1111125 1111114 1111116 1111125 1111114 1111116
MICROCOPY RESOLUTION TEST CHART MICROCOPY RESOLUTION TEST CHART NATIONAL BUREAU OF STANDARDS-1963-A NATIONAL BUREAU OF STANDARDS-1963-A
REFERENCE DO fnT I nJ1 l j~ ~
Bioassay of Clover Wound Tumor Virus and The Mycoplasmalike Organisms
of Peach Western X
and Aster Yellows
h ~ lt1 ~
9 ~ Technical Bulletin No 1438
Q l -9 ~
Agricultural Research S0rvice
UNITED STATES DEPARTMENT OF AGRICULTURE
ACKNOWLEDGMENTS
L M Black has graciously permitted use of previously unpublished data from research supported in part by National Science Foundation grant GS-I022 and National Institutes of Health grant AI-030l3 D D Jensen has permitted similar use of data from US Public Health Service lesearch grant AI-03490 from the National Institute of Auergy and Infectious Diseases to the University of Oalifornia O(tain data on the aster yellows agent were taken from collaborative work with R L Steere Leader anti R E Davis Plant ViTology Pioneering Research Laboratory Plant Science Research Division Agricultural Research Service USDA Beltsville Mel Oonceptual discussions with all the above collaborators and with H W Norton Department of Animal Science University of Illinois Urbana aided in formulations of principles of bioassay l1yron K Brakke USDA Lincoln Nebr made many helpful suggestions on the manushyscript Responsibility for errors however rests vith the author
III
CONTENTS page
Introduction_ ___ _____ _____ __ _ _ _ _ ___ ___ _ _ __ _ _ _ 1 The problem_ _______ ____ __ ______ _____________ 2 ~1ethods_____________________________________ 2
Test insects_ ___ ___ ___ _ _ __ ___ __ ___ _ _ _ _ _ _ _ _ _ _ 2 Needles___ ___ _ _ _ ______ __ ____ __ _ _ _ __ ____ _ _ _ _ 2 The injection procedure______________________ 3 Mortality 01 the injected insects______________ 3 Scoring of diseased insects____________________ 3
Incubation periods in plants____________________ 4 Wound tumor virus_________________________ 4 Western X-disease agent_____________________ 6
Quantal response assays________________________ 9 Dilution curve theory _ _ _ _ ___________________ 9 Dilution curve of WTV______________________ 10 Dilution curve of the WX agent______________ 10 Factors possibly affecting dilution curves_______ 14
Graded-response assays___________ ______ _______ 18 Dynamics of infection process________________ 19 Tso method_____ ____________________________ 19 Latent-period method_ ___ __ _ _ _ __ ___ _____ ___ _ 19
Latent periods in the vectoL_________________ 20 Total-Iatent-period method___________________ 24
Summary and discussion_______________________ 25 Literature cited____ ____ __ ______ _ _ _ _ _ _ __ _ _ ___ _ _ 28
Washington DG Issued January 1972
For sale by the Superintendent of Documents US Government lrlntlng olllcll WlIIhng~n DC 20402- Price 20 cents
Stock number 0100-1413
Bioassay of Oover Wound Tumor Virus and
the MycoplasmalikeOrgatnisms of Peach Western X
and Aster Yellows R F WHITCOMB Re8earch Entomologi8t
Entomology Re8earch ])ivi8ion AgricuUuraZ Re8earch Service
INTRODUCTION Chiu and others (12 13)1 recently developed a method of assaying
phytarboviruses (53) on monolayer cultures of leafhopper cells (5) This method the development of which culminated a decade of efforts and progressive advances (232426323344) may for some disease agents at least replace insect injection a technique which is by contrast one of the most cumbersome and laborious of assay methods
In 1967 it was suggested (15 25) that the agents of yellows diseases may be organisms such as mycoplasmas or chlamydiae Recently preliminary reports on cultivation (1130) have appeared If the currently held theory of etiology proves to be true many leafhopper-borne disease agents that are currently assayed by injecshytion may eventually be assayed by councing colonies on agar plates It is unlikely however that injection of insects will ever be abanshydoned as a research tool Some plant disease agents that propagate in their vectors may not prove amenable to tissue-culture assays Certain agents such as that of peach Western X-disease are acquired by their vectors so poorly from known plant hosts that injection may be a preferred method of infecting insects (26 56) Even for agents that are acquired easily by their insect vectors injection provides a means of standardizing dosage and the approximate time at which infection begins New plant disease agents will need to be studied by this means Thus there is a continuing need for an understanding of the events occurring after injection especially aspects relating to assay (50)
I Italic numbers in parentheses refer to Literature Cited p 28
1
2 TECENICAL BULLETIN 1438 US DEPT OF AGRICULTURE
THE PROBLEM
Various solut50ns containing particles of a plant disease agent or dilutions of the solutivns are injected into a number of insects Although the number of test insects is theoretically unlimited the patience of an operator is usually tlxhausted by the time 400 to 600 insects have been injected Furthermore if subsequent infection of the insects is to be verified by means of test plants there will prove to be a limiting number of plants that can be maintaineel in the available facilities Given these limitations the problem is to derive from the admittedly laborious procedU1e not only a maximum effishyciency of estimation but any other information that may be incidentally available
METHODS
Test Insects
For assays of clover wound tumor virus (WTV) the vector Agallia constlicta Van Duzee was injected The vector Oolladonus montanus Van Duzee was used for assays of the agent of peach Western Xshydisease (WX) and Macrosteles fascifrons (Stal) was injected with the aster yellows (AY) disease agellt
With all three of these leafhopper species last-instal nymphs collected shortly before molting to the adult stage are most desIToble as test insects Such nymphs are of known age are usually highly susceptible to infection are easily pierced by sharp needles and are more likely to survive the injection operation than adults However if the total-latent-period assay method is used in which insects are maintained for long periods on test plants it may be necessary to select young male insects This prevents the deposition of eggs and the destruction of the test plant by the progeny
After collection the insects should be stored at temperatures slightly above freezing in a moist chamber to prevent desiccation They are injected under a continuous flow of moist 002 at room temperature under a dissecting microscope after which they should be returned as soon as possible to a healthy preferably immune plant upon which they slllvive well
Needles
Whereas much classical work has been done with needles pulled in gas flames (47) those who have been introduced to machine-pulled needles will certainly insist on them Not only do machines produce a uniform product but many including myself are unable to produce any neeelle of their quality in a flame
3 IIOASSAY OF VIRUS AND MYCOPLASMALIKE ORGANISMS
The Injection Procedure
If inoculum is freshly prepared and is kept cold in an ice bath it will not coagulate even if it is a crude extract from plants or insects Small amounts of liquid are drawn into the needle with a low vacuum small amounts are expelled by momentarily closing off a T-Joint inshyserted into the compressed-air line leadng to the needJe The alternashytive method of drawing up liquid and expelling it by mouth is made undesirable by saliva produced by the operator If large turgid nymphs have been selected the operation sh- dId proceed rapidly Groups of 10 anesthetized insects canoe injected in 1 to 2 minutes in this way exposure to lethal doses of 002 can be avoided
Mortality of the Injected Insects
Jensen and others (26) summarized the factors known to produce mortitlity of injected leafhoppers These included the WX disease agent bacterial contaminants (58) old age and a variety of effect-s a-scribed to wOlmding Premature de[th occasionally occurred in adults that had not been injected These deaths could possibly be ascribed either to microbial infection (36 58) 01 to poor nutrition during the immatme stages induced by the toxicity of the nymphs to the celery plants on which they were reared A single last-instal nymph produced enough toxin to kill a 2- Otmiddot 3-leafecl celery seedling
It is likely that if suitable insects are used if sufficient cara is taken to preclude microbial contamination if adequ[te nutrition is provided throughout nymphal instalS and if insects are rejected if they have been pierced more deeply than necessalT that 95- to 100-percent surviyal can be obtained
Scoring of Diseased Inseets
Much effort has been spent on the serological scoring of insects by the precipitiu ring test (52) fluorescent amibody test (35 45) ring time test (49 51) and hemagglutination (20 42) For agents that haye high antigen titers the Ouchterlony test (37) should also prove useful
Another method of scoring diseased insects-lethality of the agent to the ector-is available in the case of the VVX agent (26) Although percentages of surviving insects were clearly correlated with dosage Wh(ll high concontrations of inoeula wcre injected incidental deaths hopelessly obscured the result-s if lower concentrations were inj ected
Despite the introduction of other scoring methods most assays still require test plants Fllltholmoro until the tllnsmission of disease agents from insect to plant is well understood such phenomshy
4 TECHNICAL BULLETIN 1438 US DEPT OF AGRICULTURE
ena as the fate of insects on test plants the transmission of disease agents to plants and the course of the infection in the insects and plants will remain a reasonable area of interect to vector specialists
INCUBATION PERIODS IN PLANTS
Wound TUlDor Virus
The incubation period of WTV ill crimson clover (length of time from the date insects were placed on the plan~ to the first date of symptomatic expression) varied from Hi to 60 days The distribution of incubation periods had a range of about 30 days The frequency distribution curves (fig 1) were skewed to the left with a tail extending
1 4 6 9
5middotDAY INTERVAL FIGURE I-Distribution of incubation periods of WTV in crimson clover Modal
time for incubation period was usually 19 to 21 days after the start of a 7-day inoculation feeding interval on the plants
____________________________ _
____________________________ _
BIOASSAY OF VIRUS AND MYOOPLASMALIKE ORGANISMSj
to the right Although such curves seemed at first to give an equally good fit to the incubation periods from either first or subsequent transmissions by individual insects a chi-square analysis (table 1) demonstrated that first transmissions were somewhat molf- likely to result in lengthy incubation periods than subsequent ones
T ABLE l---Jluisquare test of significance between distributions of WTV incubation periods in first and subsequent transmissions
Incubation periods
Experiment and position of transmission First four Last two Total 5-day 5-day for each
intervals intervals position
Number Number Number Experiment No1First____________________________ _
1 15 1 16 Other___________________________ _ 13 o 13
Experiment No2 Fi~t 17 3 20 Othcr___________________________ _ 27 o 27
Experiment No3 Fi~t______________ ---_- ___ -_ ----- 18 8 26
22 3 25Other_____-----------------------Experiment No4
First________________ - ____ - -- ----- 13 2 15 Other___________________________ _ 44 3 47
Experiment No5 Fi~t 2 108Other___________________________ _ 49 6 55
Totals Fi~t____________________________ _
71 16 87 Other_______________________ --- shy 155 12 167
Total for cach set of intervals __________ _ 226 28 254
x2 observed =73 x2 (=005)=384 x2 (=001)=663
1 Numbers of incubation periods of WTV in crimson clover 42G-718--71----2
6 TECID1iICAL BULLETIN 1438 US DEPT OF AGRICULTURE
W ~stern X-Disease Agent
The first celery plants infected in a series of transmissions by a given vector frequently develop WX symptoms only after an nnshyusually long incubation period Kunkel (28) noted a similar phenomshyenon with the aster yellows disease agent
These classical observations have now been extended with WX to the entire period of inoculativity of the vector As shown in figme 2 inoculativity of WX by its vector after an initial steep rise dcrnases to levels as low as those in early stages of infection If this decrease in transmission results from lower concentration of agent being inoculated into the plant then incubation periods in celery should show a corshyresponding increase For example) Lhe last transmission in a sedes should result in a longer incubation period The data of figure 3 support this expectation
We have also noted that incubation periods preceding and following skips in transmission by single insects also tend to be longer than other transmissions in the series Duffus (16) has made similar obsershyvations with aphid vectors Although the titer of WX in O montanu8 probably reaches higher levels than many other disease agents in their vectors transmission of the WX agent to celery is very poor
10-1
ZIOO -- 10-2
0 tr---ltgt 10-3u
Cf)
0---ltgt 10-4
Cf) 7~Z ltta I shy
~ 50 ~ W LLI ~
I- 25 Z uJ U 0 W 0 0 0 20 30 40 70 eo 90
DAYS AFTER
FIGURE 2-Transmission of the Western X-diseaselgent in weekly inoculation interv1ls on henlthy celery following injection of scrinl tenfold dilutions of extract from infected vectors Only insects that at some time transmitted WX werc used in the calcUlations Inlerpretntion of dosnge relationships has been discussed in a previous publicntion (54)
7 ~IOASSAY OF VIRUS AND MYCOPLASMAIIKE ORGANISMS
If 40 30
30 yransmission
0 31
-() 32
~ C-gt 33 a w I W34 ()
bull
I I I I
20
10
04
m tJ () m z ~ G) m
-f AJ lgt Z VI 3
0 35
Q cr ~36
I --IncubationI period
-02 VI VI 0 Z
Z 237 I ~ lXI I J 38 U z I
39 I I
2 3 4 5 6
TRANSMISSION NUMBER
FIGCRE 3-Two methods of measuring amount of western X-disease agent transshyptitted to celery by Colladomts monanus Solid line represents percentage of infected test plants over the 6-week course Dotted line represents the incubation period of the infections in celery initiated during the same 6-week course
Therefore a plant such as celery which happens to be very poorly susceptible to a particular disease agent is a good tool for studying variations in the inoculative potential of vectors Thus the system has pronded the best evidence to date tbat leafhopper vectors do in fact have different inocula ti-e po tentials from time to time ra ther than a simple ability or disability to transmit
Insects transmitting the wx agent tend to undergo a definite
8 TECHNICAL BULLETIN 1438 US DEPT OF AGRICULTURE
transmission-free period (TFD) before death The duration of this period depends (fig 4) on the age of the insect at the time of death The presence of such a period before death when insects failed to transmit WX seems at first to suggest a discontinuous change in the vectors status from transmitter to nontransmitter There is some histological evidence for such a change (56) Serous cells of O montanus are eventually destroyed by WX infection but the other nine cell types of the principal salivary gland despite certain cytological changes (56) apparently remain more or less functional
We have speculated (56) that multiplication of WX agent in serous cells may be required for transmission The dependence of the length of the TFD on longevity of the vector (fig 4) however suggests that histopathological changes induced by WX may not greatly affect the transmission mechanism The longe-vity of vectors varies conshysiderably within groups of insects treated iden tic ally (insects living
o 6
5 a u I shyu 4 o I shy83 VECTORS INOCULATED WITH a lJJ bull 10-1or 10-2 brei ~2 gt o o Feeding or 10-11 brei (f) bull
20 30 40 50 60 70 80 90
MEAN DAY OF DEATH
FIGURE 4-Dependence of the number of transmission-free days (TFD) before the death of Colladonus montanus adults upon the longevity of the vector (Mean day of death=days after injection of WX agent) Because longevity of the vectors depended on the injected concentration or route of entry of WX two lines were drawn One for the more concentrated inocula (10-1 or 10-2
dilutions of extract) and another for more dilute inoculum (10-3 dilution) or for infections initiated when insects fed on diseased plants
BIOASSAY OF VIRUS AND MYCOPLASMALIKE ORGANISMS 9
as long as 83 days after injection were found to carry advanced histopathological symptoms (57)) It is doubtful that infected insects failing to transmit WX for 10 to 36 days before death suffered all the while from total loss of a vital function such as salivation It is significant also that insects that happened to die during early stages of infection transmitted well in their last inoculation interval
In summary WX transmission probably decreases to a certain extent for reasons related to aging and decreased feeding rate of the insect as in the transmission of pea enation mosaic virus (48) Howshyever the major cause of decrease in inoculativity is probably a steep decay of WX agent after the initial growth phase Decreases due to failure of individual serous cells to secrete watery saliva or total impairment of transmission as a result of the failure of all serous cells may occur to a limited extent but probably are relatively unimporshytant factors in the overall transmission flurve
QUANTAL RESPONSE ASSAYS
Dilution Curve Theory
Brakke and others (10) interpreted WTV dilution curves by a graphical method Logarithms of the percentages of leafhoppers that infected crimson clover were plotted against the logarithms of the concentrations of virus extract originally injectedinG~l the insects It was found that the points fell approximately upon a straight line in the range of 0 to 50 percent infected insects Dilution curves of extracts to be compared were therefore fitted to straight lines of the same slope and differences in concentration were estimated graphically
The above method is in contrast to the classical Poisson dilution theory as applied to bacteriophage (17) animal viruses (38) sigma virus of Drosophila (39) and wheat streak mosaic virus on individual wheat plants (89)
According to the Poisson interpretation the chance presence or absence of a virus particle at the site of initiation of infection is responsible for the characteristic dosage mortality curve obtained The proportion Q of insects that receive no particle at the site of infection is e- where e is the base of natural logarithms and x is the average number of infectious particles reaching the infection site ie the concentration of particles at the infection site If the initial concentration of particles in the extract is c the concentration of a dilution of that extract is xfn
where f is the dilution factor and n the number of times the extract has been diluted Then Q=e-ctn and
10 TECENICALBULLETIN 1438 US DEPT OF AGRICULTURE
loge ~=cfn A plot therefore of 10glO loge J against 10glOc should give a straight line with unit slope
Dilution Curve of WTV
Data from two published sources (6 10) were analyzed as well as data not previously published in their entirety obtained in the study of vectorless WTV (7) None of the three sets of data gave a good fit to Poisson theory When 10glO log ~ was pbtted against the logashyrithm of virus concentration the best-fitting straight lines determined graphically gave slopes of 067 050 and 048 In only one of the 26 dilution curves examined was a slope as great as 100 obtained
Figure 5 and table 2 show the result of two unsuccessful attempts to fit the data (6 10) graphically to the theoretical curve In each case there was a wide discrepancy between theoretical and observed values Such deviations are considered to be too serious to justify application of the theoretical dilution curve to data so far obtained Under these circumstances there seems to be no reason why the Bcheme of Brakke and others (10) should not be used as an empirical method (49)
Dilution Curve of the WX Agent
Whitcomb and others (54) in earlier experiments used tenfold dilution steps In two later experiments however half-log dilution steps were used (tables 3 and 4)
The results of one experiment (table 2) indicate that percentages of infected vectors can in rare instances be meaningless as indicators of the concentration of agent that was injected An error in labeling solutions or insects seems to be precluded by the latent periods in the insects which were normal for each injected concentration Furthermore no conceivable reconstruction of the data assuming mislabeling would improve its conformity to expectation Finally whereas in this experiment there was a large fraction of immune insects it was not unusual to observe smaller percentages of seemshyingly immune insects in other injection experiments Recent research suggests two possible mechanisms for immunity We have observed in the course of our WX stumes that adipose cells were altered by stress Sillce adipose tissue might be the major site of infection after injection of the Western X-disease agent physiological [tlteration of such cells might render the insecijs immune Recent suggestions (1525) that agents of yellows diseaRcs may be Mycoplasmalike agents offer ttnother possible explanation infection with a Mycoplasma not
BIOASSAY OF VIRUS AND MYCOPLASMALIKE QRGANISyenS 11
~
---Theoretical -Observed
1 15 2 25 3 35 LOG 10 VIRUS CONCENTRATION
FIGURE 5-Data of Brakke and others (10) eye-fitted to the best-fitting straight line The slope of the observed line is 067 compared with the value of 100 predicted by Poisson theory The logarithm of virus concentration at the hlghest dilution was arbitrarily taken to be 10i therefore the abscissa is a measure of relative virus concentration
pathogenic to plants might protect a leafhopper against an agent that does cause plant disease Such an agent has recently been visualized by electron microscopy (36) and would be expected to be present in the injected extracts
In a second experiment a number of special precautions were taken O montanus adults carrying the Western X-disease agent were exshytracted in 10 ml 085 percent N 001 emulsified with Genetron 113 and clarified very briefly at 1000 g after which the pH was adjusted to 73 This extmct was centrifuged for 10 minutes at 5000 rpm
12 TECHNICAL BULLETIN 1438 US DEPT OF AGRICULTURE
TABLE 2-Analysis oj quantal response Attempt to fit data oj Black and Brakke (6) to a PflisS071 distribution
[P=observed fraction of transmitting insects Q=l-P which according to the Poisson interpretation = l-e-x where x is the average number of successful particles per insect According to the Poisson interpretation the calculated c values (xd where d is the dilution) should be homogeneous for the three dilutions of each passage]
c dilution I-P Q=x
Passage Log1o d P Q= Loge
Number 1 -2 1 030 070 036 O 36
-3 10 05 95 05 50 -4 100 05 95 05 5 00
2 -3 1 19 81 21 21 -4 10 04 96 04 40 -5 100 00 100 00
3 -3 1 20 80 22 22 -4 10 15 85 16 1 60 -5 100 06 94 06 6 00
4 -2 1 41 59 52 52
-3 10 11 89 12 120 -4 100 00 100 00
5 -2 1 37 63 46 46 -3 10 17 83 19 1 90 -4 100 04 96 04 4 00
6 -2 1 54 47 76 76 -3 10 bull -_0 75 29 290 -4 100 00 1 00 00
7 -2 1 57 43 84 84 -3 10 25 75 28 280 -4 100 07 93 07 7 00
BIOASSAY OF VIRUS AND MYCOPLASMALIKE ORGANIampS 13
TABU) 3-Analyw of fIUantal response Abnormal d~lution curve of WX agent
Dilution 1 Fraction transmitting 2 LP
Number Number Percent Days 3
10-1 bull0 1133 33 24 10-15 424 17 23 10-2 bull0 226 08 28 10-U 728 25 26 10-30 430 13 26 10-3 1 728 25 26 100f bullo 1235 34 30 10-U 1225 48 34 10-50 1127 41 32
I Dilution calculated on basis of the original weight of extracted insects 2 Numbers of insects transmitting WX agent to celery test plants divided by
the number of insects surviving through the possible latent period 3 Latent periods of WX agent in individual vectors were assumed to be the
midpoint of the interval during which their first WX transmission to celery ocshy
curred The average latent period (LP) for a group was calculated r~Pi where
LP j was the latent period of a single vector and N was the number of latent periods observed
in the SW 39 L rotor of the Spinco 2 Model L centrifuge Half-log dilutions of the supernatant were made in 01 M glycine 001 M Mg012 001 M NaaS03 after which 50 nymphs were injected with each dilution within 1M hours of final centrifugation
The results (table 4) do not conform to Poisson dilution curve theory in one important respect Apparently only about 83 percent of test insects were susceptible to the WX agent Therefore observed percentages should be transformed by multiplying them by 12 in effect ignoring the hypothetical immune insee-ts When this was done the series of percentages obtained were compatible with Poisson statistics (table 4) Of course if percentages of infection of susceptible insects do not follow the Poisson distribution such a transformation will not improve the conformity to Poisson statistics
2 Trade names are used in this publication solcly for the purpose of providing specific information Mcntion of any specific equipment trade product or comshymercial company does not constitute a guarantec or warranty of the product by the US Department of Agriculture or an endorsement by the Department over similar products or companies not mentioned
42~713--71----3
14 TEC~CAL BULLET~ 1438 US DEPT OF AGRICULTURE
TABLE 4-Analysis of quantal response WX dilution cwve
Insects responding Log dilu- Fraction 8 P(12) 7LP 8LPT tion 1 Positive 2 Negative 3 Unknown ~ transmitshy
tingS
Number Number Number Percent Percent Days Days 10 33 7 5 825 99 22 0 624 15 35 6 7 854 100 263 632 2 0 21 5 9 808 97 30 1 69 3
2 5 22 12 12 64 7 78 308 66 1 30 10 23 12 303 36 32 1 664 3 v 2 24 12 7 7 9 9 31 9 9 66 5
40 0 37 5 O 0 0 4 5 1 32 12 30 4 9 35 0 9 59 0 5 0 0 35 9 O 0 0
1 Dilution calculated on basis of the original weight of extracted insects 2 Positives=number of insects transmitting WX agent to celery 3 Negatives=number of insects failing to transmit WX agent to celery despite
survival through the possible latent period ~ Unknown=number of insects that died before end of a possible latent period
and whose inoculative potential therefore was unknown S Fraction infected was computed from the positive-negative data oThe transformation P(12) was derived from the assumption that on the avershy
age only 833 percent of insects were susceptible to WX iufection The effect of this transformlltion is to ignore apparently immune insects
7 Latent periods of WX agent in individual vectors were assumed to be the midpoint of the interval in days during which their first transmission of WX agent to celery occurred The average latent period for a group was LP=~LPN where LP j was the latent period of a single vector and N was the number of latent periods observed
B The mean total latent period (LPr) was computed by averaging the total latent period (number of days between injection of WX agent into the insect and first appearance of symptoms in eelery plants inoculated by the insect) for each injected leafhopper that transmitted to celery
9 These numbers were calculated from very small sample sizes
Factors Possibly Affecting Dilution Curves
Effects of preinoculation storage and injected volume-Two effects were tested (1) The effect of injected volume (2) stolllge of vectors before injection In each experiment 200 large last-instal nymphs of A conslricta were collected and stored at 2deg C in a glass tube in the cold room but not in u moist chamber Groups of 50 were weighed then injected with i1 10-1 dilution of WrV-infected sweet clover root
BIOASSAY OF VIRUS AiD MYCOPLASMALIKE ORGAKlSMS 15
tumors in 0003 M KH2P04 00066 M K 2HP04 0225 M NaO Half of the vectors were injected with as little solution as could be inshytroduced half with as much as could be introduced After injection the insects were reweighed to determine the total weight of inoculum that had been injected into all insects in a group It was found that by the above technique the injected volume could be varied over a sevenfold range In addition nymphs stored in the cold room for 7 or 8 hours before injection accepted more injected fluid
All injected vectors were stored at room temperature in a moist chamber then transferred to Grimm alfalfa (Medicago sativa val Grimm) After 3 weeks on alfalfa the vectors were transferred in colonies of two to healthy crimson clover test plants for a 2-week inoculation access period Survival of the insects did not vary signifishycantly from group to group The transmission for colonies of two was recorded and calculated (52) into single-insect transmission (PI)
The PI values (table 5) varied widely from treatment to treatment A satisfactory interpretation of the results can be constructed as follows The principal storage effect is assumed to be upon the volume that can be injected Therefore differences in proportions of infected insects are ascribed to the differences in injected volume It is also assumed that in the range of volumes used the probability that It
single infectious particle will initiate infection does not depend on the volume This is equivalent to assuming that for example injecshytion of seven times as much inoculum of one concentration is the same as injectin~ the same volume of an inoculum seVln times as concentrated
To assess the proposed relationship betwecn volume and conClnshytration the relationship between conecntration tmd percentage infected vectors first needed to be assessed The test for conformity for the Poisson-binomial interpretation of dilution curves (plotting of 10glO loge ~ vs lOglO c) was performed
Although the deviation of such lines from unit slope excludes the Poisson interpretation (see Dilution Ourve of WTV p 10) the method provides an empirical method for plotting transmission pershycentages Data from the two experiments reported here could be best fitted to a straight line (fig 6) with a slope 057 which is very similar to dilution-curve slopes This suggests thut volume errol in insect injection can be partly controlled by measmillg the magnitude as a mean for a group of injected insects and then correcting the concentrations as calculated by dilution
Because variations in the volumes of injected inocula arc almost certainly random they would not be expected to result in sY8tematic deviation of the dilution curve from a theoretical slope Single points
I- 0)
TADLE 5-E ffect of injected volume and lJre-inoculation storage on fraction of WTV-infected insects after injection 8 ~
Experimental treatment Experimental results- Calculated values Colonies of two infective Experiment number I and time
stored at 2deg C Time in moist Calculated
~
Initial Gain in chamber at Fraction Percentage percent single Confidenceweight weight room insect trans- inwrvals 3
temperature mission 2
HOUTS Grams Gram8 Hours Number Percent Percent ~ Experiment No1
15________ ________________ a75 ________________________ 00833 00036 75 022 41 23 35-12 co
0850 0008 65 321 14 7 16- 3 00775________________________
0799 005iamp75________________________ -------------- 1323 57 34 48-23
0761 =1 0015 -------------- 721 33 18 30-11 f1lExperiment No2200________________________
0938 0051 70 1822 82 58 72-42 tj275 ________________________ ~
0847 0014 75 1421 67 42 55-29800________________________ ~ 0847 0057 2123 91 70850________________________ -------------- 86-52
0803 0018 o-------------- 1422 64 40 52-28 IIj
gtshy1 Fifty nymphs were injected for each storage-time group in 3 Ninety-five-pereent confidence intervals for Ph determined ~ each experiment from confidence intervals for P2 determined graphically from 2 Fraction of single-insect transmission (PI) was calculated Clopper and Pearson in DOwn and Massey (14 p 415) ~
PI= 1- (1-P2)Jl g ~
BIOASSAY OF VIRUS AND MYCOPLASMALIKE ORGANISMS 17
30
1010
o cS 0 bull - - - - 95 confidence interval
--fitted line
---theoretical slope
1 15 25 3
LOG10k
FIGURE 6-Graphical analysis of data of table 5 The PI values for table 5 were converted to the appropriate logarithm (ordinate) Abscissa is the logarithm of the ratio of volume injected to the smallest volume (o=experiment I x=experiment 2) The fitted line with a slope of 057 is similar to dilution-curve slopes of WTV which indicates that fluctuations of volume or concentration produce similar effects on the fraction of injecteurod insects
on the curve however might be too high or too low as a result of high or low volumes being injected into some groups of insects The size of the orifice of the injection needle is the most probable source of such variation in routine assays
Specific inJectivity-The specific infectivity of disease agents varies widely (41) Errors resulting from this factor should however be random and should not affect the slope of the dilution curve
18 TECHNICAL BULLETIN 1438 US DEPT OF AGRICULTURE
Reversible aggregation-One type of error that could systematically bias the dilution curve is reversible complex formation or aggregation (2) If the agent in an undiluted extract is bound in complexes that dissociate upon dilution the slope of the dilution curve will be less than one
Backgr01tndmaterials-When virus is (muted the other constituents in the medium are olso diluted If substances inhibitory to infection are present a slope of less than one will be obs~rved Since two of the sets of WTV dota (p 17) were token from virus preparatiuns partly purified by rate density gmdient centrifugation inhibitory substances in the extluct should hove sedimentotion coefficients similor to that of the middotvirus Of course omong the sundry inhibitory substances thot might be present (41) a prime suspect might well be inl1Ctive WTV porticles
Variation in sllsceptibility oj test insecls--Perhaps the most likely cause for a slope less thon unity is host heterogeneity (1 4-3) Nagaraj and Black (34-) selected a nontransmitter race of insects from the A constricia coionies but it witS not determined whether these insects failed to acguire virns support multiplicatiou or tr1l1smit the virns Other studies of nontronsmitter races (4 27) olso biled to elucidote the relationship between incompetence and viral multiplication In addition to genetic variotion it is lilwly that there are irregulor physiological voliotions (29) or perhops intrastocliol variation in the susceptibility of single insects to infection by plont-disease ogents
GRADED-RESPONSE ASSAYS
Despite its widespread use guontal assay has inherent limitations Suppose we wish to ask a question such as WlUlt is the virus content in each of 20 fractions from a purification procedure It is impractical or impossible to dilute each of 20 inocula several times and inject all dilutions into sufficiently large samples of test insects At least 20 and preferably 30 observations are necessary for a relioble estimate of a percentage and at least three dilutions of a fraction mny be required to find the range of dosage responses where percentages are between oand 100 Thus for 20 [mctions we would have to inject 1200 insects assuming 100-percent suryival Except in rare circumstm1Ces such I1n
effort would be impracticol Furthermore we frequently wish to assay fluids such as salin1ry materinl or hemolymph which nre aTailable in only small qUl1utities nnd would be difficult or impossible to dilute Ilcclul1tely For these applications it hl1s been necessory to employ a gradod-response assay
BIOASSAY OF VIRUS AND MYCOPLAS~IALIKE ORGANISMS 19
Dynamics of Infection Process
The basis for graded-response assay lies in the dynamics of the infecshytion process This was first studied by Black (3) who obtained variable reimlts after permitting ]t1 fascifrons to feed on plants infected with the aster yellows tgent but concluded thtt the agcnt iu(reased during the incubation period Whitcomb and Black (52) meamtred the conshycentration of viral soluble antigen after injcction of WlV Whitcomb find others (55) estimatcd the concentration of the WX agent in the hemolymph of O montamlS at vtrious times after injection Reddy and Black (40) estimated thc concentration of WTV in solutions injected into fl constricta in order to follow growth of the virus after acquisishytion feeding Sinha and Ohiykowski (46) followed the increase of the astpr yellows agcnt in various organs of its vcctor Plus (39) studied the growth curves of sigma virus in Drosophila
Jhe general sengtie of these contributions is as follows Infection initiated by injection of a disease agent is followed by an increase of the agent which follows the course of a logistic growth curve Transshymi-sion of the diseasp agent is closely correlated with the time when maximum titer is reached in the insect The transmklsion curve rises stepply from below the threshhold of detection to a high level within a hort period of time Following the logistie growth phase of the agpnt there occurs a decrease in the concentmtion of the agent which is correlated ith decreasing transmission frequency
Graded-response lllethods using parameters of transmission curves are baled on the concentration-dependence of the time placement of the transmission curves Thus a family of similar curves (fig 2) -ho(gt logistic growth phases were found to have similar slopes was geu(rnted by plotting transmission results from injected dilutions of a diseuse agent
Tso Method
ThE dtpendplwP d(scribed above ctn be used in 1 iLUlllber of ways Any property of tbe tmnsmission cune call be sel0cted as an operative statistic The first approach -e us(rl (lii) Wfl to rnenlltte the 150 at1 timE at which 50 percent of insects that ould 0YEntuillly trnnsmit were tranlt5mitting at least once weekly The T50 of an unlawwll could be lelttted to the lQ of yailles obtained from a dilution series by graphic interpolation
Latent-Period IVlethod
In lat(lmiddot work we lIs((ln latent-period method of analysis for the WX agent Such asay haj b0l11 used ill a less quantitati-e Wily in etrlier
20 TECHN[CAL BULLETIN 1438 US DEPT OF AGRICULTURE
studies (2231) For purposes of this analysis as in the T60 analysis it was necessary to transfer the insects to new test plants five times Thus the inoculation feeding was divided into five intervals not necessarily equal To compute a latent period it was assumed that successful transmission events in each interval occurred at the instant of the median time of that interval All data from insects injected with a given inoculum were used to compute the average latent period resulting from injection of that inoculum This average latent period was then referred to a standard curve preferably obtained in the s(lle el--periment under the same experimental oonditions
In praotioe seasonal differenoes in the greenhouses in Berkeley Oolif were minimal and good agreement was obtained in the absolute values of latent periods at different times of year It would be much preferable and is necessary in Beltsville Md to perform such assays in controlled-growth facilities If this is done it is not absolutely necessary (although still highly desirable) to include a dilution-curve control in each experiment
Oomputation of latent-period data from a large experiment can be readily accomplished on a single data sheet (table 6) by employing certain shortcuts
Latent periods in the Vector
The Poisson interpretation of dilution curves has certain implicashytions in the expected distribution of latent periods in the insect If a large majority of infections are initiated by single particles as preshydicted theoretically when less than about 40 percent of insects hecome iniected the latent periods resulting from those infections should have a maximum value (or more accurately a maximum mean value with a variance depending on the variability in the insect population injected) Examination of the distributions obtained experimentally (fig 7) after the injection of WX agent into O montanu8 empirically supports this expectation
Half-loglO dilutions (in terms of weight of tissue from infected vectors) were injected It is suggested that most latent periods r~sultshying from injections of suspensions diluted a hundredfold (-20) or more resulted from single-particle or at most double- or triple-particle infectioni such latent periods should be maximal This interpretation is consistent with Poisson statistics which predict for example that when 65 (12)= 78 percent of vectors are infected after injection of a hundredfold dilution 423 percent of the infected vectors would receive 1 particle 32 percent would receive 2 particles 154 percent would receive 3 particles and 64 percent would receive 4 particles
BIOASSAY OF VIRUS AND MYCOPLASMALIKE ORGANISMS 21
If my interpretation is correct latent periods in insects can reflect the difference between infections caused by one and by about five or more particles
wx DILUTIONCURVE
-20
123456 WEEKLY INTERVAL
FIGURE 7-Percentagesof infection and frequency distributions of latent periods of the Western X-disease agent in Colladonus monlanus
~ ~
~
~ ~
TABLE 6-Example oj calculation oj average latent period oj WX agent in leafhoppers
[The experimental treatments of WX inocula are followed by injection of the extract into leafhoppers Surviving leafhoppers are trans ferred to IlOW test plants at intervals 10 to 50 days after injection the range in which all latent periods fall Three- or four-day intervals ~ are preferable but intervals not necessarily equal of any length lllay be chosen A preliminary calculation is made of difference between ~ intervals in days]
lgto CraquoInterval (1) 00
Symbol and definition 1 2 3 4 q
foDays Days Days Days
D=Range of interval in days after injection ______________________________________________ _ 20-24 24-31 31-38 HI=Midpoint of interval in days after injection ___________________________________________ _ 22 275 345 d=Difference between midpoint of interval and midpoint of first interval (H-H1) ___________ _ 0 5 5 125
t138-52 ~ 45 ~
23 o Ij
gt
I sect
tj
~ ~ Ulmiddot
CALCULATION OF LATENT PERIOD USING ABOVE HI AND d i VALUES Ul
~ Weighted
average ~ Vectors transmitting during interval (nl) Surviving Percentage period Average latent
Inoculum vectors in- trans- between HI _ periodwlted eluding non- mission I and trans- LP H I +2n j dl ~
transmitters mission UlIr1 2 3 4 Total 2nldl time lir ~
tI
Number Number Number N1l1nber Number Number Percent Days Days ~ A ____________ Q0 0 0 0 0 28 0B _____________ ----------------------------shy1 1 13 4 19 24 79 17 13 68 3568C_____________ 6 7 9 0 22 24 9167 686 2886D ____________ 6 8 8 1 23 24 9583 7 26 2926E ____________ 4 9 5 4 22 28 7857 927 31 27F _____________
12 10 1 0 23 23 10000 293 2493G ____________ I7 10 5 0 22 28 78 57 5 34 273411____________ 1 1 7 0 9 18 50 00 10 33 32 33 o ld al
1 This value is not used to calculate the latent period but will be needed elsewhere ~ ~
t-l ~
24 TECHNiICAL BULLETIN 1438 US DEPT OF AGRICULTURE
Total-Latent-Period Method
Although the use of latent periods in the insect has enabled workers to perform assays which otherwise would not have been possible there are various objections to the method It is laborious to make even five transfers as was necessary for the WX agent Also the latent-period method necessarily entails making discontinuous obshyservations This can easily lead to quirks and contradictions when an unfortunate interval is chosen
With the aster yellows agent the shorter time scale for incubation periods in plant and insect makes the selection of intervals a critical matter It has turned out that the total latent period-the latent period in the insect plus the latent period in the plant-is a function of virus concentration Actually this observation was first made with the WX agent (table 4) despite the fact that the lengthy incubation period in the plant 28 days minimum to 70 days maximum obscured the results somewhat and augured against routine use It was preshydicted that the method should work best with an agent with a short latent period in the plant especially if that latent period was not greatly affected by the age of the plant The transmission of the aster yellows disease agent to summer daisy (Chrysanthemum carinatum Schousb) china aster (Oallistephus chinensis (L) Nees) or plantain (Plantago major L) fulfills these requirements
In two respects the standard bioiogical operations are modified with this assay It is necessary to use young males or nymphs sterilized by gamma rediation for injection If this is done the small test plants can be held in the controlled environment chamber and A Y symptoms read without removal of the cage with the insect still present
The principal steps of the technique are the same as for any gradedshyresponse assay A dilution-curve control is performed and the reshysponses (in this case the total latent periods) are plotted graphically (fig 8) Unknown samples are injected under the same conditions as the control and subsequent biological operations performed under the same environmental conditions The standard assumption of bioassay that unknown aliquots produce responses that bear a similar relationshyship to concentration as aliquots of the control dilutions must be made For example the dispersity of the agent in the various inocula must be comparable If there is a steep time-decay curve for infective units this can alter the effective concentration determined In the case of agents that propagate in leafhoppers these factors may freshyquently be operative Results of two experiments with the AY agent are presented (tables 7 8 fig 8) as examples of this method
BIOASSAY OF VIRUS AND MYCOPLASMALIKE ORGANISMS 25
FIGURE 8-Relationship of total latent period to A Y concentration The line drawn is a st -ndard curve fitted to the points of the dilution curve (table 8) Total latent periods observed after injection of treated extracts can be conshyverted to A Y concentration by means of this standard curve
SUMMARY AND DISCUSSION
Concepts and problems of the bioassay of a leafhopper-borne plant virus-clover wound tumor virus (WTV) and of two yellows disease agents-the peach Western X-disease agent (WX) and the agent of aster yellows disease (AY) are discussed The principal details of assay were found to be similar for both types of agent Machine proshyduction of needles and improved methods for the transfer and mainshytenance of test insects make such bioassays less laborious and cumbersome than they once were Interpretative methods now need to be developed to realize the fullest potential of existing bioassay techniques
Dosage-response curves obtained by injecting disease agents into leafhoppers had problematical interpretations Although the fraction of infected insects decreased in groups injected with lower concentrashytions of disease agents the observed slope of the dosage~response curve was always less than the theoretical unit slope if crude inocula were
26 lECHNICAL BULLETIN 1438 US DEPT OF AGRICULTURE
TABLE 7-Total-latent-period method Aster yellows iran81Ylission to summer daisy
[Four buffers were tested with the aster yellows agent Final yield of agent was determined by injecting single concentrations of each and comparing the total latent period (time in insect and plant before symptoms could be detected) from each with a standard curve whose slope was derived from control dilutions Only two dilutions were used it would have been preferable to have had three or four Graphic interpolation of concentration as in figure 8 Olear differences are asserted between alkaline and acid pH and between buffers 0 and D]
Material tested Fraction Total latent Log1o transmitting period units AY
Dilution of extract Number Days10- __________________________1 2428 294 210-2__________________________ 2225 33 9 1
Buffer and pHA(61) _______________________ 2226 309 15 A(i5) ________________________ 3739 309 1 5 BC61) ________________________ 2525 323 125 0(80) ________________________ 3838 294 2 D (80) _______________________ 3536 279 3
injected Reversible complexing and aggregation of the particles of disease agents as well as variations in susceptibility among the test insects are likely factors in reduction of the slope of the dosageshyresponse curves in both WX and WTV assays Other factors such as interference in the establishment of infection by background mateshyrials or by inactive virus particles may also reduce the slope
Storage of test insects before injection apparently increases their capacity for acceptance of fluid The volume of inoculum injected could be deliberately varied by a sevenfold factor The dosage reshysponse was correspondingly affected by such an increase Variations in the volume of inoculum injected into test insects and failures to detect insects infected by injection were additionuJ sources of error Such errors however should be randomly distributed and shouJd not affect the slope of the dosage-response curve Further experiments with known dilutions of purified virus are highly desirable since dosage-response curves provide importunt dues lIgarc1ing the nature of the infection process
Incubation-period data long overlooked as sources of information about virus concentration were found to be most adaptable to analyshysisEstimaHon of incubation-period statistics such as the average
----------
----------------------------------------
BIOASSAY OF VIRUS AND MYCOPLASMALIKE ORGANISMS 27
TABLE 8-Total-latent-perwd method Aster yellows transmission to aster 1
~Iaterial tested
Dilution of extract 10-1________________
10-2________________
10-3 ______ ---------shy10-1________________
Treatment1__________________ 2__________________ 3__________________ 4__________________
Time 2
Minutes 0
20 40
150
60 80 95
120
Fraction transshymitting
Number 910
2325 1517 1315
2430 1328
624 025
Total latent
period 3
Days 12 8 15 8 185 14 0
158 185 188
3 0 20 10 25
20 10 9 0
Log units AY
corrected for time 5
2 2 13 13 0
1 Four treatments of increasing intensity were applied to an A Y extract Analysis as in table 7
2 Time between preparation of inoculum and injection 3 Time between injection of an insect and first appearance of symptoms on
asters The value of 1 was arbitrarily asSigned to the extract at 10-3bull
5 The A Y concentrations were corrected for time by construccing a time-decay curve with the two replicate injections of 10-1 inoculum and assuming that all inocula decayed at the observed rate
latent period or T 50 (time at which 50 percent of transmitters were transmitting at least once weekly) for groups of insects allowed the estimation of concentration of the disease agent in many samples within a single experiment ond permitted construction of infectivityshyscanning curves for fractions from purification procedures The best statistical treatment of incubation-period data has not been detershymined butseverai empirical methods are presented as interim proshycedures until more sophisticated analyses (18 19 21) are available
Incubation periods ill plants as well as insects were dosageshydependent although the dependence in plnnts was more difficult to demonstrate This dillicultr was attributed to the steep growth curves of disease agents in their vectors which seemingly assure that most successful transmission events are induced by concentrations of agent greatly in excess of the minimum concentration required to produce the minimum incubation period in the plant The earliest or the latest transmissions by vectors transmitting the WX agent to celery tended
28 TE(JHN[CAL BULLETIN 1438 US DEPT OF AGRICULTURE
to have longer incubation periods in the plant than other transmisshysions Celery which is poorly susceptible to WX was an ideal plant for demonstrating fluctuation of the inoculative potential of WX vectors With more susceptible plants the threshhold concentration of disease agent for minimum incubation period is quicWy reached
With any given set of environmentul conditions the length of the incubation period of A Y and WX infection in plants was independent of the original concentration of virus originally injected into the vector This made it possible to discern between incubation periods in insects receiving different virus concentrations as follows
Itotal = Iinsect + Jplant
where Iplant was a constant mean value with constant variance In the case of WX this total-latent-period method was difficult to employ because the incubation period in celery 26 to 50 days was accompanied by high variability However development of AY symptoms in aster plantain or summer daisy required only 6 to 18 daTs and Ivas less variable Thus in total-latent-period assay transshyfers were usually not required to determine the incubation period only one dilution needed to be injected with each inoculum and fe--er insects were required for the single injection whereas a minimum of five transfers were required to determine the latent periods in O montanu8 before transmission of the WX agent
LITERATURE CITED
(1) ARMITAGE P and SPICER C C
1956 THE DETECTION OF VARIATION IN HOST SUSCEPTIDILlIY IN DILUTION
COUNTING EXPERUIENTS J Hyg Cambridge Eng 54 401-414 (2) BALD J G
1937 THE USE OF NlllBERS OF INFECTIONS FOR COMPARING THE CONshy
CENTRATION OF PLANT VIRUS SUSPENSIONS II DISTORTION OF
TilE DILUTION SERIES Ann App Bio 24 56-76 (3) B 1 CK L M
1941 FUUTITER EVIDENCE FOH lIUlTIILICATION OF THE ASTER Y~JLLOWS
VIRUS IN THE ASTER LEAFIIOlPEH Phytopathology 31 120-135 (4)
1913 GENErIC VAIUATION IN THE CLOVEU LEAFHOPfEUS ADILITY TO
TRANSlllT POTATO YELLOW-DWAHF VIRUS Genetics 28 200-209 (5)
1969 INSECT TISSUE CUUIUHES AS TOOLS IN PLANT YlUUS RESEAUCII
Ann Rev Phytopath 7 73-100 (6) --- and BRAKKE lL R
1952 MULrIPLlCNIION OF WOUND-TUMOR vmus IN AN INSflCT VECTOR
Phytopathology 42 269-273
BIOASSAY OF VIRUS AND MYCOPLASMALIKE ORGANISMS 29
(7) --- WOLCYRZ S and WHITCOMB R F 1958 A VECTORLESS STRAIN O~ WOUND-TUMOR VIRUS (Abstract) VlIth
Internatl Congo Microbiology p 225
(8) BRAKKE M K 1958 PROPERTIES ASSAY AND PURIFICATION OF WHEAT STREAK MOSAIC
VIRUS Phytopathology 48 439-445
(9) 1970 SYSTEMIC INFECTIONS FOR THE ASSAY OF PLANT VIRUSES Ann
Rev Phytopath 8 61-84
(10) --- VATTER A E and BLACK L lL 1954 SIZE AND SHAPE OF WOUND-TUMOR VIRUS ABNORMAL AND PATHshy
OLOGICAL PLANT GROWTH Brookhaven Symposia in Biology 6
137-156
(11) CHEN T and GRANADOS R R 1970 PLANT PATHOGENIC MYCOPL-s~rA-LIKE ORGANISlr MAINTENANCE
IN VITRO AND TRANSMISSION TO ZEA MAYS L Science 167
1633-1636
(12) CHlU R J and BLACK L M 1969 ASSAY OF WOUND TUMOR VIRUS BY THE FLUORESCENT CELL COUNTshy
ING TECHNIQUE Virology 37 667-677
(13) ---REDDY D V R and BLACK L M 1966 INOCULATION AND INFECTIOI OF LEAFHOPPER TISSUE CULTURES
WITH A PLANT VIRUS Virology 30 562-566
(14) DIXON W J and 1IASSEY F J
1957 INTRODUCTION TO STATISTICAL ANALYSIS lIcGraw Hill New
York N Y 488 pp
(15) DOl Y TERANAKA 11 YORA E and AsuLurA H
1967 MYCOPLASMA- OR PLT GROUP-LIKE MICROORGANISMS FOUND II
THE PHLOEM ELEMENTS OF PLANTS IIFECTED WITH lUIDERRY
DWARF POTATO WITCHES BRoo~r ASTER YELLOWS OR PAULOWshy
NI- WITCHES BROOM Phytopath Soc Japan Ann 33 259-266
(16) DUFFUS J E
1963 POSSIBLE MULTIPLICATIOI II THE APHID VECTOR OF SOWTHISTLE
YELLOW VEIN VIRUS A YlRlIS WITH AN EXTREMELY LONG INSECT
LATENT PtJRIOD Virology 21 194-202
(17) ELLIS E L and DELBRUCK M 1939 THE GROWTH OF BACTERIOPHAGE J Gen Physio 22 365-384
(18) ESPMARK J A and G-RD S
1965 DOSE-INCUBATION TIME RELATIONSHIPS IN VIRUS INFECTED TISSUE
CULTURES THEORETICAL CONSIDERATIONS Arch Ges Virusshy
forsch 15 137-150
(19) FINNEY D J
1964 STATISTICAL METHOD IN BIOLOGICAL ASSAY Hafner New York
2d ed 661 pp
(20) GUEZ R BLACK L 11 and MACLEOD R
1967 REEXAMINATION OF THE SEROLOGICAL RELATIONSHIP BETWEEN
WOUND-TUlIOR VIRUS AND REOVIRUS Virology 32 163-165
(21) GART J J
1965 SOME STOCHASTIC MODELS RELATING TIME AND DOSAGE IN RESPONSE
CURVES Biometrics 21 583-599
30 TECHNICAL BULLETIN 1438 US DEPT OF AGRICULTURE
(22) HIRUMI H and ~IARAMOROSCH K
1963 RECOVERY OF ASTER YELLOWS VIRUS FROM VARIOUS ORGANS OF
THE INSECT VECTOR MACROSTELES FASClFRONS COlltrib
Boyce Thompsollinst 22 141-151 (23) --- and MARAMOROSCH K
1964 INSECT TISSUE CULTURE USE OF BLASTOKINETIC STAGE OF
LtJAFHOPPER J~lBRYO Science 144 1465-1467 (24) --- and MARAMOROSCH K
1964 THE IN VITRO CULTIVATION OF EMBRYONIC LEAFHOPPER TISSUES
Exp Cell Res 36 625-631 (25) lSHIIE T Dor Y YORA K and ASUYAMA H
1967 SUPPRESSIVE EFFECTS OF ANTIBIOTICS OF TETRACYCLINE GROUP ON
SYMPTOM DEVELOPMENT OF MULBERRY DWARF DISEASE Phytoshy
path Soc Japan Ann 33 267-275 (26) JENSEN D D WmTcoMB R F and RICHARDSON J
1967 LETHALITY OF INJECTED PEACH WESTERN X-DISEASE VIRUS TO ITS
LEAFHOPPER YECTOR Virology 31 532-538 (27) KISIMOTO R
1967 GENETIC VARIATION IN THE ABILITY OF A PIANTHOPPER VECTOR
LAODELPHAX STRIATELLUS (FALLEN) TO ACQUIRE THE RICE
STRIPE VIRUS Virology 32 144-152 (28) KUNKEL L O
1937 EFFECT OF HEAT ON ABILITY OF ClCADULA SEXNOTATA (FALL)
TO TRANSMIT ASTER YELLOWS Amer J Bot 24 316-327 (29) LHERlTIER P
1958 THE HEREDITARY RUS OF DROSOPRlLA Adv Virus Res 5 195-245
(30) LIN S LEE C and CHIU R
1970 ISOLATION AND CULTIVATION OF AND INOCULATION WITH A MYCOshy
PLASMA CAUSING WHITE LEAF DISEASE IN SUGARCANE Phytoshy
pathology 60 795-797 (31) MARAMOROSCH K
1953 INCUBATION PERIOD OF ASTER-YELLOWS VIRUS Amer J Bot 40 797-809
(32) 1956 MULTIPLICATION OF ASTER YELLOWS VIRUS IN IN VITRO PREPAshy
nATIONS OF INSECT TISSUES Virology 2 369-376 (33) MrTSuHAsHI J and MARAMOROSCH K
1964 LEAFHOPPER TISSUE CULTURE EMBRYONIC NYMPHAL AND IMshy
AGINAL TISSUES FROM ASEPTIC INSECTS Contrib Boyce Thompshy
son lust 22 435-460
(34) NAGARAJ A N and BLACK L M
1962 HEREDITARY VARIATION IN THE ABILITY OF A LEAFHOPPER TO
TRANSMIT TWO UNRELATED PLANT VIRUSES Virology 16 152-162
(35) --- SINHA R C and BLACK L M 1961 A SMEAR TECHNIQUE FOR DETECTING VIRUS ANTIGEN IN INDIVIDUAL
VECTORS BY THE USE OF FLUORESCENT ANTIBODIES Virology 15 205-208
(36) NASU S JENSEN DD and RICHARDSON J
1970 ELECTRON lIticnoscopy OF MYCOPLASMA-LIKB BODIES ASSOCIATED
WITH INSECT AND PLANT HOSTS OF PIMCH WgSTEHN X-DISEASE
Virology 41 583-595
BIOASSAY OF VIRUS AND MYCOPLASMALIKE ORGANISMS 31
(37) OUCHTERLONY O
1958 DIFFUSION-IN-GEL METHODS FOR IMMUNOLOGICAL ANALYSIS In Progress in Allergy S Karger Basel N Y 5 1-78
(38) PARKER R F
1938 STATISTICAL STUDIES ON THE NATURE OF THE INFECTIOUS UNIT OF
VACCINE VIRUS J Exp Med 67 725-738
(39) PLUS N 1954 ETUDE DE LA MULTIPLICATION DU VIRUS DE LA SENSIBILITE AU
GAZ CARBONIQUE CHEZ LA DROSOPHILE Bull BioI de Ill France et
de Ill Belg 88 248-293
(40) REDDY D V R and BLACK L M 1966 PRODUCTION OF WOUND-TUlIOR VIRUS AND WOUND-TUlIOR SOLUBLE
ANTIGEN IN THE INSECT VECTOR Virology 30 551-561
(41) --- and BLACK L M 1969 COllPARATIVE INFECTIVITY OF WTV ISOLATES Ann Rev Phytoshy
pathoI 7 88-92
(42) SAITO Y
1969 HEMAGGLUTINATION OF LEAFHOPPER-DORNE VIRUSES In Viruses
Vectors and Yegetation Wiley Interscience New York N Y
pp463-474
(43) SHORTLEY G and WILKINS J R
1965 INDllPENDENT-ACTION AND BIRTHmiddot EATH llODELS IN EXPERIMENTAL
llICROBIOLOGY Bact Re 29 102-141
(44) SINHA R C
1965 SEQUENTIAL INFECTION AND DISTRIBUTION OF WOUND-TUMOR
VIRUS IN THE INTERNAl ORGNS OF A VECTOR AFTER IlOGESTION OF
VIRUS Virology 26 673-686
(45) --and REDDY D V R
1964 UlPROVED FLUORESCllNT SllEAR TECHNIQUE AND ITS APPLICATION
IN DETECTlNG VIRUS ANTIGENS IN AN INSECT VECTOR Yirology
21 626-634
(46) --- and CHIYKOWSKI L N 1968 IN[TIAL AND SUBSEQUENT SITES OF ASTER YELLOWS VIRUS INFECshy
TION IN A LEAFHOPPER TECTOR Virology 33 702-708
(47) STOREY H H 1933 INYESTIGATIONS OF THE llECHANISM OF THE TRANSMISSION OF
PLANT VIRUSES BY INSECT VECTORS I Roy Soc (London) Eroc B1l3 463--185
(48) SYLVESTER E S and RICHARDSON J 1966 RECHARGING PEA APHIDS WITH PEA ENATION MOSAIC VIRUS
Virology 30 592-597
(49) WHITCOllD R F
1964 A COlIPARISON OF SEROLOGICAL SCORING WITH TEST PLANT SCORING
OF LEAFHOPPERS INFECTED BYWOUND TUMOR VIRUS Virology24
488-492
(50)
1969 BIOASSAY OF PLANT VIRUSES TRANSMITTED PERSISTENTLY BY THEIR
VECTORS In Viruses Vectors and Vegetation Wiley Interscience
New York N Y pp 449-middot162
(51) -- and BLACK L jltI 1961 A PRECIPITIN RING TIME TEST FOR ESTIIATION OF RELATIVE
SOLUBLE-ANTIGEN CONCENTRATIONS Virology 15 507-508

____________________________ _
____________________________ _
BIOASSAY OF VIRUS AND MYOOPLASMALIKE ORGANISMSj
to the right Although such curves seemed at first to give an equally good fit to the incubation periods from either first or subsequent transmissions by individual insects a chi-square analysis (table 1) demonstrated that first transmissions were somewhat molf- likely to result in lengthy incubation periods than subsequent ones
T ABLE l---Jluisquare test of significance between distributions of WTV incubation periods in first and subsequent transmissions
Incubation periods
Experiment and position of transmission First four Last two Total 5-day 5-day for each
intervals intervals position
Number Number Number Experiment No1First____________________________ _
1 15 1 16 Other___________________________ _ 13 o 13
Experiment No2 Fi~t 17 3 20 Othcr___________________________ _ 27 o 27
Experiment No3 Fi~t______________ ---_- ___ -_ ----- 18 8 26
22 3 25Other_____-----------------------Experiment No4
First________________ - ____ - -- ----- 13 2 15 Other___________________________ _ 44 3 47
Experiment No5 Fi~t 2 108Other___________________________ _ 49 6 55
Totals Fi~t____________________________ _
71 16 87 Other_______________________ --- shy 155 12 167
Total for cach set of intervals __________ _ 226 28 254
x2 observed =73 x2 (=005)=384 x2 (=001)=663
1 Numbers of incubation periods of WTV in crimson clover 42G-718--71----2
6 TECID1iICAL BULLETIN 1438 US DEPT OF AGRICULTURE
W ~stern X-Disease Agent
The first celery plants infected in a series of transmissions by a given vector frequently develop WX symptoms only after an nnshyusually long incubation period Kunkel (28) noted a similar phenomshyenon with the aster yellows disease agent
These classical observations have now been extended with WX to the entire period of inoculativity of the vector As shown in figme 2 inoculativity of WX by its vector after an initial steep rise dcrnases to levels as low as those in early stages of infection If this decrease in transmission results from lower concentration of agent being inoculated into the plant then incubation periods in celery should show a corshyresponding increase For example) Lhe last transmission in a sedes should result in a longer incubation period The data of figure 3 support this expectation
We have also noted that incubation periods preceding and following skips in transmission by single insects also tend to be longer than other transmissions in the series Duffus (16) has made similar obsershyvations with aphid vectors Although the titer of WX in O montanu8 probably reaches higher levels than many other disease agents in their vectors transmission of the WX agent to celery is very poor
10-1
ZIOO -- 10-2
0 tr---ltgt 10-3u
Cf)
0---ltgt 10-4
Cf) 7~Z ltta I shy
~ 50 ~ W LLI ~
I- 25 Z uJ U 0 W 0 0 0 20 30 40 70 eo 90
DAYS AFTER
FIGURE 2-Transmission of the Western X-diseaselgent in weekly inoculation interv1ls on henlthy celery following injection of scrinl tenfold dilutions of extract from infected vectors Only insects that at some time transmitted WX werc used in the calcUlations Inlerpretntion of dosnge relationships has been discussed in a previous publicntion (54)
7 ~IOASSAY OF VIRUS AND MYCOPLASMAIIKE ORGANISMS
If 40 30
30 yransmission
0 31
-() 32
~ C-gt 33 a w I W34 ()
bull
I I I I
20
10
04
m tJ () m z ~ G) m
-f AJ lgt Z VI 3
0 35
Q cr ~36
I --IncubationI period
-02 VI VI 0 Z
Z 237 I ~ lXI I J 38 U z I
39 I I
2 3 4 5 6
TRANSMISSION NUMBER
FIGCRE 3-Two methods of measuring amount of western X-disease agent transshyptitted to celery by Colladomts monanus Solid line represents percentage of infected test plants over the 6-week course Dotted line represents the incubation period of the infections in celery initiated during the same 6-week course
Therefore a plant such as celery which happens to be very poorly susceptible to a particular disease agent is a good tool for studying variations in the inoculative potential of vectors Thus the system has pronded the best evidence to date tbat leafhopper vectors do in fact have different inocula ti-e po tentials from time to time ra ther than a simple ability or disability to transmit
Insects transmitting the wx agent tend to undergo a definite
8 TECHNICAL BULLETIN 1438 US DEPT OF AGRICULTURE
transmission-free period (TFD) before death The duration of this period depends (fig 4) on the age of the insect at the time of death The presence of such a period before death when insects failed to transmit WX seems at first to suggest a discontinuous change in the vectors status from transmitter to nontransmitter There is some histological evidence for such a change (56) Serous cells of O montanus are eventually destroyed by WX infection but the other nine cell types of the principal salivary gland despite certain cytological changes (56) apparently remain more or less functional
We have speculated (56) that multiplication of WX agent in serous cells may be required for transmission The dependence of the length of the TFD on longevity of the vector (fig 4) however suggests that histopathological changes induced by WX may not greatly affect the transmission mechanism The longe-vity of vectors varies conshysiderably within groups of insects treated iden tic ally (insects living
o 6
5 a u I shyu 4 o I shy83 VECTORS INOCULATED WITH a lJJ bull 10-1or 10-2 brei ~2 gt o o Feeding or 10-11 brei (f) bull
20 30 40 50 60 70 80 90
MEAN DAY OF DEATH
FIGURE 4-Dependence of the number of transmission-free days (TFD) before the death of Colladonus montanus adults upon the longevity of the vector (Mean day of death=days after injection of WX agent) Because longevity of the vectors depended on the injected concentration or route of entry of WX two lines were drawn One for the more concentrated inocula (10-1 or 10-2
dilutions of extract) and another for more dilute inoculum (10-3 dilution) or for infections initiated when insects fed on diseased plants
BIOASSAY OF VIRUS AND MYCOPLASMALIKE ORGANISMS 9
as long as 83 days after injection were found to carry advanced histopathological symptoms (57)) It is doubtful that infected insects failing to transmit WX for 10 to 36 days before death suffered all the while from total loss of a vital function such as salivation It is significant also that insects that happened to die during early stages of infection transmitted well in their last inoculation interval
In summary WX transmission probably decreases to a certain extent for reasons related to aging and decreased feeding rate of the insect as in the transmission of pea enation mosaic virus (48) Howshyever the major cause of decrease in inoculativity is probably a steep decay of WX agent after the initial growth phase Decreases due to failure of individual serous cells to secrete watery saliva or total impairment of transmission as a result of the failure of all serous cells may occur to a limited extent but probably are relatively unimporshytant factors in the overall transmission flurve
QUANTAL RESPONSE ASSAYS
Dilution Curve Theory
Brakke and others (10) interpreted WTV dilution curves by a graphical method Logarithms of the percentages of leafhoppers that infected crimson clover were plotted against the logarithms of the concentrations of virus extract originally injectedinG~l the insects It was found that the points fell approximately upon a straight line in the range of 0 to 50 percent infected insects Dilution curves of extracts to be compared were therefore fitted to straight lines of the same slope and differences in concentration were estimated graphically
The above method is in contrast to the classical Poisson dilution theory as applied to bacteriophage (17) animal viruses (38) sigma virus of Drosophila (39) and wheat streak mosaic virus on individual wheat plants (89)
According to the Poisson interpretation the chance presence or absence of a virus particle at the site of initiation of infection is responsible for the characteristic dosage mortality curve obtained The proportion Q of insects that receive no particle at the site of infection is e- where e is the base of natural logarithms and x is the average number of infectious particles reaching the infection site ie the concentration of particles at the infection site If the initial concentration of particles in the extract is c the concentration of a dilution of that extract is xfn
where f is the dilution factor and n the number of times the extract has been diluted Then Q=e-ctn and
10 TECENICALBULLETIN 1438 US DEPT OF AGRICULTURE
loge ~=cfn A plot therefore of 10glO loge J against 10glOc should give a straight line with unit slope
Dilution Curve of WTV
Data from two published sources (6 10) were analyzed as well as data not previously published in their entirety obtained in the study of vectorless WTV (7) None of the three sets of data gave a good fit to Poisson theory When 10glO log ~ was pbtted against the logashyrithm of virus concentration the best-fitting straight lines determined graphically gave slopes of 067 050 and 048 In only one of the 26 dilution curves examined was a slope as great as 100 obtained
Figure 5 and table 2 show the result of two unsuccessful attempts to fit the data (6 10) graphically to the theoretical curve In each case there was a wide discrepancy between theoretical and observed values Such deviations are considered to be too serious to justify application of the theoretical dilution curve to data so far obtained Under these circumstances there seems to be no reason why the Bcheme of Brakke and others (10) should not be used as an empirical method (49)
Dilution Curve of the WX Agent
Whitcomb and others (54) in earlier experiments used tenfold dilution steps In two later experiments however half-log dilution steps were used (tables 3 and 4)
The results of one experiment (table 2) indicate that percentages of infected vectors can in rare instances be meaningless as indicators of the concentration of agent that was injected An error in labeling solutions or insects seems to be precluded by the latent periods in the insects which were normal for each injected concentration Furthermore no conceivable reconstruction of the data assuming mislabeling would improve its conformity to expectation Finally whereas in this experiment there was a large fraction of immune insects it was not unusual to observe smaller percentages of seemshyingly immune insects in other injection experiments Recent research suggests two possible mechanisms for immunity We have observed in the course of our WX stumes that adipose cells were altered by stress Sillce adipose tissue might be the major site of infection after injection of the Western X-disease agent physiological [tlteration of such cells might render the insecijs immune Recent suggestions (1525) that agents of yellows diseaRcs may be Mycoplasmalike agents offer ttnother possible explanation infection with a Mycoplasma not
BIOASSAY OF VIRUS AND MYCOPLASMALIKE QRGANISyenS 11
~
---Theoretical -Observed
1 15 2 25 3 35 LOG 10 VIRUS CONCENTRATION
FIGURE 5-Data of Brakke and others (10) eye-fitted to the best-fitting straight line The slope of the observed line is 067 compared with the value of 100 predicted by Poisson theory The logarithm of virus concentration at the hlghest dilution was arbitrarily taken to be 10i therefore the abscissa is a measure of relative virus concentration
pathogenic to plants might protect a leafhopper against an agent that does cause plant disease Such an agent has recently been visualized by electron microscopy (36) and would be expected to be present in the injected extracts
In a second experiment a number of special precautions were taken O montanus adults carrying the Western X-disease agent were exshytracted in 10 ml 085 percent N 001 emulsified with Genetron 113 and clarified very briefly at 1000 g after which the pH was adjusted to 73 This extmct was centrifuged for 10 minutes at 5000 rpm
12 TECHNICAL BULLETIN 1438 US DEPT OF AGRICULTURE
TABLE 2-Analysis oj quantal response Attempt to fit data oj Black and Brakke (6) to a PflisS071 distribution
[P=observed fraction of transmitting insects Q=l-P which according to the Poisson interpretation = l-e-x where x is the average number of successful particles per insect According to the Poisson interpretation the calculated c values (xd where d is the dilution) should be homogeneous for the three dilutions of each passage]
c dilution I-P Q=x
Passage Log1o d P Q= Loge
Number 1 -2 1 030 070 036 O 36
-3 10 05 95 05 50 -4 100 05 95 05 5 00
2 -3 1 19 81 21 21 -4 10 04 96 04 40 -5 100 00 100 00
3 -3 1 20 80 22 22 -4 10 15 85 16 1 60 -5 100 06 94 06 6 00
4 -2 1 41 59 52 52
-3 10 11 89 12 120 -4 100 00 100 00
5 -2 1 37 63 46 46 -3 10 17 83 19 1 90 -4 100 04 96 04 4 00
6 -2 1 54 47 76 76 -3 10 bull -_0 75 29 290 -4 100 00 1 00 00
7 -2 1 57 43 84 84 -3 10 25 75 28 280 -4 100 07 93 07 7 00
BIOASSAY OF VIRUS AND MYCOPLASMALIKE ORGANIampS 13
TABU) 3-Analyw of fIUantal response Abnormal d~lution curve of WX agent
Dilution 1 Fraction transmitting 2 LP
Number Number Percent Days 3
10-1 bull0 1133 33 24 10-15 424 17 23 10-2 bull0 226 08 28 10-U 728 25 26 10-30 430 13 26 10-3 1 728 25 26 100f bullo 1235 34 30 10-U 1225 48 34 10-50 1127 41 32
I Dilution calculated on basis of the original weight of extracted insects 2 Numbers of insects transmitting WX agent to celery test plants divided by
the number of insects surviving through the possible latent period 3 Latent periods of WX agent in individual vectors were assumed to be the
midpoint of the interval during which their first WX transmission to celery ocshy
curred The average latent period (LP) for a group was calculated r~Pi where
LP j was the latent period of a single vector and N was the number of latent periods observed
in the SW 39 L rotor of the Spinco 2 Model L centrifuge Half-log dilutions of the supernatant were made in 01 M glycine 001 M Mg012 001 M NaaS03 after which 50 nymphs were injected with each dilution within 1M hours of final centrifugation
The results (table 4) do not conform to Poisson dilution curve theory in one important respect Apparently only about 83 percent of test insects were susceptible to the WX agent Therefore observed percentages should be transformed by multiplying them by 12 in effect ignoring the hypothetical immune insee-ts When this was done the series of percentages obtained were compatible with Poisson statistics (table 4) Of course if percentages of infection of susceptible insects do not follow the Poisson distribution such a transformation will not improve the conformity to Poisson statistics
2 Trade names are used in this publication solcly for the purpose of providing specific information Mcntion of any specific equipment trade product or comshymercial company does not constitute a guarantec or warranty of the product by the US Department of Agriculture or an endorsement by the Department over similar products or companies not mentioned
42~713--71----3
14 TEC~CAL BULLET~ 1438 US DEPT OF AGRICULTURE
TABLE 4-Analysis of quantal response WX dilution cwve
Insects responding Log dilu- Fraction 8 P(12) 7LP 8LPT tion 1 Positive 2 Negative 3 Unknown ~ transmitshy
tingS
Number Number Number Percent Percent Days Days 10 33 7 5 825 99 22 0 624 15 35 6 7 854 100 263 632 2 0 21 5 9 808 97 30 1 69 3
2 5 22 12 12 64 7 78 308 66 1 30 10 23 12 303 36 32 1 664 3 v 2 24 12 7 7 9 9 31 9 9 66 5
40 0 37 5 O 0 0 4 5 1 32 12 30 4 9 35 0 9 59 0 5 0 0 35 9 O 0 0
1 Dilution calculated on basis of the original weight of extracted insects 2 Positives=number of insects transmitting WX agent to celery 3 Negatives=number of insects failing to transmit WX agent to celery despite
survival through the possible latent period ~ Unknown=number of insects that died before end of a possible latent period
and whose inoculative potential therefore was unknown S Fraction infected was computed from the positive-negative data oThe transformation P(12) was derived from the assumption that on the avershy
age only 833 percent of insects were susceptible to WX iufection The effect of this transformlltion is to ignore apparently immune insects
7 Latent periods of WX agent in individual vectors were assumed to be the midpoint of the interval in days during which their first transmission of WX agent to celery occurred The average latent period for a group was LP=~LPN where LP j was the latent period of a single vector and N was the number of latent periods observed
B The mean total latent period (LPr) was computed by averaging the total latent period (number of days between injection of WX agent into the insect and first appearance of symptoms in eelery plants inoculated by the insect) for each injected leafhopper that transmitted to celery
9 These numbers were calculated from very small sample sizes
Factors Possibly Affecting Dilution Curves
Effects of preinoculation storage and injected volume-Two effects were tested (1) The effect of injected volume (2) stolllge of vectors before injection In each experiment 200 large last-instal nymphs of A conslricta were collected and stored at 2deg C in a glass tube in the cold room but not in u moist chamber Groups of 50 were weighed then injected with i1 10-1 dilution of WrV-infected sweet clover root
BIOASSAY OF VIRUS AiD MYCOPLASMALIKE ORGAKlSMS 15
tumors in 0003 M KH2P04 00066 M K 2HP04 0225 M NaO Half of the vectors were injected with as little solution as could be inshytroduced half with as much as could be introduced After injection the insects were reweighed to determine the total weight of inoculum that had been injected into all insects in a group It was found that by the above technique the injected volume could be varied over a sevenfold range In addition nymphs stored in the cold room for 7 or 8 hours before injection accepted more injected fluid
All injected vectors were stored at room temperature in a moist chamber then transferred to Grimm alfalfa (Medicago sativa val Grimm) After 3 weeks on alfalfa the vectors were transferred in colonies of two to healthy crimson clover test plants for a 2-week inoculation access period Survival of the insects did not vary signifishycantly from group to group The transmission for colonies of two was recorded and calculated (52) into single-insect transmission (PI)
The PI values (table 5) varied widely from treatment to treatment A satisfactory interpretation of the results can be constructed as follows The principal storage effect is assumed to be upon the volume that can be injected Therefore differences in proportions of infected insects are ascribed to the differences in injected volume It is also assumed that in the range of volumes used the probability that It
single infectious particle will initiate infection does not depend on the volume This is equivalent to assuming that for example injecshytion of seven times as much inoculum of one concentration is the same as injectin~ the same volume of an inoculum seVln times as concentrated
To assess the proposed relationship betwecn volume and conClnshytration the relationship between conecntration tmd percentage infected vectors first needed to be assessed The test for conformity for the Poisson-binomial interpretation of dilution curves (plotting of 10glO loge ~ vs lOglO c) was performed
Although the deviation of such lines from unit slope excludes the Poisson interpretation (see Dilution Ourve of WTV p 10) the method provides an empirical method for plotting transmission pershycentages Data from the two experiments reported here could be best fitted to a straight line (fig 6) with a slope 057 which is very similar to dilution-curve slopes This suggests thut volume errol in insect injection can be partly controlled by measmillg the magnitude as a mean for a group of injected insects and then correcting the concentrations as calculated by dilution
Because variations in the volumes of injected inocula arc almost certainly random they would not be expected to result in sY8tematic deviation of the dilution curve from a theoretical slope Single points
I- 0)
TADLE 5-E ffect of injected volume and lJre-inoculation storage on fraction of WTV-infected insects after injection 8 ~
Experimental treatment Experimental results- Calculated values Colonies of two infective Experiment number I and time
stored at 2deg C Time in moist Calculated
~
Initial Gain in chamber at Fraction Percentage percent single Confidenceweight weight room insect trans- inwrvals 3
temperature mission 2
HOUTS Grams Gram8 Hours Number Percent Percent ~ Experiment No1
15________ ________________ a75 ________________________ 00833 00036 75 022 41 23 35-12 co
0850 0008 65 321 14 7 16- 3 00775________________________
0799 005iamp75________________________ -------------- 1323 57 34 48-23
0761 =1 0015 -------------- 721 33 18 30-11 f1lExperiment No2200________________________
0938 0051 70 1822 82 58 72-42 tj275 ________________________ ~
0847 0014 75 1421 67 42 55-29800________________________ ~ 0847 0057 2123 91 70850________________________ -------------- 86-52
0803 0018 o-------------- 1422 64 40 52-28 IIj
gtshy1 Fifty nymphs were injected for each storage-time group in 3 Ninety-five-pereent confidence intervals for Ph determined ~ each experiment from confidence intervals for P2 determined graphically from 2 Fraction of single-insect transmission (PI) was calculated Clopper and Pearson in DOwn and Massey (14 p 415) ~
PI= 1- (1-P2)Jl g ~
BIOASSAY OF VIRUS AND MYCOPLASMALIKE ORGANISMS 17
30
1010
o cS 0 bull - - - - 95 confidence interval
--fitted line
---theoretical slope
1 15 25 3
LOG10k
FIGURE 6-Graphical analysis of data of table 5 The PI values for table 5 were converted to the appropriate logarithm (ordinate) Abscissa is the logarithm of the ratio of volume injected to the smallest volume (o=experiment I x=experiment 2) The fitted line with a slope of 057 is similar to dilution-curve slopes of WTV which indicates that fluctuations of volume or concentration produce similar effects on the fraction of injecteurod insects
on the curve however might be too high or too low as a result of high or low volumes being injected into some groups of insects The size of the orifice of the injection needle is the most probable source of such variation in routine assays
Specific inJectivity-The specific infectivity of disease agents varies widely (41) Errors resulting from this factor should however be random and should not affect the slope of the dilution curve
18 TECHNICAL BULLETIN 1438 US DEPT OF AGRICULTURE
Reversible aggregation-One type of error that could systematically bias the dilution curve is reversible complex formation or aggregation (2) If the agent in an undiluted extract is bound in complexes that dissociate upon dilution the slope of the dilution curve will be less than one
Backgr01tndmaterials-When virus is (muted the other constituents in the medium are olso diluted If substances inhibitory to infection are present a slope of less than one will be obs~rved Since two of the sets of WTV dota (p 17) were token from virus preparatiuns partly purified by rate density gmdient centrifugation inhibitory substances in the extluct should hove sedimentotion coefficients similor to that of the middotvirus Of course omong the sundry inhibitory substances thot might be present (41) a prime suspect might well be inl1Ctive WTV porticles
Variation in sllsceptibility oj test insecls--Perhaps the most likely cause for a slope less thon unity is host heterogeneity (1 4-3) Nagaraj and Black (34-) selected a nontransmitter race of insects from the A constricia coionies but it witS not determined whether these insects failed to acguire virns support multiplicatiou or tr1l1smit the virns Other studies of nontronsmitter races (4 27) olso biled to elucidote the relationship between incompetence and viral multiplication In addition to genetic variotion it is lilwly that there are irregulor physiological voliotions (29) or perhops intrastocliol variation in the susceptibility of single insects to infection by plont-disease ogents
GRADED-RESPONSE ASSAYS
Despite its widespread use guontal assay has inherent limitations Suppose we wish to ask a question such as WlUlt is the virus content in each of 20 fractions from a purification procedure It is impractical or impossible to dilute each of 20 inocula several times and inject all dilutions into sufficiently large samples of test insects At least 20 and preferably 30 observations are necessary for a relioble estimate of a percentage and at least three dilutions of a fraction mny be required to find the range of dosage responses where percentages are between oand 100 Thus for 20 [mctions we would have to inject 1200 insects assuming 100-percent suryival Except in rare circumstm1Ces such I1n
effort would be impracticol Furthermore we frequently wish to assay fluids such as salin1ry materinl or hemolymph which nre aTailable in only small qUl1utities nnd would be difficult or impossible to dilute Ilcclul1tely For these applications it hl1s been necessory to employ a gradod-response assay
BIOASSAY OF VIRUS AND MYCOPLAS~IALIKE ORGANISMS 19
Dynamics of Infection Process
The basis for graded-response assay lies in the dynamics of the infecshytion process This was first studied by Black (3) who obtained variable reimlts after permitting ]t1 fascifrons to feed on plants infected with the aster yellows tgent but concluded thtt the agcnt iu(reased during the incubation period Whitcomb and Black (52) meamtred the conshycentration of viral soluble antigen after injcction of WlV Whitcomb find others (55) estimatcd the concentration of the WX agent in the hemolymph of O montamlS at vtrious times after injection Reddy and Black (40) estimated thc concentration of WTV in solutions injected into fl constricta in order to follow growth of the virus after acquisishytion feeding Sinha and Ohiykowski (46) followed the increase of the astpr yellows agcnt in various organs of its vcctor Plus (39) studied the growth curves of sigma virus in Drosophila
Jhe general sengtie of these contributions is as follows Infection initiated by injection of a disease agent is followed by an increase of the agent which follows the course of a logistic growth curve Transshymi-sion of the diseasp agent is closely correlated with the time when maximum titer is reached in the insect The transmklsion curve rises stepply from below the threshhold of detection to a high level within a hort period of time Following the logistie growth phase of the agpnt there occurs a decrease in the concentmtion of the agent which is correlated ith decreasing transmission frequency
Graded-response lllethods using parameters of transmission curves are baled on the concentration-dependence of the time placement of the transmission curves Thus a family of similar curves (fig 2) -ho(gt logistic growth phases were found to have similar slopes was geu(rnted by plotting transmission results from injected dilutions of a diseuse agent
Tso Method
ThE dtpendplwP d(scribed above ctn be used in 1 iLUlllber of ways Any property of tbe tmnsmission cune call be sel0cted as an operative statistic The first approach -e us(rl (lii) Wfl to rnenlltte the 150 at1 timE at which 50 percent of insects that ould 0YEntuillly trnnsmit were tranlt5mitting at least once weekly The T50 of an unlawwll could be lelttted to the lQ of yailles obtained from a dilution series by graphic interpolation
Latent-Period IVlethod
In lat(lmiddot work we lIs((ln latent-period method of analysis for the WX agent Such asay haj b0l11 used ill a less quantitati-e Wily in etrlier
20 TECHN[CAL BULLETIN 1438 US DEPT OF AGRICULTURE
studies (2231) For purposes of this analysis as in the T60 analysis it was necessary to transfer the insects to new test plants five times Thus the inoculation feeding was divided into five intervals not necessarily equal To compute a latent period it was assumed that successful transmission events in each interval occurred at the instant of the median time of that interval All data from insects injected with a given inoculum were used to compute the average latent period resulting from injection of that inoculum This average latent period was then referred to a standard curve preferably obtained in the s(lle el--periment under the same experimental oonditions
In praotioe seasonal differenoes in the greenhouses in Berkeley Oolif were minimal and good agreement was obtained in the absolute values of latent periods at different times of year It would be much preferable and is necessary in Beltsville Md to perform such assays in controlled-growth facilities If this is done it is not absolutely necessary (although still highly desirable) to include a dilution-curve control in each experiment
Oomputation of latent-period data from a large experiment can be readily accomplished on a single data sheet (table 6) by employing certain shortcuts
Latent periods in the Vector
The Poisson interpretation of dilution curves has certain implicashytions in the expected distribution of latent periods in the insect If a large majority of infections are initiated by single particles as preshydicted theoretically when less than about 40 percent of insects hecome iniected the latent periods resulting from those infections should have a maximum value (or more accurately a maximum mean value with a variance depending on the variability in the insect population injected) Examination of the distributions obtained experimentally (fig 7) after the injection of WX agent into O montanu8 empirically supports this expectation
Half-loglO dilutions (in terms of weight of tissue from infected vectors) were injected It is suggested that most latent periods r~sultshying from injections of suspensions diluted a hundredfold (-20) or more resulted from single-particle or at most double- or triple-particle infectioni such latent periods should be maximal This interpretation is consistent with Poisson statistics which predict for example that when 65 (12)= 78 percent of vectors are infected after injection of a hundredfold dilution 423 percent of the infected vectors would receive 1 particle 32 percent would receive 2 particles 154 percent would receive 3 particles and 64 percent would receive 4 particles
BIOASSAY OF VIRUS AND MYCOPLASMALIKE ORGANISMS 21
If my interpretation is correct latent periods in insects can reflect the difference between infections caused by one and by about five or more particles
wx DILUTIONCURVE
-20
123456 WEEKLY INTERVAL
FIGURE 7-Percentagesof infection and frequency distributions of latent periods of the Western X-disease agent in Colladonus monlanus
~ ~
~
~ ~
TABLE 6-Example oj calculation oj average latent period oj WX agent in leafhoppers
[The experimental treatments of WX inocula are followed by injection of the extract into leafhoppers Surviving leafhoppers are trans ferred to IlOW test plants at intervals 10 to 50 days after injection the range in which all latent periods fall Three- or four-day intervals ~ are preferable but intervals not necessarily equal of any length lllay be chosen A preliminary calculation is made of difference between ~ intervals in days]
lgto CraquoInterval (1) 00
Symbol and definition 1 2 3 4 q
foDays Days Days Days
D=Range of interval in days after injection ______________________________________________ _ 20-24 24-31 31-38 HI=Midpoint of interval in days after injection ___________________________________________ _ 22 275 345 d=Difference between midpoint of interval and midpoint of first interval (H-H1) ___________ _ 0 5 5 125
t138-52 ~ 45 ~
23 o Ij
gt
I sect
tj
~ ~ Ulmiddot
CALCULATION OF LATENT PERIOD USING ABOVE HI AND d i VALUES Ul
~ Weighted
average ~ Vectors transmitting during interval (nl) Surviving Percentage period Average latent
Inoculum vectors in- trans- between HI _ periodwlted eluding non- mission I and trans- LP H I +2n j dl ~
transmitters mission UlIr1 2 3 4 Total 2nldl time lir ~
tI
Number Number Number N1l1nber Number Number Percent Days Days ~ A ____________ Q0 0 0 0 0 28 0B _____________ ----------------------------shy1 1 13 4 19 24 79 17 13 68 3568C_____________ 6 7 9 0 22 24 9167 686 2886D ____________ 6 8 8 1 23 24 9583 7 26 2926E ____________ 4 9 5 4 22 28 7857 927 31 27F _____________
12 10 1 0 23 23 10000 293 2493G ____________ I7 10 5 0 22 28 78 57 5 34 273411____________ 1 1 7 0 9 18 50 00 10 33 32 33 o ld al
1 This value is not used to calculate the latent period but will be needed elsewhere ~ ~
t-l ~
24 TECHNiICAL BULLETIN 1438 US DEPT OF AGRICULTURE
Total-Latent-Period Method
Although the use of latent periods in the insect has enabled workers to perform assays which otherwise would not have been possible there are various objections to the method It is laborious to make even five transfers as was necessary for the WX agent Also the latent-period method necessarily entails making discontinuous obshyservations This can easily lead to quirks and contradictions when an unfortunate interval is chosen
With the aster yellows agent the shorter time scale for incubation periods in plant and insect makes the selection of intervals a critical matter It has turned out that the total latent period-the latent period in the insect plus the latent period in the plant-is a function of virus concentration Actually this observation was first made with the WX agent (table 4) despite the fact that the lengthy incubation period in the plant 28 days minimum to 70 days maximum obscured the results somewhat and augured against routine use It was preshydicted that the method should work best with an agent with a short latent period in the plant especially if that latent period was not greatly affected by the age of the plant The transmission of the aster yellows disease agent to summer daisy (Chrysanthemum carinatum Schousb) china aster (Oallistephus chinensis (L) Nees) or plantain (Plantago major L) fulfills these requirements
In two respects the standard bioiogical operations are modified with this assay It is necessary to use young males or nymphs sterilized by gamma rediation for injection If this is done the small test plants can be held in the controlled environment chamber and A Y symptoms read without removal of the cage with the insect still present
The principal steps of the technique are the same as for any gradedshyresponse assay A dilution-curve control is performed and the reshysponses (in this case the total latent periods) are plotted graphically (fig 8) Unknown samples are injected under the same conditions as the control and subsequent biological operations performed under the same environmental conditions The standard assumption of bioassay that unknown aliquots produce responses that bear a similar relationshyship to concentration as aliquots of the control dilutions must be made For example the dispersity of the agent in the various inocula must be comparable If there is a steep time-decay curve for infective units this can alter the effective concentration determined In the case of agents that propagate in leafhoppers these factors may freshyquently be operative Results of two experiments with the AY agent are presented (tables 7 8 fig 8) as examples of this method
BIOASSAY OF VIRUS AND MYCOPLASMALIKE ORGANISMS 25
FIGURE 8-Relationship of total latent period to A Y concentration The line drawn is a st -ndard curve fitted to the points of the dilution curve (table 8) Total latent periods observed after injection of treated extracts can be conshyverted to A Y concentration by means of this standard curve
SUMMARY AND DISCUSSION
Concepts and problems of the bioassay of a leafhopper-borne plant virus-clover wound tumor virus (WTV) and of two yellows disease agents-the peach Western X-disease agent (WX) and the agent of aster yellows disease (AY) are discussed The principal details of assay were found to be similar for both types of agent Machine proshyduction of needles and improved methods for the transfer and mainshytenance of test insects make such bioassays less laborious and cumbersome than they once were Interpretative methods now need to be developed to realize the fullest potential of existing bioassay techniques
Dosage-response curves obtained by injecting disease agents into leafhoppers had problematical interpretations Although the fraction of infected insects decreased in groups injected with lower concentrashytions of disease agents the observed slope of the dosage~response curve was always less than the theoretical unit slope if crude inocula were
26 lECHNICAL BULLETIN 1438 US DEPT OF AGRICULTURE
TABLE 7-Total-latent-period method Aster yellows iran81Ylission to summer daisy
[Four buffers were tested with the aster yellows agent Final yield of agent was determined by injecting single concentrations of each and comparing the total latent period (time in insect and plant before symptoms could be detected) from each with a standard curve whose slope was derived from control dilutions Only two dilutions were used it would have been preferable to have had three or four Graphic interpolation of concentration as in figure 8 Olear differences are asserted between alkaline and acid pH and between buffers 0 and D]
Material tested Fraction Total latent Log1o transmitting period units AY
Dilution of extract Number Days10- __________________________1 2428 294 210-2__________________________ 2225 33 9 1
Buffer and pHA(61) _______________________ 2226 309 15 A(i5) ________________________ 3739 309 1 5 BC61) ________________________ 2525 323 125 0(80) ________________________ 3838 294 2 D (80) _______________________ 3536 279 3
injected Reversible complexing and aggregation of the particles of disease agents as well as variations in susceptibility among the test insects are likely factors in reduction of the slope of the dosageshyresponse curves in both WX and WTV assays Other factors such as interference in the establishment of infection by background mateshyrials or by inactive virus particles may also reduce the slope
Storage of test insects before injection apparently increases their capacity for acceptance of fluid The volume of inoculum injected could be deliberately varied by a sevenfold factor The dosage reshysponse was correspondingly affected by such an increase Variations in the volume of inoculum injected into test insects and failures to detect insects infected by injection were additionuJ sources of error Such errors however should be randomly distributed and shouJd not affect the slope of the dosage-response curve Further experiments with known dilutions of purified virus are highly desirable since dosage-response curves provide importunt dues lIgarc1ing the nature of the infection process
Incubation-period data long overlooked as sources of information about virus concentration were found to be most adaptable to analyshysisEstimaHon of incubation-period statistics such as the average
----------
----------------------------------------
BIOASSAY OF VIRUS AND MYCOPLASMALIKE ORGANISMS 27
TABLE 8-Total-latent-perwd method Aster yellows transmission to aster 1
~Iaterial tested
Dilution of extract 10-1________________
10-2________________
10-3 ______ ---------shy10-1________________
Treatment1__________________ 2__________________ 3__________________ 4__________________
Time 2
Minutes 0
20 40
150
60 80 95
120
Fraction transshymitting
Number 910
2325 1517 1315
2430 1328
624 025
Total latent
period 3
Days 12 8 15 8 185 14 0
158 185 188
3 0 20 10 25
20 10 9 0
Log units AY
corrected for time 5
2 2 13 13 0
1 Four treatments of increasing intensity were applied to an A Y extract Analysis as in table 7
2 Time between preparation of inoculum and injection 3 Time between injection of an insect and first appearance of symptoms on
asters The value of 1 was arbitrarily asSigned to the extract at 10-3bull
5 The A Y concentrations were corrected for time by construccing a time-decay curve with the two replicate injections of 10-1 inoculum and assuming that all inocula decayed at the observed rate
latent period or T 50 (time at which 50 percent of transmitters were transmitting at least once weekly) for groups of insects allowed the estimation of concentration of the disease agent in many samples within a single experiment ond permitted construction of infectivityshyscanning curves for fractions from purification procedures The best statistical treatment of incubation-period data has not been detershymined butseverai empirical methods are presented as interim proshycedures until more sophisticated analyses (18 19 21) are available
Incubation periods ill plants as well as insects were dosageshydependent although the dependence in plnnts was more difficult to demonstrate This dillicultr was attributed to the steep growth curves of disease agents in their vectors which seemingly assure that most successful transmission events are induced by concentrations of agent greatly in excess of the minimum concentration required to produce the minimum incubation period in the plant The earliest or the latest transmissions by vectors transmitting the WX agent to celery tended
28 TE(JHN[CAL BULLETIN 1438 US DEPT OF AGRICULTURE
to have longer incubation periods in the plant than other transmisshysions Celery which is poorly susceptible to WX was an ideal plant for demonstrating fluctuation of the inoculative potential of WX vectors With more susceptible plants the threshhold concentration of disease agent for minimum incubation period is quicWy reached
With any given set of environmentul conditions the length of the incubation period of A Y and WX infection in plants was independent of the original concentration of virus originally injected into the vector This made it possible to discern between incubation periods in insects receiving different virus concentrations as follows
Itotal = Iinsect + Jplant
where Iplant was a constant mean value with constant variance In the case of WX this total-latent-period method was difficult to employ because the incubation period in celery 26 to 50 days was accompanied by high variability However development of AY symptoms in aster plantain or summer daisy required only 6 to 18 daTs and Ivas less variable Thus in total-latent-period assay transshyfers were usually not required to determine the incubation period only one dilution needed to be injected with each inoculum and fe--er insects were required for the single injection whereas a minimum of five transfers were required to determine the latent periods in O montanu8 before transmission of the WX agent
LITERATURE CITED
(1) ARMITAGE P and SPICER C C
1956 THE DETECTION OF VARIATION IN HOST SUSCEPTIDILlIY IN DILUTION
COUNTING EXPERUIENTS J Hyg Cambridge Eng 54 401-414 (2) BALD J G
1937 THE USE OF NlllBERS OF INFECTIONS FOR COMPARING THE CONshy
CENTRATION OF PLANT VIRUS SUSPENSIONS II DISTORTION OF
TilE DILUTION SERIES Ann App Bio 24 56-76 (3) B 1 CK L M
1941 FUUTITER EVIDENCE FOH lIUlTIILICATION OF THE ASTER Y~JLLOWS
VIRUS IN THE ASTER LEAFIIOlPEH Phytopathology 31 120-135 (4)
1913 GENErIC VAIUATION IN THE CLOVEU LEAFHOPfEUS ADILITY TO
TRANSlllT POTATO YELLOW-DWAHF VIRUS Genetics 28 200-209 (5)
1969 INSECT TISSUE CUUIUHES AS TOOLS IN PLANT YlUUS RESEAUCII
Ann Rev Phytopath 7 73-100 (6) --- and BRAKKE lL R
1952 MULrIPLlCNIION OF WOUND-TUMOR vmus IN AN INSflCT VECTOR
Phytopathology 42 269-273
BIOASSAY OF VIRUS AND MYCOPLASMALIKE ORGANISMS 29
(7) --- WOLCYRZ S and WHITCOMB R F 1958 A VECTORLESS STRAIN O~ WOUND-TUMOR VIRUS (Abstract) VlIth
Internatl Congo Microbiology p 225
(8) BRAKKE M K 1958 PROPERTIES ASSAY AND PURIFICATION OF WHEAT STREAK MOSAIC
VIRUS Phytopathology 48 439-445
(9) 1970 SYSTEMIC INFECTIONS FOR THE ASSAY OF PLANT VIRUSES Ann
Rev Phytopath 8 61-84
(10) --- VATTER A E and BLACK L lL 1954 SIZE AND SHAPE OF WOUND-TUMOR VIRUS ABNORMAL AND PATHshy
OLOGICAL PLANT GROWTH Brookhaven Symposia in Biology 6
137-156
(11) CHEN T and GRANADOS R R 1970 PLANT PATHOGENIC MYCOPL-s~rA-LIKE ORGANISlr MAINTENANCE
IN VITRO AND TRANSMISSION TO ZEA MAYS L Science 167
1633-1636
(12) CHlU R J and BLACK L M 1969 ASSAY OF WOUND TUMOR VIRUS BY THE FLUORESCENT CELL COUNTshy
ING TECHNIQUE Virology 37 667-677
(13) ---REDDY D V R and BLACK L M 1966 INOCULATION AND INFECTIOI OF LEAFHOPPER TISSUE CULTURES
WITH A PLANT VIRUS Virology 30 562-566
(14) DIXON W J and 1IASSEY F J
1957 INTRODUCTION TO STATISTICAL ANALYSIS lIcGraw Hill New
York N Y 488 pp
(15) DOl Y TERANAKA 11 YORA E and AsuLurA H
1967 MYCOPLASMA- OR PLT GROUP-LIKE MICROORGANISMS FOUND II
THE PHLOEM ELEMENTS OF PLANTS IIFECTED WITH lUIDERRY
DWARF POTATO WITCHES BRoo~r ASTER YELLOWS OR PAULOWshy
NI- WITCHES BROOM Phytopath Soc Japan Ann 33 259-266
(16) DUFFUS J E
1963 POSSIBLE MULTIPLICATIOI II THE APHID VECTOR OF SOWTHISTLE
YELLOW VEIN VIRUS A YlRlIS WITH AN EXTREMELY LONG INSECT
LATENT PtJRIOD Virology 21 194-202
(17) ELLIS E L and DELBRUCK M 1939 THE GROWTH OF BACTERIOPHAGE J Gen Physio 22 365-384
(18) ESPMARK J A and G-RD S
1965 DOSE-INCUBATION TIME RELATIONSHIPS IN VIRUS INFECTED TISSUE
CULTURES THEORETICAL CONSIDERATIONS Arch Ges Virusshy
forsch 15 137-150
(19) FINNEY D J
1964 STATISTICAL METHOD IN BIOLOGICAL ASSAY Hafner New York
2d ed 661 pp
(20) GUEZ R BLACK L 11 and MACLEOD R
1967 REEXAMINATION OF THE SEROLOGICAL RELATIONSHIP BETWEEN
WOUND-TUlIOR VIRUS AND REOVIRUS Virology 32 163-165
(21) GART J J
1965 SOME STOCHASTIC MODELS RELATING TIME AND DOSAGE IN RESPONSE
CURVES Biometrics 21 583-599
30 TECHNICAL BULLETIN 1438 US DEPT OF AGRICULTURE
(22) HIRUMI H and ~IARAMOROSCH K
1963 RECOVERY OF ASTER YELLOWS VIRUS FROM VARIOUS ORGANS OF
THE INSECT VECTOR MACROSTELES FASClFRONS COlltrib
Boyce Thompsollinst 22 141-151 (23) --- and MARAMOROSCH K
1964 INSECT TISSUE CULTURE USE OF BLASTOKINETIC STAGE OF
LtJAFHOPPER J~lBRYO Science 144 1465-1467 (24) --- and MARAMOROSCH K
1964 THE IN VITRO CULTIVATION OF EMBRYONIC LEAFHOPPER TISSUES
Exp Cell Res 36 625-631 (25) lSHIIE T Dor Y YORA K and ASUYAMA H
1967 SUPPRESSIVE EFFECTS OF ANTIBIOTICS OF TETRACYCLINE GROUP ON
SYMPTOM DEVELOPMENT OF MULBERRY DWARF DISEASE Phytoshy
path Soc Japan Ann 33 267-275 (26) JENSEN D D WmTcoMB R F and RICHARDSON J
1967 LETHALITY OF INJECTED PEACH WESTERN X-DISEASE VIRUS TO ITS
LEAFHOPPER YECTOR Virology 31 532-538 (27) KISIMOTO R
1967 GENETIC VARIATION IN THE ABILITY OF A PIANTHOPPER VECTOR
LAODELPHAX STRIATELLUS (FALLEN) TO ACQUIRE THE RICE
STRIPE VIRUS Virology 32 144-152 (28) KUNKEL L O
1937 EFFECT OF HEAT ON ABILITY OF ClCADULA SEXNOTATA (FALL)
TO TRANSMIT ASTER YELLOWS Amer J Bot 24 316-327 (29) LHERlTIER P
1958 THE HEREDITARY RUS OF DROSOPRlLA Adv Virus Res 5 195-245
(30) LIN S LEE C and CHIU R
1970 ISOLATION AND CULTIVATION OF AND INOCULATION WITH A MYCOshy
PLASMA CAUSING WHITE LEAF DISEASE IN SUGARCANE Phytoshy
pathology 60 795-797 (31) MARAMOROSCH K
1953 INCUBATION PERIOD OF ASTER-YELLOWS VIRUS Amer J Bot 40 797-809
(32) 1956 MULTIPLICATION OF ASTER YELLOWS VIRUS IN IN VITRO PREPAshy
nATIONS OF INSECT TISSUES Virology 2 369-376 (33) MrTSuHAsHI J and MARAMOROSCH K
1964 LEAFHOPPER TISSUE CULTURE EMBRYONIC NYMPHAL AND IMshy
AGINAL TISSUES FROM ASEPTIC INSECTS Contrib Boyce Thompshy
son lust 22 435-460
(34) NAGARAJ A N and BLACK L M
1962 HEREDITARY VARIATION IN THE ABILITY OF A LEAFHOPPER TO
TRANSMIT TWO UNRELATED PLANT VIRUSES Virology 16 152-162
(35) --- SINHA R C and BLACK L M 1961 A SMEAR TECHNIQUE FOR DETECTING VIRUS ANTIGEN IN INDIVIDUAL
VECTORS BY THE USE OF FLUORESCENT ANTIBODIES Virology 15 205-208
(36) NASU S JENSEN DD and RICHARDSON J
1970 ELECTRON lIticnoscopy OF MYCOPLASMA-LIKB BODIES ASSOCIATED
WITH INSECT AND PLANT HOSTS OF PIMCH WgSTEHN X-DISEASE
Virology 41 583-595
BIOASSAY OF VIRUS AND MYCOPLASMALIKE ORGANISMS 31
(37) OUCHTERLONY O
1958 DIFFUSION-IN-GEL METHODS FOR IMMUNOLOGICAL ANALYSIS In Progress in Allergy S Karger Basel N Y 5 1-78
(38) PARKER R F
1938 STATISTICAL STUDIES ON THE NATURE OF THE INFECTIOUS UNIT OF
VACCINE VIRUS J Exp Med 67 725-738
(39) PLUS N 1954 ETUDE DE LA MULTIPLICATION DU VIRUS DE LA SENSIBILITE AU
GAZ CARBONIQUE CHEZ LA DROSOPHILE Bull BioI de Ill France et
de Ill Belg 88 248-293
(40) REDDY D V R and BLACK L M 1966 PRODUCTION OF WOUND-TUlIOR VIRUS AND WOUND-TUlIOR SOLUBLE
ANTIGEN IN THE INSECT VECTOR Virology 30 551-561
(41) --- and BLACK L M 1969 COllPARATIVE INFECTIVITY OF WTV ISOLATES Ann Rev Phytoshy
pathoI 7 88-92
(42) SAITO Y
1969 HEMAGGLUTINATION OF LEAFHOPPER-DORNE VIRUSES In Viruses
Vectors and Yegetation Wiley Interscience New York N Y
pp463-474
(43) SHORTLEY G and WILKINS J R
1965 INDllPENDENT-ACTION AND BIRTHmiddot EATH llODELS IN EXPERIMENTAL
llICROBIOLOGY Bact Re 29 102-141
(44) SINHA R C
1965 SEQUENTIAL INFECTION AND DISTRIBUTION OF WOUND-TUMOR
VIRUS IN THE INTERNAl ORGNS OF A VECTOR AFTER IlOGESTION OF
VIRUS Virology 26 673-686
(45) --and REDDY D V R
1964 UlPROVED FLUORESCllNT SllEAR TECHNIQUE AND ITS APPLICATION
IN DETECTlNG VIRUS ANTIGENS IN AN INSECT VECTOR Yirology
21 626-634
(46) --- and CHIYKOWSKI L N 1968 IN[TIAL AND SUBSEQUENT SITES OF ASTER YELLOWS VIRUS INFECshy
TION IN A LEAFHOPPER TECTOR Virology 33 702-708
(47) STOREY H H 1933 INYESTIGATIONS OF THE llECHANISM OF THE TRANSMISSION OF
PLANT VIRUSES BY INSECT VECTORS I Roy Soc (London) Eroc B1l3 463--185
(48) SYLVESTER E S and RICHARDSON J 1966 RECHARGING PEA APHIDS WITH PEA ENATION MOSAIC VIRUS
Virology 30 592-597
(49) WHITCOllD R F
1964 A COlIPARISON OF SEROLOGICAL SCORING WITH TEST PLANT SCORING
OF LEAFHOPPERS INFECTED BYWOUND TUMOR VIRUS Virology24
488-492
(50)
1969 BIOASSAY OF PLANT VIRUSES TRANSMITTED PERSISTENTLY BY THEIR
VECTORS In Viruses Vectors and Vegetation Wiley Interscience
New York N Y pp 449-middot162
(51) -- and BLACK L jltI 1961 A PRECIPITIN RING TIME TEST FOR ESTIIATION OF RELATIVE
SOLUBLE-ANTIGEN CONCENTRATIONS Virology 15 507-508
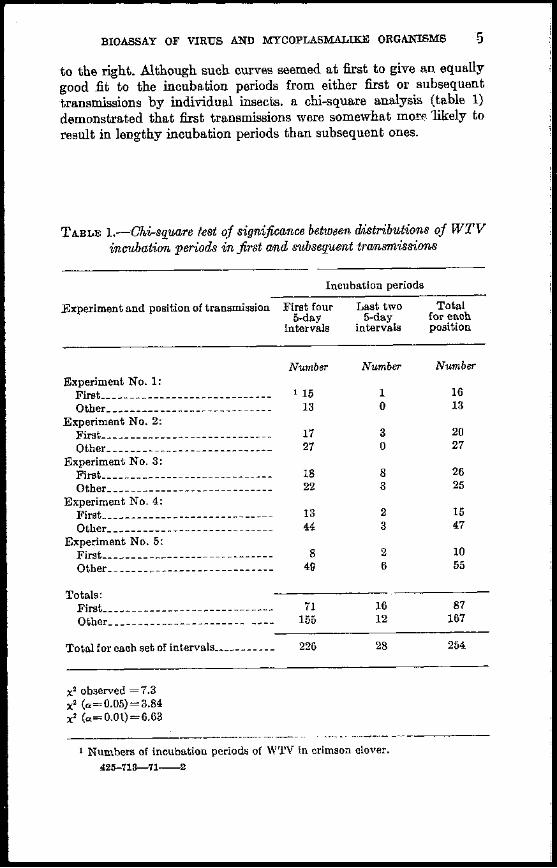
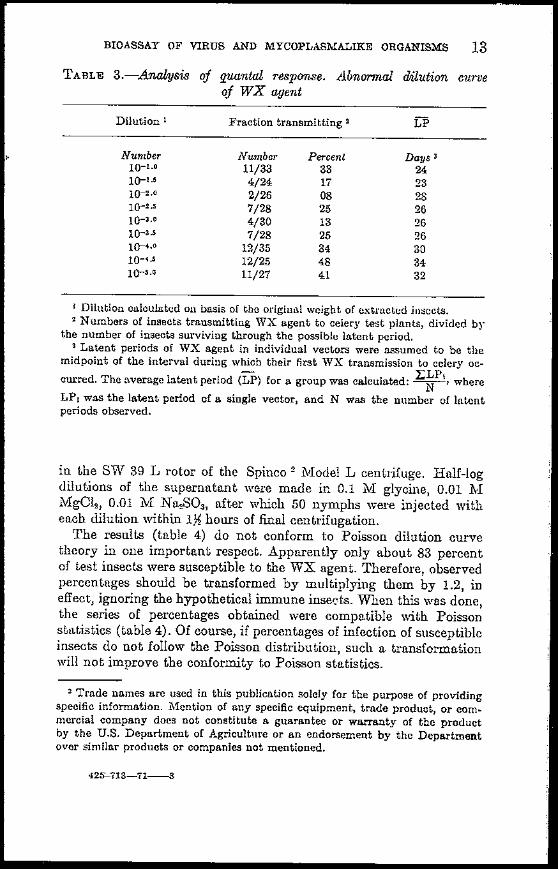
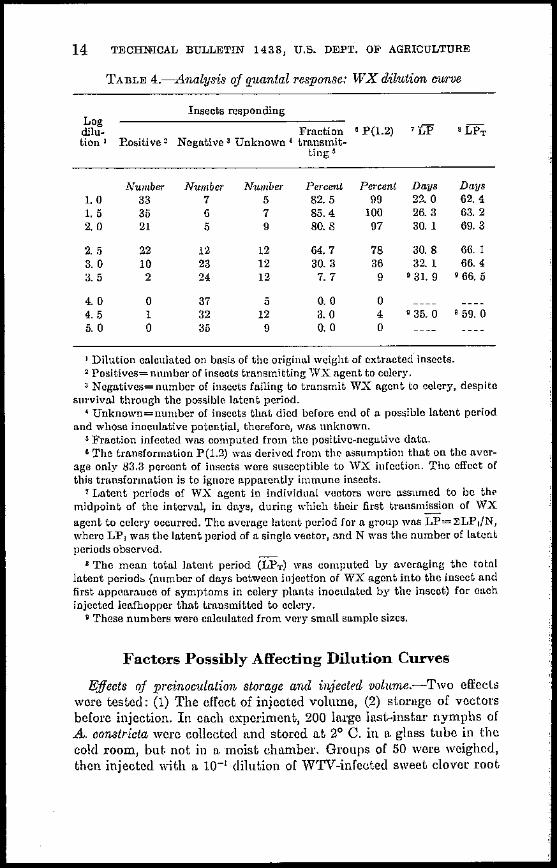

~ ~
~
~ ~
TABLE 6-Example oj calculation oj average latent period oj WX agent in leafhoppers
[The experimental treatments of WX inocula are followed by injection of the extract into leafhoppers Surviving leafhoppers are trans ferred to IlOW test plants at intervals 10 to 50 days after injection the range in which all latent periods fall Three- or four-day intervals ~ are preferable but intervals not necessarily equal of any length lllay be chosen A preliminary calculation is made of difference between ~ intervals in days]
lgto CraquoInterval (1) 00
Symbol and definition 1 2 3 4 q
foDays Days Days Days
D=Range of interval in days after injection ______________________________________________ _ 20-24 24-31 31-38 HI=Midpoint of interval in days after injection ___________________________________________ _ 22 275 345 d=Difference between midpoint of interval and midpoint of first interval (H-H1) ___________ _ 0 5 5 125
t138-52 ~ 45 ~
23 o Ij
gt
I sect
tj
~ ~ Ulmiddot
CALCULATION OF LATENT PERIOD USING ABOVE HI AND d i VALUES Ul
~ Weighted
average ~ Vectors transmitting during interval (nl) Surviving Percentage period Average latent
Inoculum vectors in- trans- between HI _ periodwlted eluding non- mission I and trans- LP H I +2n j dl ~
transmitters mission UlIr1 2 3 4 Total 2nldl time lir ~
tI
Number Number Number N1l1nber Number Number Percent Days Days ~ A ____________ Q0 0 0 0 0 28 0B _____________ ----------------------------shy1 1 13 4 19 24 79 17 13 68 3568C_____________ 6 7 9 0 22 24 9167 686 2886D ____________ 6 8 8 1 23 24 9583 7 26 2926E ____________ 4 9 5 4 22 28 7857 927 31 27F _____________
12 10 1 0 23 23 10000 293 2493G ____________ I7 10 5 0 22 28 78 57 5 34 273411____________ 1 1 7 0 9 18 50 00 10 33 32 33 o ld al
1 This value is not used to calculate the latent period but will be needed elsewhere ~ ~
t-l ~
24 TECHNiICAL BULLETIN 1438 US DEPT OF AGRICULTURE
Total-Latent-Period Method
Although the use of latent periods in the insect has enabled workers to perform assays which otherwise would not have been possible there are various objections to the method It is laborious to make even five transfers as was necessary for the WX agent Also the latent-period method necessarily entails making discontinuous obshyservations This can easily lead to quirks and contradictions when an unfortunate interval is chosen
With the aster yellows agent the shorter time scale for incubation periods in plant and insect makes the selection of intervals a critical matter It has turned out that the total latent period-the latent period in the insect plus the latent period in the plant-is a function of virus concentration Actually this observation was first made with the WX agent (table 4) despite the fact that the lengthy incubation period in the plant 28 days minimum to 70 days maximum obscured the results somewhat and augured against routine use It was preshydicted that the method should work best with an agent with a short latent period in the plant especially if that latent period was not greatly affected by the age of the plant The transmission of the aster yellows disease agent to summer daisy (Chrysanthemum carinatum Schousb) china aster (Oallistephus chinensis (L) Nees) or plantain (Plantago major L) fulfills these requirements
In two respects the standard bioiogical operations are modified with this assay It is necessary to use young males or nymphs sterilized by gamma rediation for injection If this is done the small test plants can be held in the controlled environment chamber and A Y symptoms read without removal of the cage with the insect still present
The principal steps of the technique are the same as for any gradedshyresponse assay A dilution-curve control is performed and the reshysponses (in this case the total latent periods) are plotted graphically (fig 8) Unknown samples are injected under the same conditions as the control and subsequent biological operations performed under the same environmental conditions The standard assumption of bioassay that unknown aliquots produce responses that bear a similar relationshyship to concentration as aliquots of the control dilutions must be made For example the dispersity of the agent in the various inocula must be comparable If there is a steep time-decay curve for infective units this can alter the effective concentration determined In the case of agents that propagate in leafhoppers these factors may freshyquently be operative Results of two experiments with the AY agent are presented (tables 7 8 fig 8) as examples of this method
BIOASSAY OF VIRUS AND MYCOPLASMALIKE ORGANISMS 25
FIGURE 8-Relationship of total latent period to A Y concentration The line drawn is a st -ndard curve fitted to the points of the dilution curve (table 8) Total latent periods observed after injection of treated extracts can be conshyverted to A Y concentration by means of this standard curve
SUMMARY AND DISCUSSION
Concepts and problems of the bioassay of a leafhopper-borne plant virus-clover wound tumor virus (WTV) and of two yellows disease agents-the peach Western X-disease agent (WX) and the agent of aster yellows disease (AY) are discussed The principal details of assay were found to be similar for both types of agent Machine proshyduction of needles and improved methods for the transfer and mainshytenance of test insects make such bioassays less laborious and cumbersome than they once were Interpretative methods now need to be developed to realize the fullest potential of existing bioassay techniques
Dosage-response curves obtained by injecting disease agents into leafhoppers had problematical interpretations Although the fraction of infected insects decreased in groups injected with lower concentrashytions of disease agents the observed slope of the dosage~response curve was always less than the theoretical unit slope if crude inocula were
26 lECHNICAL BULLETIN 1438 US DEPT OF AGRICULTURE
TABLE 7-Total-latent-period method Aster yellows iran81Ylission to summer daisy
[Four buffers were tested with the aster yellows agent Final yield of agent was determined by injecting single concentrations of each and comparing the total latent period (time in insect and plant before symptoms could be detected) from each with a standard curve whose slope was derived from control dilutions Only two dilutions were used it would have been preferable to have had three or four Graphic interpolation of concentration as in figure 8 Olear differences are asserted between alkaline and acid pH and between buffers 0 and D]
Material tested Fraction Total latent Log1o transmitting period units AY
Dilution of extract Number Days10- __________________________1 2428 294 210-2__________________________ 2225 33 9 1
Buffer and pHA(61) _______________________ 2226 309 15 A(i5) ________________________ 3739 309 1 5 BC61) ________________________ 2525 323 125 0(80) ________________________ 3838 294 2 D (80) _______________________ 3536 279 3
injected Reversible complexing and aggregation of the particles of disease agents as well as variations in susceptibility among the test insects are likely factors in reduction of the slope of the dosageshyresponse curves in both WX and WTV assays Other factors such as interference in the establishment of infection by background mateshyrials or by inactive virus particles may also reduce the slope
Storage of test insects before injection apparently increases their capacity for acceptance of fluid The volume of inoculum injected could be deliberately varied by a sevenfold factor The dosage reshysponse was correspondingly affected by such an increase Variations in the volume of inoculum injected into test insects and failures to detect insects infected by injection were additionuJ sources of error Such errors however should be randomly distributed and shouJd not affect the slope of the dosage-response curve Further experiments with known dilutions of purified virus are highly desirable since dosage-response curves provide importunt dues lIgarc1ing the nature of the infection process
Incubation-period data long overlooked as sources of information about virus concentration were found to be most adaptable to analyshysisEstimaHon of incubation-period statistics such as the average
----------
----------------------------------------
BIOASSAY OF VIRUS AND MYCOPLASMALIKE ORGANISMS 27
TABLE 8-Total-latent-perwd method Aster yellows transmission to aster 1
~Iaterial tested
Dilution of extract 10-1________________
10-2________________
10-3 ______ ---------shy10-1________________
Treatment1__________________ 2__________________ 3__________________ 4__________________
Time 2
Minutes 0
20 40
150
60 80 95
120
Fraction transshymitting
Number 910
2325 1517 1315
2430 1328
624 025
Total latent
period 3
Days 12 8 15 8 185 14 0
158 185 188
3 0 20 10 25
20 10 9 0
Log units AY
corrected for time 5
2 2 13 13 0
1 Four treatments of increasing intensity were applied to an A Y extract Analysis as in table 7
2 Time between preparation of inoculum and injection 3 Time between injection of an insect and first appearance of symptoms on
asters The value of 1 was arbitrarily asSigned to the extract at 10-3bull
5 The A Y concentrations were corrected for time by construccing a time-decay curve with the two replicate injections of 10-1 inoculum and assuming that all inocula decayed at the observed rate
latent period or T 50 (time at which 50 percent of transmitters were transmitting at least once weekly) for groups of insects allowed the estimation of concentration of the disease agent in many samples within a single experiment ond permitted construction of infectivityshyscanning curves for fractions from purification procedures The best statistical treatment of incubation-period data has not been detershymined butseverai empirical methods are presented as interim proshycedures until more sophisticated analyses (18 19 21) are available
Incubation periods ill plants as well as insects were dosageshydependent although the dependence in plnnts was more difficult to demonstrate This dillicultr was attributed to the steep growth curves of disease agents in their vectors which seemingly assure that most successful transmission events are induced by concentrations of agent greatly in excess of the minimum concentration required to produce the minimum incubation period in the plant The earliest or the latest transmissions by vectors transmitting the WX agent to celery tended
28 TE(JHN[CAL BULLETIN 1438 US DEPT OF AGRICULTURE
to have longer incubation periods in the plant than other transmisshysions Celery which is poorly susceptible to WX was an ideal plant for demonstrating fluctuation of the inoculative potential of WX vectors With more susceptible plants the threshhold concentration of disease agent for minimum incubation period is quicWy reached
With any given set of environmentul conditions the length of the incubation period of A Y and WX infection in plants was independent of the original concentration of virus originally injected into the vector This made it possible to discern between incubation periods in insects receiving different virus concentrations as follows
Itotal = Iinsect + Jplant
where Iplant was a constant mean value with constant variance In the case of WX this total-latent-period method was difficult to employ because the incubation period in celery 26 to 50 days was accompanied by high variability However development of AY symptoms in aster plantain or summer daisy required only 6 to 18 daTs and Ivas less variable Thus in total-latent-period assay transshyfers were usually not required to determine the incubation period only one dilution needed to be injected with each inoculum and fe--er insects were required for the single injection whereas a minimum of five transfers were required to determine the latent periods in O montanu8 before transmission of the WX agent
LITERATURE CITED
(1) ARMITAGE P and SPICER C C
1956 THE DETECTION OF VARIATION IN HOST SUSCEPTIDILlIY IN DILUTION
COUNTING EXPERUIENTS J Hyg Cambridge Eng 54 401-414 (2) BALD J G
1937 THE USE OF NlllBERS OF INFECTIONS FOR COMPARING THE CONshy
CENTRATION OF PLANT VIRUS SUSPENSIONS II DISTORTION OF
TilE DILUTION SERIES Ann App Bio 24 56-76 (3) B 1 CK L M
1941 FUUTITER EVIDENCE FOH lIUlTIILICATION OF THE ASTER Y~JLLOWS
VIRUS IN THE ASTER LEAFIIOlPEH Phytopathology 31 120-135 (4)
1913 GENErIC VAIUATION IN THE CLOVEU LEAFHOPfEUS ADILITY TO
TRANSlllT POTATO YELLOW-DWAHF VIRUS Genetics 28 200-209 (5)
1969 INSECT TISSUE CUUIUHES AS TOOLS IN PLANT YlUUS RESEAUCII
Ann Rev Phytopath 7 73-100 (6) --- and BRAKKE lL R
1952 MULrIPLlCNIION OF WOUND-TUMOR vmus IN AN INSflCT VECTOR
Phytopathology 42 269-273
BIOASSAY OF VIRUS AND MYCOPLASMALIKE ORGANISMS 29
(7) --- WOLCYRZ S and WHITCOMB R F 1958 A VECTORLESS STRAIN O~ WOUND-TUMOR VIRUS (Abstract) VlIth
Internatl Congo Microbiology p 225
(8) BRAKKE M K 1958 PROPERTIES ASSAY AND PURIFICATION OF WHEAT STREAK MOSAIC
VIRUS Phytopathology 48 439-445
(9) 1970 SYSTEMIC INFECTIONS FOR THE ASSAY OF PLANT VIRUSES Ann
Rev Phytopath 8 61-84
(10) --- VATTER A E and BLACK L lL 1954 SIZE AND SHAPE OF WOUND-TUMOR VIRUS ABNORMAL AND PATHshy
OLOGICAL PLANT GROWTH Brookhaven Symposia in Biology 6
137-156
(11) CHEN T and GRANADOS R R 1970 PLANT PATHOGENIC MYCOPL-s~rA-LIKE ORGANISlr MAINTENANCE
IN VITRO AND TRANSMISSION TO ZEA MAYS L Science 167
1633-1636
(12) CHlU R J and BLACK L M 1969 ASSAY OF WOUND TUMOR VIRUS BY THE FLUORESCENT CELL COUNTshy
ING TECHNIQUE Virology 37 667-677
(13) ---REDDY D V R and BLACK L M 1966 INOCULATION AND INFECTIOI OF LEAFHOPPER TISSUE CULTURES
WITH A PLANT VIRUS Virology 30 562-566
(14) DIXON W J and 1IASSEY F J
1957 INTRODUCTION TO STATISTICAL ANALYSIS lIcGraw Hill New
York N Y 488 pp
(15) DOl Y TERANAKA 11 YORA E and AsuLurA H
1967 MYCOPLASMA- OR PLT GROUP-LIKE MICROORGANISMS FOUND II
THE PHLOEM ELEMENTS OF PLANTS IIFECTED WITH lUIDERRY
DWARF POTATO WITCHES BRoo~r ASTER YELLOWS OR PAULOWshy
NI- WITCHES BROOM Phytopath Soc Japan Ann 33 259-266
(16) DUFFUS J E
1963 POSSIBLE MULTIPLICATIOI II THE APHID VECTOR OF SOWTHISTLE
YELLOW VEIN VIRUS A YlRlIS WITH AN EXTREMELY LONG INSECT
LATENT PtJRIOD Virology 21 194-202
(17) ELLIS E L and DELBRUCK M 1939 THE GROWTH OF BACTERIOPHAGE J Gen Physio 22 365-384
(18) ESPMARK J A and G-RD S
1965 DOSE-INCUBATION TIME RELATIONSHIPS IN VIRUS INFECTED TISSUE
CULTURES THEORETICAL CONSIDERATIONS Arch Ges Virusshy
forsch 15 137-150
(19) FINNEY D J
1964 STATISTICAL METHOD IN BIOLOGICAL ASSAY Hafner New York
2d ed 661 pp
(20) GUEZ R BLACK L 11 and MACLEOD R
1967 REEXAMINATION OF THE SEROLOGICAL RELATIONSHIP BETWEEN
WOUND-TUlIOR VIRUS AND REOVIRUS Virology 32 163-165
(21) GART J J
1965 SOME STOCHASTIC MODELS RELATING TIME AND DOSAGE IN RESPONSE
CURVES Biometrics 21 583-599
30 TECHNICAL BULLETIN 1438 US DEPT OF AGRICULTURE
(22) HIRUMI H and ~IARAMOROSCH K
1963 RECOVERY OF ASTER YELLOWS VIRUS FROM VARIOUS ORGANS OF
THE INSECT VECTOR MACROSTELES FASClFRONS COlltrib
Boyce Thompsollinst 22 141-151 (23) --- and MARAMOROSCH K
1964 INSECT TISSUE CULTURE USE OF BLASTOKINETIC STAGE OF
LtJAFHOPPER J~lBRYO Science 144 1465-1467 (24) --- and MARAMOROSCH K
1964 THE IN VITRO CULTIVATION OF EMBRYONIC LEAFHOPPER TISSUES
Exp Cell Res 36 625-631 (25) lSHIIE T Dor Y YORA K and ASUYAMA H
1967 SUPPRESSIVE EFFECTS OF ANTIBIOTICS OF TETRACYCLINE GROUP ON
SYMPTOM DEVELOPMENT OF MULBERRY DWARF DISEASE Phytoshy
path Soc Japan Ann 33 267-275 (26) JENSEN D D WmTcoMB R F and RICHARDSON J
1967 LETHALITY OF INJECTED PEACH WESTERN X-DISEASE VIRUS TO ITS
LEAFHOPPER YECTOR Virology 31 532-538 (27) KISIMOTO R
1967 GENETIC VARIATION IN THE ABILITY OF A PIANTHOPPER VECTOR
LAODELPHAX STRIATELLUS (FALLEN) TO ACQUIRE THE RICE
STRIPE VIRUS Virology 32 144-152 (28) KUNKEL L O
1937 EFFECT OF HEAT ON ABILITY OF ClCADULA SEXNOTATA (FALL)
TO TRANSMIT ASTER YELLOWS Amer J Bot 24 316-327 (29) LHERlTIER P
1958 THE HEREDITARY RUS OF DROSOPRlLA Adv Virus Res 5 195-245
(30) LIN S LEE C and CHIU R
1970 ISOLATION AND CULTIVATION OF AND INOCULATION WITH A MYCOshy
PLASMA CAUSING WHITE LEAF DISEASE IN SUGARCANE Phytoshy
pathology 60 795-797 (31) MARAMOROSCH K
1953 INCUBATION PERIOD OF ASTER-YELLOWS VIRUS Amer J Bot 40 797-809
(32) 1956 MULTIPLICATION OF ASTER YELLOWS VIRUS IN IN VITRO PREPAshy
nATIONS OF INSECT TISSUES Virology 2 369-376 (33) MrTSuHAsHI J and MARAMOROSCH K
1964 LEAFHOPPER TISSUE CULTURE EMBRYONIC NYMPHAL AND IMshy
AGINAL TISSUES FROM ASEPTIC INSECTS Contrib Boyce Thompshy
son lust 22 435-460
(34) NAGARAJ A N and BLACK L M
1962 HEREDITARY VARIATION IN THE ABILITY OF A LEAFHOPPER TO
TRANSMIT TWO UNRELATED PLANT VIRUSES Virology 16 152-162
(35) --- SINHA R C and BLACK L M 1961 A SMEAR TECHNIQUE FOR DETECTING VIRUS ANTIGEN IN INDIVIDUAL
VECTORS BY THE USE OF FLUORESCENT ANTIBODIES Virology 15 205-208
(36) NASU S JENSEN DD and RICHARDSON J
1970 ELECTRON lIticnoscopy OF MYCOPLASMA-LIKB BODIES ASSOCIATED
WITH INSECT AND PLANT HOSTS OF PIMCH WgSTEHN X-DISEASE
Virology 41 583-595
BIOASSAY OF VIRUS AND MYCOPLASMALIKE ORGANISMS 31
(37) OUCHTERLONY O
1958 DIFFUSION-IN-GEL METHODS FOR IMMUNOLOGICAL ANALYSIS In Progress in Allergy S Karger Basel N Y 5 1-78
(38) PARKER R F
1938 STATISTICAL STUDIES ON THE NATURE OF THE INFECTIOUS UNIT OF
VACCINE VIRUS J Exp Med 67 725-738
(39) PLUS N 1954 ETUDE DE LA MULTIPLICATION DU VIRUS DE LA SENSIBILITE AU
GAZ CARBONIQUE CHEZ LA DROSOPHILE Bull BioI de Ill France et
de Ill Belg 88 248-293
(40) REDDY D V R and BLACK L M 1966 PRODUCTION OF WOUND-TUlIOR VIRUS AND WOUND-TUlIOR SOLUBLE
ANTIGEN IN THE INSECT VECTOR Virology 30 551-561
(41) --- and BLACK L M 1969 COllPARATIVE INFECTIVITY OF WTV ISOLATES Ann Rev Phytoshy
pathoI 7 88-92
(42) SAITO Y
1969 HEMAGGLUTINATION OF LEAFHOPPER-DORNE VIRUSES In Viruses
Vectors and Yegetation Wiley Interscience New York N Y
pp463-474
(43) SHORTLEY G and WILKINS J R
1965 INDllPENDENT-ACTION AND BIRTHmiddot EATH llODELS IN EXPERIMENTAL
llICROBIOLOGY Bact Re 29 102-141
(44) SINHA R C
1965 SEQUENTIAL INFECTION AND DISTRIBUTION OF WOUND-TUMOR
VIRUS IN THE INTERNAl ORGNS OF A VECTOR AFTER IlOGESTION OF
VIRUS Virology 26 673-686
(45) --and REDDY D V R
1964 UlPROVED FLUORESCllNT SllEAR TECHNIQUE AND ITS APPLICATION
IN DETECTlNG VIRUS ANTIGENS IN AN INSECT VECTOR Yirology
21 626-634
(46) --- and CHIYKOWSKI L N 1968 IN[TIAL AND SUBSEQUENT SITES OF ASTER YELLOWS VIRUS INFECshy
TION IN A LEAFHOPPER TECTOR Virology 33 702-708
(47) STOREY H H 1933 INYESTIGATIONS OF THE llECHANISM OF THE TRANSMISSION OF
PLANT VIRUSES BY INSECT VECTORS I Roy Soc (London) Eroc B1l3 463--185
(48) SYLVESTER E S and RICHARDSON J 1966 RECHARGING PEA APHIDS WITH PEA ENATION MOSAIC VIRUS
Virology 30 592-597
(49) WHITCOllD R F
1964 A COlIPARISON OF SEROLOGICAL SCORING WITH TEST PLANT SCORING
OF LEAFHOPPERS INFECTED BYWOUND TUMOR VIRUS Virology24
488-492
(50)
1969 BIOASSAY OF PLANT VIRUSES TRANSMITTED PERSISTENTLY BY THEIR
VECTORS In Viruses Vectors and Vegetation Wiley Interscience
New York N Y pp 449-middot162
(51) -- and BLACK L jltI 1961 A PRECIPITIN RING TIME TEST FOR ESTIIATION OF RELATIVE
SOLUBLE-ANTIGEN CONCENTRATIONS Virology 15 507-508
