njcat technology verification kraken...
TRANSCRIPT
NJCAT TECHNOLOGY VERIFICATION
Kraken® Membrane Filtration System
Bio Clean Environmental Services, Inc.
(With April 2016 Addendum)
February, 2016
i
Table of Contents
Page
Table of Contents ....................................................................................................................... i
List of Figures ........................................................................................................................... ii
List of Tables ............................................................................................................................ ii
1. Description of Technology ..................................................................................................1
2. Laboratory Testing ...............................................................................................................2
2.1 Test Setup.......................................................................................................................2
2.2 Test Sediment.................................................................................................................6
2.3 Removal Efficiency Testing ..........................................................................................8
2.4 Sediment Mass Loading Capacity .................................................................................9
2.5 Scour Testing .................................................................................................................9
3. Performance Claims .............................................................................................................9
4. Supporting Documentation ................................................................................................10
4.1 Removal Efficiency Testing ........................................................................................11
4.2 Sediment Mass Loading Capacity ...............................................................................17
4.3 Filter Driving Head ......................................................................................................18
5. Design Limitations .............................................................................................................25
6. Maintenance Plans .............................................................................................................27
7. Statements ..........................................................................................................................30
8. References ..........................................................................................................................35
Verification Appendix .............................................................................................................36
Addendum ................................................................................................................................42
ii
List of Figures
Page
Figure 1 Kraken® Design ............................................................................................................... 1
Figure 2 Kraken® Filter KF-4-4 ..................................................................................................... 2
Figure 3 Test Flow Loop................................................................................................................ 3
Figure 4 Test Flow Loop Detail ..................................................................................................... 3
Figure 5 Background Sampling Point ............................................................................................ 4
Figure 6 Effluent Sampling – Removal Efficiency Test ................................................................ 5
Figure 7 Sediment Addition Point ................................................................................................. 6
Figure 8 Average Particle Size Distribution of Test Sediment ...................................................... 7
Figure 9 Removal Efficiency vs Sediment Mass Loading for the Kraken® KF 4-4 ................... 18
Figure 10 Increase in Driving Head vs Sediment Mass Loading ............................................... 19
List of Tables
Page
Table 1 Particle Size Distribution of Test Sediment ...................................................................... 7
Table 2 Removal Efficiency Sampling Frequency ........................................................................ 8
Table 3 Removal Efficiency Water Flow Rate ............................................................................. 12
Table 4 Removal Efficiency Sediment Feed Rate ....................................................................... 13
Table 5 Removal Efficiency Drain Down Losses........................................................................ 14
Table 6 Removal Efficiency SSC Data ........................................................................................ 15
Table 7 Removal Efficiency Results............................................................................................ 17
Table 8 Sediment Mass Loading Water Flow Rate ..................................................................... 20
Table 9 Sediment Mass Loading Sediment Feed Rate ................................................................. 21
Table 10 Sediment Mass Loading Drain Down Loses ................................................................. 22
Table 11 Sediment Mass Loading SSC Data ............................................................................... 23
Table 12 Sediment Mass Loading Removal Efficiency Results .................................................. 24
1
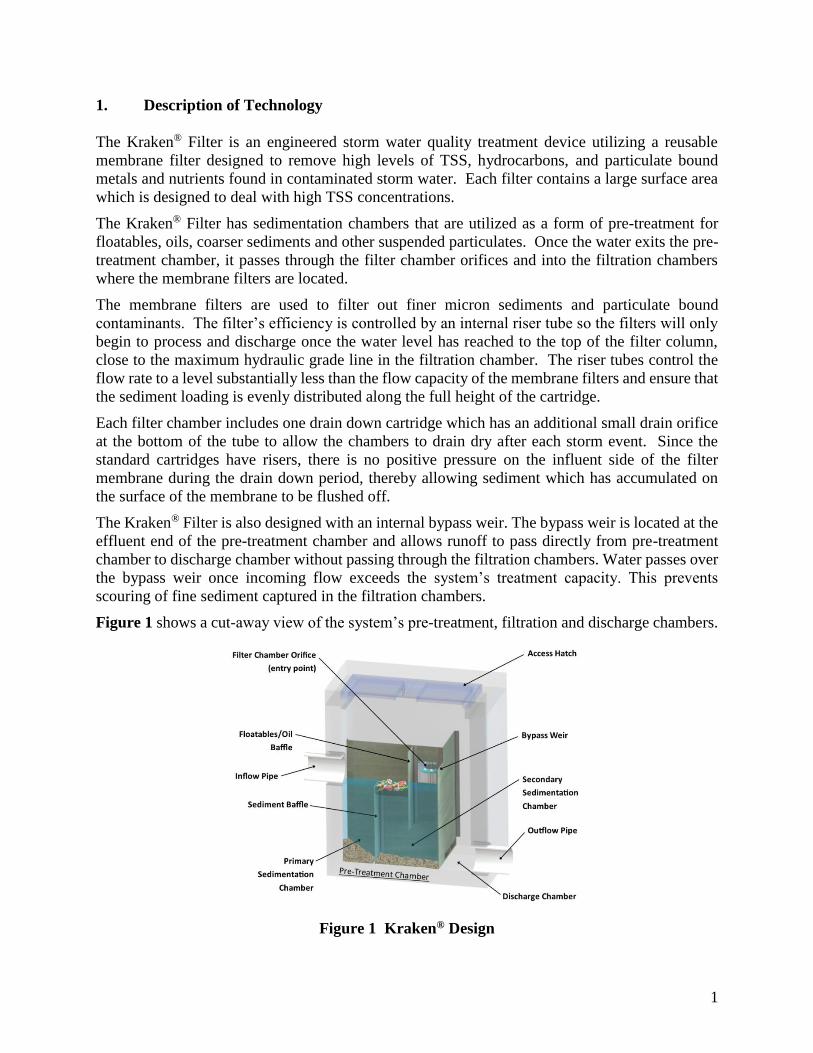
1. Description of Technology
The Kraken® Filter is an engineered storm water quality treatment device utilizing a reusable
membrane filter designed to remove high levels of TSS, hydrocarbons, and particulate bound
metals and nutrients found in contaminated storm water. Each filter contains a large surface area
which is designed to deal with high TSS concentrations.
The Kraken® Filter has sedimentation chambers that are utilized as a form of pre-treatment for
floatables, oils, coarser sediments and other suspended particulates. Once the water exits the pre-
treatment chamber, it passes through the filter chamber orifices and into the filtration chambers
where the membrane filters are located.
The membrane filters are used to filter out finer micron sediments and particulate bound
contaminants. The filter’s efficiency is controlled by an internal riser tube so the filters will only
begin to process and discharge once the water level has reached to the top of the filter column,
close to the maximum hydraulic grade line in the filtration chamber. The riser tubes control the
flow rate to a level substantially less than the flow capacity of the membrane filters and ensure that
the sediment loading is evenly distributed along the full height of the cartridge.
Each filter chamber includes one drain down cartridge which has an additional small drain orifice
at the bottom of the tube to allow the chambers to drain dry after each storm event. Since the
standard cartridges have risers, there is no positive pressure on the influent side of the filter
membrane during the drain down period, thereby allowing sediment which has accumulated on
the surface of the membrane to be flushed off.
The Kraken® Filter is also designed with an internal bypass weir. The bypass weir is located at the
effluent end of the pre-treatment chamber and allows runoff to pass directly from pre-treatment
chamber to discharge chamber without passing through the filtration chambers. Water passes over
the bypass weir once incoming flow exceeds the system’s treatment capacity. This prevents
scouring of fine sediment captured in the filtration chambers.
Figure 1 shows a cut-away view of the system’s pre-treatment, filtration and discharge chambers.
Figure 1 Kraken® Design
2
2. Laboratory Testing
The test program was conducted by Good Harbour Laboratories, an independent water technology
testing lab, at their site in Mississauga, Ontario. Testing occurred during the month of August,
2015. The Kraken® Filter that was tested in the laboratory was identical to a commercially
available unit with the exception that it did not have a concrete top that would be associated with
a unit installed below grade. For lab testing there was no need for a concrete top as it would inhibit
access to the unit. There was no effect on testing by not having a top on the unit.
Laboratory testing was done in accordance with the New Jersey Department of Environmental
Protection Laboratory Protocol to Assess Total Suspended Solids Removal by a Filtration
Manufactured Treatment Device (January, 2013). Prior to starting the performance testing
program, a quality assurance project plan (QAPP) was submitted to and approved by the New
Jersey Corporation for Advanced Technology (NJCAT).
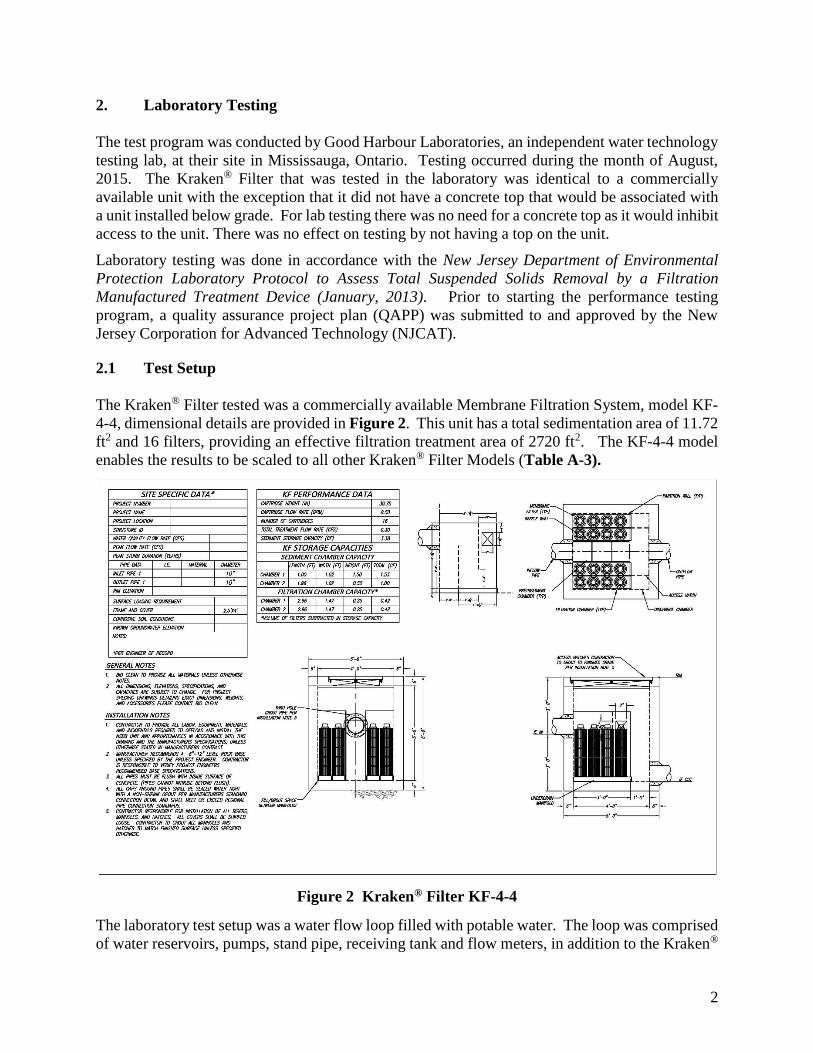
2.1 Test Setup
The Kraken® Filter tested was a commercially available Membrane Filtration System, model KF-
4-4, dimensional details are provided in Figure 2. This unit has a total sedimentation area of 11.72
ft2 and 16 filters, providing an effective filtration treatment area of 2720 ft2. The KF-4-4 model
enables the results to be scaled to all other Kraken® Filter Models (Table A-3).
Figure 2 Kraken® Filter KF-4-4
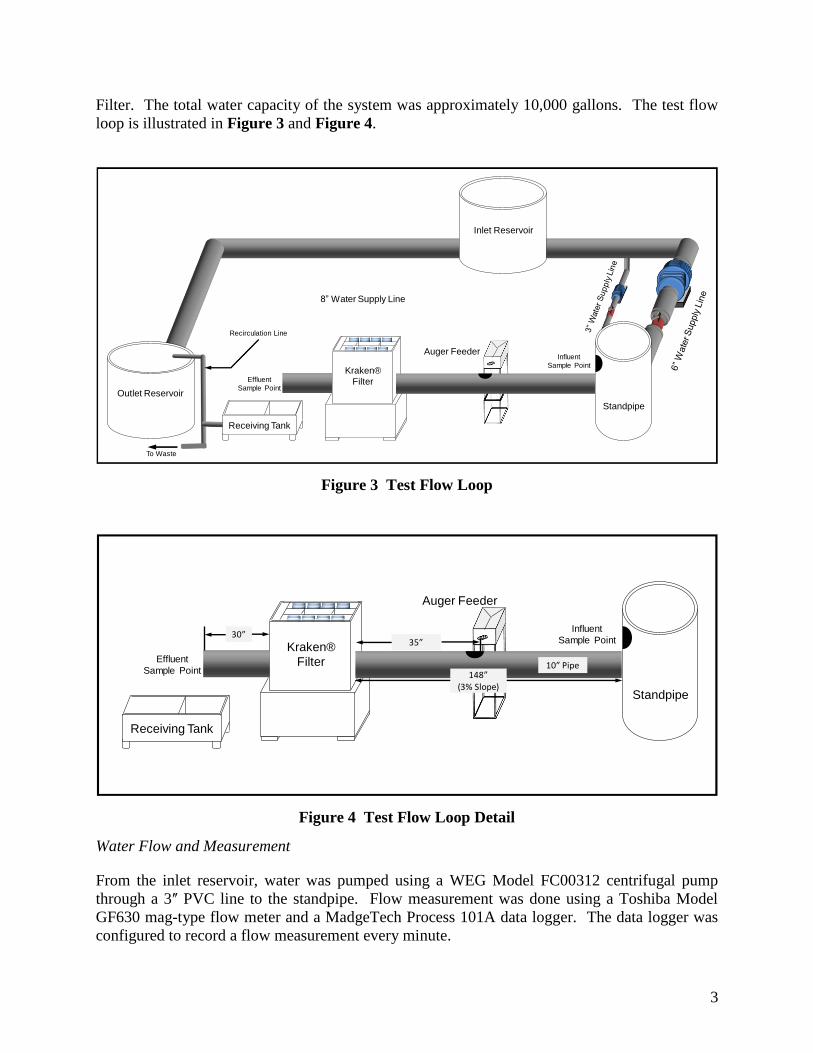
The laboratory test setup was a water flow loop filled with potable water. The loop was comprised
of water reservoirs, pumps, stand pipe, receiving tank and flow meters, in addition to the Kraken®
3
Filter. The total water capacity of the system was approximately 10,000 gallons. The test flow
loop is illustrated in Figure 3 and Figure 4.
Figure 3 Test Flow Loop
Figure 4 Test Flow Loop Detail
Water Flow and Measurement
From the inlet reservoir, water was pumped using a WEG Model FC00312 centrifugal pump
through a 3ʺ PVC line to the standpipe. Flow measurement was done using a Toshiba Model
GF630 mag-type flow meter and a MadgeTech Process 101A data logger. The data logger was
configured to record a flow measurement every minute.
Receiving Tank
Standpipe
Inlet Reservoir
8” Water Supply Line
Kraken®
Filter
Auger Feeder
Outlet Reservoir
To Waste
Recirculation Line
Effluent
Sample Point
Influent
Sample Point
Receiving Tank
Standpipe
Kraken®
Filter
Auger Feeder
Effluent
Sample Point
Influent
Sample Point
10” Pipe148”
(3% Slope)
35”30”
4
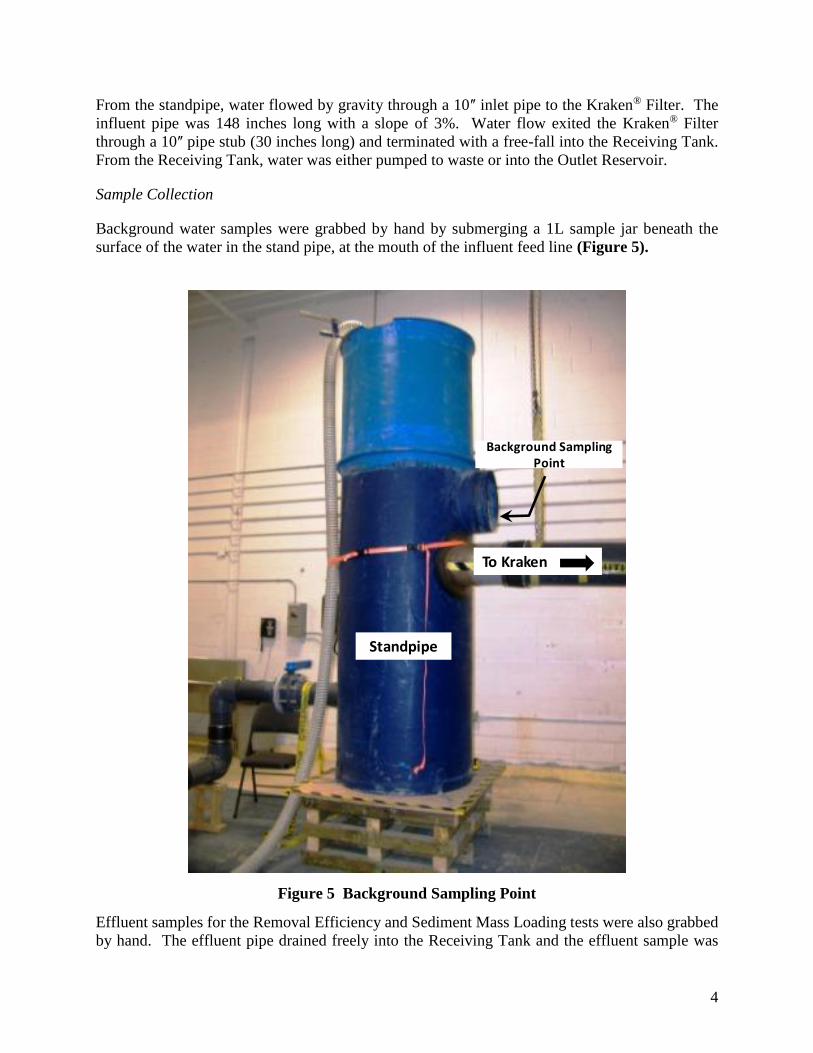
From the standpipe, water flowed by gravity through a 10ʺ inlet pipe to the Kraken® Filter. The
influent pipe was 148 inches long with a slope of 3%. Water flow exited the Kraken® Filter
through a 10ʺ pipe stub (30 inches long) and terminated with a free-fall into the Receiving Tank.
From the Receiving Tank, water was either pumped to waste or into the Outlet Reservoir.
Sample Collection
Background water samples were grabbed by hand by submerging a 1L sample jar beneath the
surface of the water in the stand pipe, at the mouth of the influent feed line (Figure 5).
Figure 5 Background Sampling Point
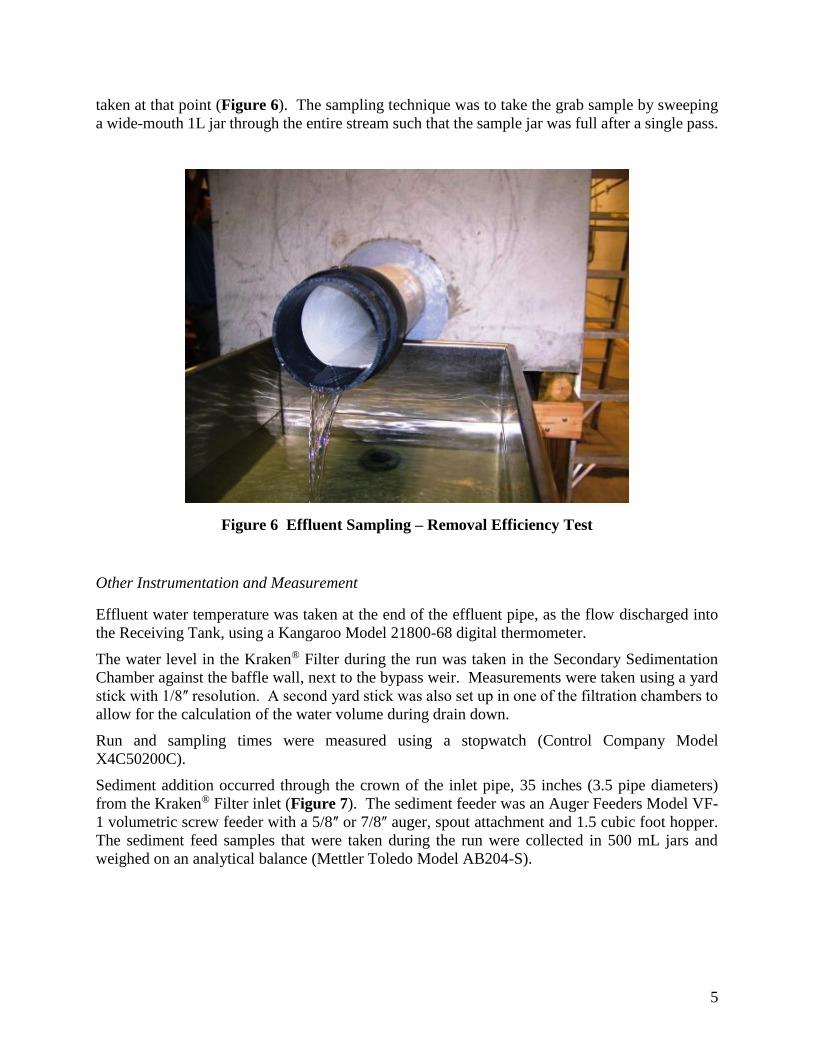
Effluent samples for the Removal Efficiency and Sediment Mass Loading tests were also grabbed
by hand. The effluent pipe drained freely into the Receiving Tank and the effluent sample was
Standpipe
To Kraken
Background SamplingPoint
5
taken at that point (Figure 6). The sampling technique was to take the grab sample by sweeping
a wide-mouth 1L jar through the entire stream such that the sample jar was full after a single pass.
Figure 6 Effluent Sampling – Removal Efficiency Test
Other Instrumentation and Measurement
Effluent water temperature was taken at the end of the effluent pipe, as the flow discharged into
the Receiving Tank, using a Kangaroo Model 21800-68 digital thermometer.
The water level in the Kraken® Filter during the run was taken in the Secondary Sedimentation
Chamber against the baffle wall, next to the bypass weir. Measurements were taken using a yard
stick with 1/8ʺ resolution. A second yard stick was also set up in one of the filtration chambers to
allow for the calculation of the water volume during drain down.
Run and sampling times were measured using a stopwatch (Control Company Model
X4C50200C).
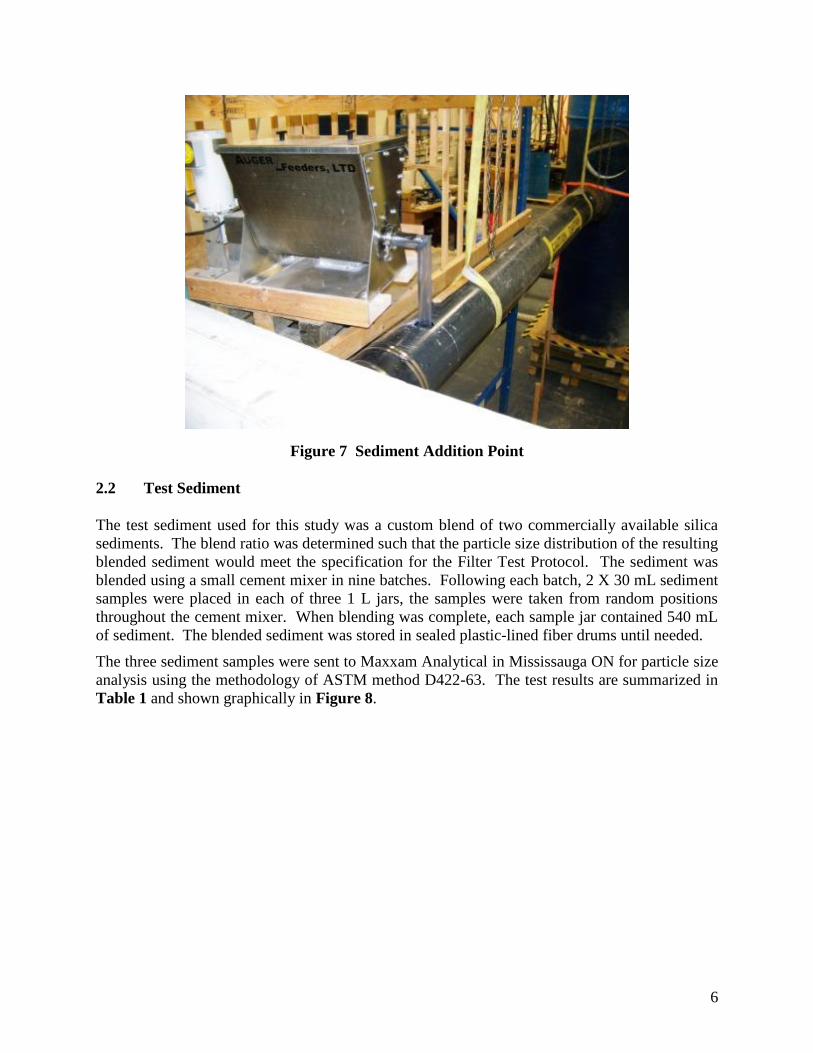
Sediment addition occurred through the crown of the inlet pipe, 35 inches (3.5 pipe diameters)
from the Kraken® Filter inlet (Figure 7). The sediment feeder was an Auger Feeders Model VF-
1 volumetric screw feeder with a 5/8ʺ or 7/8ʺ auger, spout attachment and 1.5 cubic foot hopper.
The sediment feed samples that were taken during the run were collected in 500 mL jars and
weighed on an analytical balance (Mettler Toledo Model AB204-S).
6
Figure 7 Sediment Addition Point
2.2 Test Sediment
The test sediment used for this study was a custom blend of two commercially available silica
sediments. The blend ratio was determined such that the particle size distribution of the resulting
blended sediment would meet the specification for the Filter Test Protocol. The sediment was
blended using a small cement mixer in nine batches. Following each batch, 2 X 30 mL sediment
samples were placed in each of three 1 L jars, the samples were taken from random positions
throughout the cement mixer. When blending was complete, each sample jar contained 540 mL
of sediment. The blended sediment was stored in sealed plastic-lined fiber drums until needed.
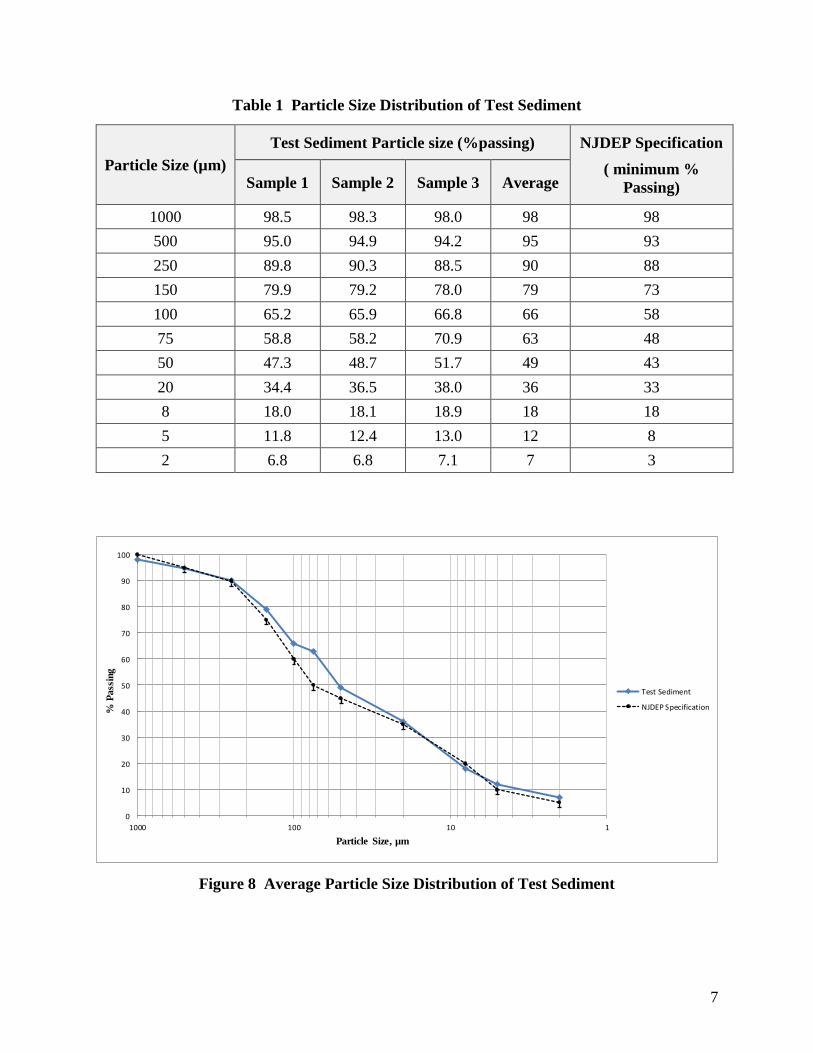
The three sediment samples were sent to Maxxam Analytical in Mississauga ON for particle size
analysis using the methodology of ASTM method D422-63. The test results are summarized in
Table 1 and shown graphically in Figure 8.
7
Table 1 Particle Size Distribution of Test Sediment
Particle Size (µm)
Test Sediment Particle size (%passing) NJDEP Specification
( minimum %
Passing) Sample 1 Sample 2 Sample 3 Average
1000 98.5 98.3 98.0 98 98
500 95.0 94.9 94.2 95 93
250 89.8 90.3 88.5 90 88
150 79.9 79.2 78.0 79 73
100 65.2 65.9 66.8 66 58
75 58.8 58.2 70.9 63 48
50 47.3 48.7 51.7 49 43
20 34.4 36.5 38.0 36 33
8 18.0 18.1 18.9 18 18
5 11.8 12.4 13.0 12 8
2 6.8 6.8 7.1 7 3
Figure 8 Average Particle Size Distribution of Test Sediment
0
10
20
30
40
50
60
70
80
90
100
1101001000
% P
ass
ing
Particle Size, µm
Test Sediment
NJDEP Specification
8
In addition to particle size distribution, Maxxam Analytics also performed a moisture analysis of
the test sediment and determined the water content to be < 0.30%, the method detection limit.
The blended test sediment was found to meet the NJDEP particle size specification and was
acceptable for use. With a d50 of 52 µm, the test sediment was slightly finer than the sediment
required by the NJDEP test protocol.
2.3 Removal Efficiency Testing
Removal Efficiency Testing was conducted in accordance with Section 5 of the NJDEP Laboratory
Protocol for Filtration MTDs. Testing was completed at a flow rate of 0.303 cfs (136 gpm) and a
target sediment concentration of 200 mg/L.
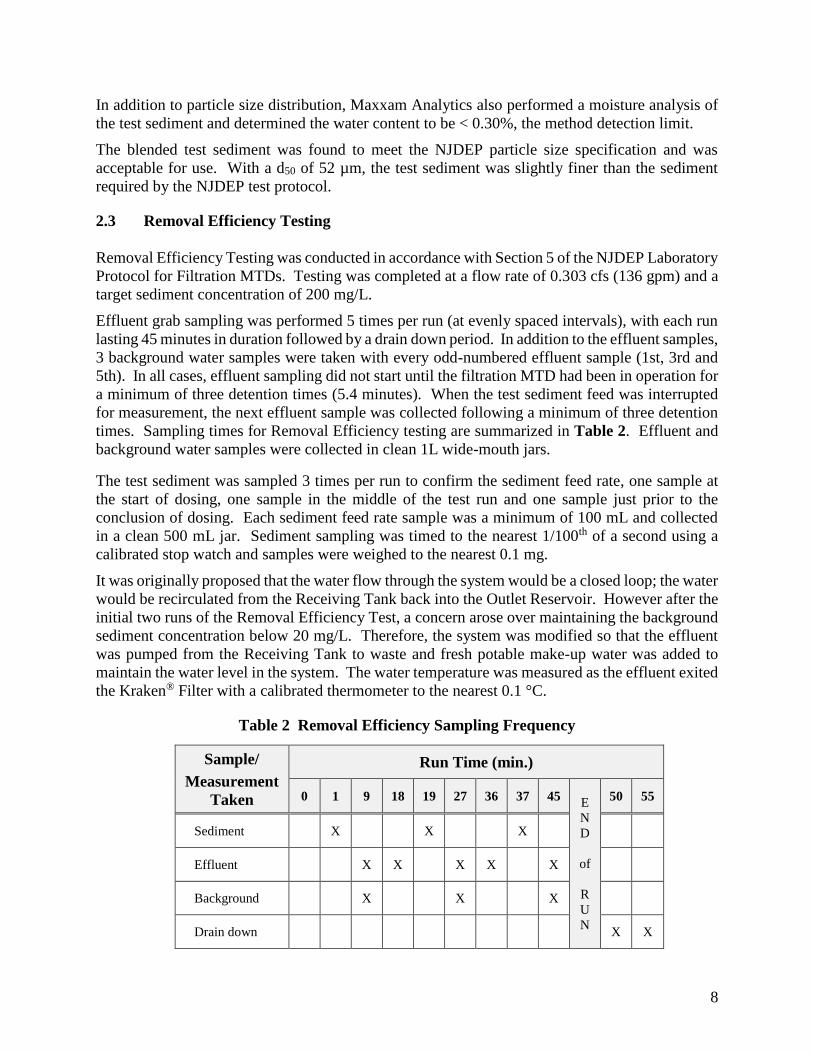
Effluent grab sampling was performed 5 times per run (at evenly spaced intervals), with each run
lasting 45 minutes in duration followed by a drain down period. In addition to the effluent samples,
3 background water samples were taken with every odd-numbered effluent sample (1st, 3rd and
5th). In all cases, effluent sampling did not start until the filtration MTD had been in operation for
a minimum of three detention times (5.4 minutes). When the test sediment feed was interrupted
for measurement, the next effluent sample was collected following a minimum of three detention
times. Sampling times for Removal Efficiency testing are summarized in Table 2. Effluent and
background water samples were collected in clean 1L wide-mouth jars.
The test sediment was sampled 3 times per run to confirm the sediment feed rate, one sample at
the start of dosing, one sample in the middle of the test run and one sample just prior to the
conclusion of dosing. Each sediment feed rate sample was a minimum of 100 mL and collected
in a clean 500 mL jar. Sediment sampling was timed to the nearest 1/100th of a second using a
calibrated stop watch and samples were weighed to the nearest 0.1 mg.
It was originally proposed that the water flow through the system would be a closed loop; the water
would be recirculated from the Receiving Tank back into the Outlet Reservoir. However after the
initial two runs of the Removal Efficiency Test, a concern arose over maintaining the background
sediment concentration below 20 mg/L. Therefore, the system was modified so that the effluent
was pumped from the Receiving Tank to waste and fresh potable make-up water was added to
maintain the water level in the system. The water temperature was measured as the effluent exited
the Kraken® Filter with a calibrated thermometer to the nearest 0.1 °C.
Table 2 Removal Efficiency Sampling Frequency
Sample/
Measurement
Taken
Run Time (min.)
0 1 9 18 19 27 36 37 45 E
N
D
of
R
U
N
50 55
Sediment X X X
Effluent X X X X X
Background X X X
Drain down X X
9
The drain down sample was collected at the end of each removal efficiency run, after the pump
had been switched off and the sediment feed stopped. On a clean filter, the drain down period
lasted 15 minutes and sampling occurred at 5 and 10 minutes into the drain down period. However,
as sediment accumulated in the filtration chambers, the drain down period was extended. Therefore
the sampling period was also adjusted, gradually increasing to 10 and 20 minutes after the pump
and sediment feed had stopped.
2.4 Sediment Mass Loading Capacity
The sediment mass loading capacity of the Kraken® Filter was determined as a continuation of the
Removal Efficiency Testing. All aspects of the test procedure remained the same except that the
influent sediment concentration was increased from 200 to 400 mg/L. Sediment Mass loading
began after 16 runs of removal efficiency had been completed.
2.5 Scour Testing
At this time the Kraken® Filter System is being submitted for approval for off-line testing;
therefore no scour test data was provided.
3. Performance Claims
Per the NJDEP verification procedure, the following are the performance claims made by Bio
Clean Environmental Services, Inc. and/or established via the laboratory testing conducted for the
Kraken® Filter.
Verified Total Suspended Solids (TSS) Removal Rate
Based on the laboratory testing conducted, the Kraken® Filter achieved greater than 80% removal
efficiency of TSS. In accordance with the NJDEP process for obtaining approval of a stormwater
treatment device from NJCAT (Procedure; NJDEP 2013) the TSS removal efficiency is rounded
down to 80%.
Maximum Treatment Flow Rate (MTFR) and maximum drain down cartridge flow.
The MTFR increases with the Kraken® Filter model size and the number of filtration cartridges.
For the tested unit, the Kraken® Filter model KF-4-4, the MTFR was 0.303 cfs (136 gpm) which
corresponds to a MTFR to filtration treatment area ratio of 1.11x10⁻⁴ cfs/ft2 (0.05 gpm/ft2).
Each Kraken® Filter is designed so that there is 1 drain down cartridge for every 7 filter cartridges.
The drain down flow is regulated by a drain down orifice, sized so that a clean filter drains down
in 15 minutes. The drain down flow rate is expected to decrease as the filters ripen.
Maximum Sediment Storage Depth and Volume
The sedimentation and treatment volume varies with the Kraken® Filter model size. For the KF-
4-4, the total storage capacity is 4.5 ft3 (as determined during this laboratory testing), which
includes the Primary Sedimentation, Secondary Sedimentation and two Filter chambers.
10
Effective Treatment/Sedimentation Area
The Effective Treatment and Sedimentation areas are the same for the Kraken® Filter and will
increase with increasing model size. For the Kraken® Filter KF-4-4, the effective
treatment/sedimentation area is the combined area of all the chambers, 11.72 ft2.
Detention Time and Wet Volume
The Kraken® Filter detention time and wet volume will vary with model size. The unit tested had
a wet volume of 32 ft3 which corresponded to a detention time of 1.8 minutes at the test flow rate
of 0.303 cfs.
Effective Filtration Area
The effective filtration area varies with the number of cartridges installed in the Kraken® Filter
unit. The KF-4-4 has 16 filters with a total effective filtration area of 2,720 ft2.
Sediment Mass Loading Capacity
The sedimentation mass loading capacity varies with the Kraken® Filter model size. Based on the
laboratory testing results, the KF-4-4 has a mass loading capacity of 434 lbs. (4.5 ft3).
Maximum Allowable Inflow Drainage Area
Based on the results from the laboratory testing, approximately 434 pounds of sediment (27.1
lbs/cartridge AND/OR 37 lbs/ft2 of effective treatment/sedimentation area) can be loaded into the
KF-4-4, while maintaining an overall 89% removal efficiency. Based on the protocol requirements
for “Maximum Allowable Inflow Drainage Area” the KF-4-4 can effectively treat 0.723 acres
based on a load of 600 lbs per acre of drainage area annually per the protocol. It should be noted
that at 434 pounds of sediment loading the system did not go into bypass. The water level in the
system was still several inches from the bypass weir, indicating the system could continue to
effectively treat runoff at 0.303 cfs for an extended period of time.
4. Supporting Documentation
The NJDEP Procedure (NJDEP, 2013) for obtaining verification of a stormwater manufactured
treatment device (MTD) from the New Jersey Corporation for Advanced Technology (NJCAT)
requires that “copies of the laboratory test reports, including all collected and measured data; all
data from performance evaluation test runs; spreadsheets containing original data from all
performance test runs; all pertinent calculations; etc.” be included in this section. This was
discussed with NJDEP and it was agreed that as long as such documentation could be made
available by NJCAT upon request that it would not be prudent or necessary to include all this
information in this verification report.
11
4.1 Removal Efficiency Testing
A total of 16 removal efficiency testing runs were completed in accordance with the NJDEP filter
protocol. The target flow rate and influent sediment concentration were 136 gpm and 200 mg/L
respectively. The results from all 16 runs were used to calculate the overall removal efficiency of
the Kraken® Filter KF-4-4.
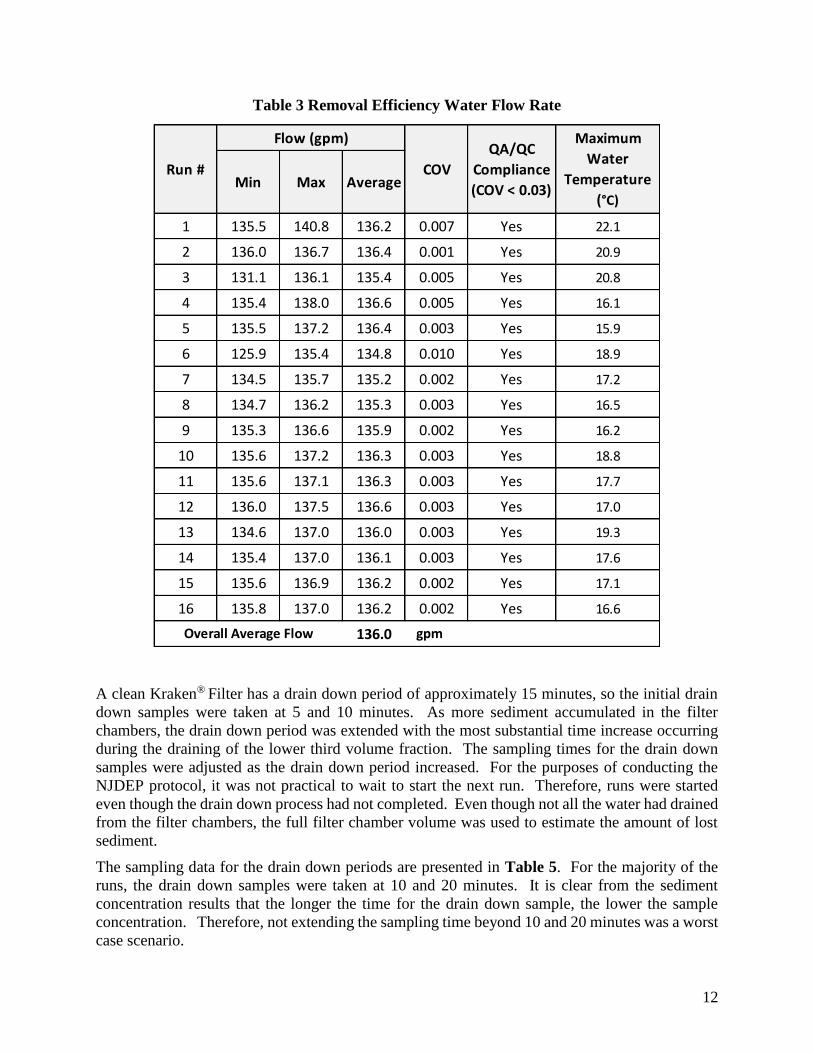
Flow Rate
The flow rate was measured using an electromagnetic-type flow meter and data logger configured
to take a reading every minute. The run was started as soon as water was observed to be exiting
from the Kraken® Filter. For each run, the flow rate was to be maintained within 10% of the target
flow with a COV (coefficient of variation) of 0.03. The flow data has been summarized in Table
3, including the compliance to the QA/QC acceptance criteria.
The average flow for all removal efficiency runs was 136.0 gpm.
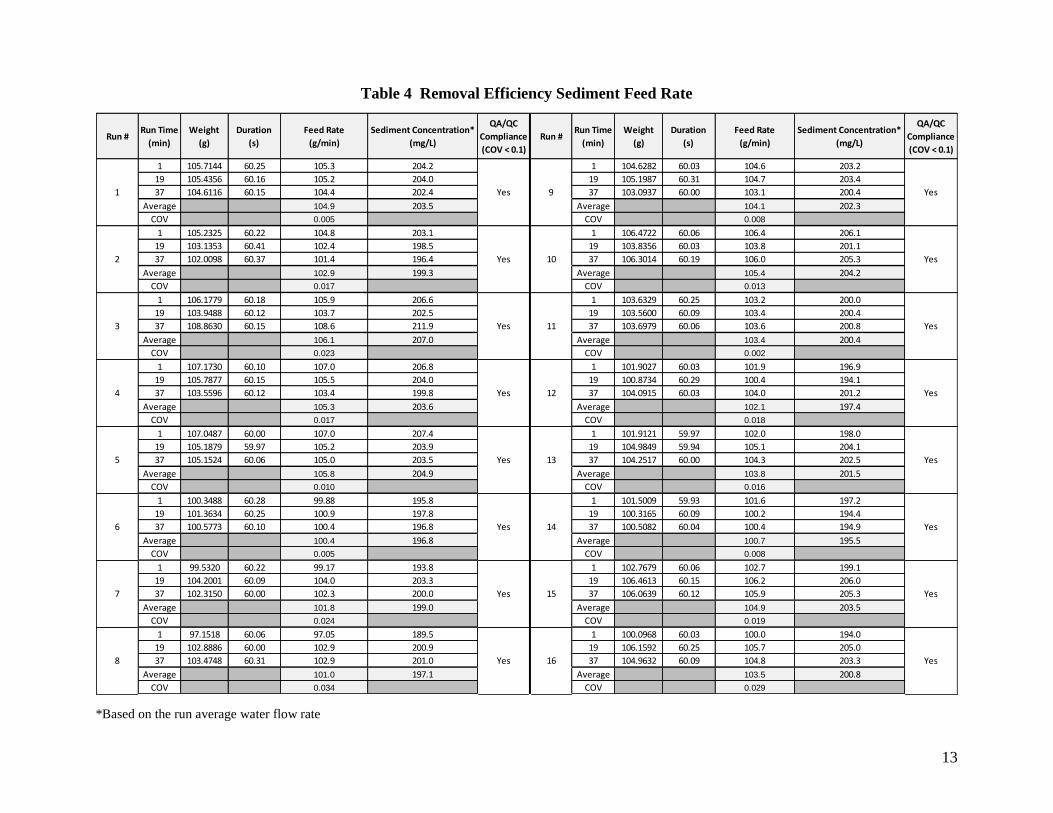
Sediment Addition
The target sediment concentration was 200 ± 20 mg/L with a COV of 0.10. The sediment feed
rate for each run was checked three times during each run. The sediment weight checks, feed rates,
final concentrations and compliance to QA/QC criteria are summarized in Table 4.
Filter Drain Down
The Kraken® Filter is designed with a drain down feature that allows the filter chambers to drain
dry after each storm event. The drain down permits sediment which has accumulated on the
surface of the membrane to be flushed off thereby extending the life of the filters. As per the
NJDEP protocol, the amount of sediment that escapes the filter during the drain period must be
accounted for.
The volume of water in the filter chambers was determined by multiplying the chamber area by
the water level in the chamber at the end of the run. The water volume was corrected for the
displacement volume of the filters. Effluent samples for total suspended solids (TSS), measured
as suspended sediment concentration (SSC), determination were taken during the drain down
period to permit estimation of the amount of sediment that was lost.
12
Table 3 Removal Efficiency Water Flow Rate
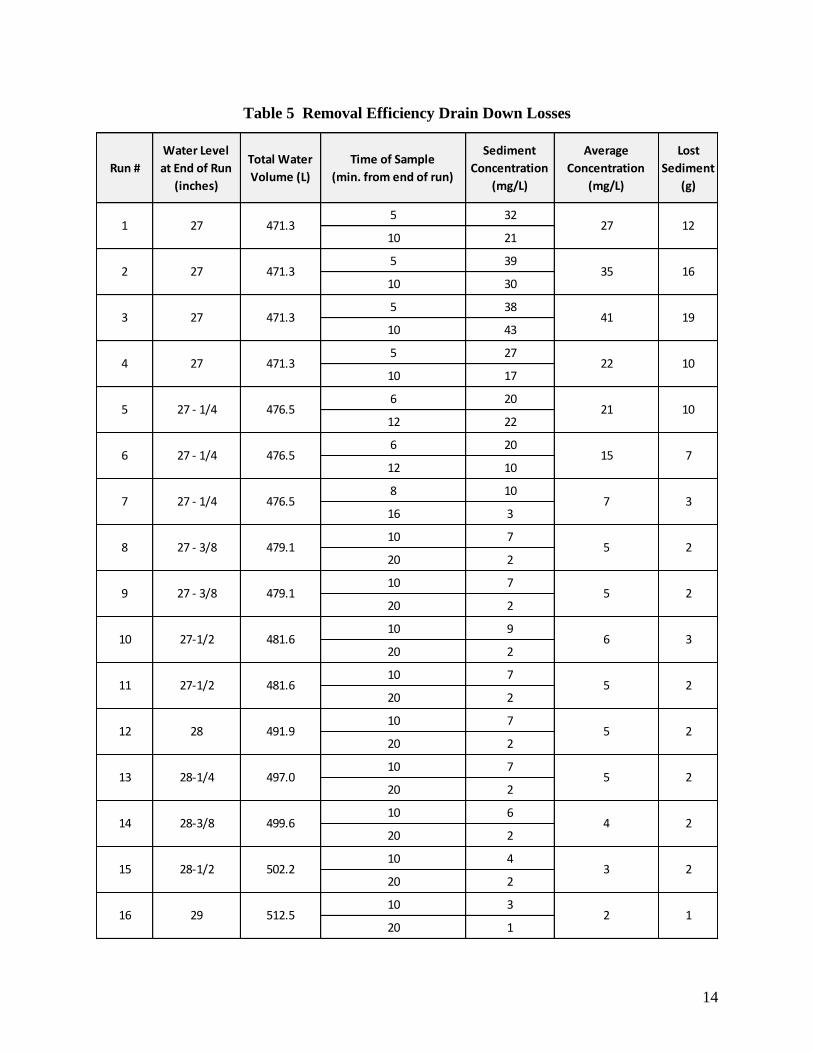
A clean Kraken® Filter has a drain down period of approximately 15 minutes, so the initial drain
down samples were taken at 5 and 10 minutes. As more sediment accumulated in the filter
chambers, the drain down period was extended with the most substantial time increase occurring
during the draining of the lower third volume fraction. The sampling times for the drain down
samples were adjusted as the drain down period increased. For the purposes of conducting the
NJDEP protocol, it was not practical to wait to start the next run. Therefore, runs were started
even though the drain down process had not completed. Even though not all the water had drained
from the filter chambers, the full filter chamber volume was used to estimate the amount of lost
sediment.
The sampling data for the drain down periods are presented in Table 5. For the majority of the
runs, the drain down samples were taken at 10 and 20 minutes. It is clear from the sediment
concentration results that the longer the time for the drain down sample, the lower the sample
concentration. Therefore, not extending the sampling time beyond 10 and 20 minutes was a worst
case scenario.
Min Max Average
1 135.5 140.8 136.2 0.007 Yes 22.1
2 136.0 136.7 136.4 0.001 Yes 20.9
3 131.1 136.1 135.4 0.005 Yes 20.8
4 135.4 138.0 136.6 0.005 Yes 16.1
5 135.5 137.2 136.4 0.003 Yes 15.9
6 125.9 135.4 134.8 0.010 Yes 18.9
7 134.5 135.7 135.2 0.002 Yes 17.2
8 134.7 136.2 135.3 0.003 Yes 16.5
9 135.3 136.6 135.9 0.002 Yes 16.2
10 135.6 137.2 136.3 0.003 Yes 18.8
11 135.6 137.1 136.3 0.003 Yes 17.7
12 136.0 137.5 136.6 0.003 Yes 17.0
13 134.6 137.0 136.0 0.003 Yes 19.3
14 135.4 137.0 136.1 0.003 Yes 17.6
15 135.6 136.9 136.2 0.002 Yes 17.1
16 135.8 137.0 136.2 0.002 Yes 16.6
136.0
Maximum
Water
Temperature
(°C)
gpmOverall Average Flow
Flow (gpm)
Run # COV
QA/QC
Compliance
(COV < 0.03)
13
Table 4 Removal Efficiency Sediment Feed Rate
*Based on the run average water flow rate
Run #Run Time
(min)
Weight
(g)
Duration
(s)
Feed Rate
(g/min)
Sediment Concentration*
(mg/L)
QA/QC
Compliance
(COV < 0.1)
Run #Run Time
(min)
Weight
(g)
Duration
(s)
Feed Rate
(g/min)
Sediment Concentration*
(mg/L)
QA/QC
Compliance
(COV < 0.1)
1 105.7144 60.25 105.3 204.2 1 104.6282 60.03 104.6 203.2
19 105.4356 60.16 105.2 204.0 19 105.1987 60.31 104.7 203.4
37 104.6116 60.15 104.4 202.4 37 103.0937 60.00 103.1 200.4
Average 104.9 203.5 Average 104.1 202.3
COV 0.005 COV 0.008
1 105.2325 60.22 104.8 203.1 1 106.4722 60.06 106.4 206.1
19 103.1353 60.41 102.4 198.5 19 103.8356 60.03 103.8 201.1
37 102.0098 60.37 101.4 196.4 37 106.3014 60.19 106.0 205.3
Average 102.9 199.3 Average 105.4 204.2
COV 0.017 COV 0.013
1 106.1779 60.18 105.9 206.6 1 103.6329 60.25 103.2 200.0
19 103.9488 60.12 103.7 202.5 19 103.5600 60.09 103.4 200.4
37 108.8630 60.15 108.6 211.9 37 103.6979 60.06 103.6 200.8
Average 106.1 207.0 Average 103.4 200.4
COV 0.023 COV 0.002
1 107.1730 60.10 107.0 206.8 1 101.9027 60.03 101.9 196.9
19 105.7877 60.15 105.5 204.0 19 100.8734 60.29 100.4 194.1
37 103.5596 60.12 103.4 199.8 37 104.0915 60.03 104.0 201.2
Average 105.3 203.6 Average 102.1 197.4
COV 0.017 COV 0.018
1 107.0487 60.00 107.0 207.4 1 101.9121 59.97 102.0 198.0
19 105.1879 59.97 105.2 203.9 19 104.9849 59.94 105.1 204.1
37 105.1524 60.06 105.0 203.5 37 104.2517 60.00 104.3 202.5
Average 105.8 204.9 Average 103.8 201.5
COV 0.010 COV 0.016
1 100.3488 60.28 99.88 195.8 1 101.5009 59.93 101.6 197.2
19 101.3634 60.25 100.9 197.8 19 100.3165 60.09 100.2 194.4
37 100.5773 60.10 100.4 196.8 37 100.5082 60.04 100.4 194.9
Average 100.4 196.8 Average 100.7 195.5
COV 0.005 COV 0.008
1 99.5320 60.22 99.17 193.8 1 102.7679 60.06 102.7 199.1
19 104.2001 60.09 104.0 203.3 19 106.4613 60.15 106.2 206.0
37 102.3150 60.00 102.3 200.0 37 106.0639 60.12 105.9 205.3
Average 101.8 199.0 Average 104.9 203.5
COV 0.024 COV 0.019
1 97.1518 60.06 97.05 189.5 1 100.0968 60.03 100.0 194.0
19 102.8886 60.00 102.9 200.9 19 106.1592 60.25 105.7 205.0
37 103.4748 60.31 102.9 201.0 37 104.9632 60.09 104.8 203.3
Average 101.0 197.1 Average 103.5 200.8
COV 0.034 COV 0.029
Yes
2 Yes
3 Yes
14 Yes
7 Yes
8 Yes
6 Yes
12 Yes
13 Yes
9 Yes
10 Yes
11 Yes
4 Yes
5 Yes
1
15 Yes
16 Yes
14
Table 5 Removal Efficiency Drain Down Losses
Run #
Water Level
at End of Run
(inches)
Total Water
Volume (L)
Time of Sample
(min. from end of run)
Sediment
Concentration
(mg/L)
Average
Concentration
(mg/L)
Lost
Sediment
(g)
5 32
10 21
5 39
10 30
5 38
10 43
5 27
10 17
6 20
12 22
6 20
12 10
8 10
16 3
10 7
20 2
10 7
20 2
10 9
20 2
10 7
20 2
10 7
20 2
10 7
20 2
10 6
20 2
10 4
20 2
10 3
20 1
3
2
2
3
2
2
5
4
12
16
19
10
10
7
7
5
5
27 - 3/8
27 - 3/8
10
11
12
13
27 - 1/4
512.5
491.9
497.028-1/4
28-1/2
29
2
2
2
1
3
2
28
27 - 1/4
15
9
7
8
22
21
41
471.3
471.3
476.5
481.6
481.6
27-1/2
27-1/2
476.5
479.1
479.1
6
5
5
28-3/8 499.6
502.2
27 - 1/4
14
1 27 471.3 27
2
3
4
5
6 15476.5
471.3
35
16
27
27
27
15
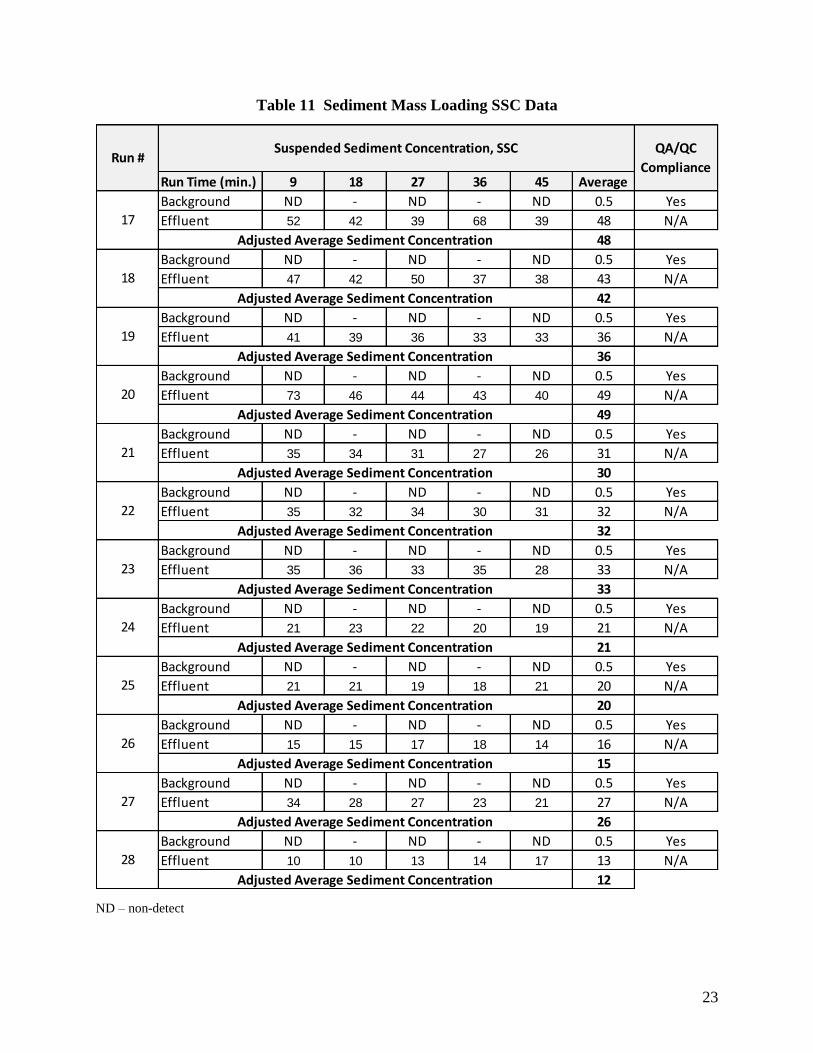
Removal Efficiency Calculations
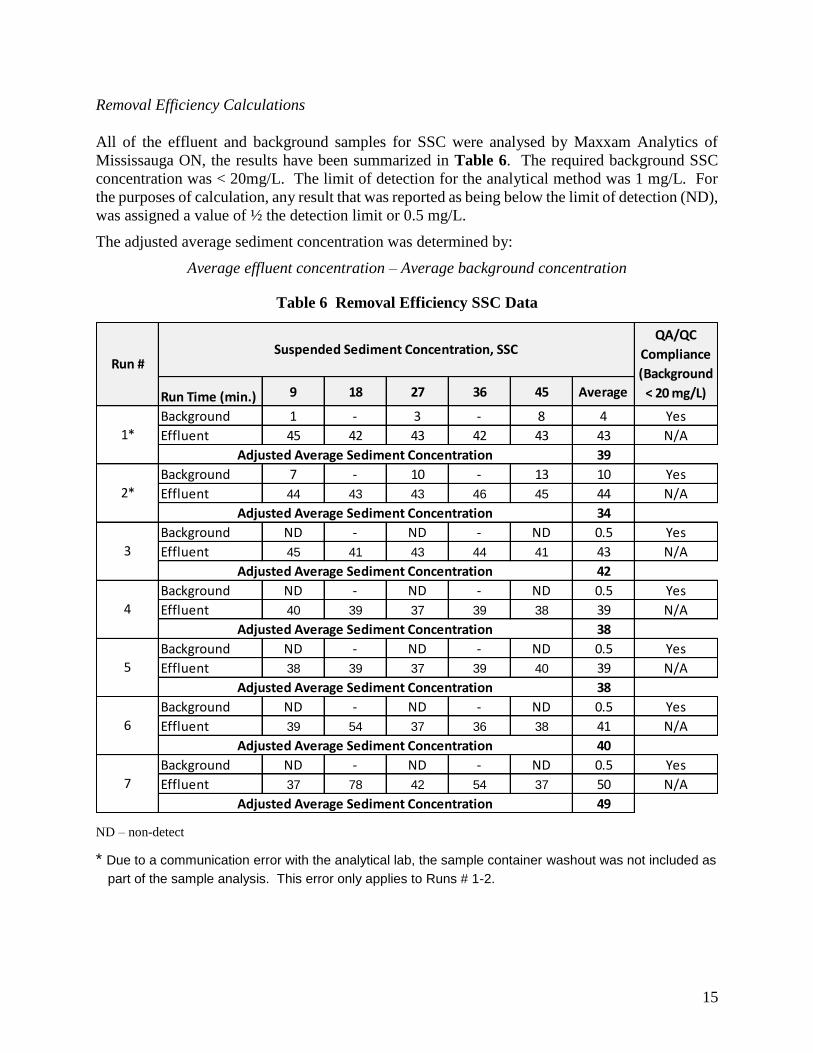
All of the effluent and background samples for SSC were analysed by Maxxam Analytics of
Mississauga ON, the results have been summarized in Table 6. The required background SSC
concentration was < 20mg/L. The limit of detection for the analytical method was 1 mg/L. For
the purposes of calculation, any result that was reported as being below the limit of detection (ND),
was assigned a value of ½ the detection limit or 0.5 mg/L.
The adjusted average sediment concentration was determined by:
Average effluent concentration – Average background concentration
Table 6 Removal Efficiency SSC Data
ND – non-detect
* Due to a communication error with the analytical lab, the sample container washout was not included as
part of the sample analysis. This error only applies to Runs # 1-2.
Run Time (min.) 9 18 27 36 45 Average
Background 1 - 3 - 8 4 Yes
Effluent 45 42 43 42 43 43 N/A
39
Background 7 - 10 - 13 10 Yes
Effluent 44 43 43 46 45 44 N/A
34
Background ND - ND - ND 0.5 Yes
Effluent 45 41 43 44 41 43 N/A
42
Background ND - ND - ND 0.5 Yes
Effluent 40 39 37 39 38 39 N/A
38
Background ND - ND - ND 0.5 Yes
Effluent 38 39 37 39 40 39 N/A
38
Background ND - ND - ND 0.5 Yes
Effluent 39 54 37 36 38 41 N/A
40
Background ND - ND - ND 0.5 Yes
Effluent 37 78 42 54 37 50 N/A
49
Adjusted Average Sediment Concentration
6
Adjusted Average Sediment Concentration
7
Adjusted Average Sediment Concentration
5
QA/QC
Compliance
(Background
< 20 mg/L)
Suspended Sediment Concentration, SSCRun #
4
Adjusted Average Sediment Concentration
1*
Adjusted Average Sediment Concentration
2*
Adjusted Average Sediment Concentration
3
Adjusted Average Sediment Concentration
16
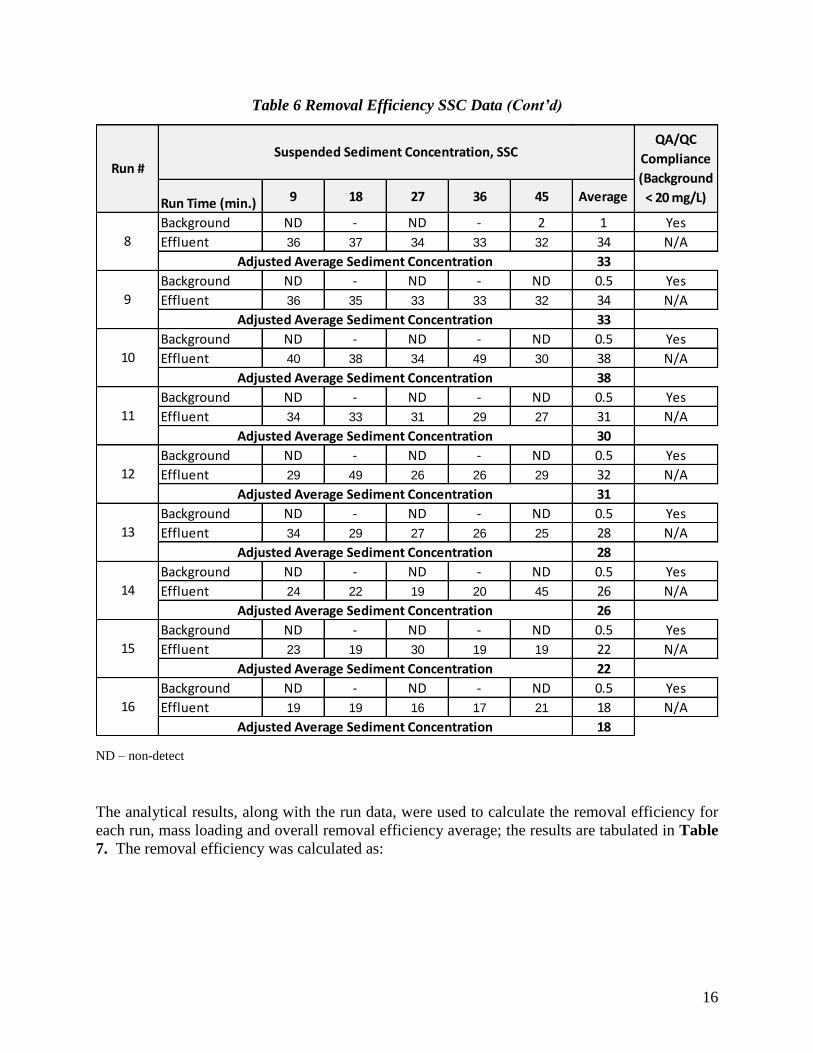
Table 6 Removal Efficiency SSC Data (Cont’d)
ND – non-detect
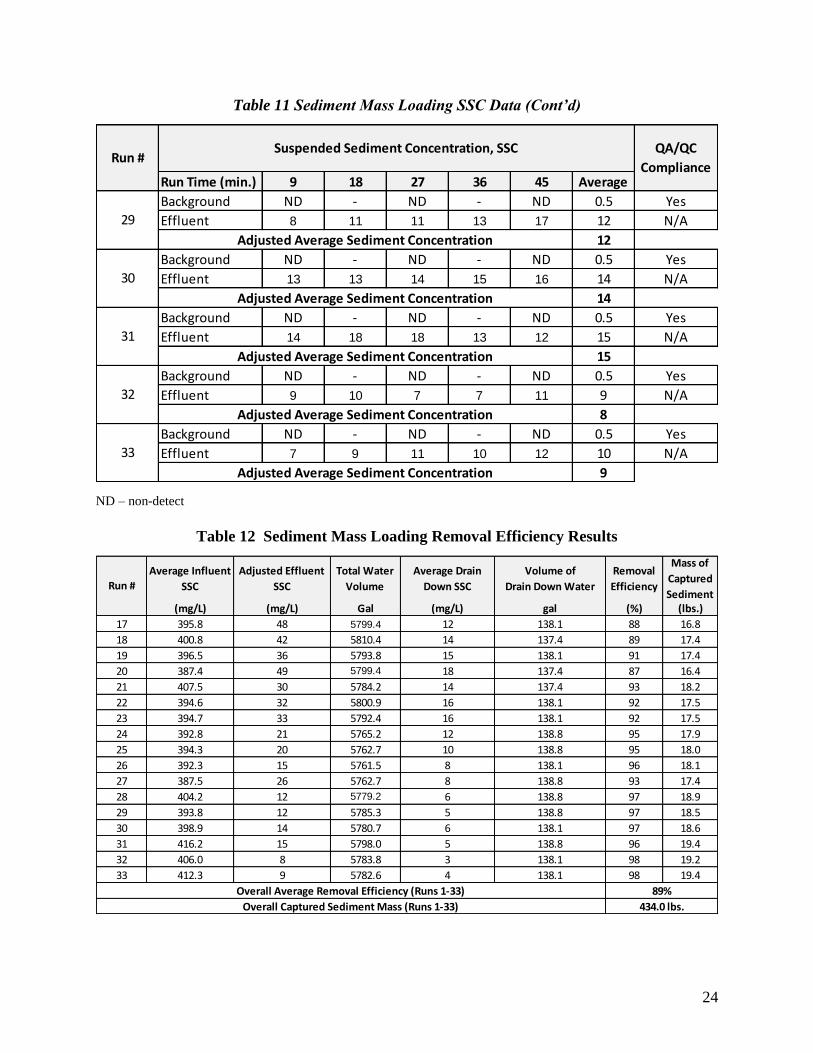
The analytical results, along with the run data, were used to calculate the removal efficiency for
each run, mass loading and overall removal efficiency average; the results are tabulated in Table
7. The removal efficiency was calculated as:
Run Time (min.) 9 18 27 36 45 Average
Background ND - ND - 2 1 Yes
Effluent 36 37 34 33 32 34 N/A
33
Background ND - ND - ND 0.5 Yes
Effluent 36 35 33 33 32 34 N/A
33
Background ND - ND - ND 0.5 Yes
Effluent 40 38 34 49 30 38 N/A
38
Background ND - ND - ND 0.5 Yes
Effluent 34 33 31 29 27 31 N/A
30
Background ND - ND - ND 0.5 Yes
Effluent 29 49 26 26 29 32 N/A
31
Background ND - ND - ND 0.5 Yes
Effluent 34 29 27 26 25 28 N/A
28
Background ND - ND - ND 0.5 Yes
Effluent 24 22 19 20 45 26 N/A
26
Background ND - ND - ND 0.5 Yes
Effluent 23 19 30 19 19 22 N/A
22
Background ND - ND - ND 0.5 Yes
Effluent 19 19 16 17 21 18 N/A
18
QA/QC
Compliance
(Background
< 20 mg/L)
16
Adjusted Average Sediment Concentration
Suspended Sediment Concentration, SSC
13
Adjusted Average Sediment Concentration
14
Adjusted Average Sediment Concentration
15
Adjusted Average Sediment Concentration
Adjusted Average Sediment Concentration
10
Adjusted Average Sediment Concentration
11
Adjusted Average Sediment Concentration
12
Adjusted Average Sediment Concentration
8
Adjusted Average Sediment Concentration
Run #
9
17
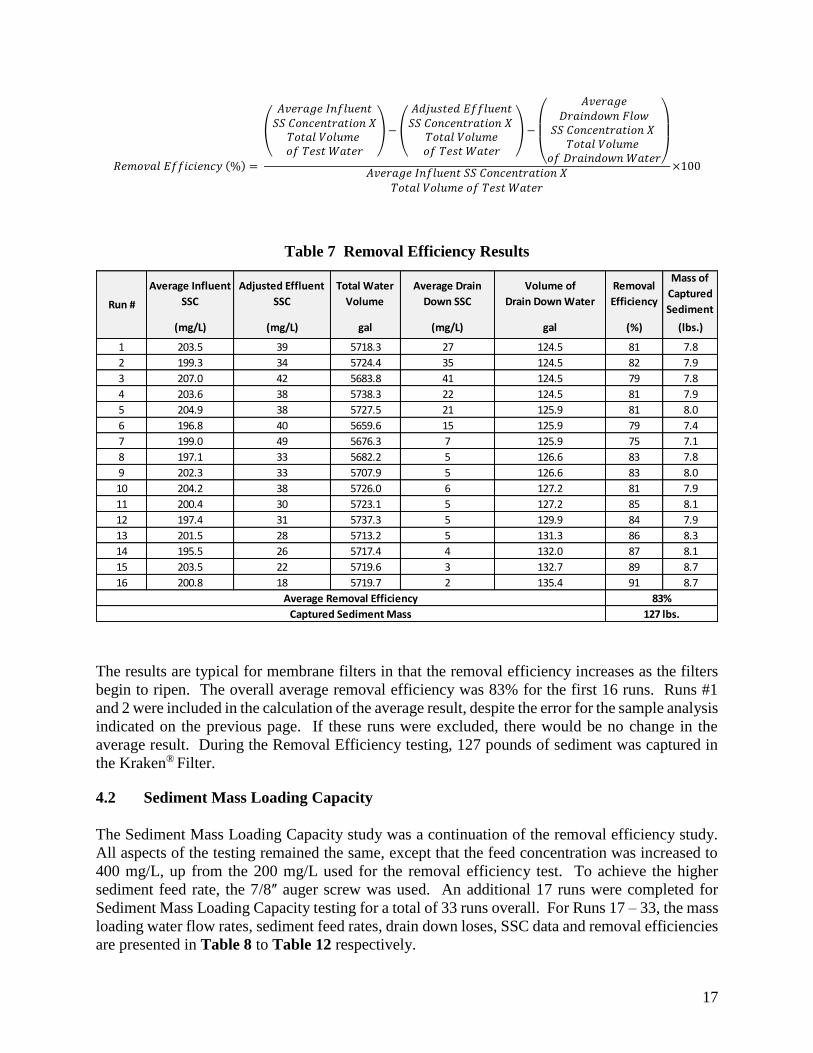
𝑅𝑒𝑚𝑜𝑣𝑎𝑙 𝐸𝑓𝑓𝑖𝑐𝑖𝑒𝑛𝑐𝑦 (%) =
(
𝐴𝑣𝑒𝑟𝑎𝑔𝑒 𝐼𝑛𝑓𝑙𝑢𝑒𝑛𝑡𝑆𝑆 𝐶𝑜𝑛𝑐𝑒𝑛𝑡𝑟𝑎𝑡𝑖𝑜𝑛 𝑋𝑇𝑜𝑡𝑎𝑙 𝑉𝑜𝑙𝑢𝑚𝑒 𝑜𝑓 𝑇𝑒𝑠𝑡 𝑊𝑎𝑡𝑒𝑟
)− (
𝐴𝑑𝑗𝑢𝑠𝑡𝑒𝑑 𝐸𝑓𝑓𝑙𝑢𝑒𝑛𝑡𝑆𝑆 𝐶𝑜𝑛𝑐𝑒𝑛𝑡𝑟𝑎𝑡𝑖𝑜𝑛 𝑋 𝑇𝑜𝑡𝑎𝑙 𝑉𝑜𝑙𝑢𝑚𝑒𝑜𝑓 𝑇𝑒𝑠𝑡 𝑊𝑎𝑡𝑒𝑟
) −
(
𝐴𝑣𝑒𝑟𝑎𝑔𝑒𝐷𝑟𝑎𝑖𝑛𝑑𝑜𝑤𝑛 𝐹𝑙𝑜𝑤𝑆𝑆 𝐶𝑜𝑛𝑐𝑒𝑛𝑡𝑟𝑎𝑡𝑖𝑜𝑛 𝑋 𝑇𝑜𝑡𝑎𝑙 𝑉𝑜𝑙𝑢𝑚𝑒
𝑜𝑓 𝐷𝑟𝑎𝑖𝑛𝑑𝑜𝑤𝑛 𝑊𝑎𝑡𝑒𝑟)
𝐴𝑣𝑒𝑟𝑎𝑔𝑒 𝐼𝑛𝑓𝑙𝑢𝑒𝑛𝑡 𝑆𝑆 𝐶𝑜𝑛𝑐𝑒𝑛𝑡𝑟𝑎𝑡𝑖𝑜𝑛 𝑋𝑇𝑜𝑡𝑎𝑙 𝑉𝑜𝑙𝑢𝑚𝑒 𝑜𝑓 𝑇𝑒𝑠𝑡 𝑊𝑎𝑡𝑒𝑟
×100
Table 7 Removal Efficiency Results
The results are typical for membrane filters in that the removal efficiency increases as the filters
begin to ripen. The overall average removal efficiency was 83% for the first 16 runs. Runs #1
and 2 were included in the calculation of the average result, despite the error for the sample analysis
indicated on the previous page. If these runs were excluded, there would be no change in the
average result. During the Removal Efficiency testing, 127 pounds of sediment was captured in
the Kraken® Filter.
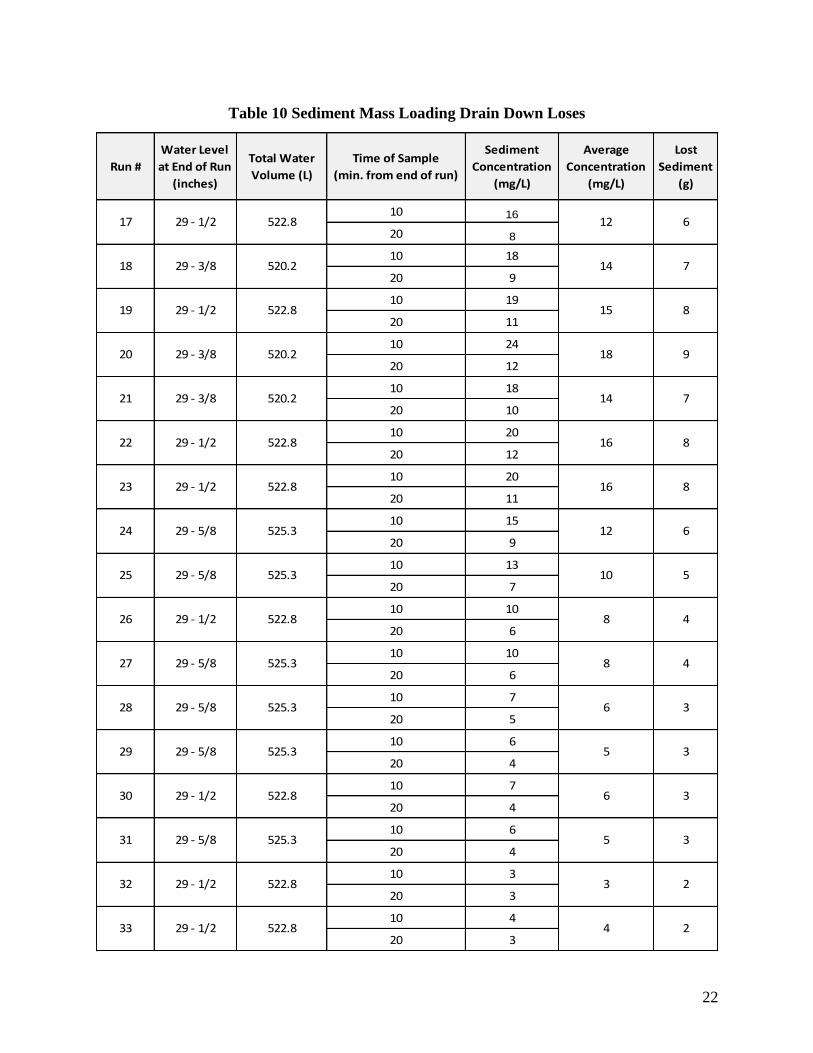
4.2 Sediment Mass Loading Capacity
The Sediment Mass Loading Capacity study was a continuation of the removal efficiency study.
All aspects of the testing remained the same, except that the feed concentration was increased to
400 mg/L, up from the 200 mg/L used for the removal efficiency test. To achieve the higher
sediment feed rate, the 7/8ʺ auger screw was used. An additional 17 runs were completed for
Sediment Mass Loading Capacity testing for a total of 33 runs overall. For Runs 17 – 33, the mass
loading water flow rates, sediment feed rates, drain down loses, SSC data and removal efficiencies
are presented in Table 8 to Table 12 respectively.
Average Influent
SSC
Adjusted Effluent
SSC
Total Water
Volume
Average Drain
Down SSC
Volume of
Drain Down Water
Removal
Efficiency
Mass of
Captured
Sediment
(mg/L) (mg/L) gal (mg/L) gal (%) (lbs.)
1 203.5 39 5718.3 27 124.5 81 7.8
2 199.3 34 5724.4 35 124.5 82 7.9
3 207.0 42 5683.8 41 124.5 79 7.8
4 203.6 38 5738.3 22 124.5 81 7.9
5 204.9 38 5727.5 21 125.9 81 8.0
6 196.8 40 5659.6 15 125.9 79 7.4
7 199.0 49 5676.3 7 125.9 75 7.1
8 197.1 33 5682.2 5 126.6 83 7.8
9 202.3 33 5707.9 5 126.6 83 8.0
10 204.2 38 5726.0 6 127.2 81 7.9
11 200.4 30 5723.1 5 127.2 85 8.1
12 197.4 31 5737.3 5 129.9 84 7.9
13 201.5 28 5713.2 5 131.3 86 8.3
14 195.5 26 5717.4 4 132.0 87 8.1
15 203.5 22 5719.6 3 132.7 89 8.7
16 200.8 18 5719.7 2 135.4 91 8.7
Average Removal Efficiency 83%
Captured Sediment Mass 127 lbs.
Run #
18
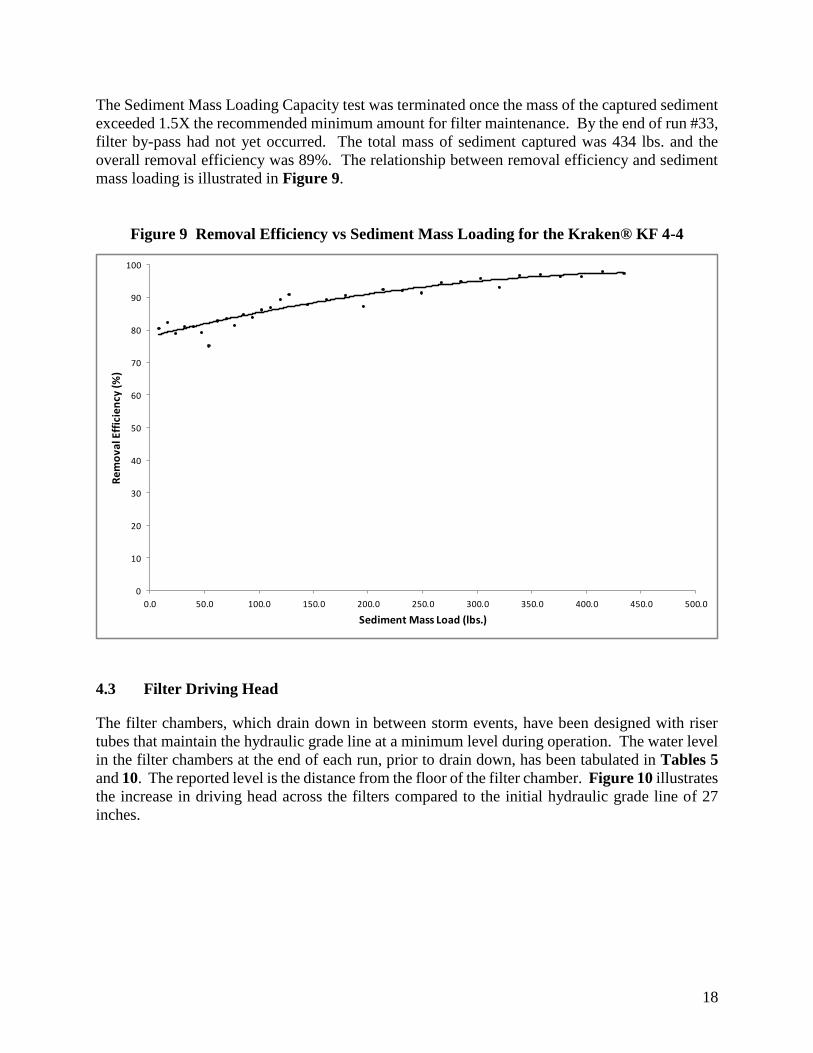
The Sediment Mass Loading Capacity test was terminated once the mass of the captured sediment
exceeded 1.5X the recommended minimum amount for filter maintenance. By the end of run #33,
filter by-pass had not yet occurred. The total mass of sediment captured was 434 lbs. and the
overall removal efficiency was 89%. The relationship between removal efficiency and sediment
mass loading is illustrated in Figure 9.
Figure 9 Removal Efficiency vs Sediment Mass Loading for the Kraken® KF 4-4
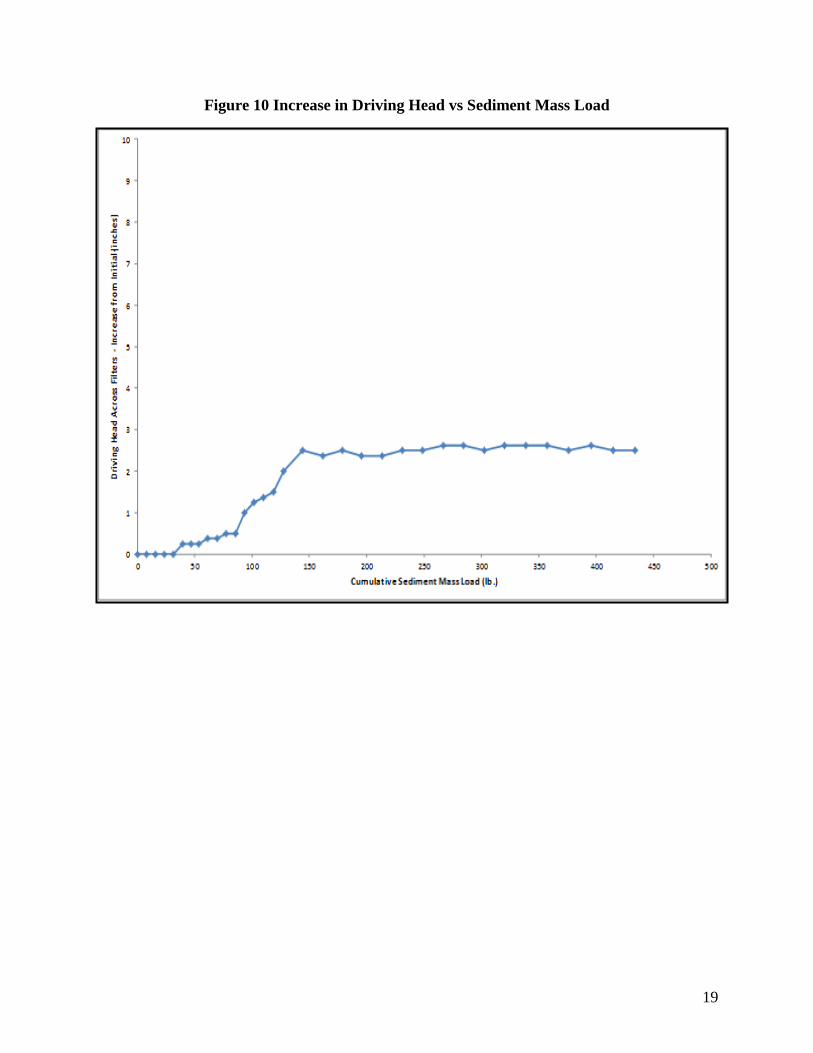
4.3 Filter Driving Head
The filter chambers, which drain down in between storm events, have been designed with riser
tubes that maintain the hydraulic grade line at a minimum level during operation. The water level
in the filter chambers at the end of each run, prior to drain down, has been tabulated in Tables 5
and 10. The reported level is the distance from the floor of the filter chamber. Figure 10 illustrates
the increase in driving head across the filters compared to the initial hydraulic grade line of 27
inches.
0
10
20
30
40
50
60
70
80
90
100
0.0 50.0 100.0 150.0 200.0 250.0 300.0 350.0 400.0 450.0 500.0
Re
mo
va
l Eff
icie
ncy
(%
)
Sediment Mass Load (lbs.)
19
Figure 10 Increase in Driving Head vs Sediment Mass Load
20
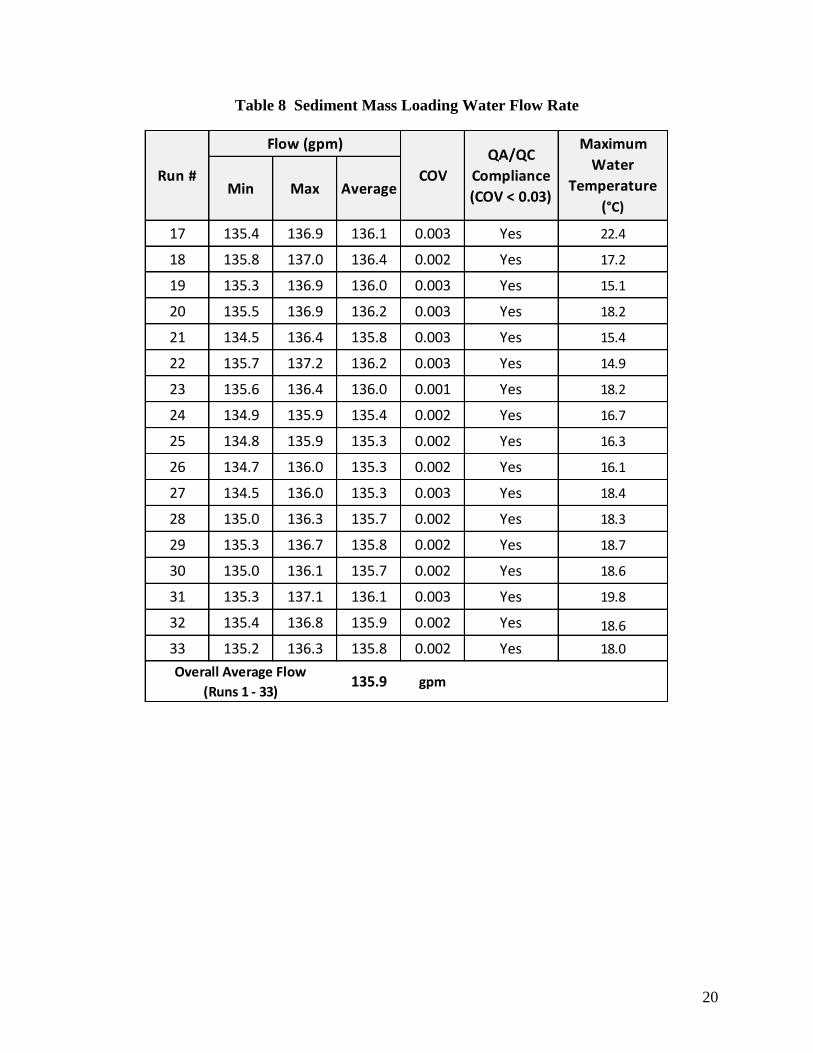
Table 8 Sediment Mass Loading Water Flow Rate
Min Max Average
17 135.4 136.9 136.1 0.003 Yes 22.4
18 135.8 137.0 136.4 0.002 Yes 17.2
19 135.3 136.9 136.0 0.003 Yes 15.1
20 135.5 136.9 136.2 0.003 Yes 18.2
21 134.5 136.4 135.8 0.003 Yes 15.4
22 135.7 137.2 136.2 0.003 Yes 14.9
23 135.6 136.4 136.0 0.001 Yes 18.2
24 134.9 135.9 135.4 0.002 Yes 16.7
25 134.8 135.9 135.3 0.002 Yes 16.3
26 134.7 136.0 135.3 0.002 Yes 16.1
27 134.5 136.0 135.3 0.003 Yes 18.4
28 135.0 136.3 135.7 0.002 Yes 18.3
29 135.3 136.7 135.8 0.002 Yes 18.7
30 135.0 136.1 135.7 0.002 Yes 18.6
31 135.3 137.1 136.1 0.003 Yes 19.8
32 135.4 136.8 135.9 0.002 Yes 18.6
33 135.2 136.3 135.8 0.002 Yes 18.0
Maximum
Water
Temperature
(°C)
Overall Average Flow
(Runs 1 - 33)135.9 gpm
Run #
Flow (gpm)
COV
QA/QC
Compliance
(COV < 0.03)
21
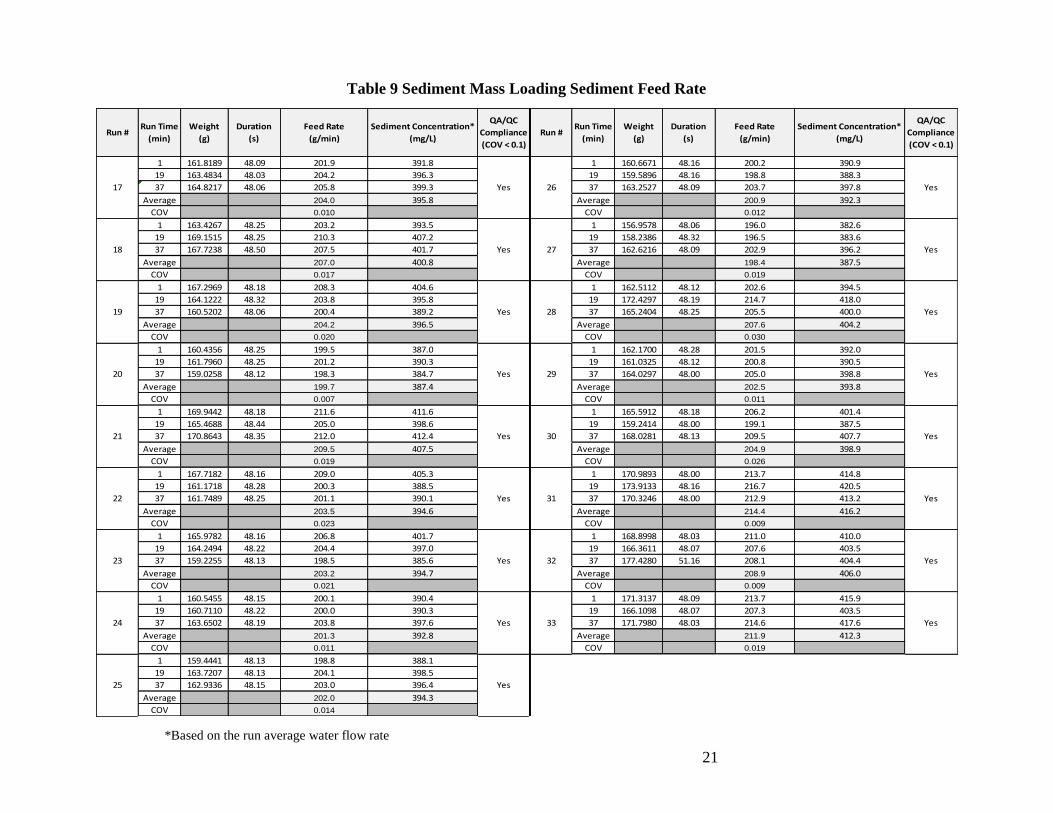
Table 9 Sediment Mass Loading Sediment Feed Rate
*Based on the run average water flow rate
Run #Run Time
(min)
Weight
(g)
Duration
(s)
Feed Rate
(g/min)
Sediment Concentration*
(mg/L)
QA/QC
Compliance
(COV < 0.1)
Run #Run Time
(min)
Weight
(g)
Duration
(s)
Feed Rate
(g/min)
Sediment Concentration*
(mg/L)
QA/QC
Compliance
(COV < 0.1)
1 161.8189 48.09 201.9 391.8 1 160.6671 48.16 200.2 390.9
19 163.4834 48.03 204.2 396.3 19 159.5896 48.16 198.8 388.3
37 164.8217 48.06 205.8 399.3 37 163.2527 48.09 203.7 397.8
Average 204.0 395.8 Average 200.9 392.3
COV 0.010 COV 0.012
1 163.4267 48.25 203.2 393.5 1 156.9578 48.06 196.0 382.6
19 169.1515 48.25 210.3 407.2 19 158.2386 48.32 196.5 383.6
37 167.7238 48.50 207.5 401.7 37 162.6216 48.09 202.9 396.2
Average 207.0 400.8 Average 198.4 387.5
COV 0.017 COV 0.019
1 167.2969 48.18 208.3 404.6 1 162.5112 48.12 202.6 394.5
19 164.1222 48.32 203.8 395.8 19 172.4297 48.19 214.7 418.0
37 160.5202 48.06 200.4 389.2 37 165.2404 48.25 205.5 400.0
Average 204.2 396.5 Average 207.6 404.2
COV 0.020 COV 0.030
1 160.4356 48.25 199.5 387.0 1 162.1700 48.28 201.5 392.0
19 161.7960 48.25 201.2 390.3 19 161.0325 48.12 200.8 390.5
37 159.0258 48.12 198.3 384.7 37 164.0297 48.00 205.0 398.8
Average 199.7 387.4 Average 202.5 393.8
COV 0.007 COV 0.011
1 169.9442 48.18 211.6 411.6 1 165.5912 48.18 206.2 401.4
19 165.4688 48.44 205.0 398.6 19 159.2414 48.00 199.1 387.5
37 170.8643 48.35 212.0 412.4 37 168.0281 48.13 209.5 407.7
Average 209.5 407.5 Average 204.9 398.9
COV 0.019 COV 0.026
1 167.7182 48.16 209.0 405.3 1 170.9893 48.00 213.7 414.8
19 161.1718 48.28 200.3 388.5 19 173.9133 48.16 216.7 420.5
37 161.7489 48.25 201.1 390.1 37 170.3246 48.00 212.9 413.2
Average 203.5 394.6 Average 214.4 416.2
COV 0.023 COV 0.009
1 165.9782 48.16 206.8 401.7 1 168.8998 48.03 211.0 410.0
19 164.2494 48.22 204.4 397.0 19 166.3611 48.07 207.6 403.5
37 159.2255 48.13 198.5 385.6 37 177.4280 51.16 208.1 404.4
Average 203.2 394.7 Average 208.9 406.0
COV 0.021 COV 0.009
1 160.5455 48.15 200.1 390.4 1 171.3137 48.09 213.7 415.9
19 160.7110 48.22 200.0 390.3 19 166.1098 48.07 207.3 403.5
37 163.6502 48.19 203.8 397.6 37 171.7980 48.03 214.6 417.6
Average 201.3 392.8 Average 211.9 412.3
COV 0.011 COV 0.019
1 159.4441 48.13 198.8 388.1
19 163.7207 48.13 204.1 398.5
37 162.9336 48.15 203.0 396.4
Average 202.0 394.3
COV 0.014
25 Yes
17 Yes 26 Yes
18 Yes 27 Yes
19 Yes 28 Yes
20 Yes 29 Yes
21 Yes 30 Yes
24 Yes 33 Yes
22 Yes 31 Yes
23 Yes 32 Yes
22
Table 10 Sediment Mass Loading Drain Down Loses
Run #
Water Level
at End of Run
(inches)
Total Water
Volume (L)
Time of Sample
(min. from end of run)
Sediment
Concentration
(mg/L)
Average
Concentration
(mg/L)
Lost
Sediment
(g)
10 16
20 8
10 18
20 9
10 19
20 11
10 24
20 12
10 18
20 10
10 20
20 12
10 20
20 11
10 15
20 9
10 13
20 7
10 10
20 6
10 10
20 6
10 7
20 5
10 6
20 4
10 7
20 4
10 6
20 4
10 3
20 3
10 4
20 333 29 - 1/2 522.8 4 2
18 29 - 3/8 520.2 14 7
17 29 - 1/2 522.8 12 6
20 29 - 3/8 520.2 18 9
19 29 - 1/2 522.8 15 8
22 29 - 1/2 522.8 16 8
21 29 - 3/8 520.2 14 7
24 29 - 5/8 525.3 12 6
23 29 - 1/2 522.8 16 8
26 29 - 1/2 522.8 8 4
25 29 - 5/8 525.3 10 5
28 29 - 5/8 525.3 6 3
27 29 - 5/8 525.3 8 4
30 29 - 1/2 522.8 6 3
29 29 - 5/8 525.3 5 3
32 29 - 1/2 522.8 3 2
31 29 - 5/8 525.3 5 3
23
Table 11 Sediment Mass Loading SSC Data
ND – non-detect
Run Time (min.) 9 18 27 36 45 Average
Background ND - ND - ND 0.5 Yes
Effluent 52 42 39 68 39 48 N/A
48
Background ND - ND - ND 0.5 Yes
Effluent 47 42 50 37 38 43 N/A
42
Background ND - ND - ND 0.5 Yes
Effluent 41 39 36 33 33 36 N/A
36
Background ND - ND - ND 0.5 Yes
Effluent 73 46 44 43 40 49 N/A
49
Background ND - ND - ND 0.5 Yes
Effluent 35 34 31 27 26 31 N/A
30
Background ND - ND - ND 0.5 Yes
Effluent 35 32 34 30 31 32 N/A
32
Background ND - ND - ND 0.5 Yes
Effluent 35 36 33 35 28 33 N/A
33
Background ND - ND - ND 0.5 Yes
Effluent 21 23 22 20 19 21 N/A
21
Background ND - ND - ND 0.5 Yes
Effluent 21 21 19 18 21 20 N/A
20
Background ND - ND - ND 0.5 Yes
Effluent 15 15 17 18 14 16 N/A
15
Background ND - ND - ND 0.5 Yes
Effluent 34 28 27 23 21 27 N/A
26
Background ND - ND - ND 0.5 Yes
Effluent 10 10 13 14 17 13 N/A
12
Run #Suspended Sediment Concentration, SSC QA/QC
Compliance
17
Adjusted Average Sediment Concentration
18
Adjusted Average Sediment Concentration
19
Adjusted Average Sediment Concentration
20
Adjusted Average Sediment Concentration
Adjusted Average Sediment Concentration
23
Adjusted Average Sediment Concentration
24
Adjusted Average Sediment Concentration
21
Adjusted Average Sediment Concentration
22
25
Adjusted Average Sediment Concentration
26
Adjusted Average Sediment Concentration
27
Adjusted Average Sediment Concentration
28
Adjusted Average Sediment Concentration
24
Table 11 Sediment Mass Loading SSC Data (Cont’d)
ND – non-detect
Table 12 Sediment Mass Loading Removal Efficiency Results
Run Time (min.) 9 18 27 36 45 Average
Background ND - ND - ND 0.5 Yes
Effluent 8 11 11 13 17 12 N/A
12
Background ND - ND - ND 0.5 Yes
Effluent 13 13 14 15 16 14 N/A
14
Background ND - ND - ND 0.5 Yes
Effluent 14 18 18 13 12 15 N/A
15
Background ND - ND - ND 0.5 Yes
Effluent 9 10 7 7 11 9 N/A
8
Background ND - ND - ND 0.5 Yes
Effluent 7 9 11 10 12 10 N/A
9
QA/QC
Compliance
33
Adjusted Average Sediment Concentration
31
Adjusted Average Sediment Concentration
32
Adjusted Average Sediment Concentration
29
Adjusted Average Sediment Concentration
30
Adjusted Average Sediment Concentration
Run #Suspended Sediment Concentration, SSC
Average Influent
SSC
Adjusted Effluent
SSC
Total Water
Volume
Average Drain
Down SSC
Volume of
Drain Down Water
Removal
Efficiency
Mass of
Captured
Sediment(mg/L) (mg/L) Gal (mg/L) gal (%) (lbs.)
17 395.8 48 5799.4 12 138.1 88 16.8
18 400.8 42 5810.4 14 137.4 89 17.4
19 396.5 36 5793.8 15 138.1 91 17.4
20 387.4 49 5799.4 18 137.4 87 16.4
21 407.5 30 5784.2 14 137.4 93 18.2
22 394.6 32 5800.9 16 138.1 92 17.5
23 394.7 33 5792.4 16 138.1 92 17.5
24 392.8 21 5765.2 12 138.8 95 17.9
25 394.3 20 5762.7 10 138.8 95 18.0
26 392.3 15 5761.5 8 138.1 96 18.1
27 387.5 26 5762.7 8 138.8 93 17.4
28 404.2 12 5779.2 6 138.8 97 18.9
29 393.8 12 5785.3 5 138.8 97 18.5
30 398.9 14 5780.7 6 138.1 97 18.6
31 416.2 15 5798.0 5 138.8 96 19.4
32 406.0 8 5783.8 3 138.1 98 19.2
33 412.3 9 5782.6 4 138.1 98 19.4
Run #
Overall Average Removal Efficiency (Runs 1-33) 89%
Overall Captured Sediment Mass (Runs 1-33) 434.0 lbs.
25
5. Design Limitations
Bio Clean Environmental Services, Inc. provides engineering support to clients on all projects.
Each system prior to submittal is evaluated and properly designed/sized to meet site specific
conditions including treatment and bypass flow rates, load rating requirements, and pipe depth.
All site and design constraints will be addressed during the design and manufacturing process.
Required Soil Characteristics
The Kraken® Filter is delivered to the job site as a complete pre-assembled unit housed in a
concrete structure designed to meet site specific soil conditions, corrosiveness, top and lateral
loading, and ground water. The system can be used in all soil types. A copy of the geotechnical
report along with surface loading requirements are reviewed and verified for each project.
Slope
The Kraken® Filter is most commonly used in a piped-in configuration in which one or more pipes
enter the side of the system subsurface. In general, it is not recommended that the pipe slope into
the system exceed 10% nor be less than 0.5%. Slopes higher than 10% will cause increased
velocities which could affect the performance of the pre-treatment chamber. Slopes less than 0.5%
could cause sediment to accumulate in the bottom of the inflow pipe and affect its hydraulic
capacity.
The Kraken® Filter is usually not affected by variations in slope of the finish surface as the unit is
buried underground. Risers of various heights can be used to bring access to the system up to finish
surface. In some configurations the Kraken® Filter can be installed with a built-in curb or drop
inlet. In these configurations finish surface slope is more constrained and will require design
review to ensure appropriate configuration.
Maximum Flow Rate
Maximum treatment flow rate is dependent on model size. The Kraken® Filter will be sized based
upon the NJCAT tested hydraulic loading rate of 0.05 gallons per minute per square foot filter
membrane surface area. Section 6 includes details pertaining to inspection and maintenance of the
Kraken® Filter.
Maintenance Requirements
Requirements pertaining to maintenance of the Kraken® Filter will vary depending on pollutant
loading and individual site conditions. It is recommended that the system be inspected at least
twice during the first year as a way to determine loading conditions for each site. These first year
inspections can be used as a way to establish inspection and maintenance frequency for subsequent
years.
Driving Head
Driving head will vary for a given Kraken® Filter model based on the site specific configuration.
Maximum treatment flow, maximum peak flow rate for online units, pipe slope and diameter will
be assessed. At the conclusion of mass load testing the water level reached 29.5 inches. This should
be used as the minimum driving head requirement for design. It is recommended that pipe fall
between the inflow and outflow pipe be provided to minimize or eliminate the amount of sur-
charge required during lower flows. Bio Clean Environmental provides design support for each
project. Site specific drawings (cut sheet) will be provided that show pipe inverts, finish surface
26
elevation, flow rates, and hydraulic grade lines. The hydraulic grade line will be assessed for its
effect on the overall drainage system to ensure no flooding at peak flow.
Installation Limitations
With each installation Bio Clean Environmental provides contractors with instructions prior to
delivery. Contractors can request onsite assistance from an installation technician during delivery
and installation. Pick weights and lifting details are also provided prior to delivery so the contractor
can prepare appropriate equipment onsite to set the unit.
Configurations
The Kraken® Filter is available in various configurations. The units can be installed online or
offline. However, this verification is for offline installation only. The Kraken® Filter has an
internal bypass weir (optional) which allows for it to be installed online without the need for any
external high flow diversion structure. For online installations peak bypass flow is routed directly from
pre-treatment chamber to discharge chamber, thus fully bypassing the filter chambers and preventing
any scouring of captured pollutants.
Structural Load Limitations
The Kraken® Filter is housed in a pre-cast concrete structure. Most standard structures are designed
to handle indirect traffic loads with minimal cover. For deeper installation or installation requiring
direct traffic rating or higher the structure will be designed and modified with potentially thicker tops,
bottoms and/or walls to handle the additional loading. Various access hatch options are available for
parkway, indirect traffic, direct traffic and other higher loading requirements such as airports or loading
docks.
Pre-treatment Requirements
The Kraken® Filter is designed with built-in pre-treatment capable of capturing sediments, debris
and floatables such as trash and other materials. No other pre-treatment is required.
Limitations in Tailwater
Site specific tailwater conditions must be assessed on each individual project. Tailwater conditions
increase the amount of driving head required for optimal system operation. The manufacturer’s internal
protocols require that these conditions are discussed with the engineer of record and that a solution be
implemented to adjust for any design variations caused by tailwater conditions at both treatment and
bypass flow rates.
Depth to Seasonal High Water Table
High groundwater conditions will not affect the operation of the Kraken® Filter as it is a closed
system. In conditions where high groundwater is present, various measures will be employed by Bio
Clean Environmental’s engineering department to ensure that there are no negative consequences
caused by the high groundwater. Various measures can be employed such as waterproofing the inside
and outside of the structure with an approved coating. A footing can also be added to the bottom of the
structure to increase its footprint and offset any buoyancy concerns.
27
6. Maintenance Plans
The Kraken® Filter is designed at a loading rate of 0.05 gpm/ft2 of media surface area to maximize
longevity and minimize maintenance requirements. Passive backwash and pre-treatment also helps
to minimize system maintenance requirements. The Kraken® Filter has proven to handle at least
18 months sediment loading with no maintenance or loss of treatment capacity.
As with all stormwater BMPs inspection and maintenance on the Kraken® Filter is necessary.
Stormwater regulations require that all BMPs be inspected and maintained to ensure they are
operating as designed to allow for effective pollutant removal and provide protection to receiving
water bodies. It is recommended that inspections be performed multiple times during the first year
to assess site specific loading conditions. This is recommended because pollutant loading can vary
greatly from site to site. Variables such as nearby soil erosion or construction sites, winter sanding
of roads, amount of daily traffic and land use can increase pollutant loading on the system. The
first year of inspections can be used to set inspection and maintenance intervals for subsequent
years. Without appropriate maintenance a BMP can exceed its storage capacity which can
negatively affect its continued performance in removing and retaining captured pollutants. The
Kraken® Filter Operation & Maintenance Manual is available at:
http://www.biocleanenvironmental.com/kraken-operation-and-maintenance/
Inspection Equipment
Following is a list of equipment to allow for simple and effective inspection of the Kraken® Filter:
• Bio Clean Environmental Inspection Form (contained in O&M Manual).
• Flashlight.
• Manhole hook or appropriate tools to access hatches and covers.
• Appropriate traffic control signage and procedures.
• Measuring pole and/or tape measure.
• Protective clothing and eye protection.
• Note: entering a confined space requires appropriate safety and certification. It is generally
not required for routine inspections of the system.
Inspection Steps
The core to any successful stormwater BMP maintenance program is routine inspections. The
inspection steps required on the Kraken® Filter are quick and easy. As mentioned above the first
year or two should be seen as the maintenance interval establishment phase. During the first two
years more frequent inspections should occur in order to gather loading data and maintenance
requirements for that specific site. This information can be used to establish a base for long term
inspection and maintenance interval requirements.
The Kraken® Filter can be inspected though visual observation without entry into the system. All
necessary pre-inspection steps must be carried out before inspection occurs, especially traffic
control and other safety measures to protect the inspector and near-by pedestrians from any dangers
associated with an open access hatch or manhole. Once these access covers have been safely
opened the inspection process can proceed:
28
• Prepare the inspection form by writing in the necessary information including project
name, location, date & time, unit number and other info (see inspection form).
• Observe the inside of the system through the access hatches. If minimal light is available
and vision into the unit is impaired utilize a flashlight to see inside the system and all of its
chambers.
• Look for any out of the ordinary obstructions in the inflow pipe, pre-treatment chamber,
filter chambers, discharge chamber or outflow pipe. Write down any observations on the
inspection form.
• Through observation and/or digital photographs estimate the amount of floatable debris
accumulated in the pre-treatment chamber. Record this information on the inspection form.
Next utilizing a tape measure or measuring stick estimate the amount of sediment
accumulated in the primary and secondary sedimentation chambers. Record this depth on
the inspection form. Through visual observation inspect the condition of the filter
cartridges. Look for excessive build-up of sediments on the surface and any build-up on
the top of the cartridges. Record this information on the inspection form.
• Finalize inspection report for analysis by the maintenance manager to determine if
maintenance is required.
Maintenance Indicators
Based upon observations made during inspection, maintenance of the system may be required
based on the following indicators:
• Missing or damaged internal components or cartridges.
• Obstructions in the system or its inlet or outlet.
• Excessive accumulation of floatable in the pre-treatment chambers in which the length and
width of the chambers behind oil/floatables skimmer is fully impacted.
• Excessive accumulation of sediment in the primary sedimentation chamber of more than
18” in depth.
• Excessive accumulation of sediment in the secondary sedimentation chamber of more than
6”.
• Excessive accumulation of sediment in the filter chambers of more than 3” on average.
• Substantial build-up of sediments on the membrane of the filter cartridges which will have
a very dark appearance indicating the membrane may be fully saturated with sediment.
Maintenance Equipment
While maintenance can be done fully by hand it is recommended that a vacuum truck be utilized
to minimize the time required to maintain the Kraken® Filter:
• Bio Clean Environmental Maintenance Form (contained in O&M Manual).
• Flashlight.
• Manhole hook or appropriate tools to access hatches and covers.
• Appropriate traffic control signage and procedures.
• Measuring pole and/or tape measure.
• Protective clothing and eye protection.
• Note: entering a confined space requires appropriate safety and certification. It is generally
not required for routine inspections of the system. Entry into the system will be required if
it is determine the cartridge filters need washing/cleaning.
29
• Vacuum truck
• Trash can
• Pressure washer
Maintenance Procedures
It is recommended that maintenance occurs at least three days after the most recent rain event to
allow for drain down of the system and any associated upstream detention systems. Maintaining
the system while flows are still entering it will increase the time and complexity required for
maintenance. Cleaning of the pre-treatment chamber can be performed from finish surface without
entry into the vault utilizing a vacuum truck. Once all safety measures have been set up cleaning
of the pre-treatment chamber can proceed as followed:
• Using an extension on a vacuum truck position the hose over the opened access hatch and
lower into the center of the primary sedimentation chamber. Remove all floating debris,
standing water and sediment from the chamber. A power washer can be used to assist if
sediments have become hardened and stuck to the walls or the floor of the chamber. Repeat
the same procedure for the secondary sedimentation chamber. This completes the
maintenance procedure required on the pre-treatment chamber.
If maintenance is required on the filter cartridges the following procedure can be followed after
maintenance on the pre-treatment chamber is performed:
• Following rules for confined space entry use a gas meter to detect the presence of any
hazardous gases. If hazardous gases are present do not enter the vault. Follow appropriate
confined space procedures, such as utilizing venting system, to address the hazard. Once it
is determined to be safe to enter utilize appropriate entry equipment such as a ladder and
tripod with harness to enter the system.
• Once entry into the system has been established the maintenance technician should position
themselves to stand in the pre-treatment chamber. From here the removal of the cartridges
can commence.
• Each cartridge is pressure fitted in place and includes a handle for easy removal. To remove
a cartridge, simply grab the handle and pull straight up. It may be required to gently shift
pressure from side to side while pulling up to break the pressure seal. Removal of the
cartridge should be done by hand with minimal effort and requires no tools.
• Once the cartridges are removed they should be taken out of the vault and brought up to
finish surface for cleaning. Using a large garbage can and a standard garden hose (low
pressure nozzle), each cartridge should be rinsed off from the outside to remove
accumulated sediments and debris. Once each cartridge is rinsed it should be placed to the
side for re-installation.
• Each filter chamber should be power washed and vacuumed clean before re-inserting the
cleaned cartridges.
• After all cartridges have been washed they can be replaced back into the vault. To replace
each cartridge simply slide the cartridge over each pressure fitted coupler. Push down on
the handle to ensure the cartridge has been fully seated and the bottom of the cartridge is
making contact with the floor.
• The last step is to close up and replace all access hatches and remove all traffic control.
30
• All removed debris and pollutants shall be disposed of following local and state
requirements.
• Disposal requirements for recovered pollutants and spent cartridges may vary depending
on local guidelines. In most areas the sediment and spent cartridges, once dewatered, can
be disposed of in a sanitary landfill. It is not anticipated that the sediment would be
classified as hazardous waste.
• In the case of damaged components or spend cartridges, replacement parts can be ordered
by the manufacture.
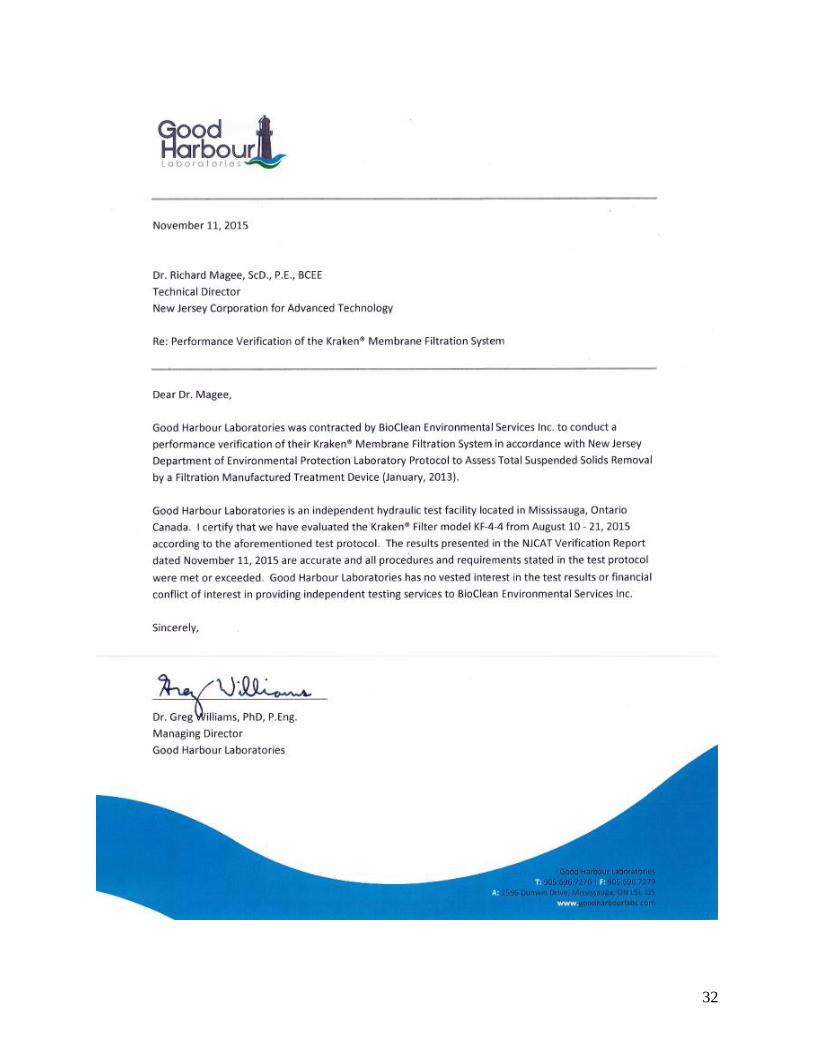
7. Statements
The following attached pages are signed statements from the manufacturer (Bio Clean
Environmental Services, Inc.), the independent test laboratory (Good Harbour Labs), and NJCAT.
These statements are a requirement of the verification process.
In addition, it should be noted that this report has been subjected to public review (e.g. stormwater
industry) and all comments and concerns have been satisfactorily addressed.

31
32
33
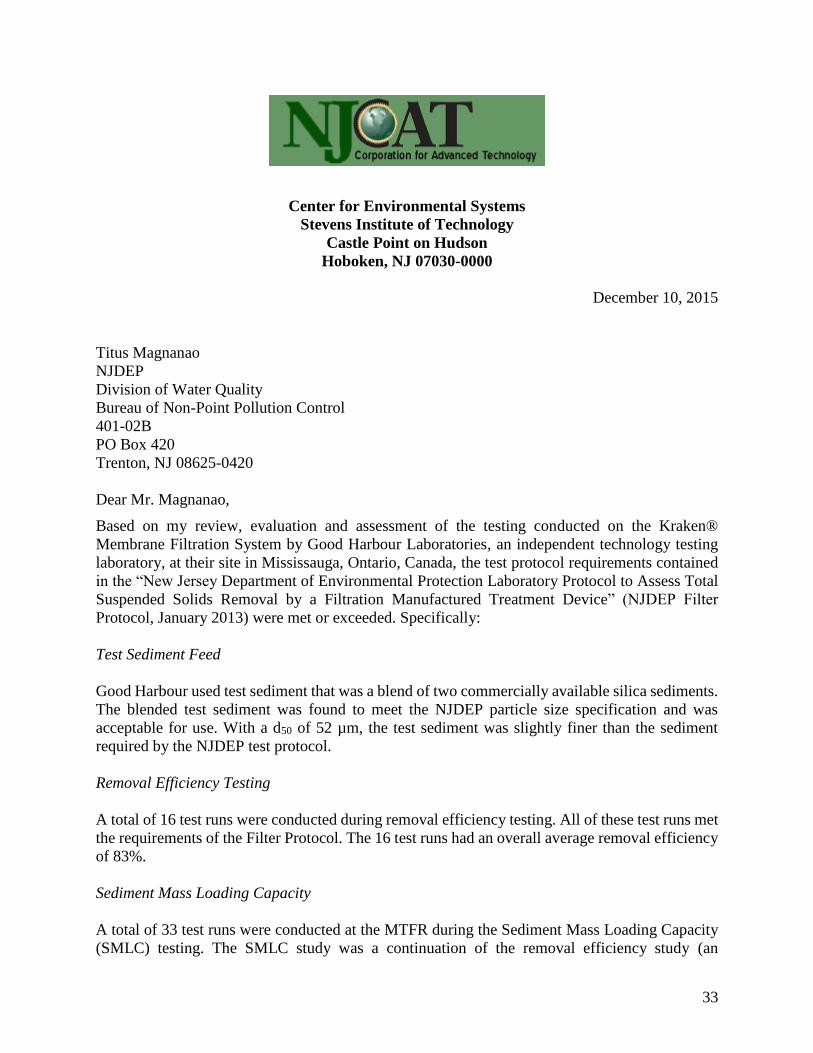
Center for Environmental Systems
Stevens Institute of Technology
Castle Point on Hudson
Hoboken, NJ 07030-0000
December 10, 2015
Titus Magnanao
NJDEP
Division of Water Quality
Bureau of Non-Point Pollution Control
401-02B
PO Box 420
Trenton, NJ 08625-0420
Dear Mr. Magnanao,
Based on my review, evaluation and assessment of the testing conducted on the Kraken®
Membrane Filtration System by Good Harbour Laboratories, an independent technology testing
laboratory, at their site in Mississauga, Ontario, Canada, the test protocol requirements contained
in the “New Jersey Department of Environmental Protection Laboratory Protocol to Assess Total
Suspended Solids Removal by a Filtration Manufactured Treatment Device” (NJDEP Filter
Protocol, January 2013) were met or exceeded. Specifically:
Test Sediment Feed
Good Harbour used test sediment that was a blend of two commercially available silica sediments.
The blended test sediment was found to meet the NJDEP particle size specification and was
acceptable for use. With a d50 of 52 µm, the test sediment was slightly finer than the sediment
required by the NJDEP test protocol.
Removal Efficiency Testing
A total of 16 test runs were conducted during removal efficiency testing. All of these test runs met
the requirements of the Filter Protocol. The 16 test runs had an overall average removal efficiency
of 83%.
Sediment Mass Loading Capacity
A total of 33 test runs were conducted at the MTFR during the Sediment Mass Loading Capacity
(SMLC) testing. The SMLC study was a continuation of the removal efficiency study (an
34
additional 17 test runs). The SMLC test was terminated once the mass of the captured sediment
exceeded 1.5X the recommended minimum amount for filter maintenance (one year). By the end
of run #33, filter bypass had not yet occurred. The total mass of sediment captured was 434 lbs.
and the overall removal efficiency was 89%.
Scour Testing
At this time the Kraken® filter System is being submitted for approval for off-line testing;
therefore no scour test data was provided.
Sincerely,
Richard S. Magee, Sc.D., P.E., BCEE
35
8. References
1. Good Harbour Laboratories 2015. Laboratory Performance Testing Quality Assurance
Project Plan (QAPP) for Bio Clean’s Kraken™ Membrane Filtration System. Prepared
by Good Harbour Laboratories, June 2015.
2. Good Harbour Laboratories, Notebook A010, pp. 17-29, 53-66, 69, 84-99.
3. NJDEP 2013a. New Jersey Department of Environmental Protection Procedure for
Obtaining Verification of a Stormwater Manufactured Treatment Device from New
Jersey Corporation for Advanced Technology. January 25, 2013.
4. NJDEP 2013b. New Jersey Department of Environmental Protection Laboratory
Protocol to Assess Total Suspended Solids Removal by a Filtration Manufactured
Treatment Device. January 25, 2013.
36
VERIFICATION APPENDIX
37
Introduction
• Manufacturer – Bio Clean Environmental Services, Inc., 2972 San Luis Rey Road,
Oceanside, CA 92054. Website: http://www.BioCleanEnvironmental.com Phone: 760-
433-7640.
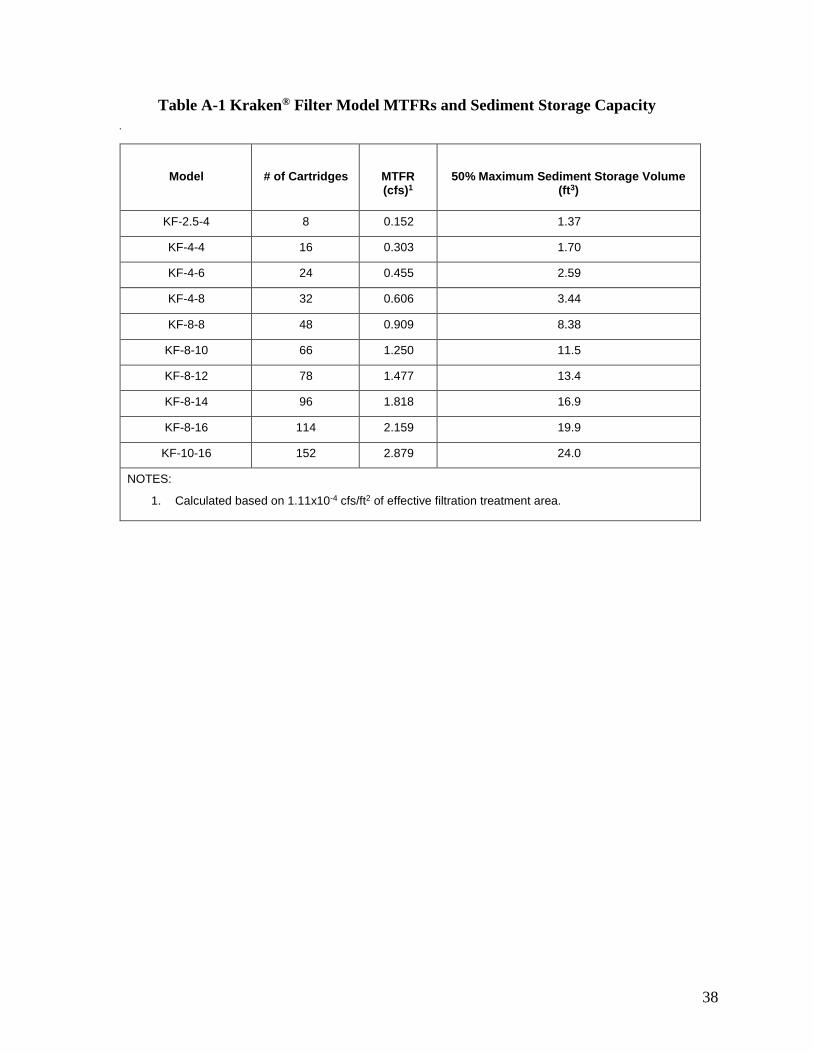
• MTD - Kraken® Filter verified models are shown in Table A-1.
• TSS Removal Rate – 80%
• Off-line installation
Detailed Specification
• NJDEP sizing tables and physical dimensions for Kraken® Filter verified models are
attached (Table A-1 and Table A-2). These Sizing Tables are valid for NJ following
NJDEP Water Quality Design Storm Event of 1.25" in 2 hours (NJAC 7:8-5.5(a)).
• Maximum inflow drainage area
o The maximum inflow drainage area is governed by the maximum treatment flow
rate of each model size as presented in Table A-1 and Table A-4.
• Driving head will vary for a given Kraken® Filter model based on the site specific
configuration. For standard design, as tested under the NJDEP Protocol, 29.5 inches should
be used as the driving head requirement. Bio Clean Environmental provides design support
for each project.
• The drain down flow is regulated by a drain down orifice, sized so that a clean filter drains
down in approximately 15 minutes. The drain down flow rate is expected to decrease as
the filters ripen.
• See Kraken® Filter O&M Manual for maintenance needs and procedures.
http://www.biocleanenvironmental.com/kraken-operation-and-maintenance/
• This certification does not extend to the enhanced removal rates under NJAC 7:8-5.5
through the addition of settling chambers (such as hydrodynamic separators) or media
filtration practices (such as a sand filter).
38
Table A-1 Kraken® Filter Model MTFRs and Sediment Storage Capacity
•
Model
# of Cartridges
MTFR (cfs)1
50% Maximum Sediment Storage Volume (ft3)
KF-2.5-4 8 0.152 1.37
KF-4-4 16 0.303 1.70
KF-4-6 24 0.455 2.59
KF-4-8 32 0.606 3.44
KF-8-8 48 0.909 8.38
KF-8-10 66 1.250 11.5
KF-8-12 78 1.477 13.4
KF-8-14 96 1.818 16.9
KF-8-16 114 2.159 19.9
KF-10-16 152 2.879 24.0
NOTES:
1. Calculated based on 1.11x10⁻⁴ cfs/ft2 of effective filtration treatment area.
39
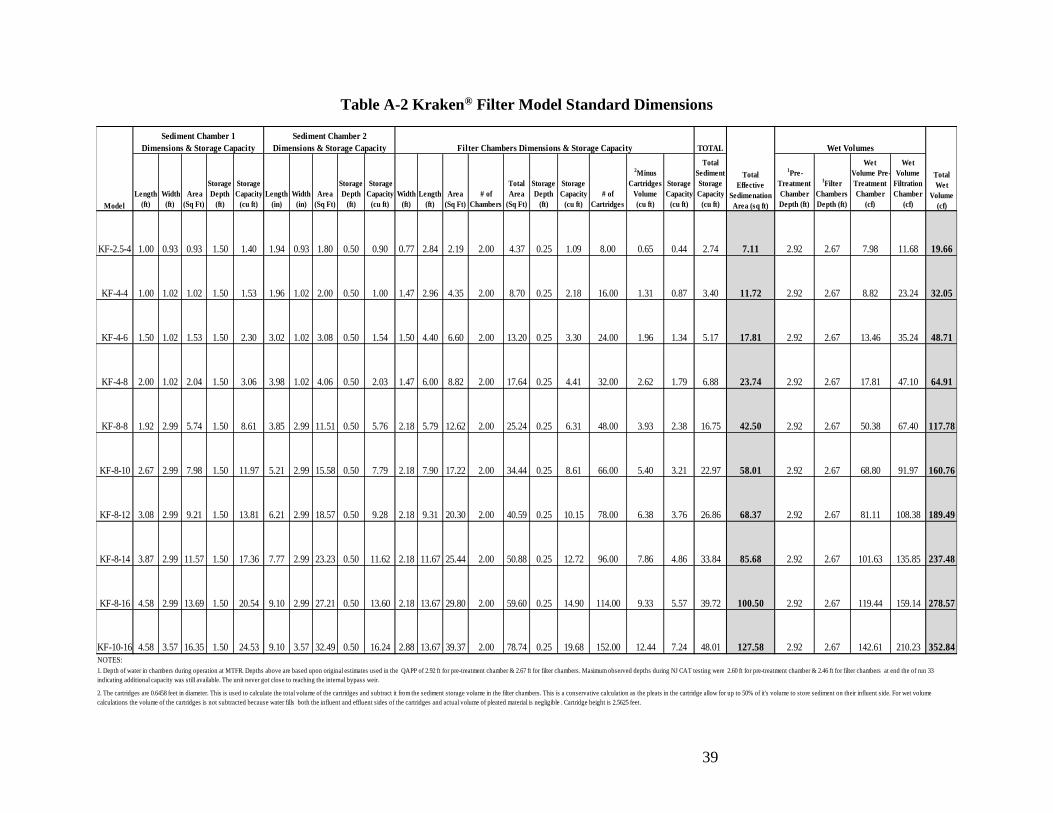
Table A-2 Kraken® Filter Model Standard Dimensions
TOTAL
Length
(ft)
Width
(ft)
Area
(Sq Ft)
Storage
Depth
(ft)
Storage
Capacity
(cu ft)
Length
(in)
Width
(in)
Area
(Sq Ft)
Storage
Depth
(ft)
Storage
Capacity
(cu ft)
Width
(ft)
Length
(ft)
Area
(Sq Ft)
# of
Chambers
Total
Area
(Sq Ft)
Storage
Depth
(ft)
Storage
Capacity
(cu ft)
# of
Cartridges
2Minus
Cartridges
Volume
(cu ft)
Storage
Capacity
(cu ft)
Total
Sediment
Storage
Capacity
(cu ft)
1Pre-
Treatment
Chamber
Depth (ft)
1Filter
Chambers
Depth (ft)
Wet
Volume Pre-
Treatment
Chamber
(cf)
Wet
Volume
Filtration
Chamber
(cf)
KF-2.5-4 1.00 0.93 0.93 1.50 1.40 1.94 0.93 1.80 0.50 0.90 0.77 2.84 2.19 2.00 4.37 0.25 1.09 8.00 0.65 0.44 2.74 7.11 2.92 2.67 7.98 11.68 19.66
KF-4-4 1.00 1.02 1.02 1.50 1.53 1.96 1.02 2.00 0.50 1.00 1.47 2.96 4.35 2.00 8.70 0.25 2.18 16.00 1.31 0.87 3.40 11.72 2.92 2.67 8.82 23.24 32.05
KF-4-6 1.50 1.02 1.53 1.50 2.30 3.02 1.02 3.08 0.50 1.54 1.50 4.40 6.60 2.00 13.20 0.25 3.30 24.00 1.96 1.34 5.17 17.81 2.92 2.67 13.46 35.24 48.71
KF-4-8 2.00 1.02 2.04 1.50 3.06 3.98 1.02 4.06 0.50 2.03 1.47 6.00 8.82 2.00 17.64 0.25 4.41 32.00 2.62 1.79 6.88 23.74 2.92 2.67 17.81 47.10 64.91
KF-8-8 1.92 2.99 5.74 1.50 8.61 3.85 2.99 11.51 0.50 5.76 2.18 5.79 12.62 2.00 25.24 0.25 6.31 48.00 3.93 2.38 16.75 42.50 2.92 2.67 50.38 67.40 117.78
KF-8-10 2.67 2.99 7.98 1.50 11.97 5.21 2.99 15.58 0.50 7.79 2.18 7.90 17.22 2.00 34.44 0.25 8.61 66.00 5.40 3.21 22.97 58.01 2.92 2.67 68.80 91.97 160.76
KF-8-12 3.08 2.99 9.21 1.50 13.81 6.21 2.99 18.57 0.50 9.28 2.18 9.31 20.30 2.00 40.59 0.25 10.15 78.00 6.38 3.76 26.86 68.37 2.92 2.67 81.11 108.38 189.49
KF-8-14 3.87 2.99 11.57 1.50 17.36 7.77 2.99 23.23 0.50 11.62 2.18 11.67 25.44 2.00 50.88 0.25 12.72 96.00 7.86 4.86 33.84 85.68 2.92 2.67 101.63 135.85 237.48
KF-8-16 4.58 2.99 13.69 1.50 20.54 9.10 2.99 27.21 0.50 13.60 2.18 13.67 29.80 2.00 59.60 0.25 14.90 114.00 9.33 5.57 39.72 100.50 2.92 2.67 119.44 159.14 278.57
KF-10-16 4.58 3.57 16.35 1.50 24.53 9.10 3.57 32.49 0.50 16.24 2.88 13.67 39.37 2.00 78.74 0.25 19.68 152.00 12.44 7.24 48.01 127.58 2.92 2.67 142.61 210.23 352.84
Wet Volumes
Total
Wet
Volume
(cf)
1. Depth of water in chambers during operation at MTFR. Depths above are based upon original estimates used in the QAPP of 2.92 ft for pre-treatment chamber & 2.67 ft for filter chambers. Maximum observed depths during NJ CAT testing were 2.60 ft for pre-treatment chamber & 2.46 ft for filter chambers at end the of run 33
indicating additional capacity was still available. The unit never got close to reaching the internal bypass weir.
2. The cartridges are 0.6458 feet in diameter. This is used to calculate the total volume of the cartridges and subtract it from the sediment storage volume in the filter chambers. This is a conservative calculation as the pleats in the cartridge allow for up to 50% of it's volume to store sediment on their influent side. For wet volume
calculations the volume of the cartridges is not subtracted because water fills both the influent and effluent sides of the cartridges and actual volume of pleated material is negligible . Cartridge height is 2.5625 feet.
Sediment Chamber 2
Dimensions & Storage Capacity
Sediment Chamber 1
Dimensions & Storage Capacity
Total
Effective
Sedimenation
Area (sq ft)
Filter Chambers Dimensions & Storage Capacity
Model
NOTES:
40
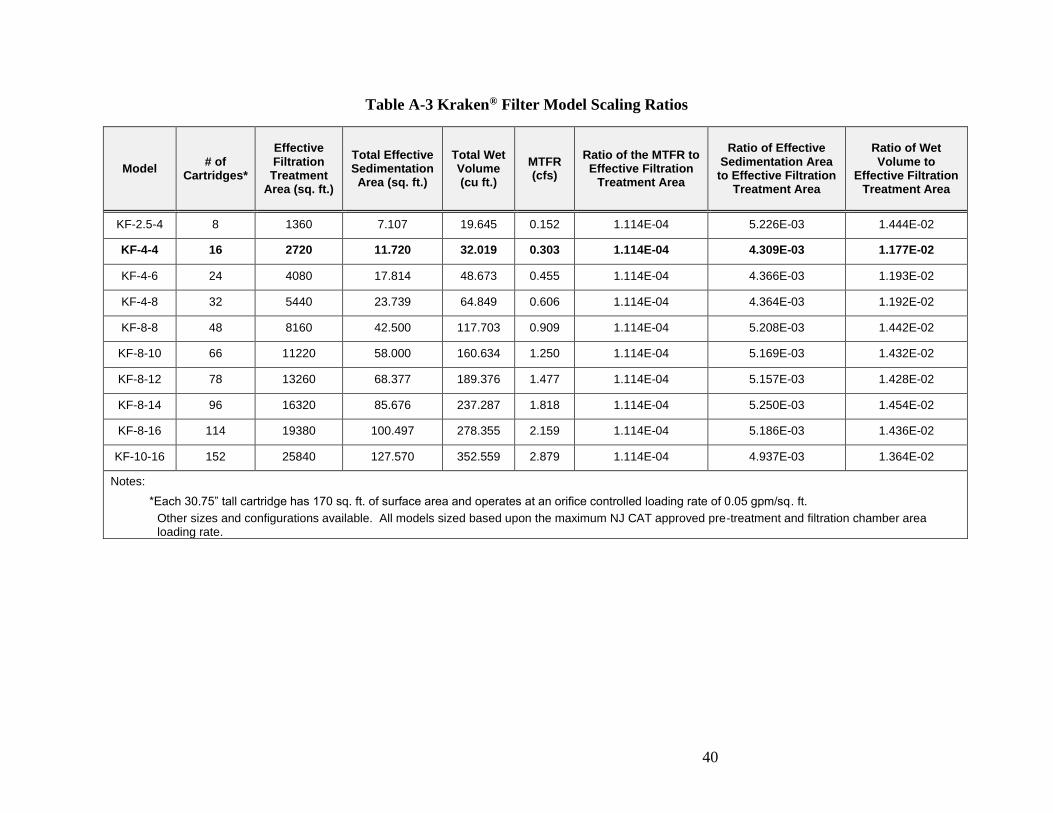
Table A-3 Kraken® Filter Model Scaling Ratios
Model # of
Cartridges*
Effective Filtration Treatment
Area (sq. ft.)
Total Effective Sedimentation Area (sq. ft.)
Total Wet Volume (cu ft.)
MTFR (cfs)
Ratio of the MTFR to Effective Filtration
Treatment Area
Ratio of Effective Sedimentation Area
to Effective Filtration Treatment Area
Ratio of Wet Volume to
Effective Filtration Treatment Area
KF-2.5-4 8 1360 7.107 19.645 0.152 1.114E-04 5.226E-03 1.444E-02
KF-4-4 16 2720 11.720 32.019 0.303 1.114E-04 4.309E-03 1.177E-02
KF-4-6 24 4080 17.814 48.673 0.455 1.114E-04 4.366E-03 1.193E-02
KF-4-8 32 5440 23.739 64.849 0.606 1.114E-04 4.364E-03 1.192E-02
KF-8-8 48 8160 42.500 117.703 0.909 1.114E-04 5.208E-03 1.442E-02
KF-8-10 66 11220 58.000 160.634 1.250 1.114E-04 5.169E-03 1.432E-02
KF-8-12 78 13260 68.377 189.376 1.477 1.114E-04 5.157E-03 1.428E-02
KF-8-14 96 16320 85.676 237.287 1.818 1.114E-04 5.250E-03 1.454E-02
KF-8-16 114 19380 100.497 278.355 2.159 1.114E-04 5.186E-03 1.436E-02
KF-10-16 152 25840 127.570 352.559 2.879 1.114E-04 4.937E-03 1.364E-02
Notes:
*Each 30.75” tall cartridge has 170 sq. ft. of surface area and operates at an orifice controlled loading rate of 0.05 gpm/sq. ft.
Other sizes and configurations available. All models sized based upon the maximum NJ CAT approved pre-treatment and filtration chamber area loading rate.
41
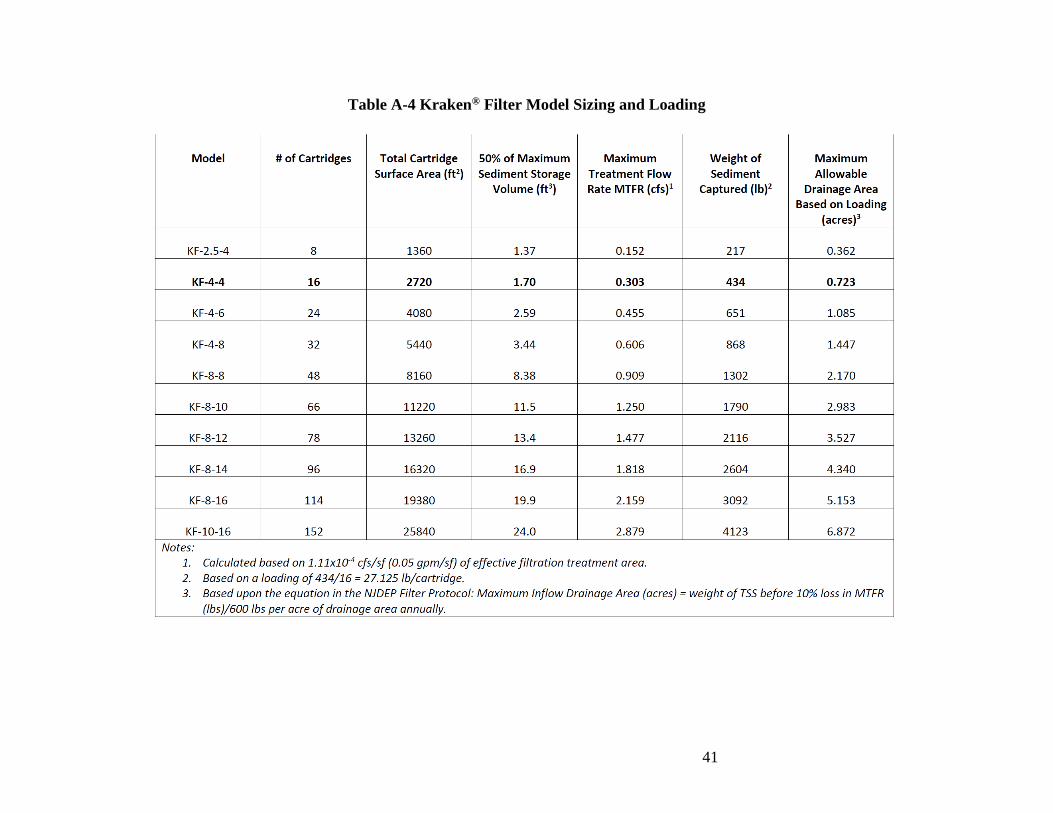
Table A-4 Kraken® Filter Model Sizing and Loading
42
NJCAT TECHNOLOGY VERIFICATION
ADDENDUM REPORT
Kraken® Membrane Filtration System
Bio Clean Environmental Services, Inc.
April, 2016
43
Table of Contents
Page
Table of Contents .......................................................................................................................... 43
List of Figures ............................................................................................................................... 44
List of Tables ................................................................................................................................ 44
1. Introduction ........................................................................................................................... 45
2. Laboratory Testing ................................................................................................................ 45
2.1 Test Setup .................................................................................................................................. 45
2.2 Test Sediment ........................................................................................................................... 47
2.3 Scour Testing ............................................................................................................................ 47
3. Additional Performance Claims ............................................................................................ 49
4. Supporting Documentation .................................................................................................... 49
4.1 Scour Testing ............................................................................................................................ 49
5. Statements .............................................................................................................................. 51
6. References………………………………………………………………………………….. 55
44
List of Figures
Figure 1: Test Flow Loop ............................................................................................................ 46
Figure 2: Isokinetic Sampler…………………………………………………………………….46
Figure 3: Fil-Trek Filter Housing ................................................................................................ 47
Figure 4: Scour Test Background SSC ........................................................................................ 50
List of Tables
Page
Table 1: Filter Element Retained Sediment .................................................................................. 48
Table 2: Chamber Sediment Pre-Load Amounts .......................................................................... 48
Table 3: Scour Test Sampling Frequency .................................................................................... 49
Table 4: Scour Test Flow Summary ............................................................................................ 50
Table 5: Scour Test Background SSC Results ............................................................................. 50
Table 6: Scour Test Effluent SSC Results ................................................................................... 51
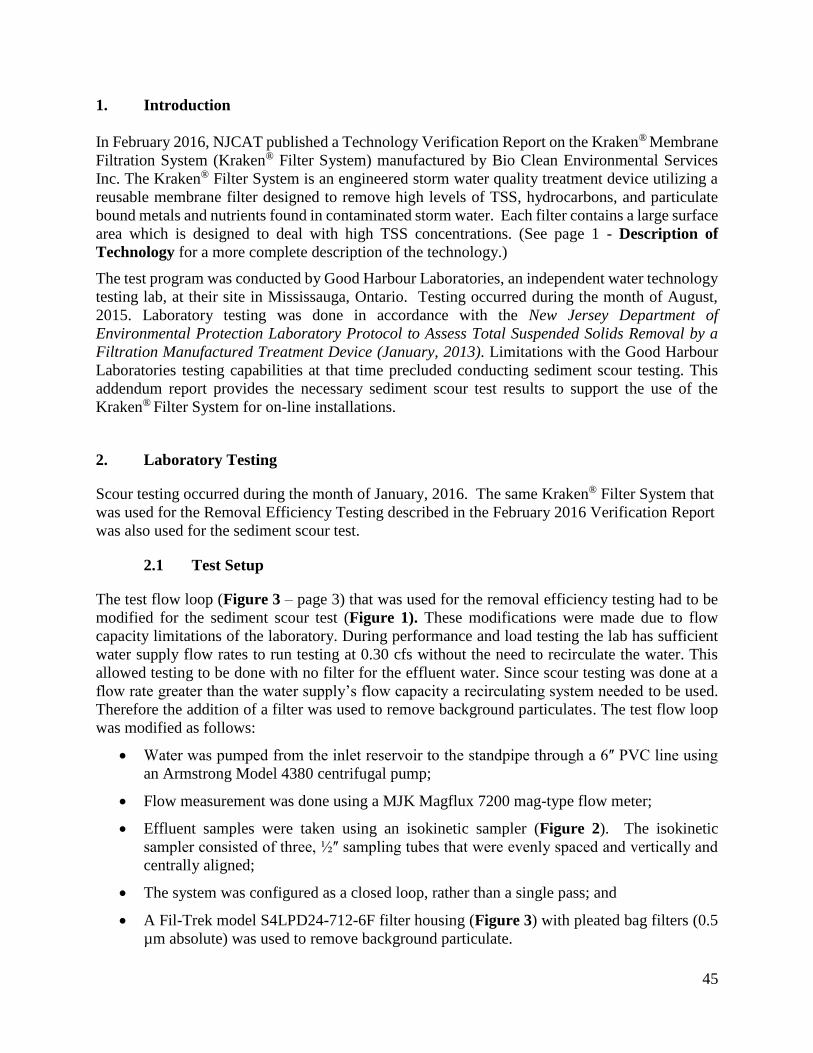
45
1. Introduction
In February 2016, NJCAT published a Technology Verification Report on the Kraken® Membrane
Filtration System (Kraken® Filter System) manufactured by Bio Clean Environmental Services
Inc. The Kraken® Filter System is an engineered storm water quality treatment device utilizing a
reusable membrane filter designed to remove high levels of TSS, hydrocarbons, and particulate
bound metals and nutrients found in contaminated storm water. Each filter contains a large surface
area which is designed to deal with high TSS concentrations. (See page 1 - Description of
Technology for a more complete description of the technology.)
The test program was conducted by Good Harbour Laboratories, an independent water technology
testing lab, at their site in Mississauga, Ontario. Testing occurred during the month of August,
2015. Laboratory testing was done in accordance with the New Jersey Department of
Environmental Protection Laboratory Protocol to Assess Total Suspended Solids Removal by a
Filtration Manufactured Treatment Device (January, 2013). Limitations with the Good Harbour
Laboratories testing capabilities at that time precluded conducting sediment scour testing. This
addendum report provides the necessary sediment scour test results to support the use of the
Kraken® Filter System for on-line installations.
2. Laboratory Testing
Scour testing occurred during the month of January, 2016. The same Kraken® Filter System that
was used for the Removal Efficiency Testing described in the February 2016 Verification Report
was also used for the sediment scour test.
2.1 Test Setup
The test flow loop (Figure 3 – page 3) that was used for the removal efficiency testing had to be
modified for the sediment scour test (Figure 1). These modifications were made due to flow
capacity limitations of the laboratory. During performance and load testing the lab has sufficient
water supply flow rates to run testing at 0.30 cfs without the need to recirculate the water. This
allowed testing to be done with no filter for the effluent water. Since scour testing was done at a
flow rate greater than the water supply’s flow capacity a recirculating system needed to be used.
Therefore the addition of a filter was used to remove background particulates. The test flow loop
was modified as follows:
• Water was pumped from the inlet reservoir to the standpipe through a 6ʺ PVC line using
an Armstrong Model 4380 centrifugal pump;
• Flow measurement was done using a MJK Magflux 7200 mag-type flow meter;
• Effluent samples were taken using an isokinetic sampler (Figure 2). The isokinetic
sampler consisted of three, ½ʺ sampling tubes that were evenly spaced and vertically and
centrally aligned;
• The system was configured as a closed loop, rather than a single pass; and
• A Fil-Trek model S4LPD24-712-6F filter housing (Figure 3) with pleated bag filters (0.5
µm absolute) was used to remove background particulate.
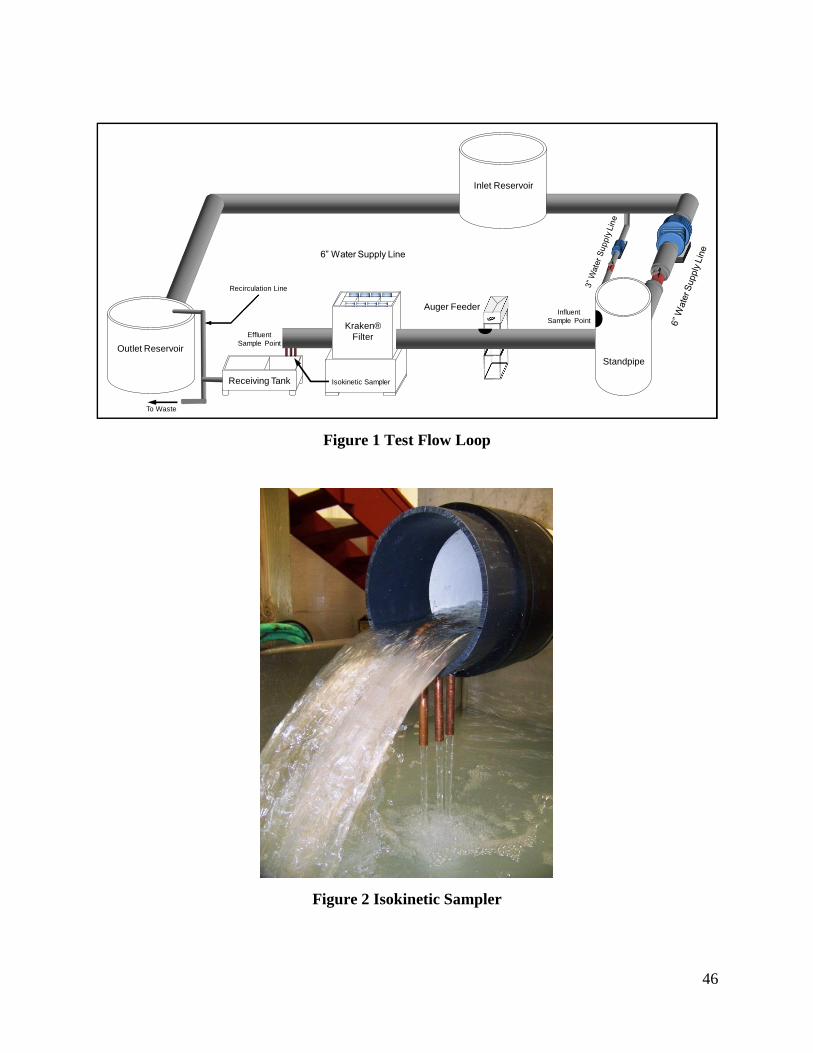
46
Figure 1 Test Flow Loop
Figure 2 Isokinetic Sampler
Receiving Tank
Standpipe
Inlet Reservoir
6” Water Supply Line
Kraken®
Filter
Auger Feeder
Outlet Reservoir
To Waste
Recirculation Line
Isokinetic Sampler
Effluent
Sample Point
Influent
Sample Point
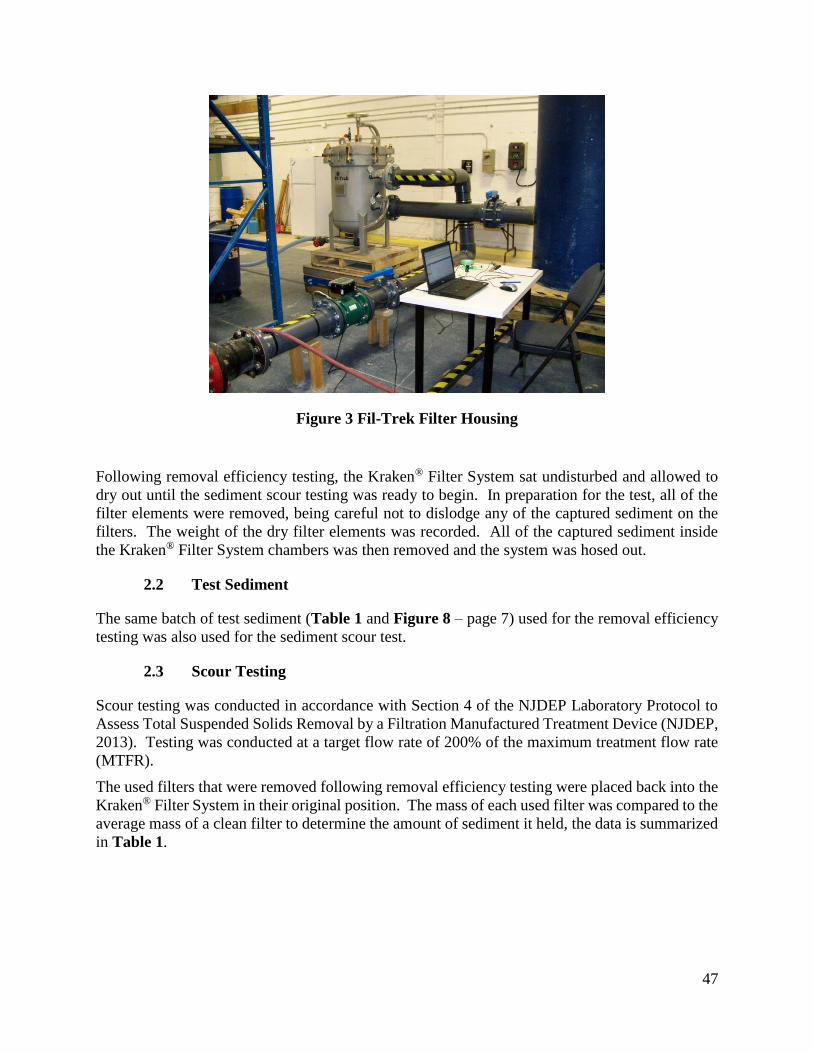
47
Figure 3 Fil-Trek Filter Housing
Following removal efficiency testing, the Kraken® Filter System sat undisturbed and allowed to
dry out until the sediment scour testing was ready to begin. In preparation for the test, all of the
filter elements were removed, being careful not to dislodge any of the captured sediment on the
filters. The weight of the dry filter elements was recorded. All of the captured sediment inside
the Kraken® Filter System chambers was then removed and the system was hosed out.
2.2 Test Sediment
The same batch of test sediment (Table 1 and Figure 8 – page 7) used for the removal efficiency
testing was also used for the sediment scour test.
2.3 Scour Testing
Scour testing was conducted in accordance with Section 4 of the NJDEP Laboratory Protocol to
Assess Total Suspended Solids Removal by a Filtration Manufactured Treatment Device (NJDEP,
2013). Testing was conducted at a target flow rate of 200% of the maximum treatment flow rate
(MTFR).
The used filters that were removed following removal efficiency testing were placed back into the
Kraken® Filter System in their original position. The mass of each used filter was compared to the
average mass of a clean filter to determine the amount of sediment it held, the data is summarized
in Table 1.
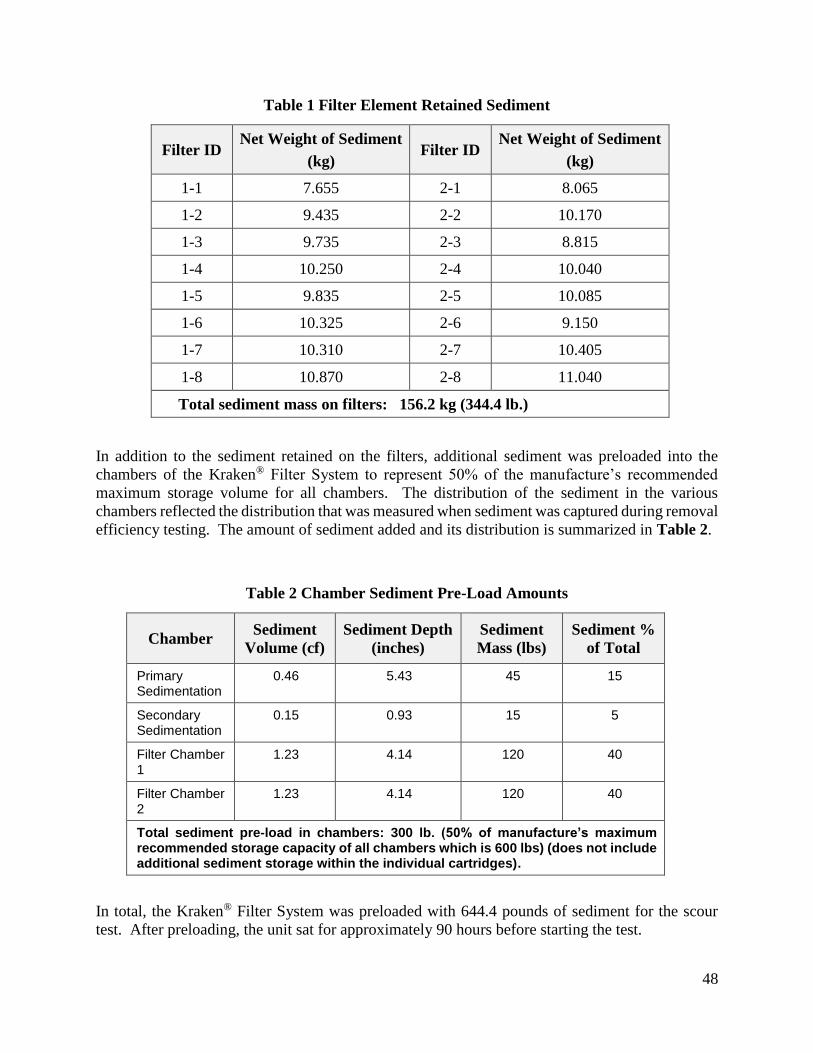
48
Table 1 Filter Element Retained Sediment
Filter ID Net Weight of Sediment
(kg) Filter ID
Net Weight of Sediment
(kg)
1-1 7.655 2-1 8.065
1-2 9.435 2-2 10.170
1-3 9.735 2-3 8.815
1-4 10.250 2-4 10.040
1-5 9.835 2-5 10.085
1-6 10.325 2-6 9.150
1-7 10.310 2-7 10.405
1-8 10.870 2-8 11.040
Total sediment mass on filters: 156.2 kg (344.4 lb.)
In addition to the sediment retained on the filters, additional sediment was preloaded into the
chambers of the Kraken® Filter System to represent 50% of the manufacture’s recommended
maximum storage volume for all chambers. The distribution of the sediment in the various
chambers reflected the distribution that was measured when sediment was captured during removal
efficiency testing. The amount of sediment added and its distribution is summarized in Table 2.
Table 2 Chamber Sediment Pre-Load Amounts
Chamber Sediment
Volume (cf)
Sediment Depth
(inches)
Sediment
Mass (lbs)
Sediment %
of Total
Primary Sedimentation
0.46 5.43 45 15
Secondary Sedimentation
0.15 0.93 15 5
Filter Chamber 1
1.23 4.14 120 40
Filter Chamber 2
1.23 4.14 120 40
Total sediment pre-load in chambers: 300 lb. (50% of manufacture’s maximum recommended storage capacity of all chambers which is 600 lbs) (does not include additional sediment storage within the individual cartridges).
In total, the Kraken® Filter System was preloaded with 644.4 pounds of sediment for the scour
test. After preloading, the unit sat for approximately 90 hours before starting the test.
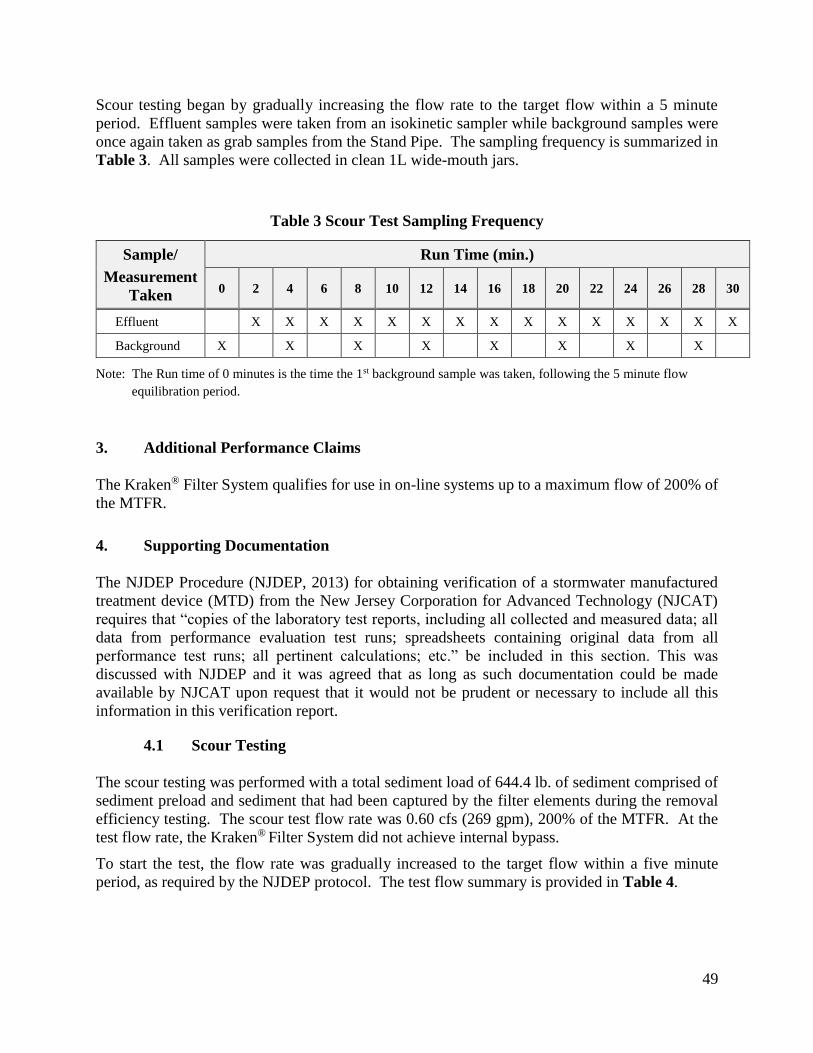
49
Scour testing began by gradually increasing the flow rate to the target flow within a 5 minute
period. Effluent samples were taken from an isokinetic sampler while background samples were
once again taken as grab samples from the Stand Pipe. The sampling frequency is summarized in
Table 3. All samples were collected in clean 1L wide-mouth jars.
Table 3 Scour Test Sampling Frequency
Sample/
Measurement
Taken
Run Time (min.)
0 2 4 6 8 10 12 14 16 18 20 22 24 26 28 30
Effluent X X X X X X X X X X X X X X X
Background X X X X X X X X
Note: The Run time of 0 minutes is the time the 1st background sample was taken, following the 5 minute flow
equilibration period.
3. Additional Performance Claims
The Kraken® Filter System qualifies for use in on-line systems up to a maximum flow of 200% of
the MTFR.
4. Supporting Documentation
The NJDEP Procedure (NJDEP, 2013) for obtaining verification of a stormwater manufactured
treatment device (MTD) from the New Jersey Corporation for Advanced Technology (NJCAT)
requires that “copies of the laboratory test reports, including all collected and measured data; all
data from performance evaluation test runs; spreadsheets containing original data from all
performance test runs; all pertinent calculations; etc.” be included in this section. This was
discussed with NJDEP and it was agreed that as long as such documentation could be made
available by NJCAT upon request that it would not be prudent or necessary to include all this
information in this verification report.
4.1 Scour Testing
The scour testing was performed with a total sediment load of 644.4 lb. of sediment comprised of
sediment preload and sediment that had been captured by the filter elements during the removal
efficiency testing. The scour test flow rate was 0.60 cfs (269 gpm), 200% of the MTFR. At the
test flow rate, the Kraken® Filter System did not achieve internal bypass.
To start the test, the flow rate was gradually increased to the target flow within a five minute
period, as required by the NJDEP protocol. The test flow summary is provided in Table 4.
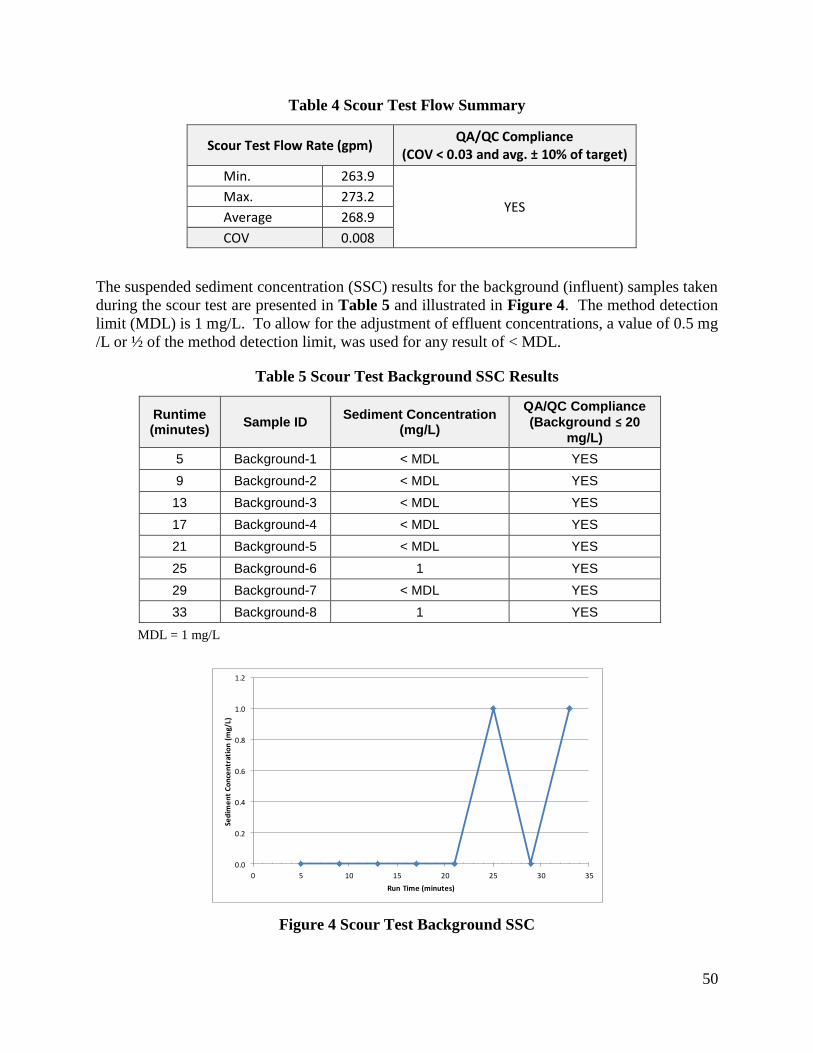
50
Table 4 Scour Test Flow Summary
Scour Test Flow Rate (gpm) QA/QC Compliance
(COV < 0.03 and avg. ± 10% of target)
Min. 263.9
YES Max. 273.2
Average 268.9
COV 0.008
The suspended sediment concentration (SSC) results for the background (influent) samples taken
during the scour test are presented in Table 5 and illustrated in Figure 4. The method detection
limit (MDL) is 1 mg/L. To allow for the adjustment of effluent concentrations, a value of 0.5 mg
/L or ½ of the method detection limit, was used for any result of < MDL.
Table 5 Scour Test Background SSC Results
Runtime (minutes)
Sample ID Sediment Concentration
(mg/L)
QA/QC Compliance
(Background ≤ 20
mg/L)
5 Background-1 < MDL YES
9 Background-2 < MDL YES
13 Background-3 < MDL YES
17 Background-4 < MDL YES
21 Background-5 < MDL YES
25 Background-6 1 YES
29 Background-7 < MDL YES
33 Background-8 1 YES
MDL = 1 mg/L
Figure 4 Scour Test Background SSC
0.0
0.2
0.4
0.6
0.8
1.0
1.2
0 5 10 15 20 25 30 35
Sed
ime
nt
Co
nce
ntr
atio
n (
mg/
L)
Run Time (minutes)
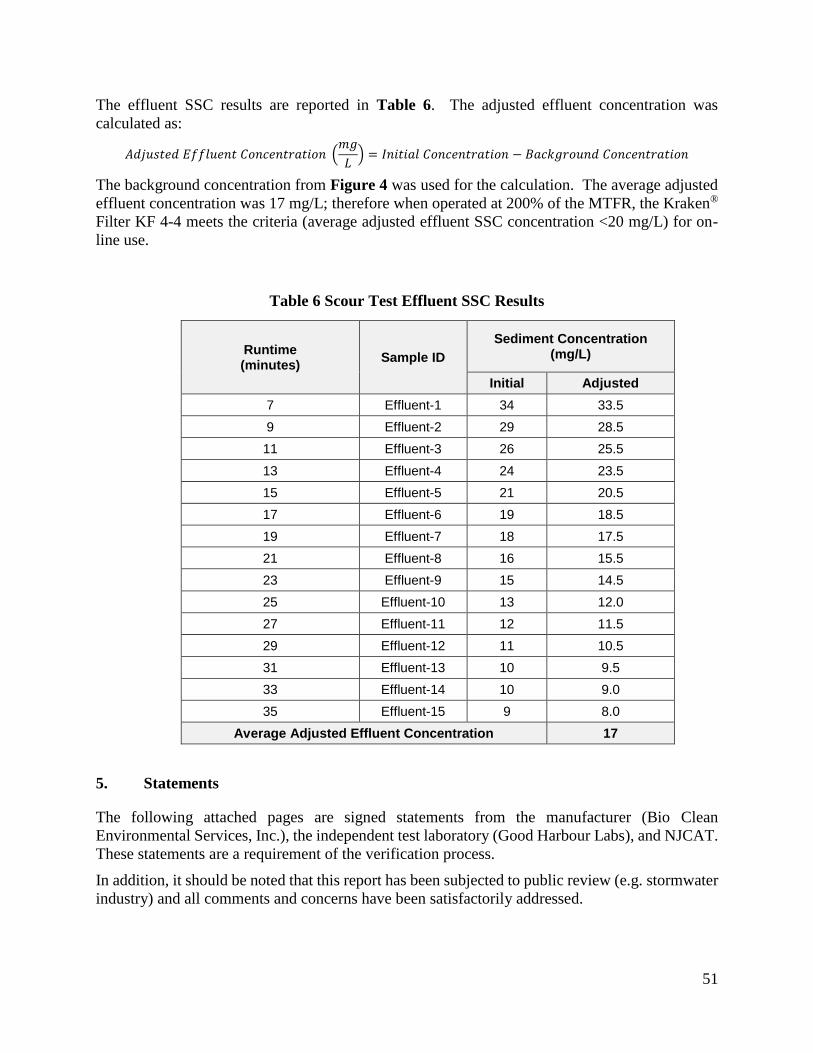
51
The effluent SSC results are reported in Table 6. The adjusted effluent concentration was
calculated as:
𝐴𝑑𝑗𝑢𝑠𝑡𝑒𝑑 𝐸𝑓𝑓𝑙𝑢𝑒𝑛𝑡 𝐶𝑜𝑛𝑐𝑒𝑛𝑡𝑟𝑎𝑡𝑖𝑜𝑛 (𝑚𝑔
𝐿) = 𝐼𝑛𝑖𝑡𝑖𝑎𝑙 𝐶𝑜𝑛𝑐𝑒𝑛𝑡𝑟𝑎𝑡𝑖𝑜𝑛 − 𝐵𝑎𝑐𝑘𝑔𝑟𝑜𝑢𝑛𝑑 𝐶𝑜𝑛𝑐𝑒𝑛𝑡𝑟𝑎𝑡𝑖𝑜𝑛
The background concentration from Figure 4 was used for the calculation. The average adjusted
effluent concentration was 17 mg/L; therefore when operated at 200% of the MTFR, the Kraken®
Filter KF 4-4 meets the criteria (average adjusted effluent SSC concentration <20 mg/L) for on-
line use.
Table 6 Scour Test Effluent SSC Results
Runtime (minutes)
Sample ID
Sediment Concentration (mg/L)
Initial Adjusted
7 Effluent-1 34 33.5
9 Effluent-2 29 28.5
11 Effluent-3 26 25.5
13 Effluent-4 24 23.5
15 Effluent-5 21 20.5
17 Effluent-6 19 18.5
19 Effluent-7 18 17.5
21 Effluent-8 16 15.5
23 Effluent-9 15 14.5
25 Effluent-10 13 12.0
27 Effluent-11 12 11.5
29 Effluent-12 11 10.5
31 Effluent-13 10 9.5
33 Effluent-14 10 9.0
35 Effluent-15 9 8.0
Average Adjusted Effluent Concentration 17
5. Statements
The following attached pages are signed statements from the manufacturer (Bio Clean
Environmental Services, Inc.), the independent test laboratory (Good Harbour Labs), and NJCAT.
These statements are a requirement of the verification process.
In addition, it should be noted that this report has been subjected to public review (e.g. stormwater
industry) and all comments and concerns have been satisfactorily addressed.
52
53
54
Center for Environmental Systems
Stevens Institute of Technology
Castle Point on Hudson
Hoboken, NJ 07030-0000
April 4, 2016
Titus Magnanao
NJDEP
Division of Water Quality
Bureau of Non-Point Pollution Control
401-02B
PO Box 420
Trenton, NJ 08625-0420
Dear Mr. Magnanao,
Based on my review, evaluation and assessment of the testing conducted on the Kraken®
Membrane Filtration System by Good Harbour Laboratories, an independent technology testing
laboratory, at their site in Mississauga, Ontario, Canada, the scour test protocol requirements
contained in the “New Jersey Department of Environmental Protection Laboratory Protocol to
Assess Total Suspended Solids Removal by a Filtration Manufactured Treatment Device” (NJDEP
Filter Protocol, January 2013) for on-line installation were met or exceeded. Specifically:
Scour Testing
Scour testing was conducted at 0.60 cfs (200% of the MTFR), the maximum flow rate that Bio
Clean Environmental Services intends to convey through the Kraken® Filter System, in order to
demonstrate the ability of the Kraken® Filter to be used as an on-line treatment device. Background
concentrations were ≤ 1 mg/L (the MDL) throughout the scour testing, which complies with the
20 mg/L maximum background concentration specified by the test protocol. Unadjusted effluent
concentrations ranged from 9 mg/L to 34 mg/L. When adjusted for background concentrations, the
effluent concentrations range from 8 to 33.5 mg/L with a mean of 17 mg/L, qualifying the Kraken®
Filter System for on-line installation up to 200% of the MTFR.
Sincerely,
Richard S. Magee, Sc.D., P.E., BCEE
55
6. References
[1] Good Harbour Laboratories, Notebook A012, pp. 3-4, 18-XX.