nmr derived solution structure of an ef-hand calcium-binding protein from entamoeba...
TRANSCRIPT

NMR Derived Solution Structure of an EF-Hand Calcium-Binding Protein fromEntamoeba Histolytica†
H. S. Atreya,‡ S. C. Sahu,‡ A. Bhattacharya,§ K. V. R. Chary,*,‡ and Girjesh Govil‡
Department of Chemical Sciences, Tata Institute of Fundamental Research, Mumbai-400005, India, and School of Life Sciences,Jawaharlal Nehru UniVersity, New Delhi-110067, India
ReceiVed July 18, 2001; ReVised Manuscript ReceiVed September 10, 2001
ABSTRACT: We present the three-dimensional (3D) solution structure of a calcium-binding protein fromEntamoeba histolytica(EhCaBP), an etiologic agent of amoebiasis affecting millions worldwide.EhCaBPis a 14.7 kDa (134 residues) monomeric protein thought to play a role in the pathogenesis of amoebiasis.The 3D structure of Ca2+-boundEhCaBP has been derived using multidimensional nuclear magneticresonance (NMR) spectroscopic techniques. The study reveals the presence of two globular domainsconnected by a flexible linker region spanning 8 amino acid residues. Each domain consists of a pair ofhelix-loop-helix motifs similar to the canonical EF-hand motif of calcium-binding proteins.EhCaBP bindsto four Ca2+ with high affinity (two in each domain), and it is structurally related to calmodulin (CaM)and troponin C (TnC) despite its low sequence homology (∼29%) with these proteins. NMR-derivedstructures ofEhCaBP converge within each domain with low RMSDs and angular order-parameters forbackbone torsion angles close to 1.0. However, the presence of a highly flexible central linker regionresults in an ill-defined orientation of the two domains relative to one other. These findings are supportedby backbone15N relaxation rate measurements and deuterium exchange studies, which reveal low structuralorder parameters for residues in the central linker region. Earlier, biochemical studies showed thatEhCaBPis involved in a novel signal transduction mechanism, distinct from CaM. A possible reason for such afunctional diversity is revealed by a detailed comparison of the 3D structure ofEhCaBP with that of CaMand TnC. The studies indicate a more open C-terminal domain forEhCaBP with larger water exposedtotal hydrophobic surface area as compared to CaM and TnC. Further dissimilarities between the structuresinclude the presence of two Gly residues (G63 and G67) in the central linker region ofEhCaBP, whichseem to impart it a greater flexibility compared to CaM and TnC and also play crucial role in its biologicalfunction. Thus, unlike in CaM and TnC, wherein the length and/or composition of the central linker havebeen found to be crucial for their function, inEhCaBP, both flexibility as well as amino acid compositionis required for the function of the protein.
Entamoeba histolytica, a protozoan parasite, is the caus-ative agent of amoebiasis and amoebic dysentry. It infectsnearly 50 million people worldwide, resulting in about40000-100000 deaths every year (1). Though ubiquitousin distribution, this parasite is more prevalent in tropical andsubtropical regions. It can invade extraintestinal tissues suchas liver and brain and result in the formation of abscesseswhich could be life threatening (1). Although the biology ofthe parasite has been studied extensively, the mechanismgoverning its pathogenesis remains unclear.E. histolyticagenerally does not invade, and it is not clear as to why onlya few infected individuals get invasive disease. A numberof studies suggest that calcium (Ca2+) may be involved inthe pathogenetic mechanisms of amoebiasis (2-4). Ravdinet al. (2) have observed a transient increase in Ca2+ levelsin the target cells during the process of cell killing. In anotherstudy, Carbajal et al. (4) have reported the effect of cytosolic
free Ca2+ on cell adhesion ofE. histolytica trophozoites.More recently, Meza (5) reviewed on various possiblesignaling pathways inE. histolyticaleading to pathogenesis.
To understand the mechanism by which Ca2+ effectsvirulence and also to elucidate the role of Ca2+-bindingproteins (hereafter abbreviated as CaBP) in host-parasiterelationships, a gene encoding a novel CaBP has beenisolated fromE. histolytica (EhCaBP) (6). A number ofexperiments on this protein suggests that it is involved in anovel signal transduction pathway involving cellular prolif-eration, distinct from the ubiquitous Ca2+ signal-transducingmolecule calmodulin (CaM) (7, 8). Further, analysis ofdifferent species ofEntamoebaindicates that this protein isnot present in nonpathogenic species, namely,EntamoebainVadensand Entamoeba moshkoVskii, thus suggesting itspossible role in the pathogenesis of amoebiasis (8).
EhCaBP is a 14.7 kDa (134 amino acid residues) mono-meric protein. An analysis of its primary sequence revealsthe presence of four Ca2+-binding sites (Scheme 1), similarto those observed in other EF-hand CaBPs (9, 10). Thespecific sites labeled as X, Y, Z,-Y, -X, -Z in Scheme 1,refer to 1st, 3rd, 5th, 7th, 9th, and 12th positions, respectively,
† A.B. gratefully acknowledges support from DST.* To whom the correspondence should be addressed. E-mail:
[email protected]. Fax: 0091-22-2152110.‡ Department of Chemical Sciences.§ School of Life Sciences.
14392 Biochemistry2001,40, 14392-14403
10.1021/bi0114978 CCC: $20.00 © 2001 American Chemical SocietyPublished on Web 11/08/2001
in the Ca2+-binding loops of the protein, which coordinateto Ca2+ in a pentagonal bipyramidal geometry (9).
Extensive analyses of molecular databases includinghuman genome show thatEhCaBP has a limited overallsequence similarity with known CaBPs. The maximumidentity at the amino acid level is 29% with calmodulins. Ingeneral, CaM belongs to a highly conserved protein familyshowing more than 65% sequence identity among members,irrespective of the species. Similarity in the protein sequencesof EhCaBP and CaM is restricted mainly to EF-hand Ca2+-binding loops (see Scheme 1) with a negligible similarity inthe functional central linker region.
As a prelude to the characterization of structure-functionrelationship inEhCaBP, we have initiated its NMR study insolution in the Ca2+-bound form. Backbone and side-chain1H, 13C, and15N NMR assignments and secondary structurecharacterization of this protein have been reported earlier(11-13). These studies reveal that, despite its low overallsequence homology, the structural topology of the proteinresembles that of intracellular CaBPs such as CaM (14-17)and troponin C (TnC) (18-21), in terms of two globulardomains (the N-terminal and the C-terminal) with a pair ofEF-hands each and connected by a flexible linker region.Despite such marked structural similarities, these proteinshave evolved to be functionally diverse (7, 8). Thus, subtleand important differences in structural properties may existbetweenEhCaBP and CaM/TnC, which may provide cluesto its function.
Unlike CaM and TnC, which have been extensivelystudied using X-ray crystallography,EhCaBP crystals yieldedpoor X-ray diffraction limiting the resolution to 3.5 Å andthereby eluding a good crystal structure (22). This has beenattributed to the presence of highly flexible linker region inEhCaBP, connecting the two individual globular domains.In this paper, we present the complete 3D structure of theEhCaBP in solution as derived by NMR data. The structuralmorphology of the protein is compared with CaM and TnCin order to highlight the similarities and differences, whichexist between these proteins.
MATERIALS AND METHODS
Sample Preparation. EhCaBP was overexpressed inEs-cherichia coli BL21(DE3) strain containing a pET-3cexpression system. Unlabeled, isotopically13C or15N labeled,doubly labeled (both13C and15N), and amino acid selectivelyunlabeled-13C fractionally (10%) labeledEhCaBP, werepurified using the protocol described earlier (11, 12, 23).NMR experiments were performed at 35°C on 0.6 mL of 3mM protein samples in 30 mM CaCl2 and 50 mM deuteratedTris buffer (pH 6.0), either in 99.9%2H2O or in a mixedsolvent of 90% H2O and 10% 2H2O.
NMR Experiments.NMR experiments were carried out ona Varian Unity+ 600 MHz NMR spectrometer equipped withpulsed field gradient unit and triple resonance probe withactively shieldedZ-gradients, operating at a1H frequencyof 600.051 MHz.
The two-dimensional (2D) experiments with unlabeledEhCaBP in2H2O include two quantum-filtered correlationspectroscopy (2QF-COSY) (24), three quantum-filteredcorrelation spectroscopy (3QF-COSY) (25), clean totalcorrelation spectroscopy (clean-TOCSY) (26) with a mixingtime (τm) of 80 ms and NOESY (27) with a τm of 100 ms.Spectra in 90% H2O + 10% 2H2O include WGRAF-NOESY (28) with a τm of 100 ms and clean-TOCSY with aτm of 100 ms.
Experiments with uniformly15N-labeled or13C-labeledEhCaBP include sensitivity enhanced 2D (15N-1H) HSQCand 2D (13C-1H) HSQC (29) in both constant time andnonconstant time options, 3D TOCSY-(13C/15N-1H)-HSQC(τm ) 80 ms) (30), 3D NOESY-(13C/15N-1H)-HSQC(τm ) 100 ms) (31) and 3D HNHA (32). Further, using thedoubly labeledEhCaBP, the following 3D triple resonanceexperiments were recorded: HNCA (33), HN(CO)CA (34),HNCO (35), CBCANH (36), CBCA(CO)NH (37), and HN-(CA)CO (38). Data transformation and processing were doneon a Silicon Graphics workstation (R10000 based Indigo IISolid Impact Graphics) using the Felix 97 software (MSI).1H chemical shifts were calibrated relative to 2,2-dimethyl-2-silapentane-5-sulfonate (DSS) at 308 K (0.0 ppm).13Cchemical shifts were calibrated indirectly relative to DSS.15N chemical shifts were calibrated with respect to an externalstandard of15NH4Cl (2.9 M in 1 M HCl).
Distance Constraints for Structure Calculations: (a) nOe-DeriVed Distance Constraints.Cross-peaks from 3D (1H-1H) NOESY-(15N-1H)-HSQC and 2D1H NOESY spectrawere integrated for obtaining distance restraints. The calibra-tion of cross-peaks were done using the CALIBA macro ofDYANA ( 39) with the minimum distance set to 2.4 Å andthe maximum distance set to 6.0 Å. For cross-peaks in theNOESY spectrum which could not be integrated accurately,distances were classified based on their intensities as 1.8-2.4 Å (strong), 1.8-3.5 Å (medium), 1.8-5.0 Å (weak), or1.8-6.0 Å (very weak). Hydrogen bond constraints wereadded only for residues which were involved in either aR-helix or a â-sheet as characterized by chemical shiftindices, 3J(HN-HR) values and deuterium exchange rates(12). A lower limit of 2.0 Å was used for H-O distance inall the hydrogen bonds. Stereospecific assignments ofprochiral methyl groups of Val and Leu residues wereobtained using selectively unlabeled-13C fractionally labeledsamples as described in ref23. Standard pseudo-atom
Scheme 1
Structure of aE. histolyticaCa2+-Binding Protein Biochemistry, Vol. 40, No. 48, 200114393

distance corrections were incorporated to account for centeraveraging (40) for all methyl protons and nonstereospecifi-cally assigned methylene protons. A total of 1265 distanceconstraints (with an average of about 10/residue) were usedfor structure calculations, which include 430 intraresidue,389 interresidue (sequential), 335 medium range, and 111long-range distance constraints. Only intraresidue and se-quential nOes were observed for residues belonging to thelinker region, while a few short-range nOes were seen forresidues in segments joining the two EF-hands in a domain.The number of distance constraints used in the structurecalculation for each amino acid residue is shown in Figure1a. The N-terminal M1, A2, and E3 residues do not showup correlations in any of the 2D and 3D NMR spectra. Theseresidues were therefore excluded from structure calculations.
(b) Ca2+-Ligand Distance Constraints.Though Ca2+ ionswere not included in the initial stages of structure calcula-tions, they were incorporated in the final stages of structurerefinement. These were based on two independent experi-mental observations of substantial downfield shifts of (i)1HNspins belonging to the individual Gly residues at the sixthposition in each of the four Ca2+-binding loops, namely, G15,G51, G90, and G122 (at 10.34, 10.75, 10.51, and 9.92 ppm,respectively), and (ii) backbone15N spins belonging to theindividual hydrophobic residues at the eighth position in eachof the four Ca2+-binding loops, namely, V17, I53, L92, andI124 (at 127.8, 130.6, 128.7, and 128.1 ppm, respectively).The downfield shift observed for Gly residues is due to thehydrogen bonding of their HN with one of the two side-chain oxygens of an invariant Asp at the first position in theCa2+-binding loop (41), and those observed for residues atthe eighth position in the loop are due to the coordinationof backbone C′ of its previous residue to Ca2+ (42). Thus,
these downfield shifts serve as signatures of Ca2+ bindingto all the four sites in the protein.
The ligands chosen for Ca2+ coordination included residuesat positions X, Y, Z,-Y, and -Z in the respective Ca2+-binding loops (Scheme 1) (9). The bridging water molecule,hydrogen bonding with side-chain oxygen atoms of residuesat Y and-X position and simultaneously coordinating toCa2+, was not included in the structure calculations. If theresidue at position 1, 3, or 5 in the loop happened to be anAsp, then the distance between its Cγ and Ca2+ wasrestrained to an upper limit of 4.0 Å. This is because onlyone of the side-chain carboxyl oxygen coordinates to Ca2+.On the other hand, if the residue at these positions happenedto be an Asn, a direct upper limit O-Ca2+ distance constraintof 2.8 Å was used. Similarly, for residues at positions 7 and12 in the loop, which coordinate to Ca2+ directly via theirbackbone C′ and both the side-chain carboxyl oxygens,respectively, an O-Ca2+ distance constraint of 2.8 Å wasused. Thus, a total of six Ca2+-ligand distance constraintsper Ca2+-binding loop were incorporated, with the lowerbound set to 2.0 Å in all cases.
Torsion Angle Constraints.Torsion angle restraints forφangles were derived from3J(HN-HR) values measured in3D HNHA experiment (32). Coupling constants thus ob-tained for different amino acid residues are given in Figure1b. For residues which were characterized by1H, 13CR, and13C′ chemical shift indices (CSI) as belonging to aR-helixand showed a3J(HN-HR) < 5 Hz, φ was restrained to-60( 30° (R-helix). On the other hand, residues which weresimultaneously characterized by the same CSI as belongingto â-sheet structure and which showed3J(HN-HR) > 7 Hz,φ was restrained to-120( 30° (â-sheet). Backboneψ angleconstraints were included only for those residues within aregular R-helical (-45 ( 30°) or â-sheet (135( 30°)conformation. A total of 200φ and ψ torsion angleconstraints were used in structure calculations with 176constraints for residues in variousR-helices and 24 con-straints for residues inâ-sheets.
Structure Calculations.Structure calculations were per-formed using the program DYANA (39). The standardsimulated annealing protocol was used with 10 000 torsionangle dynamics (TAD) steps. Each round of structurecalculations started with 200 randomized conformers. Outof all the energy-minimized calculated structures, 20 struc-tures with the lowest residual target function values werechosen for analysis. All atom pairwise-RMSDs were com-puted using DYANA and MOLMOL (43). The quality ofthese structures was analyzed using PROCHECK (44). Thecorresponding PDB files for an ensemble of 20 structures(PDB code: 1JFJ) and a representative structure ofEhCaBP(PDB code: 1JFK) have been deposited.
Backbone Dynamics Studies.Backbone dynamics ofEhCaBP was studied using15N relaxation data (R1, R2, andnOe) obtained from 2D [15N-1H] NMR spectroscopy (45-47). The relaxation data were analyzed using the model freeapproach (48). Models of spectral density functions wereselected for each residue using the procedure described byMandel et al. (49), for both isotropic and axially symmetricdiffusion tensors. They are essentiallyS2-τm, S2-τm-τe,S2-τm-Rex, S2-τm-τe-Rex, and a two-time scale model(50), whereτm is the global correlation time of the molecule,S2 represents the N-H bond order parameter,τe is the
FIGURE 1: (a) Number of nOes for each amino acid residue usedin 3D structure calculation ofEhCaBP, plotted as a function of theresidue number (shown for residues 4-134). (b) Values of HN-HR coupling constants inEhCaBP obtained using the 3D HNHAexperiment, as a function of residue number. Vertical bars indicatevalues for only those residues for which coupling constants couldbe measured unambiguously.
14394 Biochemistry, Vol. 40, No. 48, 2001 Atreya et al.
effective correlation time for internal motions andRex refersto the conformational exchange rate constant. In the firststage, the best model for individual residue was selected byfitting the experimental data to different models separately.In such a selection, the criterion has always been a modelthat required a minimum number of parameters to fit theexperimental data. After selection of the best model,τm wasoptimized along with other model parameters using the gridsearch method (49). The individual optimizations involvedthe minimization ofø2 function using the program Modelfree(4.01) (49).
To ascertain whether relaxation data fitted usingRex termsarise from rotational diffusion anisotropy or conformationalexchange, a model incorporating anisotropic diffusion wastested forEhCaBP in a fashion similar to the one describedby Tjandra et al. (51). In such calculations, all residues whicheither have large amplitude internal motions or potentiallyundergoing conformational exchange, were excluded. Theformer was identified by their respective low values of nOe(<0.6) while the latter were identified using the followingcondition (51):
where SD is the standard deviation of the left-hand side ofthe expression. The data were then fitted to two models ofthe diffusion tensor, namely, isotropic and axially symmetric.In such calculations, the following error function wasoptimized to obtain anisotropic diffusion parameters (51):
where σT1/T2 is the estimated error in the experimentallyderived T1/T2 ratio, and the summation extends over allresidues used in the fit. The program, R2R1_1.11 availablein Prof. A. G. Palmer’s laboratory was used for thesecalculations. Further, the significance of reduction in the errorfunction was evaluated using a statisticalF-test (52), to assesswhether the fit occurred by chance with the inclusion ofanisotropic diffusion.
RESULTS
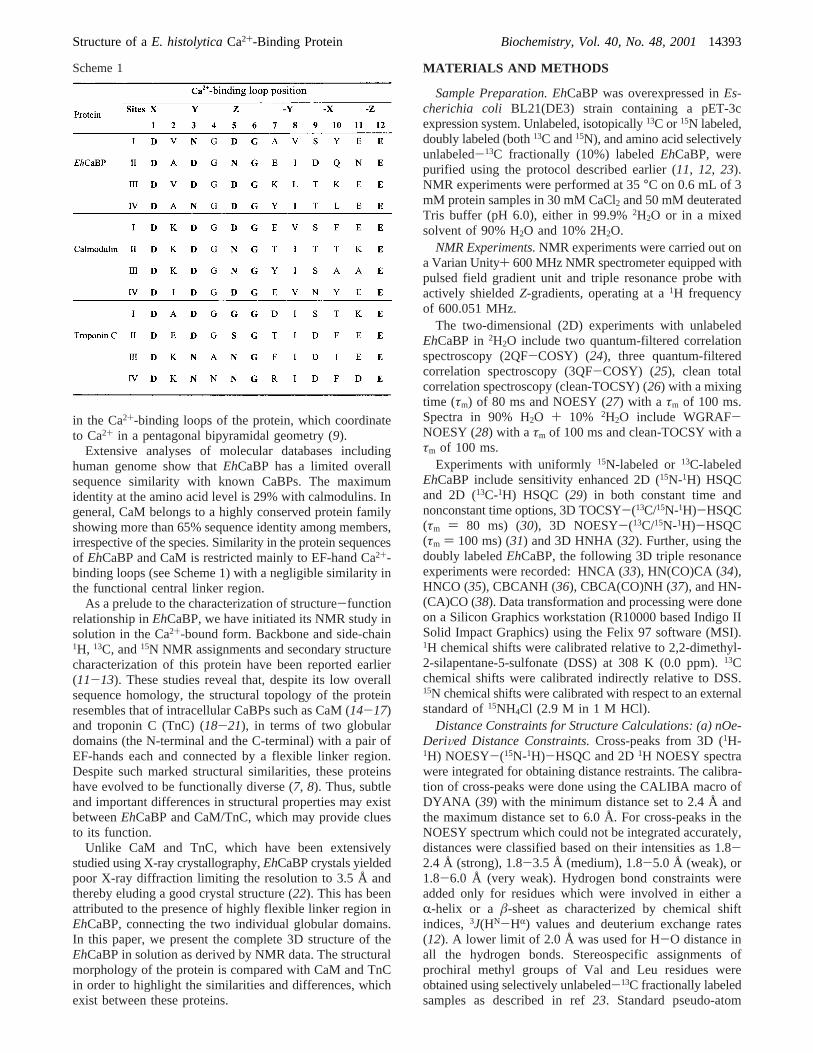
Quality of EhCaBP Structures.A superposition of 20NMR-derived minimum energy conformers ofEhCaBP isshown in Figure 2. Figure 2a shows the superposition of thestructures when aligned with respect to the N-terminal
FIGURE 2: (a) Superposition of the 20 energy-minimized conformers ofEhCaBP as aligned with respect to the N-terminal domain (residues4-62). Only backbone atoms are shown. (b) Superposition of the energy-minimized conformers ofEhCaBP aligned with respect to theC-terminal domain (residues 71-134). Only backbone atoms are shown. (c) Superposition of the N-terminal domain of the energy-minimizedconformers ofEhCaBP (residues 4-62). (d) Superposition of the C-terminal domain of the energy-minimized conformers ofEhCaBP(residues 71-134).
(⟨T2⟩ - T2,n)/⟨T2⟩ - (⟨T1⟩ - T1,n)/⟨T1⟩ > 1.5× SD
E ) ∑n
(T1,e/T2,e - T1,c/T2,c)2/σT1/T2
2
Structure of aE. histolyticaCa2+-Binding Protein Biochemistry, Vol. 40, No. 48, 200114395
domain (residues 4-62), while Figure 2b shows the super-position of structures aligned with respect to the C-terminaldomain (residues 71-134). Structural statistics for the familyof 20 EhCaBP structures is presented in Table 1. Although,each domain exhibits structural heterogeneity when alignedwith respect to the latter (Figure 2a and 2b), residues withineach domain converge with low RMSDs (Table 1). This isdepicted in Figures 2c and 2d, which show the superpositionof the 20 conformers of individual N- and C-terminaldomains (residues 4-62 and 71-134). Further, as shownbelow using relaxation data, the central linker region(residues 63-70) exhibits high structural flexibility (in asubnanosecond time scale) giving rise to spatial heterogeneityof the two domains about this region. Poor convergence ofstructures in this region is thus attributed to a small numberof nOes observed for these residues due to conformationalaveraging. A lack of secondary structure in this region isalso reflected in1HR, 13CR, and13C′ chemical shift indices(12). On the other hand, it is seen that NMR structures withina given domain show good convergence and covalentgeometry with a well-defined secondary structure. In all the20 structures, the absolute mean deviation ofø1 angles is20°, while the absolute deviation ofω angles from the meanremained below 0.2°. Further, individual EF-hands within agiven domain show higher convergence when compared tothe domain as a whole, as indicated by their low RMSDfrom the mean (Table 1). This is attributed to be due tosegments connecting the two individual EF-hands within eachdomain (residues 30-34 in N-terminal domain and 103-107 in C-terminal domain), which show slightly higherdisorder than the rest of the polypeptide. These inter-EF-hand loop regions also undergo higher mobility as comparedto the other structurally ordered segments in the protein (seebelow). Even in the Ramachandran plot of 20 structures(statistics shown in Table 1), residues that were observed in
the disallowed regions (0.2% in total) belonged mostly toeither the linker region or to the segments connecting thetwo EF-hands in individual domains. In very few cases(0.05%), residues belonging to the Ca2+-binding loops wereseen in the disallowed regions.
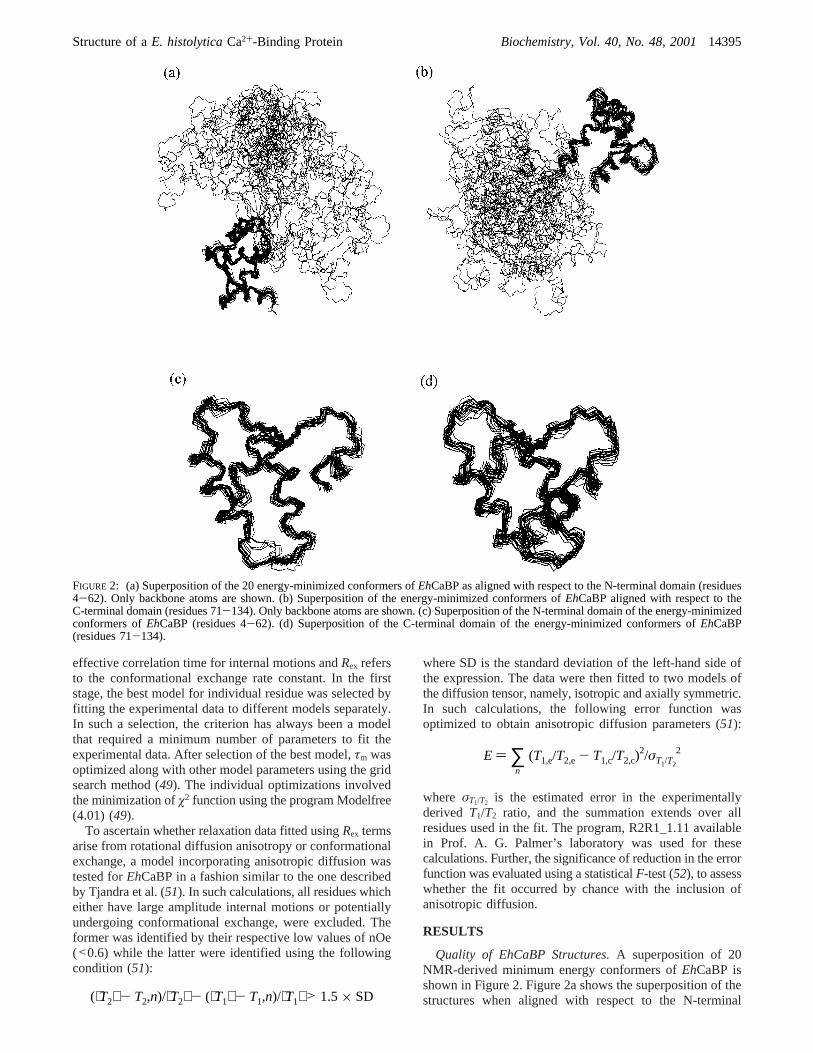
The family of EhCaBP conformers was further analyzedwith respect to angular order parameters forφ andψ torsionangles using the method of Hyberts et al. (53). This is plottedin Figure 3a and 3b, as a function of residue number. Theorder parameter is related to the standard deviation of torsionangles in a logarithmic manner and a value close to 1.0indicates a good convergence (53). As evident from Figure3, EhCaBP structures exhibit good convergence (except forresidues 63-70) in terms of backbone torsion angles withmean values of 0.95( 0.12 and 0.96( 0.13 forφ andψtorsion angular order parameters, respectively. Residues 63-70, which form an extended linker region, show poorconvergence. Other residues, which show low angular orderparameters, are the ones belonging to inter-EF-hand loopregions and a few residues in the Ca2+-binding loops.
The interhelix angle between two helices within individualEF-hands was computed using MOLMOL and is shown inFigure 3c for all the individual structures. As evident fromthis figure, the interhelical angles are conserved in all thestructures with an average (over 20 conformers) of 115(3.75° for EF-hand I, 120( 4.2° for EF-hand II, 96( 4.8°for EF-hand III, and 93( 6.0° for EF-hand IV. Theseanalyses reveal that, in its Ca2+-bound state, the C-terminaldomain of EhCaBP shows a more open conformationcompared to the N-terminal domain, as evidenced from theinterhelical angles. Further, to see the effect of this open
Table 1: Structural Parameter Statistics for the 20Energy-Minimized Conformers ofEhCaBP Calculated UsingDYANA a
(1) DYANA parametersavg target function (Å2) 0.51( 0.08
upper limit violationsconstraints violated in more than 1 structure 0sum of violations (Å) 4.7( 0.5
dihedral angle violationsconstraints violated in more than 1 structure 0sum of violations (deg) 0.3( 0.1
van der Waals violationsnumber> 0.2 Å 0sum of violations (Å) 1.3( 0.3
(2) RMSD values (Å)N-terminal domain
residues 4-62 0.68( 0.20EF-hand 1 (residues 4-29) 0.54( 0.18EF-hand 2 (residues 35-62) 0.59( 0.14
C-terminal domainresidues 71-134 0.73( 0.19EF-hand 3 (residues 71-102) 0.55( 0.18EF-hand 4 (residues 107-134) 0.60( 0.20
(3) Ramachandran plot statisticsresidues in most favorable regions (%) 82.2residues in allowed regions (%) 16.4residues in generously allowed regions (%) 1.2residues in disallowed regions (%) 0.2a RMSDs were evaluated using MOLMOL and statistics for the
Ramachandran plot were obtained using PROCHECK. FIGURE 3: (a) Backboneφ and (b) ψ torsion angular order-parameters for the 20 structures ofEhCaBP as a function of residuenumber. (b) Interhelical angle within an EF-hand in the N- andC-terminal domains ofEhCaBP plotted for the energy-minimizedstructures. (c) Ca2+-Ca2+ distance in the N- and C-terminal domainof EhCaBP plotted for the energy-minimized structures.
14396 Biochemistry, Vol. 40, No. 48, 2001 Atreya et al.
structure on Ca2+-Ca2+ distances in both the domains, inter-Ca2+ distance in each domain was computed for all the 20structures and shown in Figure 3d. The Ca2+-Ca2+ distanceis conserved in all these structures with an average value of12.6 ( 0.3 Å in N-terminal domain and 13.2( 0.28 Å inthe C-terminal domain. A longer Ca2+-Ca2+ distance in theC-terminal domain as compared to the N-terminal domaincan be attributed to a more open structure of the former.
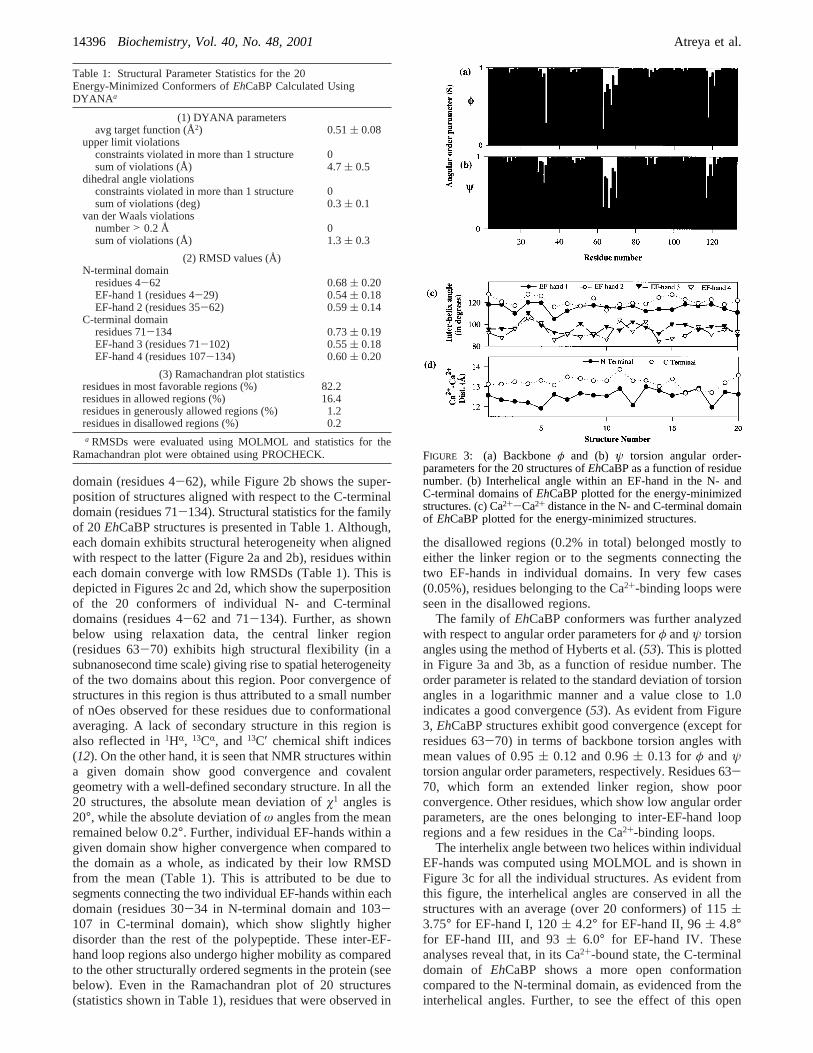
Description of the Structure.A minimum energy structureof EhCaBP, having the least residual target function valueamong the 20 conformers was chosen as a representativestructure and is shown in Figure 4a. A topology diagram ofthe same molecule is shown in Figure 4b, depicting thevarious secondary structure elements in the protein. Thestructure of EhCaBP reveals two globular domains (N-terminal and C-terminal), each containing a pair of canonicalEF-hands. The two domains are connected by an eight aminoacid residue linker, which lacks a secondary structure.
(a) EF-Hands.Each of the four EF-hands inEhCaBPconsists of two amphipathic helices flanking the Ca2+-bindingloop in a typical helix-loop-helix motif (9, 10). There are inall, eightR-helices [residues A4-I9 (R1), Y19-K28 (R2),E35-A45 (R3), Q55-Y62 (R4), D71-M84 (R5), E94-K102 (R6), E107-A116 (R7), L126-L134 (R8)] and fourantiparallelâ-strand segments, each formed by three aminoacid residues [V16-S18 (â1), E52-D54 (â2), K91-T93(â3), and Y123-T125 (â4)]. HelicesR1 andR2 form thefirst EF-hand in the N-terminal domain followed by helices
R3 andR4 forming the second EF-hand. In the C-terminaldomain, the two respective EF-hands are formed by helicesR5 andR6 andR7 andR8 (Figure 4b). AllR-helices andâ-strands were characterized by characteristic nOe patterns,3J(HN-HR) values and deuterium exchange studies (12).
(b) Ca2+-Binding Loops.The four Ca2+-binding loops inEhCaBP, as evidenced from sequence homology (Scheme1) and supported by NMR data consist of 12 contiguousresidues with an invariant Asp, Gly, and Glu at the 1st, 6th,and the 12th positions, respectively. Residues D10-E21 andD46-E57 form Ca2+-binding loops in the N-terminaldomain, while those belonging to the C-terminal domain areformed by residues D85-E96 and D117-E128.
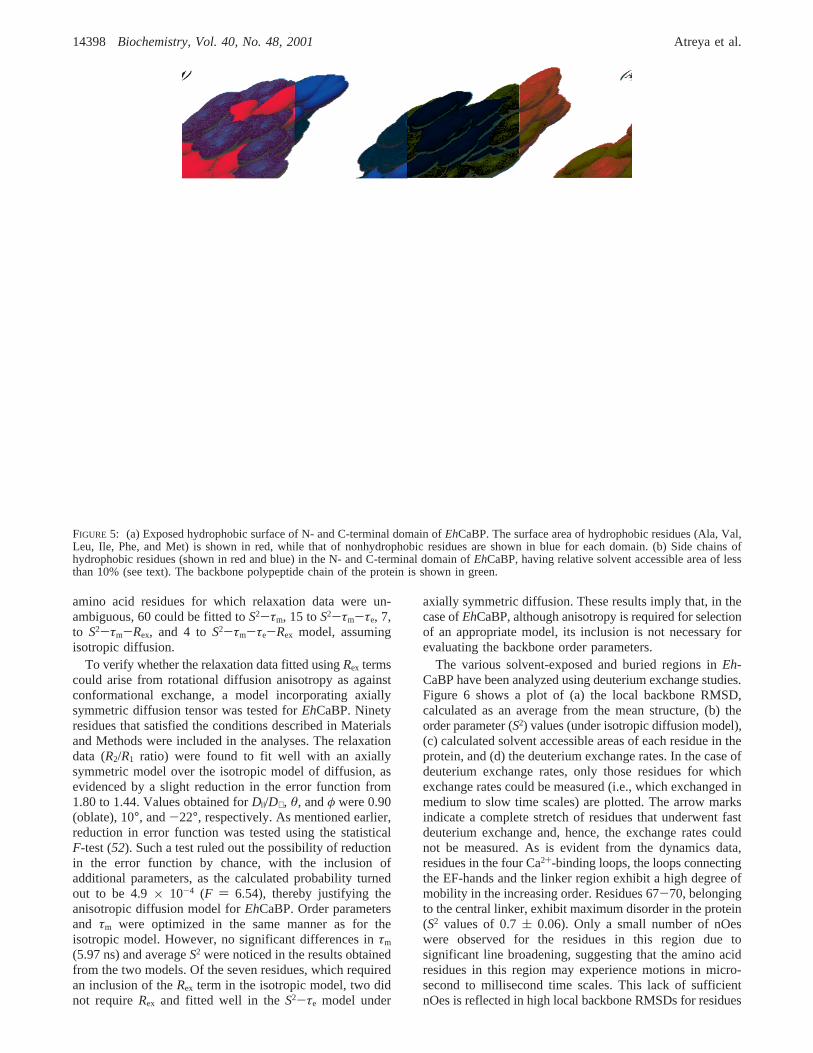
(c) Hydrophobic Pockets in the Protein.Figure 5a il-lustrates the hydrophobic surface area of the N- andC-terminal domains (residues 4-62 and 71-134, respec-tively) in EhCaBP. The hydrophobic residues shown (in red)are Ala, Val, Leu, Ile, Met, and Phe. The solvent (water)exposed surface area was computed using the software,NACCESS (54). Using this software, relative solvent exposedsurface area of each residue is calculated as percentageaccessibility compared to the accessibility of that residue typein an extended ALA-X-ALA tripeptide (55). Relative ac-cessibility helps in evaluating the extent of accessible surfacearea of a given residue type in different regions of the protein.Thus, the C-terminal domain, which shows a more openconformation in EhCaBP exhibits a slightly higher ex-posed hydrophobic surface of 37.3% (total solvent accessiblearea) 1483 Å) compared to 33% (total solvent accessiblearea) 1264 Å2) in the N-terminal domain. The number ofhydrophobic residues in N-terminal and C-terminal domainsis 26 and 24, respectively.
Hydrophobic pockets in the protein were characterizedbased on nOes observed between apolar residues. Residues,which formed the hydrophobic cluster with a relative solventaccessible area of less than 10%, are shown in Figure 5b forthe two domains. The core of the hydrophobic pocket arisesmainly from residues in the amphipathic helices of the EF-hands. Phe residues at 6, 25, 42, 58, and 61 comprise theburied aromatic residues in the N-terminal domain, whilethose in the C-terminal domain are comprised of Phe residuesat 101, 129, and Tyr 81 (Figure 7b). The other Phe residuesin the C-terminal domain are relatively exposed to solventwith a relative solvent accessible surface area of 32% (F100)and 58% (F130). Other hydrophobic residues which havemore than 30% of their surface area accessible to solventinclude A2, L5, V11, A16, A24, A31, I32, L37, L40, A47,and A59 in the N-terminal domain and L77, V79, L80, L83,M84, V86, I106, and A110 in the C-terminal domain. Thereare few polar residues, mainly belonging to the Ca2+-bindingloops, that are also buried away from solvent.
Dynamic Properties of EhCaBP.The different flexible andrigid structural elements in the protein have been analyzedusing the backbone15N relaxation data, following theprocedure outlined in the Materials and Methods. Orderparameters (S2) reflect the mobility of individual N-H bondvectors on the nanosecond to picosecond time scales (48).An estimate forτc of 5.95 ns was obtained fromR2/R1 ratiousing an isotropic diffusion model. The averageS2 value forresidues 10-62 (belonging to the N-terminal domain) isfound to be 0.89( 0.07, while it is 0.88( 0.05 for resi-dues 71-134 (belonging to the C-terminal domain). Of 112
FIGURE 4: (a) A representative structure ofEhCaBP having theleast residual target function value among the 20 conformersgenerated using DYANA. Residues 4-134 are shown in the figure.Ca2+ atoms in the structure are shown in gray. (b) A topologydiagram of the same molecule (panel a), depicting the varioussecondary structure elements in the protein. Start and end residuenumbers inR-helices (brown) andâ-sheet (blue) structures alongthe polypeptide chain of the protein are indicated, along with thenumbering of EF-hands.
Structure of aE. histolyticaCa2+-Binding Protein Biochemistry, Vol. 40, No. 48, 200114397
amino acid residues for which relaxation data were un-ambiguous, 60 could be fitted toS2-τm, 15 toS2-τm-τe, 7,to S2-τm-Rex, and 4 toS2-τm-τe-Rex model, assumingisotropic diffusion.
To verify whether the relaxation data fitted usingRex termscould arise from rotational diffusion anisotropy as againstconformational exchange, a model incorporating axiallysymmetric diffusion tensor was tested forEhCaBP. Ninetyresidues that satisfied the conditions described in Materialsand Methods were included in the analyses. The relaxationdata (R2/R1 ratio) were found to fit well with an axiallysymmetric model over the isotropic model of diffusion, asevidenced by a slight reduction in the error function from1.80 to 1.44. Values obtained forD|/D⊥, θ, andφ were 0.90(oblate), 10°, and-22°, respectively. As mentioned earlier,reduction in error function was tested using the statisticalF-test (52). Such a test ruled out the possibility of reductionin the error function by chance, with the inclusion ofadditional parameters, as the calculated probability turnedout to be 4.9× 10⁻⁴ (F ) 6.54), thereby justifying theanisotropic diffusion model forEhCaBP. Order parametersand τm were optimized in the same manner as for theisotropic model. However, no significant differences inτm
(5.97 ns) and averageS2 were noticed in the results obtainedfrom the two models. Of the seven residues, which requiredan inclusion of theRex term in the isotropic model, two didnot requireRex and fitted well in theS2-τe model under
axially symmetric diffusion. These results imply that, in thecase ofEhCaBP, although anisotropy is required for selectionof an appropriate model, its inclusion is not necessary forevaluating the backbone order parameters.
The various solvent-exposed and buried regions inEh-CaBP have been analyzed using deuterium exchange studies.Figure 6 shows a plot of (a) the local backbone RMSD,calculated as an average from the mean structure, (b) theorder parameter (S2) values (under isotropic diffusion model),(c) calculated solvent accessible areas of each residue in theprotein, and (d) the deuterium exchange rates. In the case ofdeuterium exchange rates, only those residues for whichexchange rates could be measured (i.e., which exchanged inmedium to slow time scales) are plotted. The arrow marksindicate a complete stretch of residues that underwent fastdeuterium exchange and, hence, the exchange rates couldnot be measured. As is evident from the dynamics data,residues in the four Ca2+-binding loops, the loops connectingthe EF-hands and the linker region exhibit a high degree ofmobility in the increasing order. Residues 67-70, belongingto the central linker, exhibit maximum disorder in the protein(S2 values of 0.7( 0.06). Only a small number of nOeswere observed for the residues in this region due tosignificant line broadening, suggesting that the amino acidresidues in this region may experience motions in micro-second to millisecond time scales. This lack of sufficientnOes is reflected in high local backbone RMSDs for residues
FIGURE 5: (a) Exposed hydrophobic surface of N- and C-terminal domain ofEhCaBP. The surface area of hydrophobic residues (Ala, Val,Leu, Ile, Phe, and Met) is shown in red, while that of nonhydrophobic residues are shown in blue for each domain. (b) Side chains ofhydrophobic residues (shown in red and blue) in the N- and C-terminal domain ofEhCaBP, having relative solvent accessible area of lessthan 10% (see text). The backbone polypeptide chain of the protein is shown in green.
14398 Biochemistry, Vol. 40, No. 48, 2001 Atreya et al.
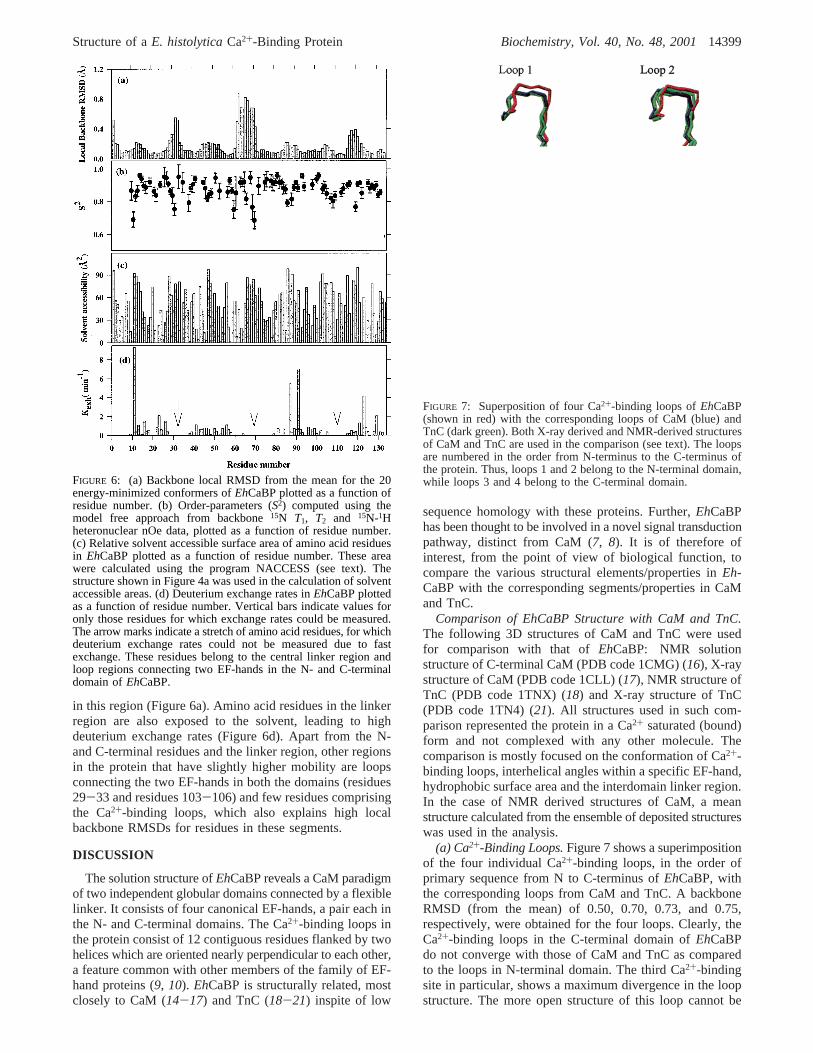
in this region (Figure 6a). Amino acid residues in the linkerregion are also exposed to the solvent, leading to highdeuterium exchange rates (Figure 6d). Apart from the N-and C-terminal residues and the linker region, other regionsin the protein that have slightly higher mobility are loopsconnecting the two EF-hands in both the domains (residues29-33 and residues 103-106) and few residues comprisingthe Ca2+-binding loops, which also explains high localbackbone RMSDs for residues in these segments.
DISCUSSION
The solution structure ofEhCaBP reveals a CaM paradigmof two independent globular domains connected by a flexiblelinker. It consists of four canonical EF-hands, a pair each inthe N- and C-terminal domains. The Ca2+-binding loops inthe protein consist of 12 contiguous residues flanked by twohelices which are oriented nearly perpendicular to each other,a feature common with other members of the family of EF-hand proteins (9, 10). EhCaBP is structurally related, mostclosely to CaM (14-17) and TnC (18-21) inspite of low
sequence homology with these proteins. Further,EhCaBPhas been thought to be involved in a novel signal transductionpathway, distinct from CaM (7, 8). It is of therefore ofinterest, from the point of view of biological function, tocompare the various structural elements/properties inEh-CaBP with the corresponding segments/properties in CaMand TnC.
Comparison of EhCaBP Structure with CaM and TnC.The following 3D structures of CaM and TnC were usedfor comparison with that ofEhCaBP: NMR solutionstructure of C-terminal CaM (PDB code 1CMG) (16), X-raystructure of CaM (PDB code 1CLL) (17), NMR structure ofTnC (PDB code 1TNX) (18) and X-ray structure of TnC(PDB code 1TN4) (21). All structures used in such com-parison represented the protein in a Ca2+ saturated (bound)form and not complexed with any other molecule. Thecomparison is mostly focused on the conformation of Ca2+-binding loops, interhelical angles within a specific EF-hand,hydrophobic surface area and the interdomain linker region.In the case of NMR derived structures of CaM, a meanstructure calculated from the ensemble of deposited structureswas used in the analysis.
(a) Ca2+-Binding Loops.Figure 7 shows a superimpositionof the four individual Ca2+-binding loops, in the order ofprimary sequence from N to C-terminus ofEhCaBP, withthe corresponding loops from CaM and TnC. A backboneRMSD (from the mean) of 0.50, 0.70, 0.73, and 0.75,respectively, were obtained for the four loops. Clearly, theCa2+-binding loops in the C-terminal domain ofEhCaBPdo not converge with those of CaM and TnC as comparedto the loops in N-terminal domain. The third Ca2+-bindingsite in particular, shows a maximum divergence in the loopstructure. The more open structure of this loop cannot be
FIGURE 6: (a) Backbone local RMSD from the mean for the 20energy-minimized conformers ofEhCaBP plotted as a function ofresidue number. (b) Order-parameters (S2) computed using themodel free approach from backbone15N T1, T2 and 15N-1Hheteronuclear nOe data, plotted as a function of residue number.(c) Relative solvent accessible surface area of amino acid residuesin EhCaBP plotted as a function of residue number. These areawere calculated using the program NACCESS (see text). Thestructure shown in Figure 4a was used in the calculation of solventaccessible areas. (d) Deuterium exchange rates inEhCaBP plottedas a function of residue number. Vertical bars indicate values foronly those residues for which exchange rates could be measured.The arrow marks indicate a stretch of amino acid residues, for whichdeuterium exchange rates could not be measured due to fastexchange. These residues belong to the central linker region andloop regions connecting two EF-hands in the N- and C-terminaldomain ofEhCaBP.
FIGURE 7: Superposition of four Ca2+-binding loops ofEhCaBP(shown in red) with the corresponding loops of CaM (blue) andTnC (dark green). Both X-ray derived and NMR-derived structuresof CaM and TnC are used in the comparison (see text). The loopsare numbered in the order from N-terminus to the C-terminus ofthe protein. Thus, loops 1 and 2 belong to the N-terminal domain,while loops 3 and 4 belong to the C-terminal domain.
Structure of aE. histolyticaCa2+-Binding Protein Biochemistry, Vol. 40, No. 48, 200114399
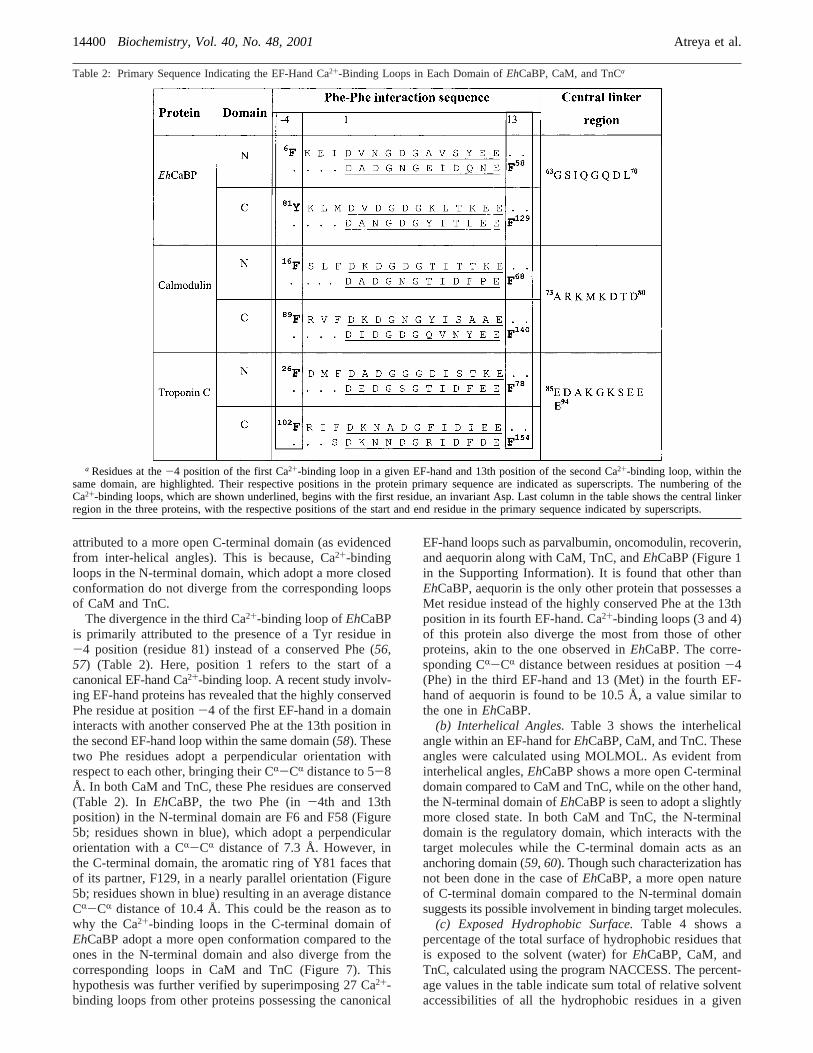
attributed to a more open C-terminal domain (as evidencedfrom inter-helical angles). This is because, Ca2+-bindingloops in the N-terminal domain, which adopt a more closedconformation do not diverge from the corresponding loopsof CaM and TnC.
The divergence in the third Ca2+-binding loop ofEhCaBPis primarily attributed to the presence of a Tyr residue in-4 position (residue 81) instead of a conserved Phe (56,57) (Table 2). Here, position 1 refers to the start of acanonical EF-hand Ca2+-binding loop. A recent study involv-ing EF-hand proteins has revealed that the highly conservedPhe residue at position-4 of the first EF-hand in a domaininteracts with another conserved Phe at the 13th position inthe second EF-hand loop within the same domain (58). Thesetwo Phe residues adopt a perpendicular orientation withrespect to each other, bringing their CR-CR distance to 5-8Å. In both CaM and TnC, these Phe residues are conserved(Table 2). In EhCaBP, the two Phe (in-4th and 13thposition) in the N-terminal domain are F6 and F58 (Figure5b; residues shown in blue), which adopt a perpendicularorientation with a CR-CR distance of 7.3 Å. However, inthe C-terminal domain, the aromatic ring of Y81 faces thatof its partner, F129, in a nearly parallel orientation (Figure5b; residues shown in blue) resulting in an average distanceCR-CR distance of 10.4 Å. This could be the reason as towhy the Ca2+-binding loops in the C-terminal domain ofEhCaBP adopt a more open conformation compared to theones in the N-terminal domain and also diverge from thecorresponding loops in CaM and TnC (Figure 7). Thishypothesis was further verified by superimposing 27 Ca2+-binding loops from other proteins possessing the canonical
EF-hand loops such as parvalbumin, oncomodulin, recoverin,and aequorin along with CaM, TnC, andEhCaBP (Figure 1in the Supporting Information). It is found that other thanEhCaBP, aequorin is the only other protein that possesses aMet residue instead of the highly conserved Phe at the 13thposition in its fourth EF-hand. Ca2+-binding loops (3 and 4)of this protein also diverge the most from those of otherproteins, akin to the one observed inEhCaBP. The corre-sponding CR-CR distance between residues at position-4(Phe) in the third EF-hand and 13 (Met) in the fourth EF-hand of aequorin is found to be 10.5 Å, a value similar tothe one inEhCaBP.
(b) Interhelical Angles.Table 3 shows the interhelicalangle within an EF-hand forEhCaBP, CaM, and TnC. Theseangles were calculated using MOLMOL. As evident frominterhelical angles,EhCaBP shows a more open C-terminaldomain compared to CaM and TnC, while on the other hand,the N-terminal domain ofEhCaBP is seen to adopt a slightlymore closed state. In both CaM and TnC, the N-terminaldomain is the regulatory domain, which interacts with thetarget molecules while the C-terminal domain acts as ananchoring domain (59, 60). Though such characterization hasnot been done in the case ofEhCaBP, a more open natureof C-terminal domain compared to the N-terminal domainsuggests its possible involvement in binding target molecules.
(c) Exposed Hydrophobic Surface.Table 4 shows apercentage of the total surface of hydrophobic residues thatis exposed to the solvent (water) forEhCaBP, CaM, andTnC, calculated using the program NACCESS. The percent-age values in the table indicate sum total of relative solventaccessibilities of all the hydrophobic residues in a given
Table 2: Primary Sequence Indicating the EF-Hand Ca2+-Binding Loops in Each Domain ofEhCaBP, CaM, and TnCa
a Residues at the-4 position of the first Ca2+-binding loop in a given EF-hand and 13th position of the second Ca2+-binding loop, within thesame domain, are highlighted. Their respective positions in the protein primary sequence are indicated as superscripts. The numbering of theCa2+-binding loops, which are shown underlined, begins with the first residue, an invariant Asp. Last column in the table shows the central linkerregion in the three proteins, with the respective positions of the start and end residue in the primary sequence indicated by superscripts.
14400 Biochemistry, Vol. 40, No. 48, 2001 Atreya et al.
domain (the number of hydrophobic residues are indicatedin brackets). Residues used in the analysis were Ala, Val,Leu, Ile, Met, and Phe. As evident from the table, thehydrophobic residues in CaM and TnC expose their totalsurface to solvent to a lesser extent as compared toEhCaBP.Such an observation was also made in thermodynamicsstudies of binding of peptides toEhCaBP (61). In a recentpeptide-binding study, it has been reported that even afterbinding of mellitin,EhCaBP exposes a considerable amountof hydrophobic surface as compared to CaM-mellitincomplex (61). This is based on the assumption that mellitininteracts in a similar fashion with CaM andEhCaBP. Thisexposure of hydrophobic surface may be required for othersecondary interactions of the protein and also impartsspecificity to the protein toward such interactions.
(d) Linker Region.The central linker region, connectingthe two globular domains in CaM and TnC has been a regionof special interest for biochemists and structural biologistsalike. Several site-directed mutageneses have been carriedout in these proteins to understand the effect of length andcomposition of this linker on their individual functions (62-64). This linker region, which spans 8-10 residues in bothCaM and TnC, has been characterized as part of a long helixin X-ray studies (17, 20, 21) and as an extended flexible
region in the solution-state NMR studies (14-16, 18, 19,65, 66). As has been described earlier, inEhCaBP, the linkerregion spans eight amino acid residues (residues 63-70)(Figure 4). This region exhibits a large structural flexibility(Figure 6b), leading to an ill-defined orientation of the twodomains (N- and C-terminal) with respect to each other(Figure 2, panels a and b). The amino acid composition ofthe linker region inEhCaBP, CaM, and TnC is shown inTable 2 (last column) for comparison. The start and endresidues in the linker region are indicated as superscripts.CaM and TnC are composed of a number of charged residuesin the central linker region as against only one Asp inEhCaBP. It is interesting to note that the presence of twoGly residues (G63 and G67) may seem to impart a greaterflexibility to the central linker region inEhCaBP, ascompared to the lone Gly residue present in TnC and nonein CaM. Such flexibility has been previously attributed tobe the reason as to why X-ray diffraction patterns ofEhCaBPcrystals are found to be poor in quality (22). Further, thepresence of G63 and G67 in the linker region has been shownto be important for the function ofEhCaBP. In one of theearlier studies onEhCaBP, these two Gly residues weremutated to Ala (67). Such mutations were found to impartrigidity to the flexible linker region. Studies involving CDand mass spectrometric techniques revealed that the mutantprotein is weakened in its ability to bind Ca2+ and its targetpeptides (67), implying a possible role of these glycines inspecific interactions with target peptides. In another study,the flexibility in the central linker region was thought to beresponsible for the inability of the short peptide, mastoporan,to bind toEhCaBP, although the same peptide is found tobind to CaM with considerable affinity (61). Thus, in contrastto CaM and TnC, where length and/or composition of thelinker region were found to be crucial for the function, inEhCaBP, both flexibility as well as amino acid composition(with the two Gly residues at position 63 and 67) seem tobe necessary for its function.
Structure-Function Relationship in EhCaBP.The NMR-derived solution structure ofEhCaBP presented here providesclues on the putative function of the protein. AlthoughEhCaBP, CaM, and TnC are similar in terms of Ca2+ bindingaffinities and the hydrophobic nature of protein-targetinteraction, there are dissimilarities in the nature of the centrallinker region and the extent of the exposed hydrophobicresidues. The latter have been shown to be crucial for thefunction of the protein both in the case ofEhCaBP and CaM/TnC. The flexibility in the linker region, imparted by Glyresidues, may be responsible for specificity of the proteintoward its interaction with target molecules. Specificity mayalso arise from more exposed hydrophobic residues ascompared to CaM and TnC. In the case ofEhCaBP, apresence of Tyr (Y81) in the C-terminal domain instead ofa more conserved Phe in that position seems to fine-tunethe Ca2+ binding affinity in that domain. This is revealed ina comparison of Ca2+-binding loop structures of this domainwith that of other EF-hand proteins. Thus, we conclude thatEhCaBP operates in a distinct manner compared to CaM andTnC, an observation that is supported by biochemical studies(7, 8). Site-directed mutagenesis involving the replacementof Y81 by a more conserved Phe (Y81F), along withstructural studies of apo-EhCaBP andEhCaBP-peptide
Table 3: Interhelical Angles within an EF-Hand inEhCaBP, CaM,and TnCa
N-terminal domian C-terminal domain
protein A/B C/D E/F G/H
EhCaBP 117.8 118.1 92.7 93.4calmodulin (X-ray) 85.5 87.4 102.4 95.2calmodulin (NMR) b b 106.6 87.7troponin C (X-ray) 99.5 96.9 104.6 107.2troponin C (NMR) 82.5 79.2 91.0 104.8
a In the case of CaM and TnC, both X-ray and NMR-derivedstructures are used for comparison (see text). The helices are labeledA-H as they occur in the primary sequence from N- to C-terminus ofthe protein. Thus, helices A/B represent the first EF-hand pair in theprotein, C/D the second EF-hand pair and so on. Helices A-D belongto the N-terminal domain and helices E-H belong to the C-terminaldomain of each protein.b NMR structure corresponding to Ca2+-saturated N-terminal CaM (noncomplexed form) was not found in theprotein data bank.
Table 4: Total Relative Solvent Accessible Hydrophobic SurfaceArea of Each Domain inEhCaBP, CaM, and TnC Calculated Usingthe Program NACCESS (63) (see text)a
relative solvent accessible surface area (%)
N-terminal domain C-terminal domain
protein
no. ofhydrophobic
residuessurface
area
no. ofhydrophobic
residuessurface
area
EhCaBP 26 33.3 24 37.3calmodulin (X-ray) 25 28.2 24 29.3calmodulin (NMR) b b 24 23.7troponin C (X-ray) 33 25.3 24 26.7troponin C (NMR) 33 33.3 24 34.6
a In the case of CaM and TnC, both X-ray and NMR-derivedstructures were used for comparison. The number of hydrophobicresidues used in the calculation for each domain is indicated. Thepercentage values indicate the extent of total hydrophobic surface areaexposed in each protein.b NMR structure corresponding to Ca2+-saturated N-terminal CaM (noncomplexed form) was not found in theprotein data bank.
Structure of aE. histolyticaCa2+-Binding Protein Biochemistry, Vol. 40, No. 48, 200114401
complexes in solution by NMR, are currently in progress inour laboratory.
ACKNOWLEDGMENT
The facilities provided by the National Facility for HighField NMR, supported by Department of Science andTechnology (DST), Department of Biotechnology (DBT),Council of Scientific and Industrial Research (CSIR), andTata Institute of Fundamental Research, Mumbai, are grate-fully acknowledged. We dedicate this paper in the memoryof late Prof. G. N. Ramachandran (1922-2001).
SUPPORTING INFORMATION AVAILABLE
Superimposition of canonical EF-hand Ca2+-binding loopsfrom different proteins. This material is available free ofcharge via the Internet at http://pubs.acs.org.
REFERENCES
1. Christopher, D. H., Haque, R., and Petri, W. A., Jr. (1999)Exp. ReV. Mol. ReV. 22.
2. Ravdin, J. I., Murphy, C. F., Guerrant, R. L., and Long-Kruz,S. A. (1985)J. Infect. Dis. 152, 542-549.
3. Munoz, M. L., O’Shea-Alvarez, M. S., Perez-Garcio, J.,Weinbach, E. C., Moreno, M. A., and Tovar, R. (1992)Comp.Biochem. Physiol. B103, 517-521.
4. Carbaja´l, M. E., Manning-Cela, R., Pin˜a, A., Franco, E., andMeza, I. (1996)Exp. Parasitol. 82, 11-20.
5. Meza, I. (2000)Parasitol. Today 16, 23-28.6. Prasad, J., Bhattacharya, S., and Bhattacharya, A. (1992)Mol.
Biochem. Parasitol. 52, 137-140.7. Yadava, N., Chandok, M. R., Prasad, J., Bhattacharya, S., and
Bhattacharya, A. (1997)Mol. Biochem. Parasitol. 84, 69-82.
8. Sahoo, N., Chakravarty, P., Yadava, N., Bhattacharya, S., andBhattacharya, A. (2000)Arch. Med. Res. 31, S57-S59.
9. Strynadka, N. C., and James, M. N. G. (1989)Annu. ReV.Biochem. 58, 951-958.
10. Nelson, M. R., and Chazin, W. J. (1998)BioMetals 11, 297-318.
11. Sahu, S. C., Atreya, H. S., Chauhan, S., Bhattacharya, A.,Chary, K. V. R., and Govil, G. (1999)J. Biomol. NMR 14,93-94.
12. Sahu, S. C., Bhattacharya, A., Chary, K. V. R., and Govil, G.(1999)FEBS Lett. 459, 51-56.
13. Atreya, H. S., Sahu, S. C., Chary, K. V. R., and Govil, G.(2000)J. Biomol. NMR 17(2), 125-136.
14. Zhang, M., Tanaka, T., and Ikura, M. (1995)Nat. Struct. Biol2, 758-767.
15. Kubinowa, H., Tjandra, N., Grzesiek, S., Ren, H., Klee, C.B., and Bax, A. (1995)Nat. Struct. Biol. 2, 768-776.
16. Finn, B. E., Evenas, J., Drakenberg, T., Waltho, P. J., Thulin,E. and ForsEÅ n, S. (1995)Nat. Struct. Biol. 2, 777-783.
17. Chattopadhyaya, R., Meador, W. E., Means, A. R., andQuiocho, F. A. (1992)J. Mol. Biol. 228, 1177.
18. Slupsky, C. M., and Sykes, B. D. (1995)Biochemistry 34,15953-15964.
19. Gagne´, S. M., Tsuda, S., Li, M. X., Smillie, L. B., and Sykes,B. D. (1995)Nat. Struct. Biol. 2, 784-789.
20. Herzberg, O., and James, M. N. G. (1988)J. Mol. Biol. 203,751.
21. Houdusse, A., Love, M. L., Dominguez, R., Grabarek Z, andCohen, C. (1997)Structure 15, 1695-711.
22. Gopal, B., Suma, R., Bhattacharya, S., Bhattacharya, A.,Murthy, M. R. N., and Surolia, A. (1998)Acta Crystallogr.,Sect. D 54, 1442-1445.
23. Atreya, H. S., and Chary, K. V. R. (2001)J. Biomol. NMR19, 267-272.
24. Piantini, U., So¨renson, O. W., and Ernst, R. (1982)J. Am.Chem. Soc. 104, 6800-6801.
25. Muller, N., Ernst, R. R., and Wu¨thrich, K. (1996)J. Am. Chem.Soc. 108, 6482-6492.
26. Griesinger, C., Otting, G., Wu¨thrich, K., and Ernst, R. R.(1988)J. Am. Chem. Soc. 110, 7870-7872.
27. Kumar, A., Wagner, G., Ernst, R. R., and Wu¨thrich, K. (1980)Biochem. Biophys. Res. Commun. 96, 1156-1163.
28. Sahu S. C., and Majumdar, A. (1998)Curr. Sci. 74, 451-45629. Kay, L. E., Keifer, P., and Saarinan, T. (1992)J. Am. Chem.
Soc. 114, 10663-10665.30. Marion, D., Kay, L. E., Sparks, S. W., Torchia, D. A., and
Bax, A. (1989)J. Am. Chem. Soc. 111, 1515-1517.31. Marion, D., Driscoll, P. C., Kay, L. E., Wingfield, P. T, Bax,
A., Gronenborn, A, and Clore, G. M. (1989)Biochemistry 28,6150-6156.
32. Vuister, G. W., and Bax, A. (1993)J. Am. Chem. Soc. 115,7772-7777.
33. Kay, L. E., Ikura, M., Tschudin, R., and Bax, A. (1990)J.Magn. Reson. 89, 496-514.
34. Bax, A., and Ikura, M. (1991)J. Biomol. NMR 1, 99-104.35. Kay, L. E., Ikura, M., Tschudin, R., and Bax, A. (1990)J.
Magn. Reson. 89, 496-514.36. Wittekand, M., and Muller, L. (1993)J. Magn. Reson. B101,
201-205.37. Grzesiek, S., and Bax, A. (1992)J. Am. Chem. Soc. 114,
6291-6293.38. Clubb, R. T., Thanabal, V., and Wagner, G. (1992)J. Magn.
Reson. 97, 213-217.39. Guntert, P., Mumenthaler, C., and Wu¨thrich, K. (1997)J. Mol.
Biol. 273, 283-298.40. Wuthrich, K., Billeter, M., and Braun W. (1983)J. Mol. Biol.
169, 949.41. Akerfeldt, K. S., Coyne, A. N., Wilk, R. R., Thulin, E., and
Linse, S. (1996)Biochemistry 35, 3662-3669.42. Biekofsky, R. R., Martin, S. R., Browne, J. P., Bayley, P. M.,
and Feeney, J. (1998)Biochemistry 37, 7617-7629.43. Koradi, R., Billeter, M., and Wu¨thrich K. (1996)J. Mol. Graph.
14, 51-55.44. Laskowski, R. A., MacArthur, M. W., Moss, D. S., and
Thorton, J. M. (1993)J. Appl. Crystallogr. 26, 283-291.45. Kay, L. E., Torchia, D. A., and Bax, A. (1989)Biochemistry
28, 8972-8979.46. Skelton, N. J., Palmer, A. G., Akke, M., Kordel, J., Rance,
M., and Chazin, W. J. (1993)J. Magn. Reson. B102, 253-264.
47. Farrow, N. A., Muhandiram, R., Singer, A. U., Pascal, S. M.,Kay, C. M., Gish, G., Shoelson, S. E., Pawson, T., Forman-Kay, J. D., and Kay, L. E. (1994)Biochemistry 33, 5984-6003.
48. Lipari, G., and Szabo, A. (1982)J. Am. Chem. Soc. 104, 4546-4559 and 4559-4570.
49. Mandel, A. M., Akke, M., and Palmer, A. G. (1995)J. Mol.Biol. 246, 144-163.
50. Clore, G. M, Szabo, A. Bax, A., Kay, L. E., Driscoll, P. C.,and Gronenborn, A. M. (1990)J. Am. Chem. Soc. 112, 4989-4991.
51. Tjandra, N., Feller, S. E., Pastor, R. W., and Bax, A. (1995)J. Am. Chem. Soc. 117, 12562-12566.
52. Bevington, P. R., and Robinson, D. K. (1992) inDatareduction and error analysis for the physical sciences,McGraw-Hill, New York.
53. Hyberts, S. G., Goldberg, M. S., Havel, T. F., and Wagner,G. (1992)Science 1, 736-751.
54. Hubbard, S. J., and Thornton, J. M. (1993)NACCESS,Computer Program, Department of Biochemistry and Molec-ular Biology, University College London.
55. Lee, B., and Richards, F. M. (1971)J. Mol. Biol. 55, 379-400.
56. Sekharadu, Y. C., and Sundaralingam, M. (1988)Protein Eng.2, 139-146.
57. Falke, J. J., Drake, S. K., Hazard, A. L., and Peersen, O. B.(1994)Q. ReV. Biophys. 27, 219-290.
14402 Biochemistry, Vol. 40, No. 48, 2001 Atreya et al.
58. Rashidi, H. H, Bauer, M., Patterson, J., and Smith, D. W.(1999)J. Mol. Microbiol. Biotechnol. 1, 175-182.
59. Crivici, A., and Ikura, M. (1995)Annu. ReV. Biophys. Biomol.Struct. 24, 85-116.
60. Filatov, V. L., Katrukha, A. G., Bulargina, T. V., and Gusev,N. B. (1999)Biochemistry (Moscow) 64, 969.
61. Moorthy, A., K., Gopal, B., Satish, P. R., Bhattacharya, S.,Bhattacharya, A., Murthy, M. R. N., and Surolia, A. (1999)FEBS Lett. 461, 19-24.
62. Putkey, J. A., Ono, T., VanBerkum, M. F., and Means, A. R.(1988)J. Biol. Chem. 263, 11242-11249.
63. Fujimori, K., So¨renson, M., Herzberg, O., Moult, J., andReinach, F. C. (1990)Nature 345, 182-184.
64. Dobrowlski, Z., Xu, G. Q., and Hitchcock-DeGregori, S. E.(1991)J. Biol. Chem. 266, 5703-5710.
65. Barbato, G., Ikura, M., Kay, L. E., Pastor, R. W., and Bax, A.(1992)Biochemistry 31, 5269-5278.
66. Slupsky, C. M., Kay, C. M., Reinach, F. C., Smillie, L. B.,and Sykes, B. D. (1995)Biochemistry 34, 7365-7375.
67. Moorthy, A. L. (2001) Ph.D. Thesis, Indian Institute ofScience, Bangalore, India.
BI0114978
Structure of aE. histolyticaCa2+-Binding Protein Biochemistry, Vol. 40, No. 48, 200114403