no. 3 tony laser scanning of conveyor ore profile d · laser scanning of conveyor ore profiles iron...
TRANSCRIPT
Tony Fares – July 2015
Laser Scanning of Conveyor Ore Profiles
IRON ORE 2015

Jacobs Global
Founded: 1947
Publicly traded on New York Stock Exchange
one of the world’s largest and most diverse
providers of technical, professional, and construction services
Employees: 60,000+
Global Locations: 200+ global ‐ 30 countries
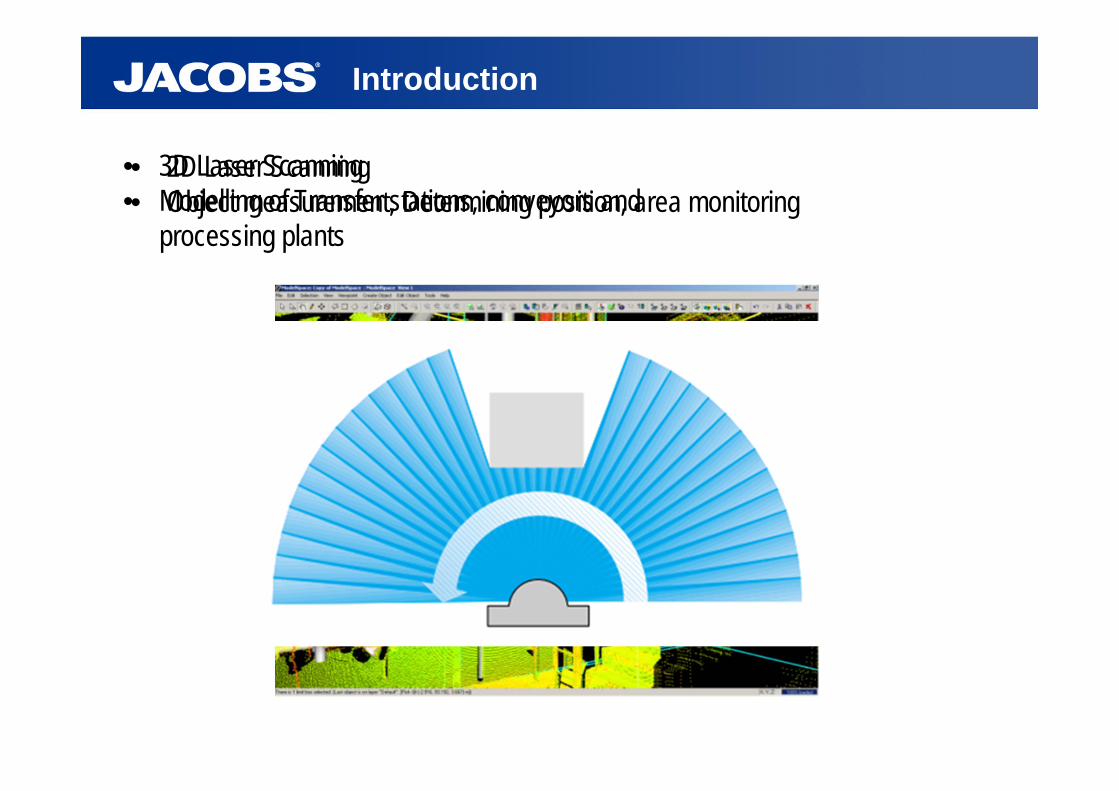
Introduction
• 3D Laser Scanning• Modelling of Transfer stations, conveyors and
processing plants
• 2D Laser Scanning• Object measurement, Determining position, area monitoring

Introduction
• Volume flow measurement of Iron Ore on conveyor belts
• Understand the real utilisation of the volumetric capacity of the conveyor
• Extract the real value of Surcharge angles
Increase production capacity at near zero capital cost
Improve design of future conveyor with reduced capital cost

Background
• The Surcharge Angle (SA) is the slope that the ore forms to the horizontal at the edge of the ore
• The higher the surcharge angle, the greater the volume of ore that can be loaded on the belt
• Understanding the real utilisation of the available volumetric capacity of a conveyor is key to unlocking latent capacity or plant “debottlenecking”
• Use of 2D scanning lasers to measure the ore profile on conveyors in the field to extract the real SA (edge distance and bulk density)

Why ?
Conveyors are typically designed on the basis of conservative SA
Design SA < Real SA
• Larger edge clearances than the specified minimum
• Belt will appear to be running relatively empty
• Latent volumetric capacity available
Design SA > Real SA
• Possible to overload the conveyor
• Conveyor may not be able to meet design production targets
• Production losses
• Debottleneck existing plant
• Revise the SA design criteria so smaller and cheaper conveyors can be designed maximising the return on capital

Laser Measurement System
• Class 1 laser scanner (eye safe)
• Outputs “range” at 0.5° increments
• 180° scan arc
• Up to 37 Hz scan rate
• +/- 15 mm uncertainty
0.5°

Field Measurements
Conveyor CV1 Conveyor CV2 Conveyor CV3 Conveyor CV4
Transfer Conveyor Transfer Conveyor
Tripper Conveyor
Ship Loader Boom
Design capacity (TPH) 10,500 10,500 10,000 10,000
Belt Speed (m/s) 4.3 4.2 4.9 3.8
Belt width (mm) 1800 1800 1500 1800
Total Lift (m) 7.5 4.5 11 -
Horizontal Length (m) 142 168 645 71
Carry idler 3 Roll, 35° 3 Roll, 35° 3 Roll, 45° 3 Roll, 35°
CEMA edge clearance (mm) 122 122 106 122
• Four Iron Ore conveyors
• Measurement done near the loading point of each belt • More than 70 hours of data collected for each conveyor• Each conveyor handled different type of Iron Ore lump and Iron Ore fines products• Lump ore typically has particles 32 mm or smaller• Fines ore typically has particles 6 mm or smaller
9,200
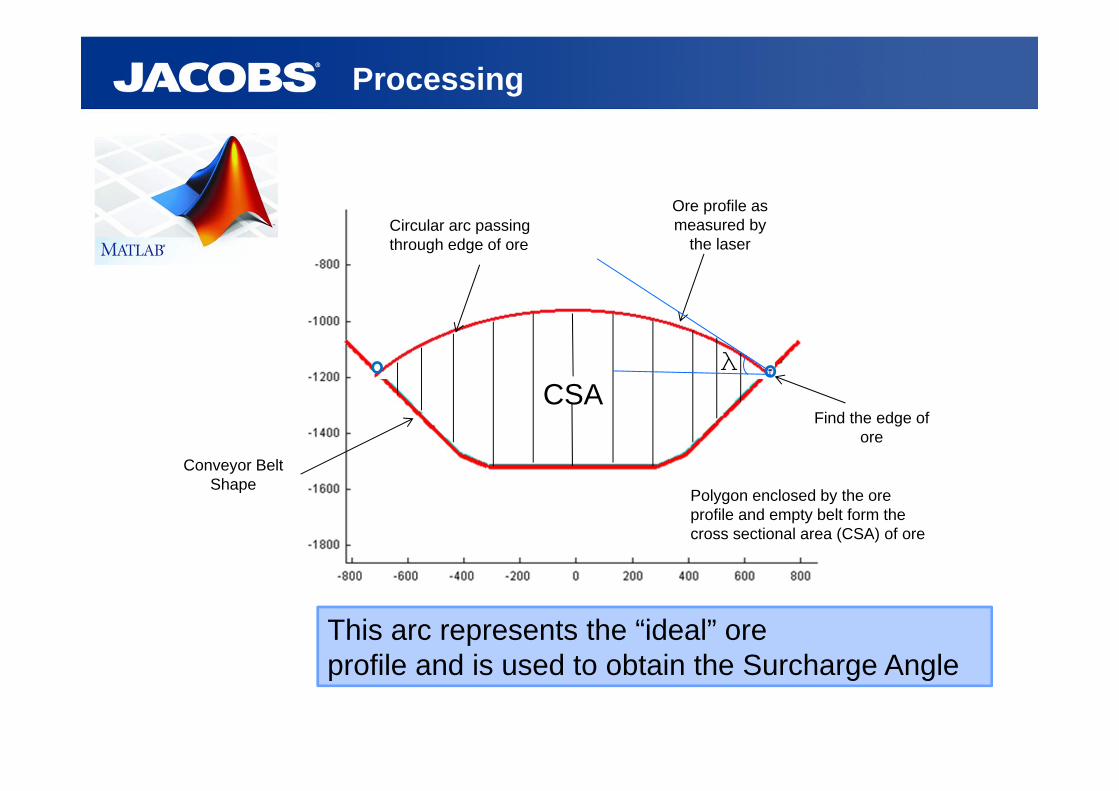
Processing
CSA
Conveyor Belt Shape
Ore profile as measured by
the laser
Find the edge of ore
Polygon enclosed by the ore profile and empty belt form the cross sectional area (CSA) of ore
Circular arc passing through edge of ore
This arc represents the “ideal” ore profile and is used to obtain the Surcharge Angle
λ

Results
Time history results for conveyor CV2, carrying lump ore
CS
A (m
2 )B
ed D
epth
(mm
)tp
h

Results
Time history results for conveyor CV1, carrying fines oreC
SA
(m2 )
Bed
Dep
th (m
m)
tph

Results
Edge clearance and surcharge angle results for conveyor CV2, carrying fines oreSu
rcha
rge
angl
e (°
)Av
ged
ge d
ista
nce
(mm
)
Cross sectional area (m2)

Results
Edge clearance and surcharge angle results for conveyor CV1, carrying lump ore
Surc
harg
e an
gle
(°)
Avg
edge
dis
tanc
e (m
m)
Cross sectional area (m2)

Results
• Conveyor 2 had the greatest SA when loading lump ore • Conveyor 1 had the lowest SA when loading lump ore

Results
• Average edge distance for conveyors 1 and 2 were greater than the recommended CEMA values (black horizontal line)
• Conveyor 1 and 2 were not fully loaded to optimal capacity, i.e. were underutilised

Results
Cap
acity
(tph
)
SA (deg)
10 deg9,200 tph
15 deg10,000 tph
8.7%
20 deg10,850 tph
25 deg11,700 tph
17.9%27.2%

Results
SA 10 deg1800 wide
3.8 m/s SA 25 deg1600 wide
3.8 m/s
SA 20 deg1600 wide
4.1 m/s
SA (deg)
Cos
t sav
ing
(%)
15-20% cost saving
$ 5M for 1000 m long conveyor
Capacity 9200 tph
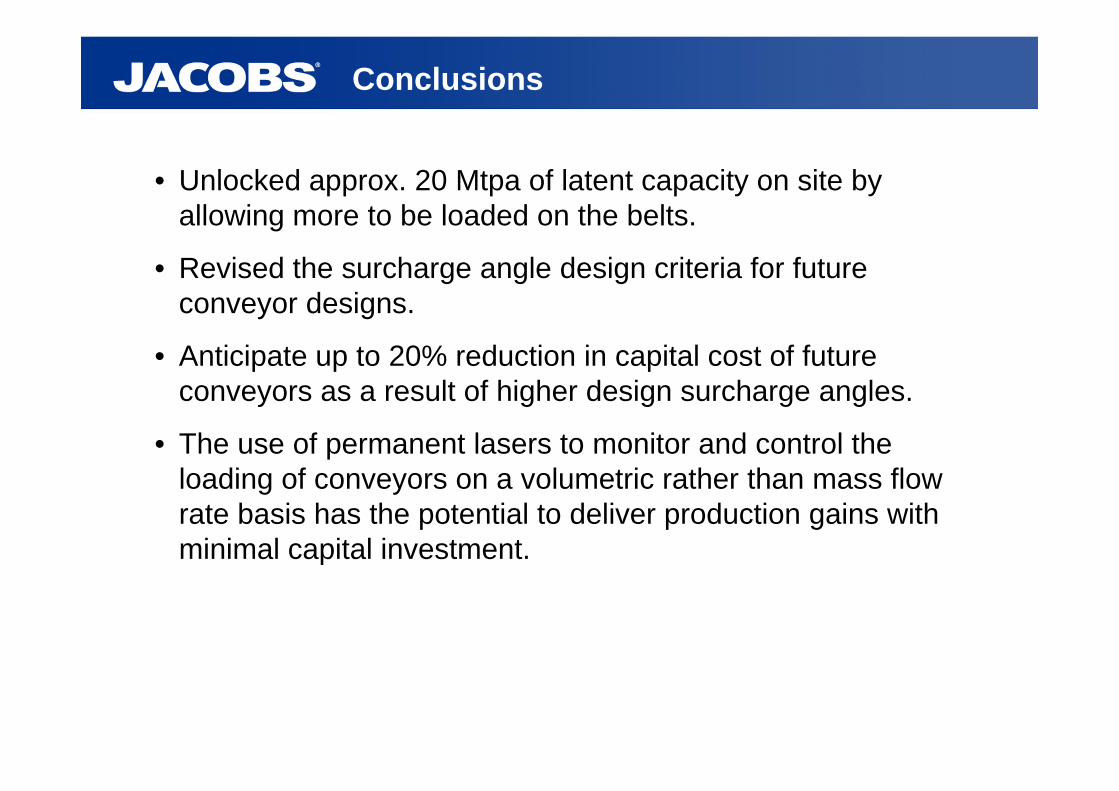
Conclusions
• Unlocked approx. 20 Mtpa of latent capacity on site by allowing more to be loaded on the belts.
• Revised the surcharge angle design criteria for future conveyor designs.
• Anticipate up to 20% reduction in capital cost of future conveyors as a result of higher design surcharge angles.
• The use of permanent lasers to monitor and control the loading of conveyors on a volumetric rather than mass flow rate basis has the potential to deliver production gains with minimal capital investment.

Increase production capacity at near zero capital cost
Improve design of future conveyor with reduced capital cost