no-screen-first: an evolving approach for an inclusive audience
TRANSCRIPT

No Screen FirstAn Evolving Approach For An Inclusive Audience
March 24, 2016

TOMMY O’KEEFE @tommyokeefe
NGUYET VUONG @nguyetv

What does it mean to make a product accessible?

What does it mean to make a product accessible?Standards compliance

Problem–Standards alone raise the bar for accessibility, but often do little to ensure usability.
standards can become just a checklist
standards are process agnostic
standards can create lowest common denominator outcomes
1
2
3


1
2
3
What is a visualization for someone who can’t see? What do we mean by “no screen first”? How do we think through designing and developing from a no-screen-first approach?

What is a “visualization” for someone who can’t see?
1

Visualization (n)Technique of creating images to communicate a message
V I S UA L C H A L L E N G E S

For data visualization, it’s presenting data in a way to call attention to particular aspects of meaning within that set of data
For example, a line graph is a way to visualize data as a trend over time. It’s about conveying meaning within a data set.
V I S UA L C H A L L E N G E S

How someone with normal vision sees the map
V I S UA L C H A L L E N G E S
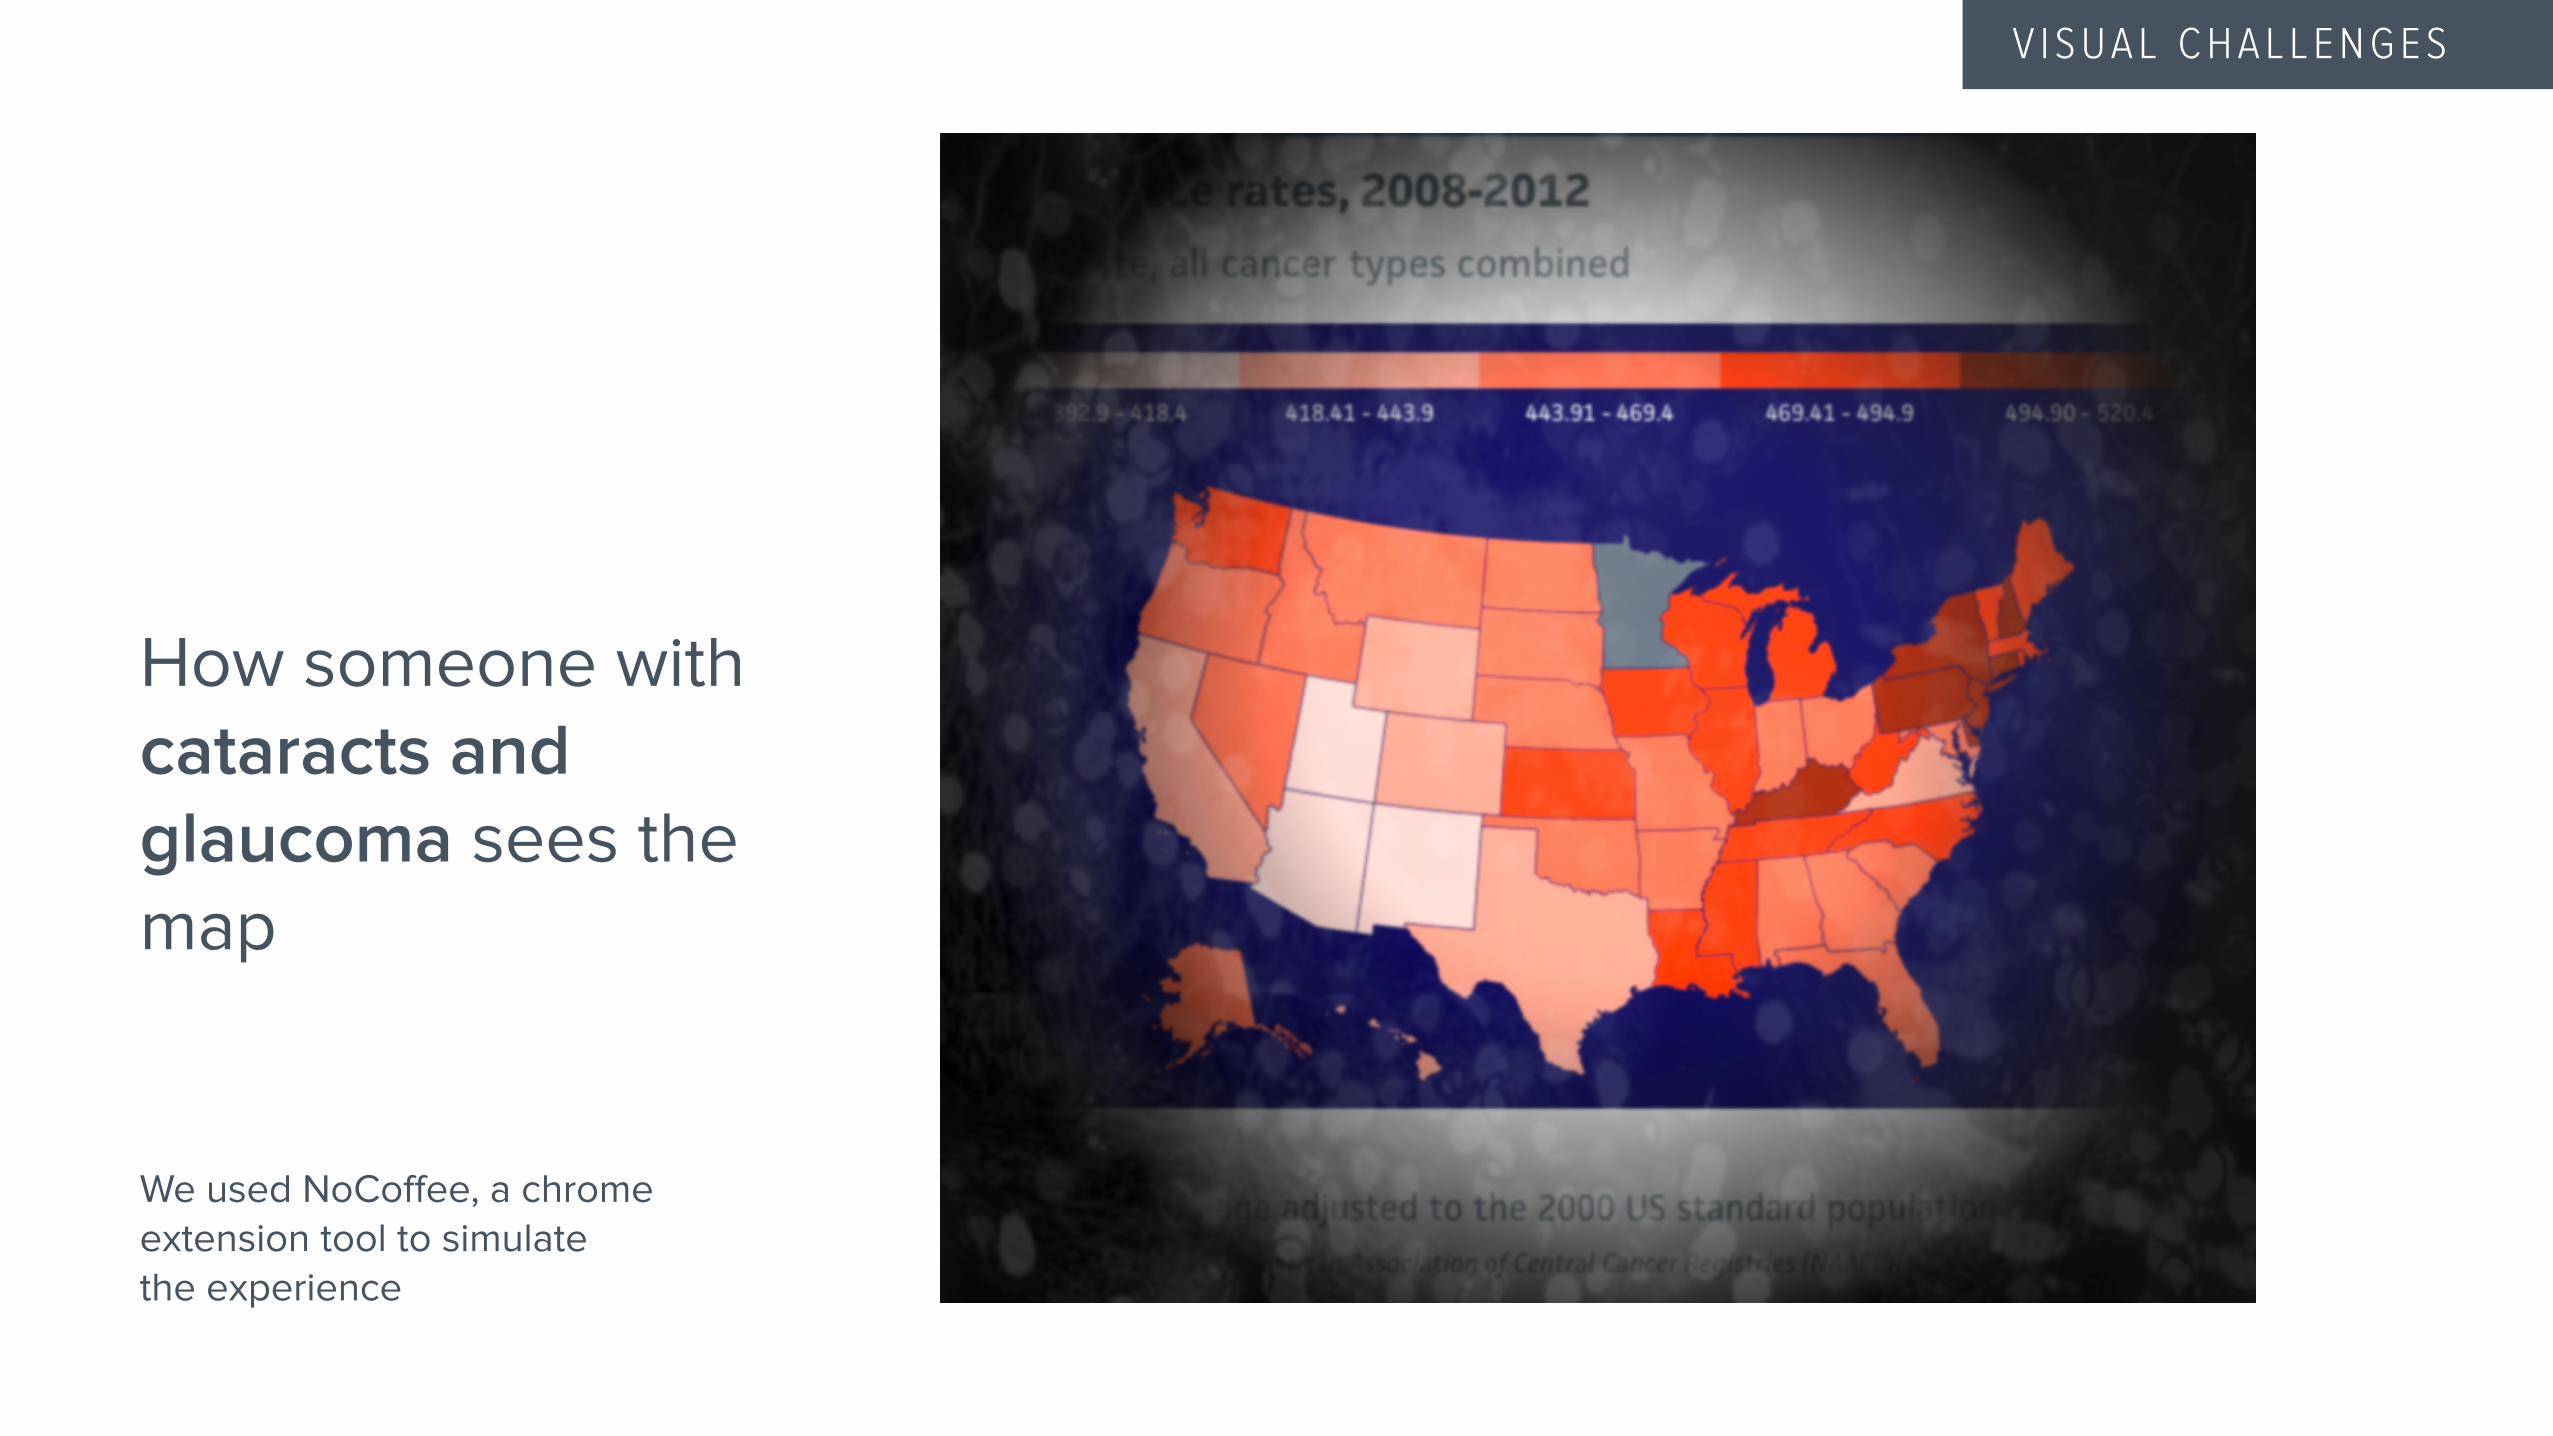
How someone with cataracts and glaucoma sees the map
We used NoCoffee, a chrome extension tool to simulate the experience
V I S UA L C H A L L E N G E S

How someone with red-green color blindness sees the map
V I S UA L C H A L L E N G E S
We used NoCoffee, a chrome extension tool to simulate the experience

Other challenges of creating accessible data visualization
Brand colors
Need for a color system
User expectations
Dynamic interfaces
Budget & resources
Constraints and influencing factors
1
V I S U A L C H A L L E N G E S
2
3
4
5

What does it mean for us to design and develop for an inclusive audience?

Treating accessibility like another breakpoint, an equally important component of responsive design
A need to create meaning out of the data before presenting it
Working together as a team that thinks holistically to integrate accessibility in our entire process
It means…1
2
3

How can we evolve our approach to create solutions that work for everyone?

No screen first = Meaning firstEveryone who touches the project has an understanding of the meaning of the information.
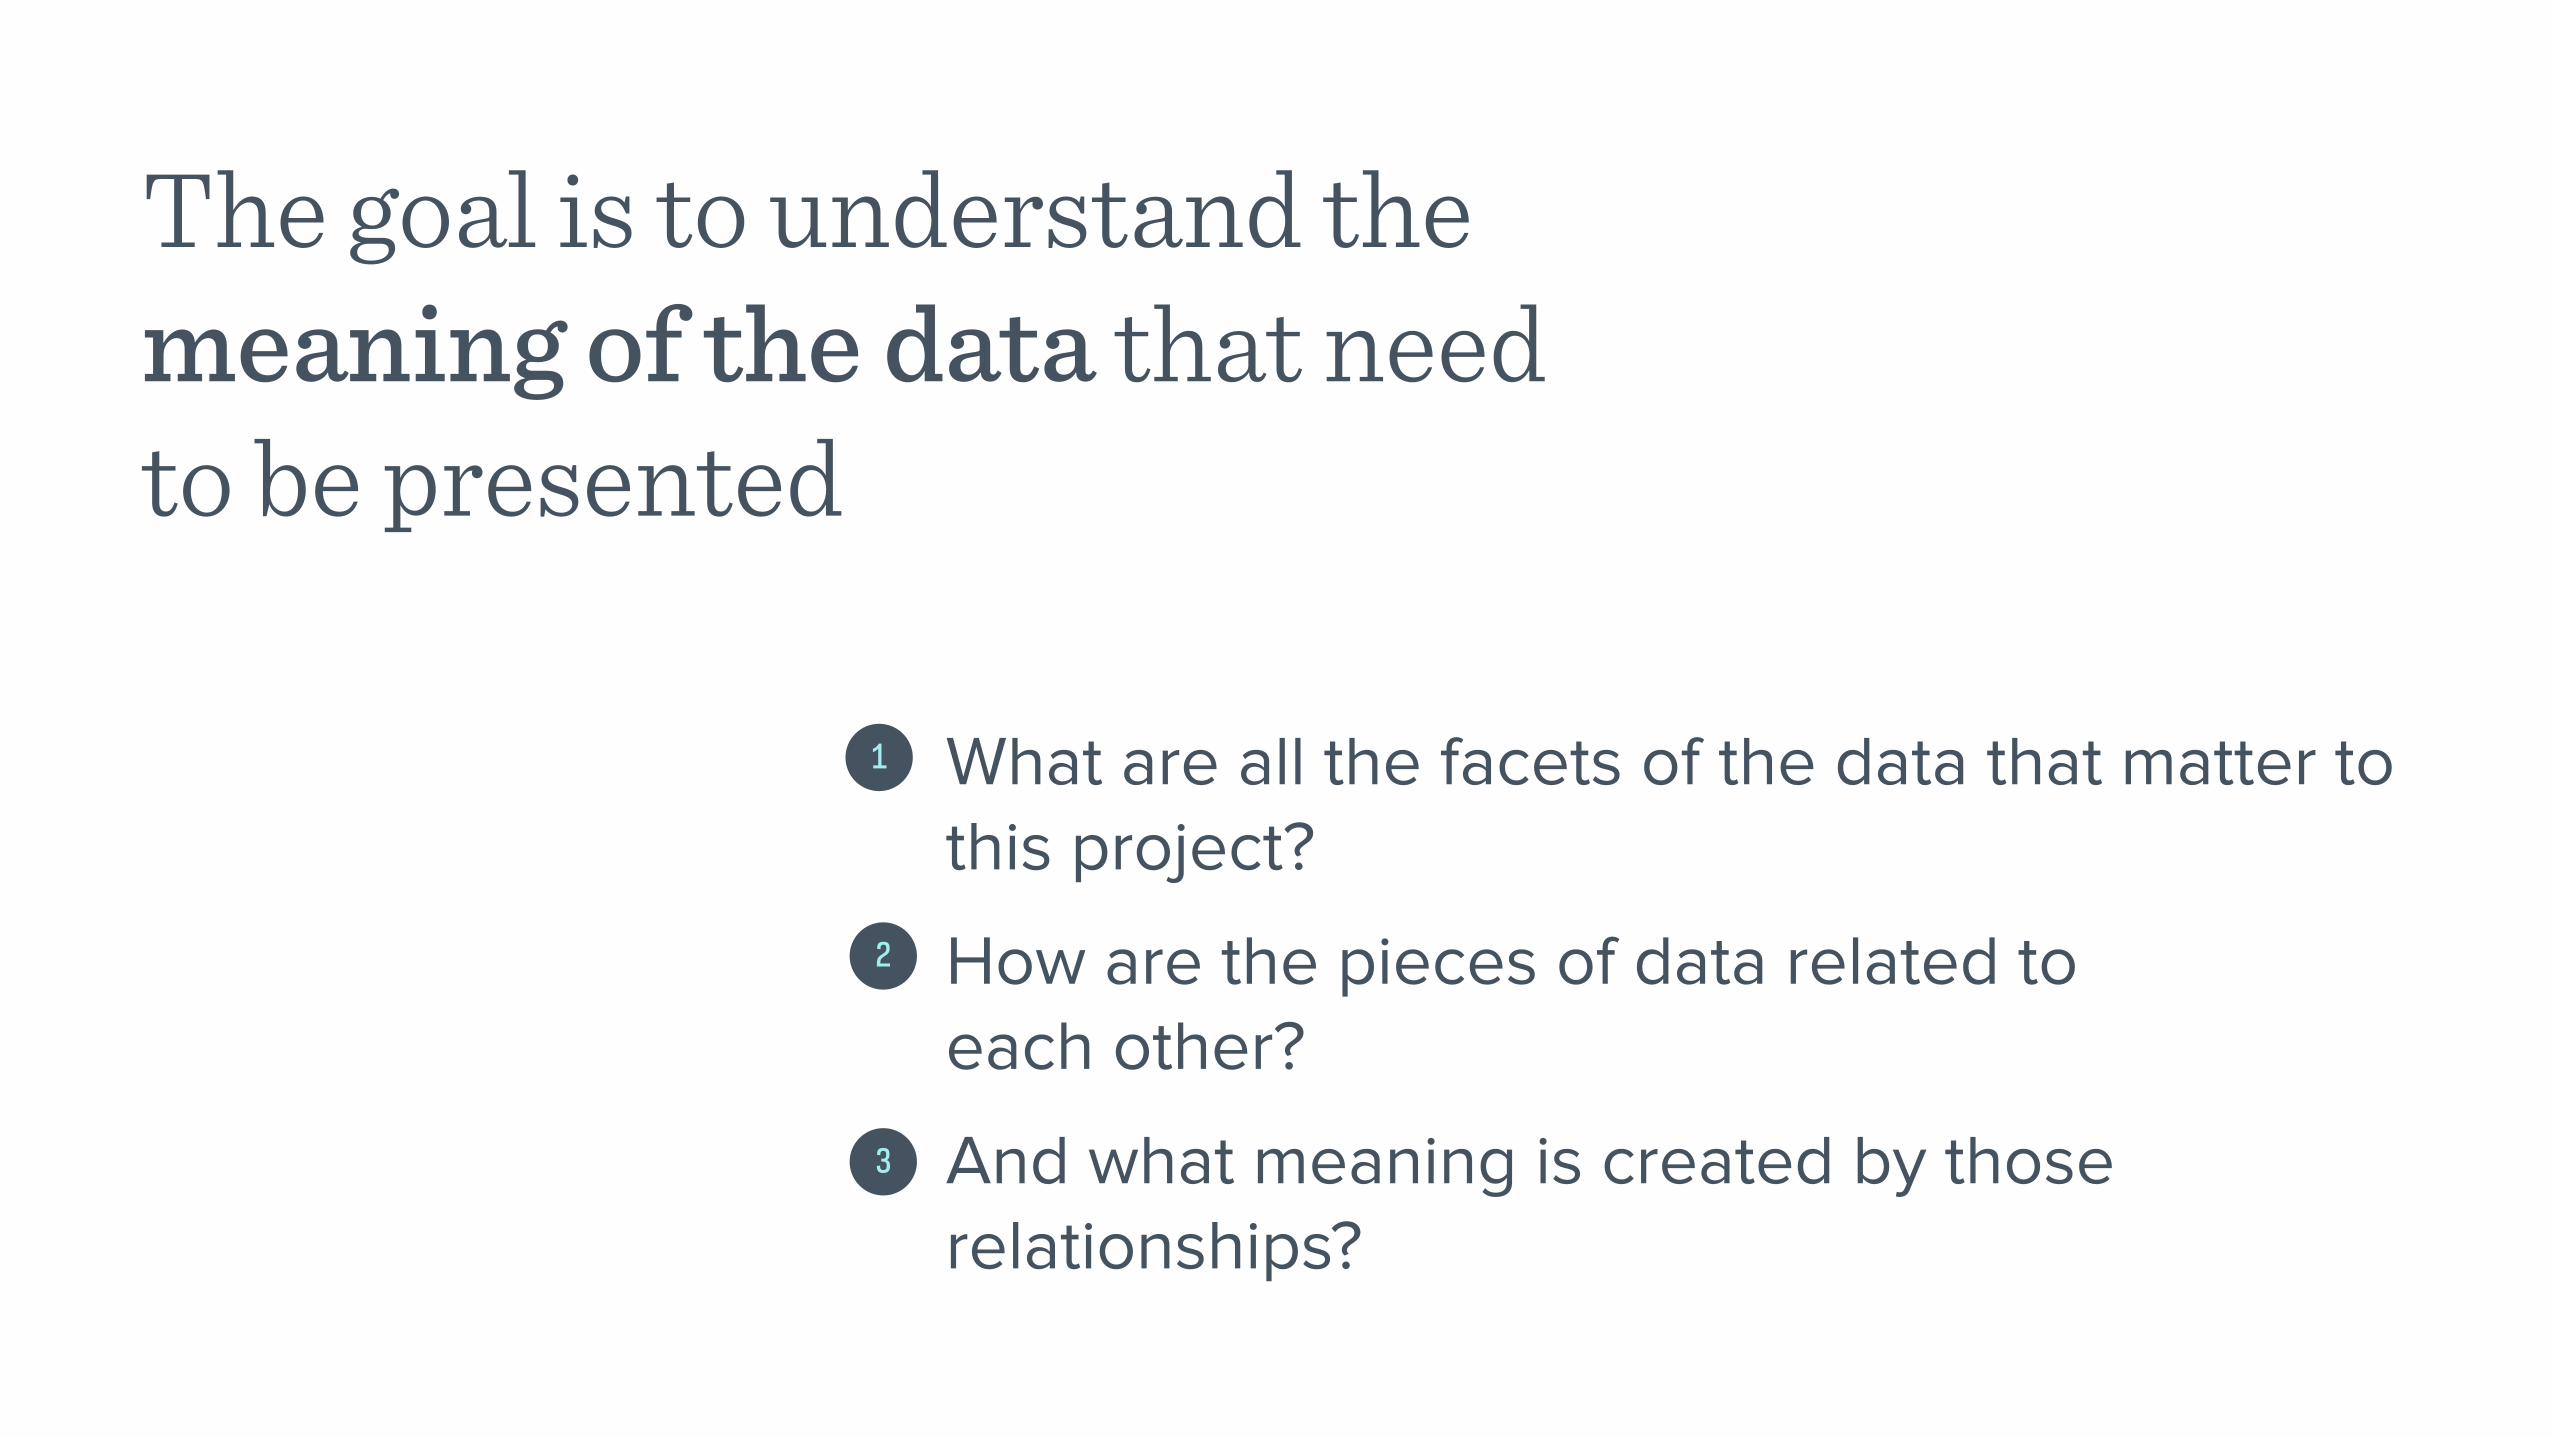
The goal is to understand the meaning of the data that need to be presented
What are all the facets of the data that matter to this project?
How are the pieces of data related to each other?
And what meaning is created by those relationships?
1
2
3
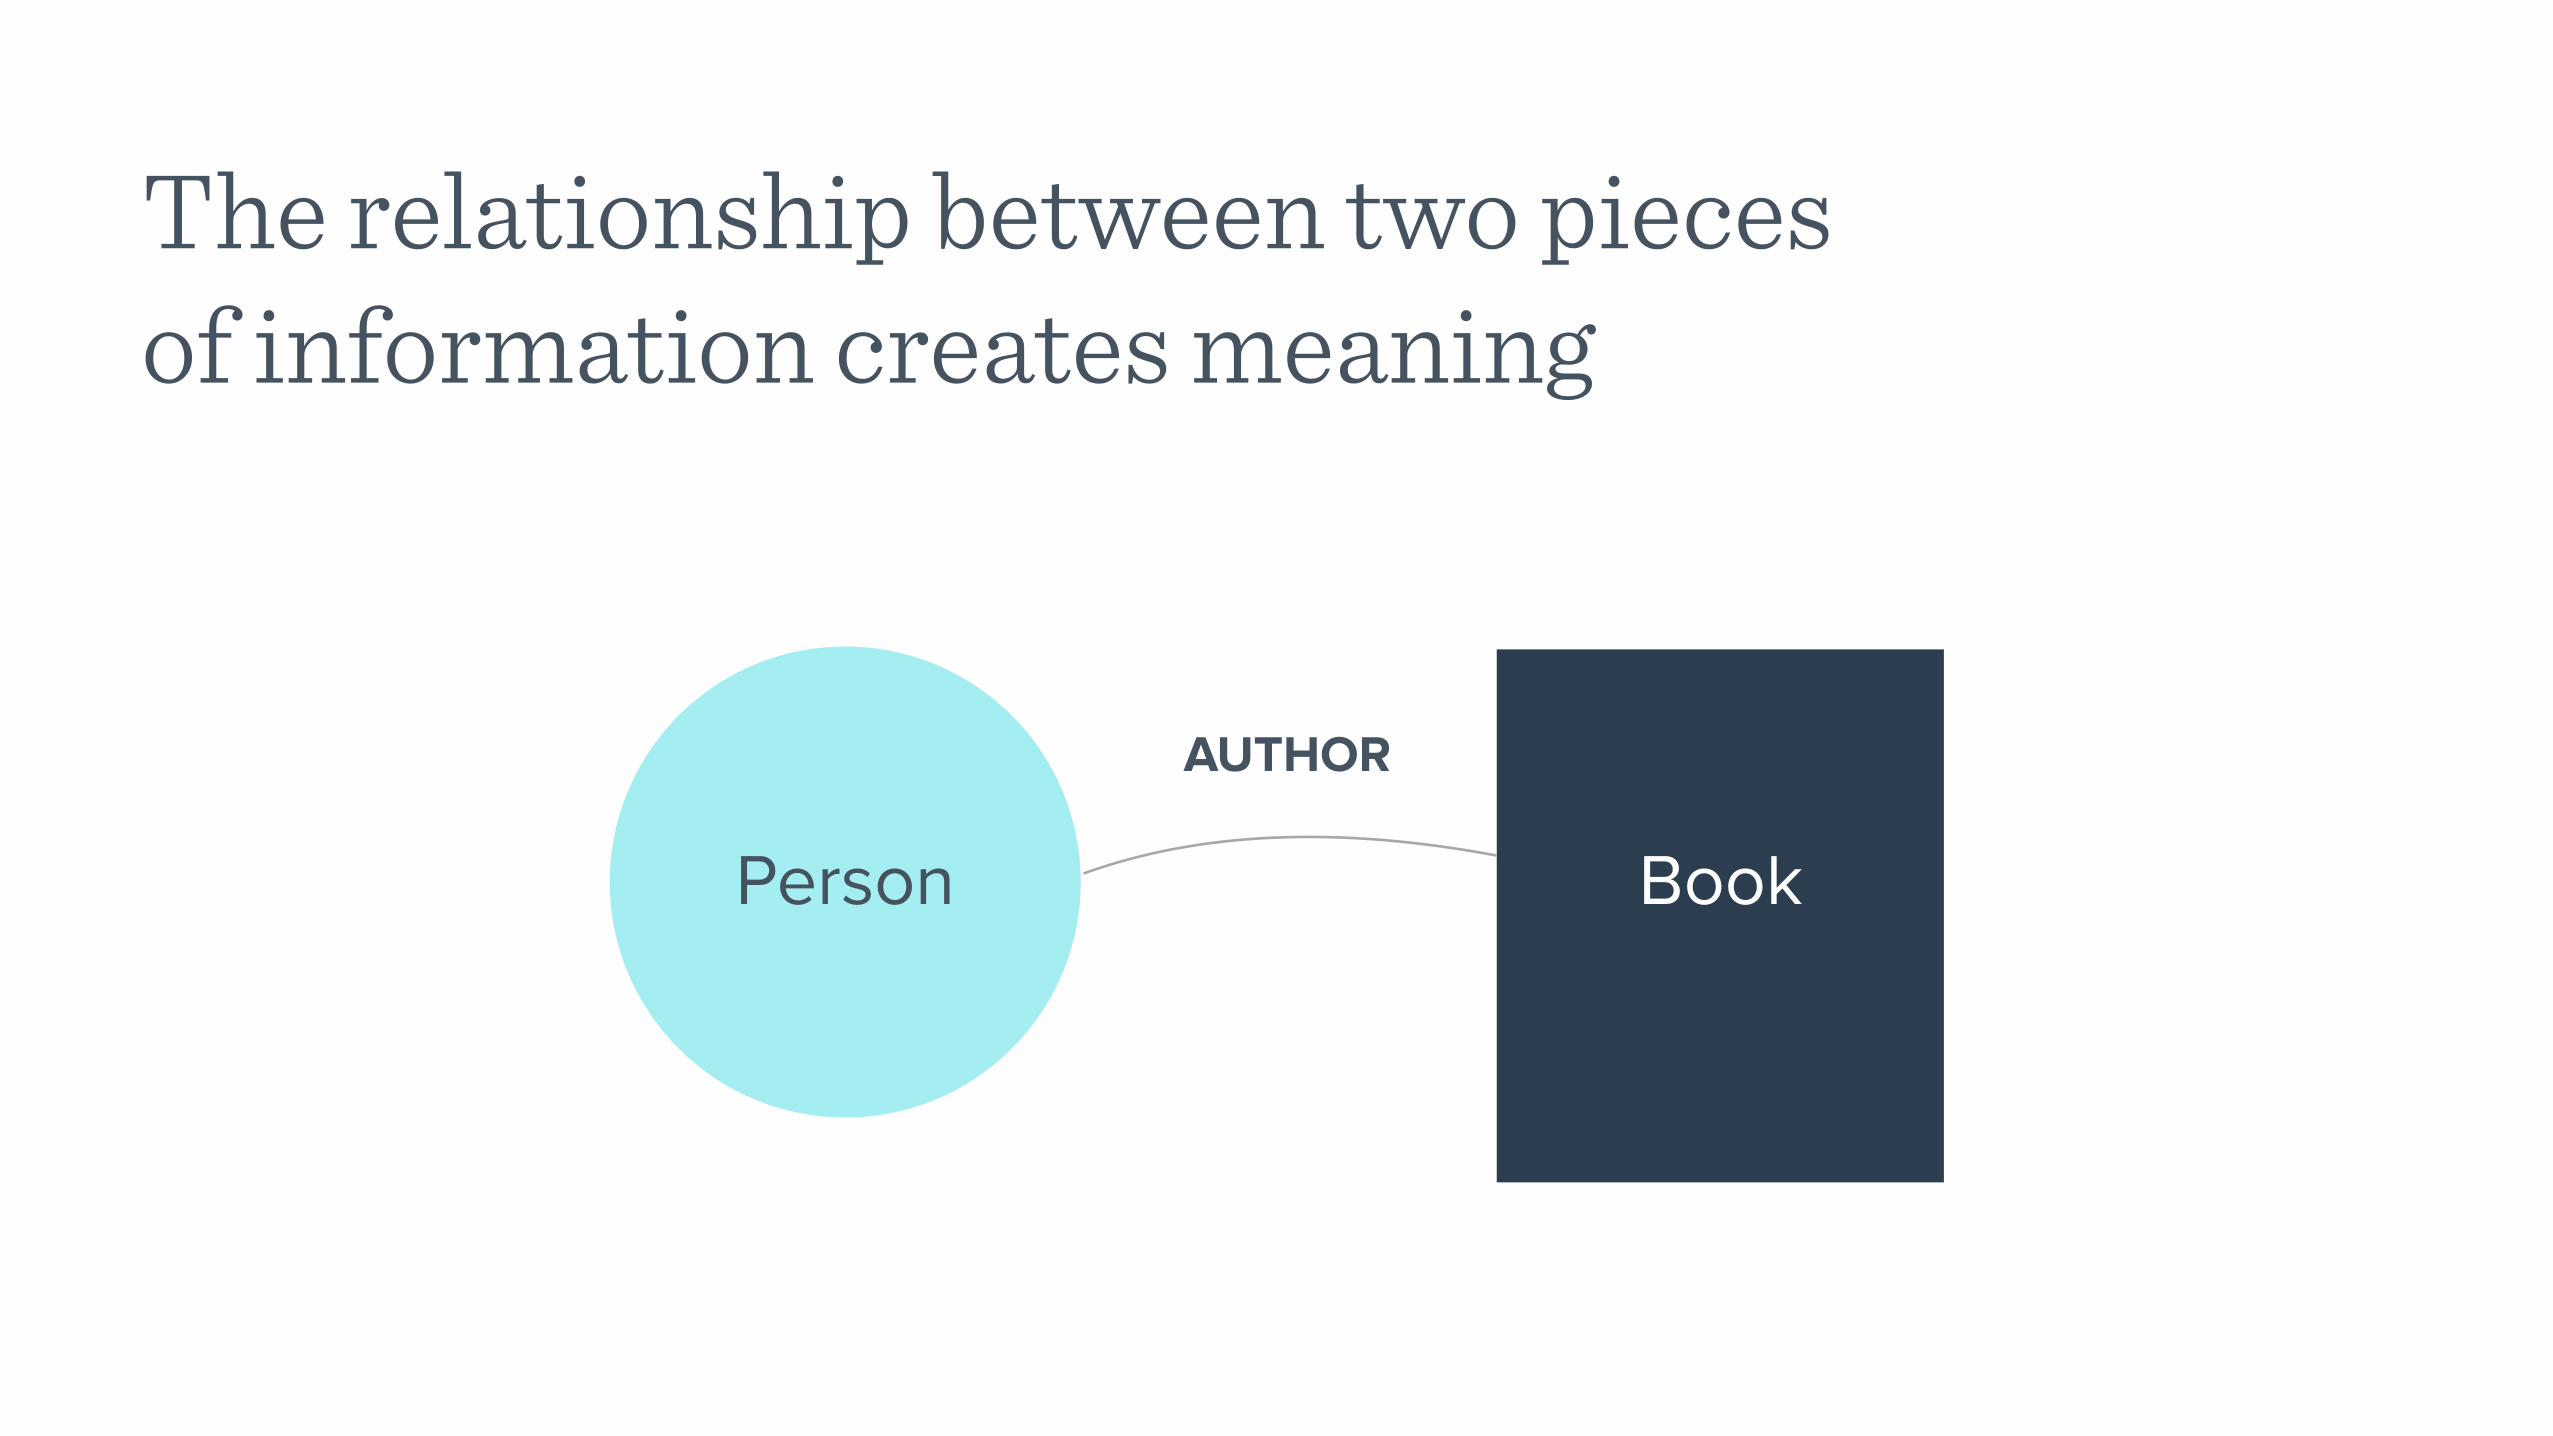
Person Book
AUTHOR
The relationship between two pieces of information creates meaning

Understanding the meaning of the data allow us to define elements that can be designed for visual presentation and for non-visual presentation
Information / Data
Structural Meaning (outputs REST API, JSON, XML, RSS)
Presentation for impaired vision (Screen reader)
Presentation for normal vision
Presentation for motion/interaction
The Meaning Stack
Enhanced presentation of meaning

Information: data at its most basic level. The goal is to create meaning out of the data
Information / Data
The Meaning Stack

Structural Meaning: structuring the data in a meaningful way that outputs semantic data with no user interface
Information / Data
Structural Meaning (outputs REST API, JSON, XML, RSS)
The Meaning Stack

Presentation layers: As we progress through each presentation layer, we can enhance meaning appropriately.
Information / Data
Structural Meaning (outputs REST API, JSON, XML, RSS)
Presentation for impaired vision (Screen reader)
Presentation for normal vision
Presentation for motion/interaction
The Meaning Stack
Enhanced presentation of meaning

InformationThe prerequisite of meaning

Information at its most basic level, without context and meaning
I N F O R M AT I O N / DATA

Conceptual model is a possible output of how we conceptualize the information to understand context and meaning
I N F O R M AT I O N / DATA

Structural MeaningSemantic data with no user interface

Structuring data in a meaningful way to establish structure. A layer separate from the visual presentation
{ ‘metric-id’: “IncRate”, sex: "F", site: "Breast", state: "District of Columbia", race: "NULL", age-range: "NULL", stage: "NULL", value: 141.7, footnote: "NULL" }
{ ‘metricId’: “IncRate”, metricGroup: "Current Averages", displayName: "Incidence rates, 2008-2012", listClassification: "Incidence", listOrder: "0", unitType: "Number", unitDescription: "Per 100,000, age adjusted to the 2000 US standard population", }
S T R U C T U R A L M E A N I N G

When we take the value of 141.7 and relate it to this description, the meaning of the value is revealed
RATE{
‘value: 141.7,
}
{ unitDescription: "Per 100,000, age adjusted to the 2000 US standard population” }
S T R U C T U R A L M E A N I N G

Understanding the structural meaning of our data allow us to enhance each presentation layer in a meaningful way.
S T R U C T U R A L M E A N I N G
Information / Data
Structural Meaning (outputs REST API, JSON, XML, RSS)
Presentation for impaired vision (Screen reader)
Presentation for normal vision
Presentation for motion/interaction
The Meaning Stack
Enhanced presentation of meaning

Visual PresentationVisual design

Every visual element has an assigned purpose to represent the data without obstructing meaning
V I S UA L D E S I G N

Fundamental uses of colors in information design
To label (color as noun)
To measure (color as quantity)
To represent (color as representation)
To decorate (color as beauty)
1
2
3
4
V I S UA L D E S I G N

Flexible color system
Brand colors
Colors tweaked for data visualization by adding saturation and brightness
V I S UA L D E S I G N

Normal Red-green color blindness
The data structures dictate requirements for a color system. At this stage, you can start testing colors using a variety of tools for visual impairments, before any user interface elements are even designed.
V I S UA L D E S I G N

Normal Red-green color blindness
V I S UA L D E S I G N

Tips for choosing colors
Alternate between warm and cool colors to help differentiate elements
When using more than 2 warm or cool colors, add brightness or saturation to distinctly differentiate them
Avoid combining colors that are low in saturation or brightness
1
2
3
V I S UA L D E S I G N

Visual PresentationImplementation

When visual & non-visual presentations align
I M P L E M E N TAT I O N

<svg id="bar-chart" class="bar-chart" aria-labelledby="title"> <title id="title"> Probability of developing cancer bar chart </title> <g id="group-2"> <text class="chart-label"> <tspan>Breast (female)</tspan> </text> <rect class="background-bar"></rect> <rect class="graph-bar"></rect> <text class="chart-value">12.3%</text> <g class="footnote"> <rect class="footnote__background"></rect> <text class="footnote__text"> <tspan>Female breast cancer only</tspan> </text> </g> </g> </svg>
When visual & non-visual presentations align
I M P L E M E N TAT I O N

When visual & non-visual presentations do not align
I M P L E M E N TAT I O N

<svg aria-labelledby="title-664 desc-664" role=”img”> <title id="title-664"> Incidence rate map </title> <desc id="desc-664"> The map data cannot be read by a screen reader, to access this data please view it as a table or a bar graph. If you are not currently in the analysis tool, use the open in analysis tool link. </desc> ( actual svg paths here ) </svg>
I M P L E M E N TAT I O N
When visual & non-visual presentations do not align

Conclusion

Treating accessibility like another breakpoint, an equally important component of responsive design
A need to create meaning out of the data before presenting it
Working together as a team that thinks holistically to integrate accessibility in our entire process
No screen first means1
2
3

Questions that guide our thinking process
What are all the “things” that exist in this project?
How are all the “things” related to each other?
And what meaning is created by those relationships?
Will this presentation layer obstruct or reveal the meaning of the “things”?
1
2
3
4

Special thanks to Zach Kalman

Thanks!

Helpful tools
A11y Project http://a11yproject.com/resources.html
Accessible SVG http://www.sitepoint.com/tips-accessible-svg/
Sim Daltonism https://michelf.ca/projects/sim-daltonism/
NoCoffee Chrome extension