no slide title - hydrographic society€¦ · traditional survey methods have numerous drawbacks to...
TRANSCRIPT
www.fugro.com
HYDROFEST 2011
SITE SURVEYS
Anna Fulop,Chief Geoscientist,Fugro Survey Limited
13 April 2011

www.fugro.com
INTRODUCTION
PRINCIPLES, METHODS AND TOOLS
SITE SURVEY OPERATIONS
RECENT DEVELOPMENTS -AUV SURVEY OPERATIONS
INTERPRETATION AND PRESENTATION
www.fugro.com
Just about anything you need to put on or in the seabed; examples:
– Rig site surveys– Platform site surveys– Pipeline route surveys– Cable route surveys– Field development surveys– Clearance, abandonment and inspection
surveys– Wind farm surveys
What do you need site surveys for?
www.fugro.com
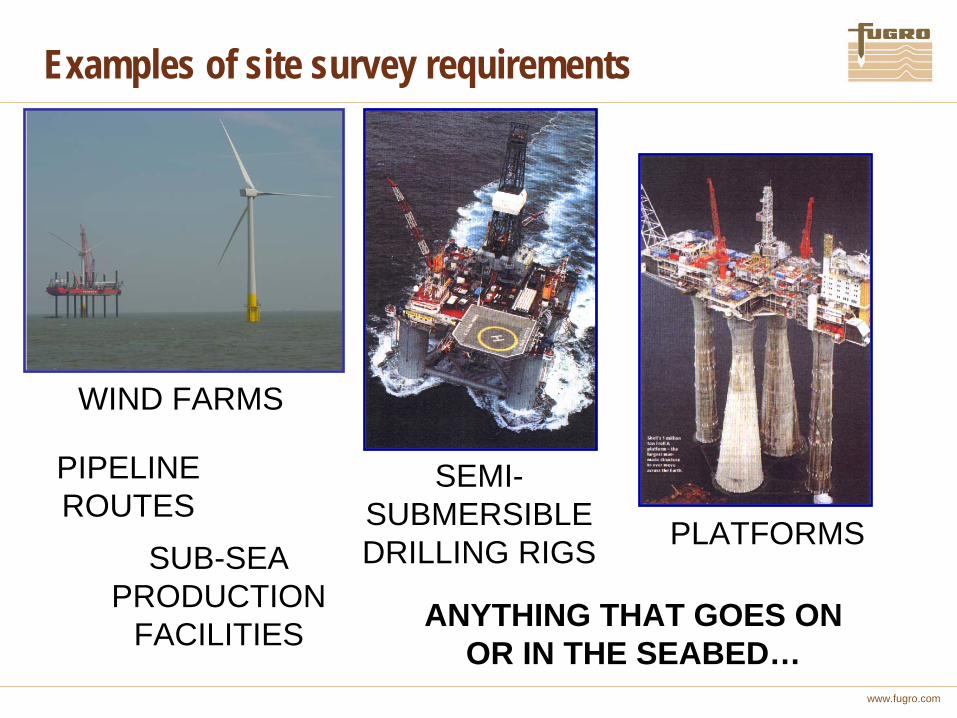
Examples of site survey requirements
WIND FARMS
SEMI- SUBMERSIBLE DRILLING RIGS PLATFORMS
PIPELINE ROUTES
SUB-SEA PRODUCTION
FACILITIES ANYTHING THAT GOES ON OR IN THE SEABED…
www.fugro.com
What are we trying to find out?
– Water depths, seabed relief, seabed gradients
– Obstructions, debris, wrecks, existing installations
– Seabed sediment types– Shallow geology, foundation conditions,
trenching conditions– Geohazards such as shallow gas
What do you need site surveys for?

www.fugro.com
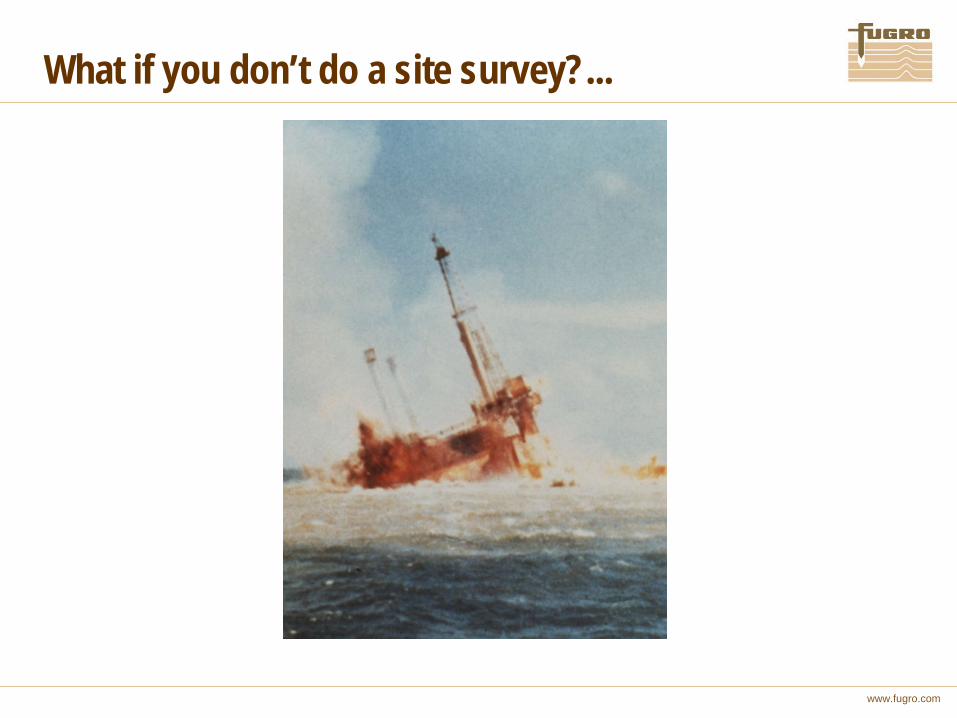
What if you don’t do a site survey?...

www.fugro.com
What if you don’t do a site survey?...

www.fugro.com
What if you don’t do a site survey?...
www.fugro.com
What if you don’t do a site survey?...
www.fugro.com
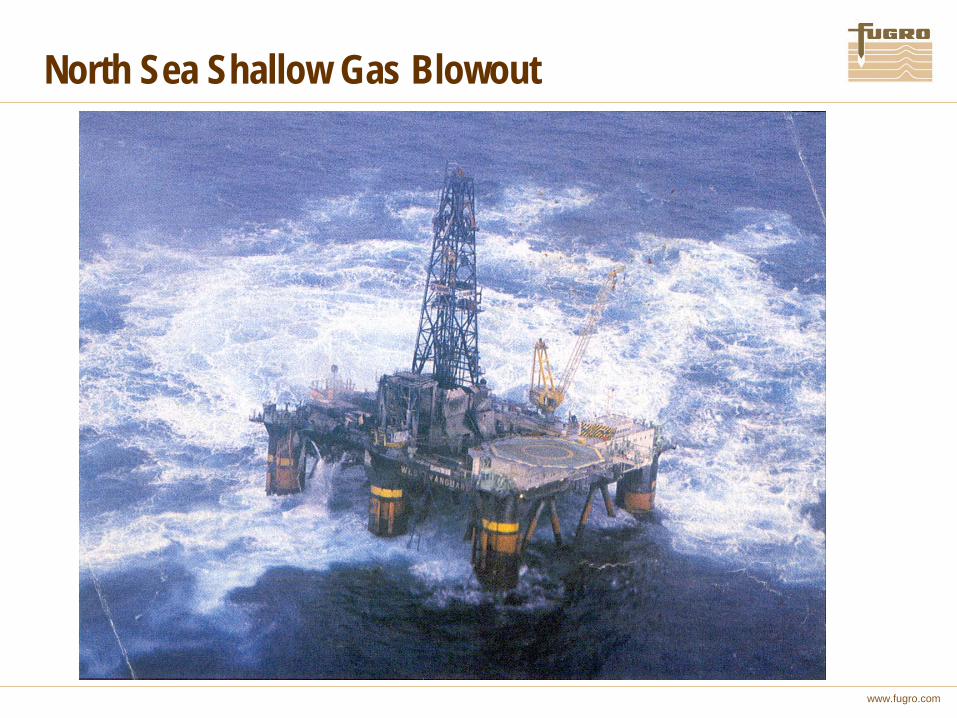
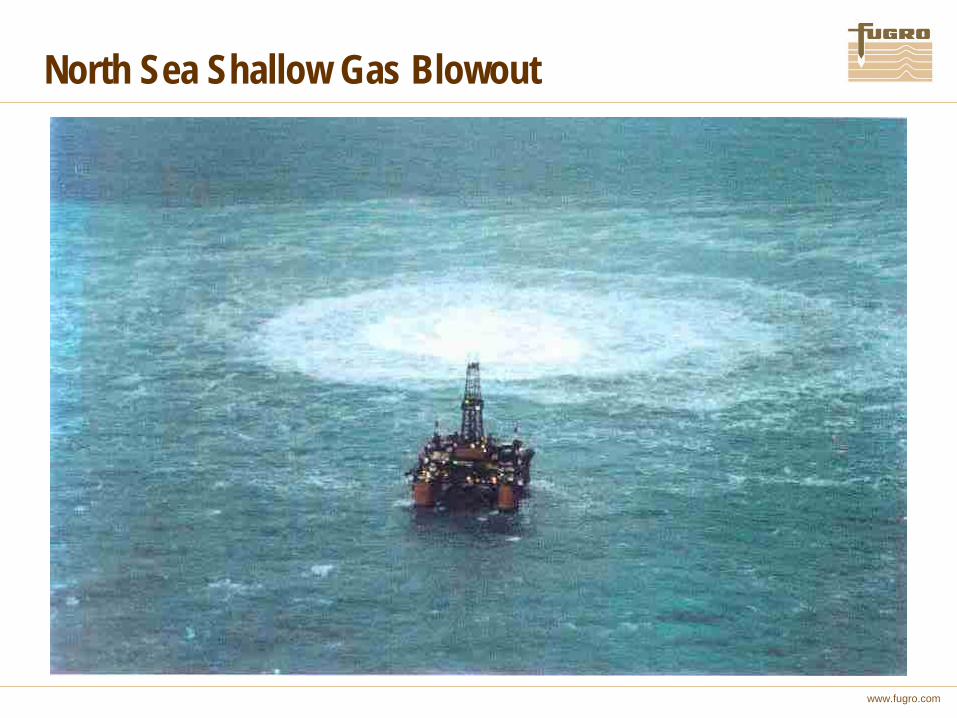
North Sea Shallow Gas Blowout
www.fugro.com
North Sea Shallow Gas Blowout
www.fugro.com
PRINCIPLES, METHODS AND TOOLS

www.fugro.com
Basic Principles
Use of geophysical ‘remote sensing’ techniques
Calibrated by some limited ‘ground truth’ sampling
Virtually always use acoustic methods
www.fugro.com
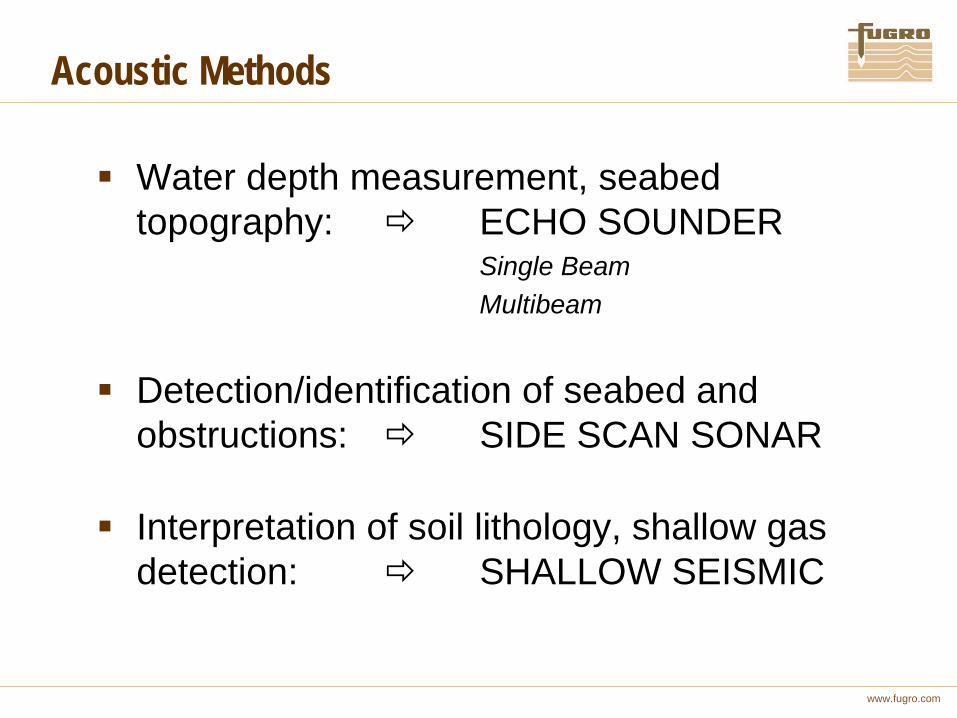
Water depth measurement, seabed topography:
ECHO SOUNDERSingle BeamMultibeam
Detection/identification of seabed and obstructions:
SIDE SCAN SONAR
Interpretation of soil lithology, shallow gas detection:
SHALLOW SEISMIC
Acoustic Methods
www.fugro.com
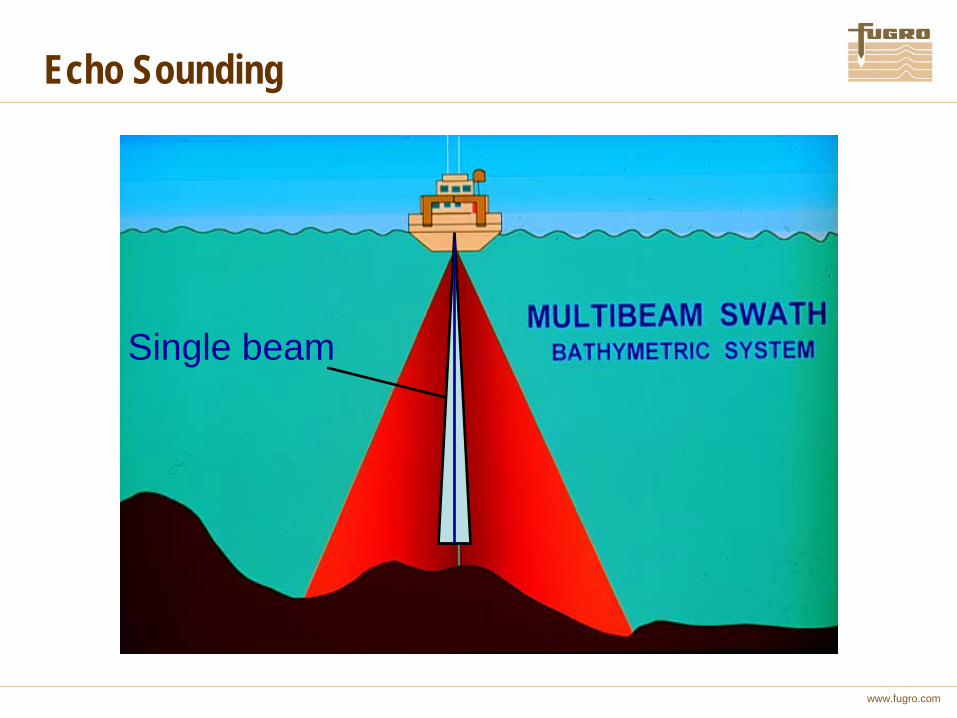
Echo Sounding
Single beam
www.fugro.com
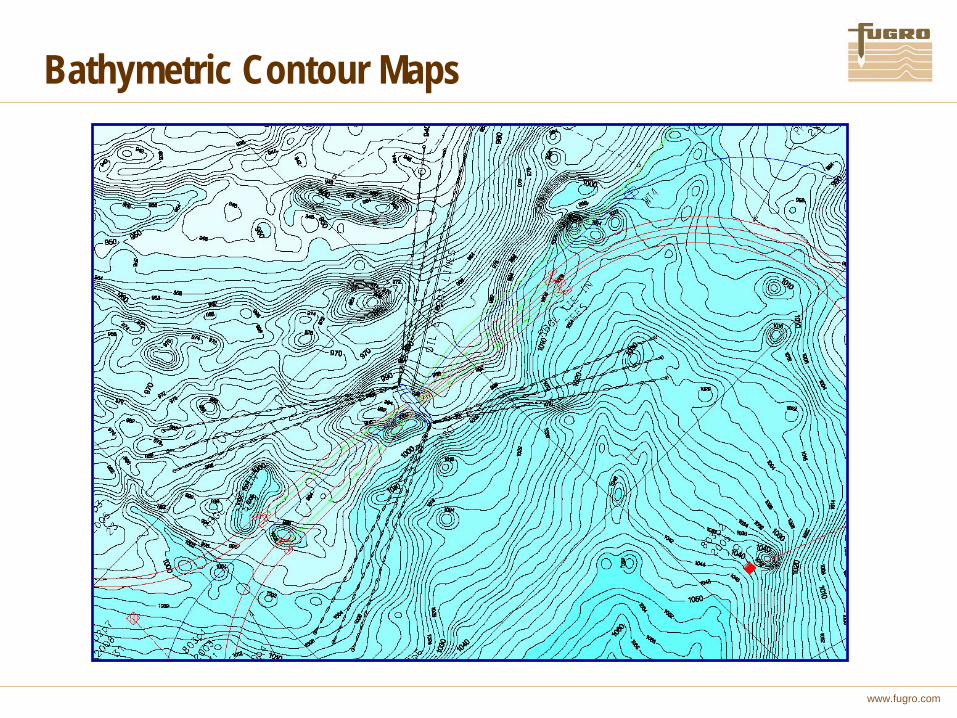
Bathymetric Contour Maps
www.fugro.com
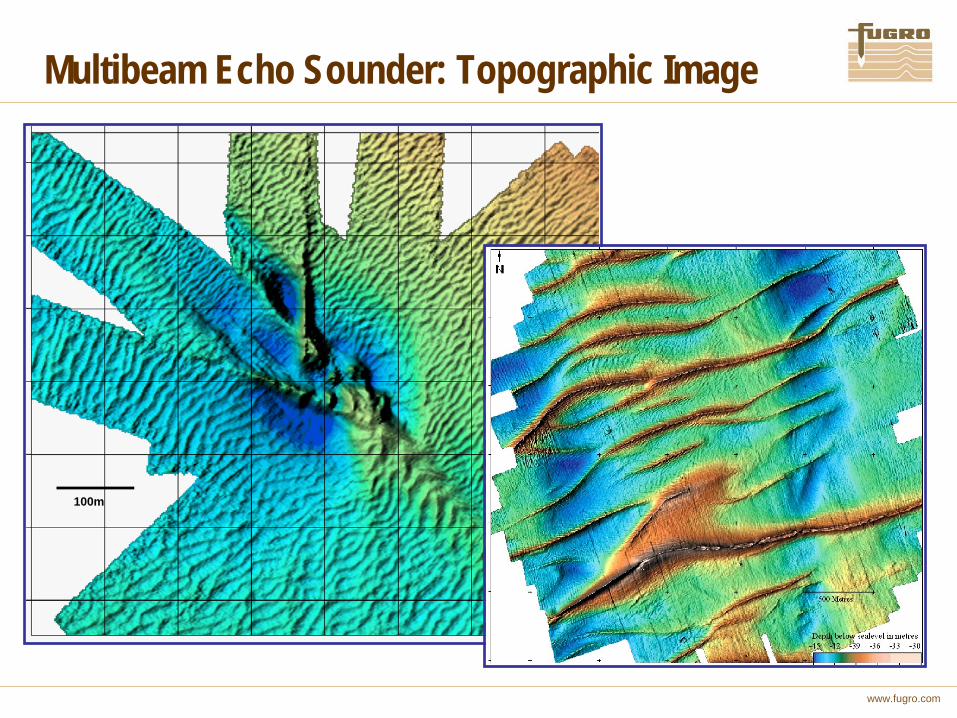
100m
Multibeam Echo Sounder: Topographic Image
www.fugro.com
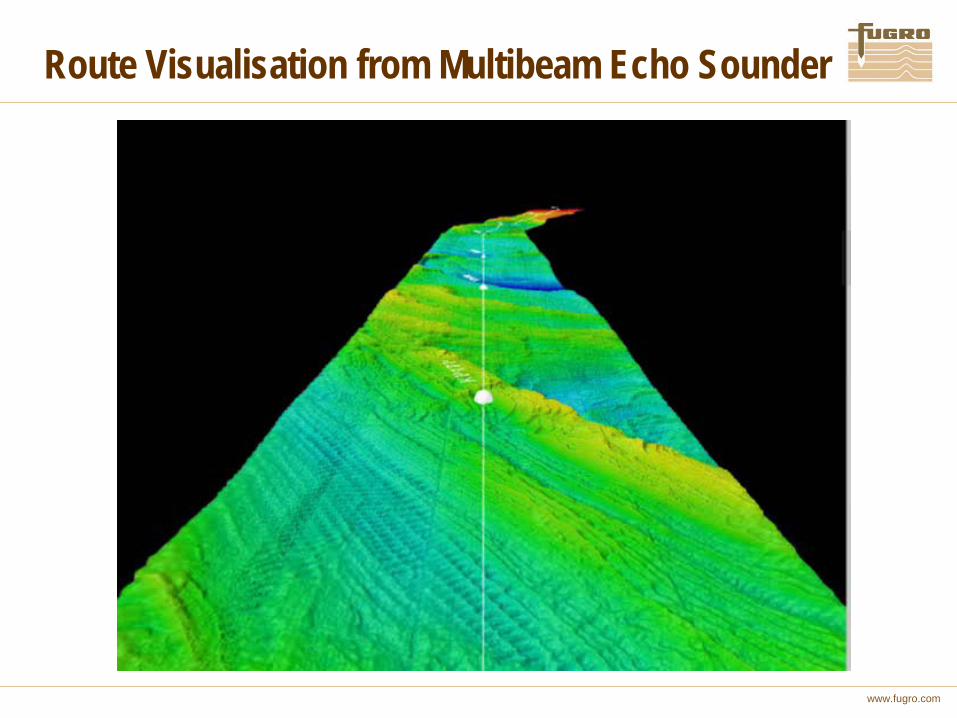
Route Visualisation from Multibeam Echo Sounder
www.fugro.com
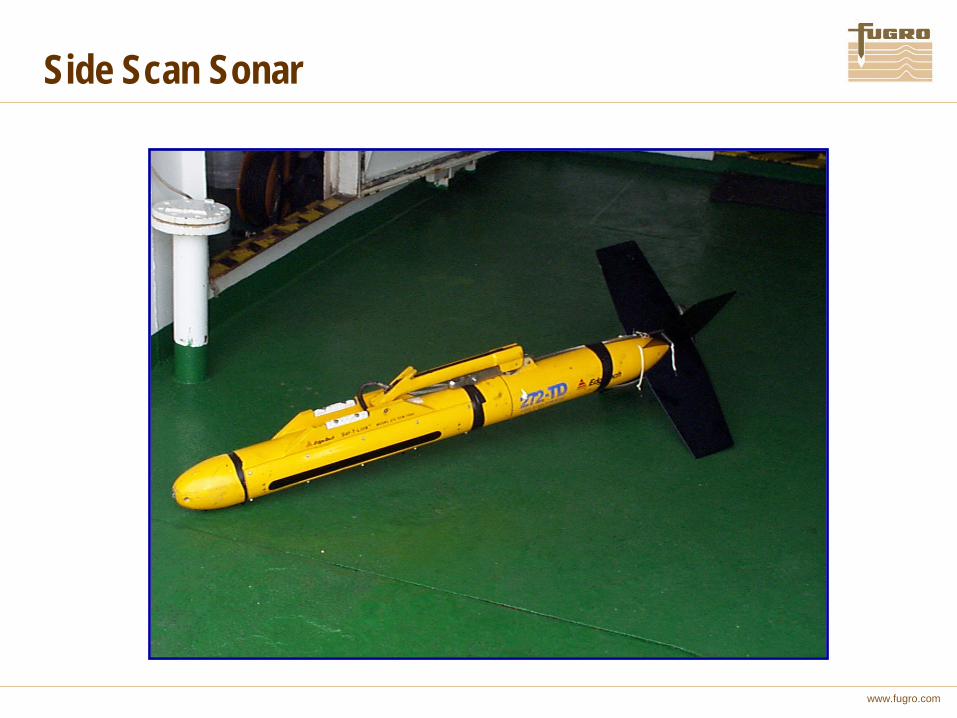
Side Scan Sonar
www.fugro.com
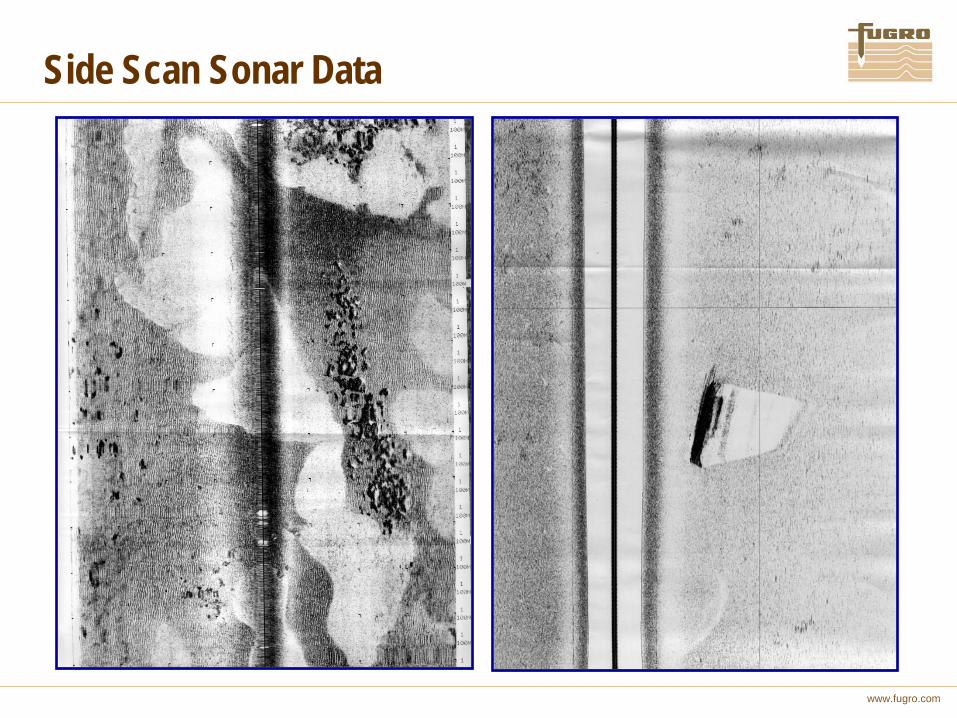
Side Scan Sonar Data
www.fugro.com
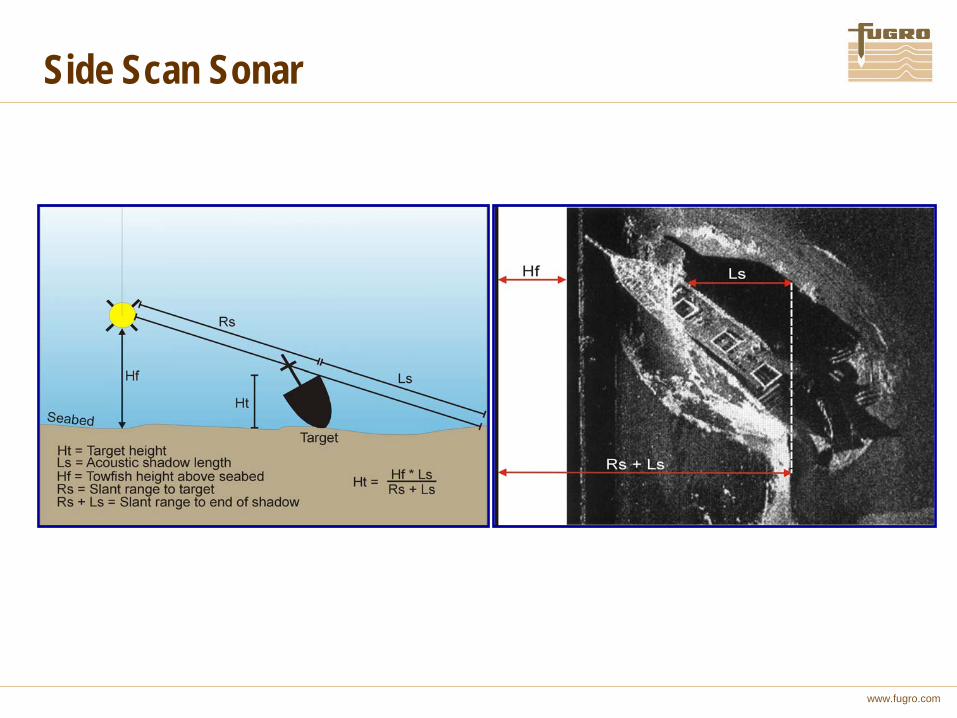
Side Scan Sonar

www.fugro.com
Seismic Systems: Principles
www.fugro.com
Pingers
Boomers
Mini-airguns
Chirps
Sparkers
Single Channel Seismic Methods

www.fugro.com
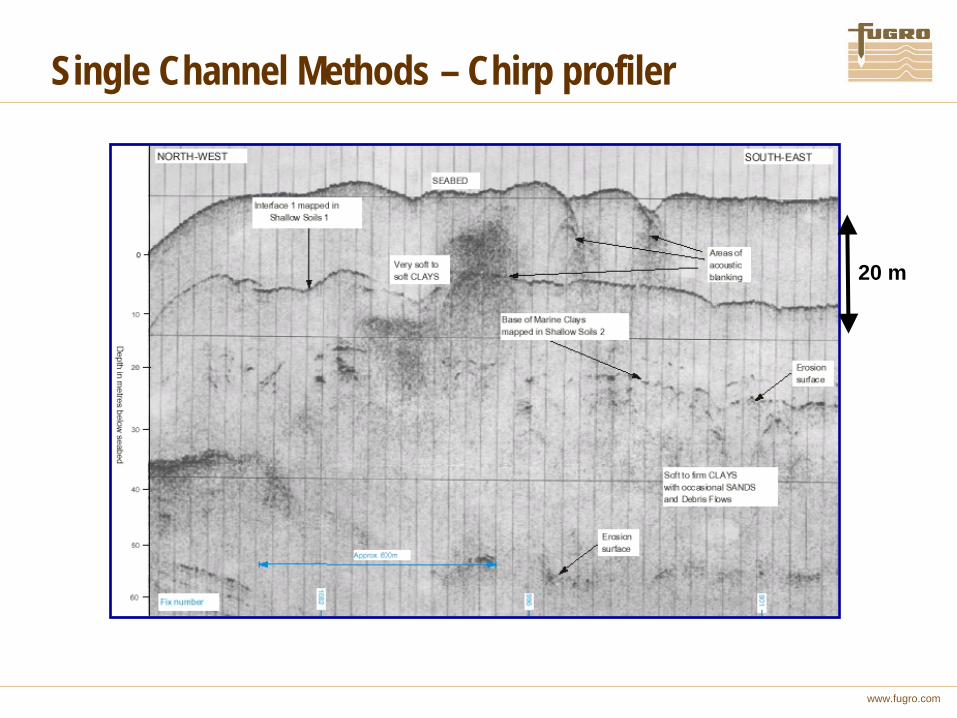
Single Channel Methods – Chirp profiler
www.fugro.com
Single Channel Methods – Chirp profiler
20 m
www.fugro.com
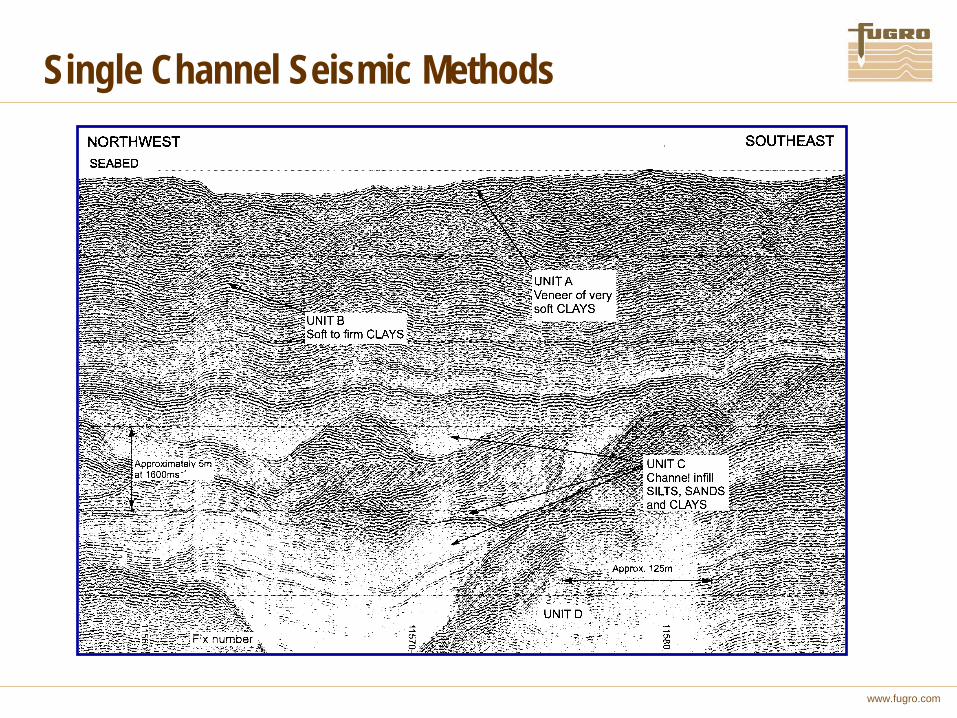
Single Channel Seismic Methods

www.fugro.com
Single Channel Methods – Mini-airgun
30 m
1st seabed multiple
www.fugro.com
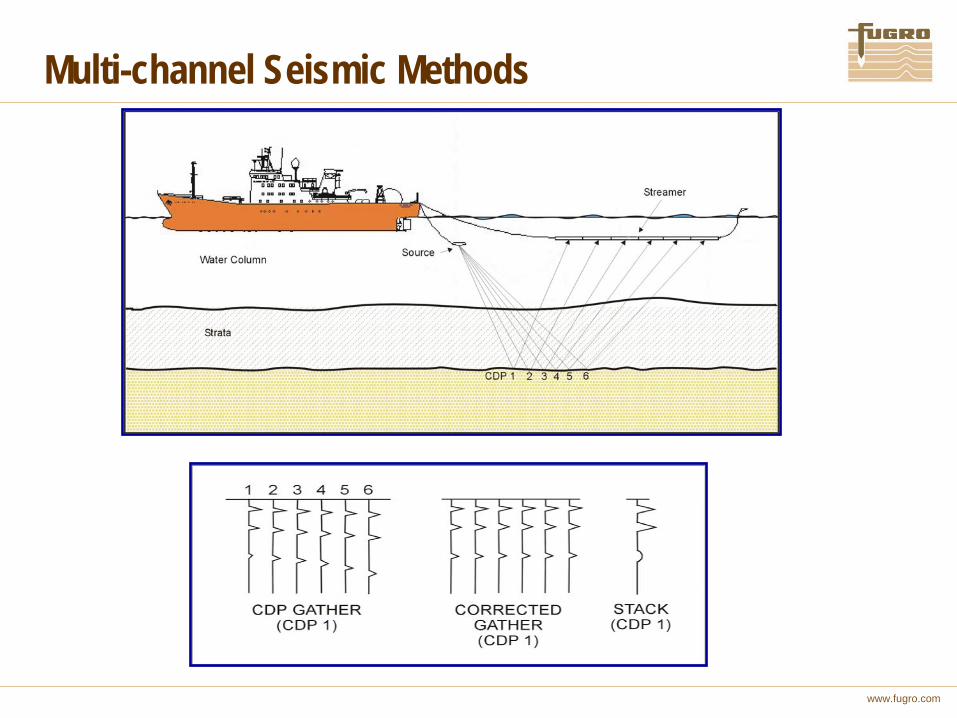
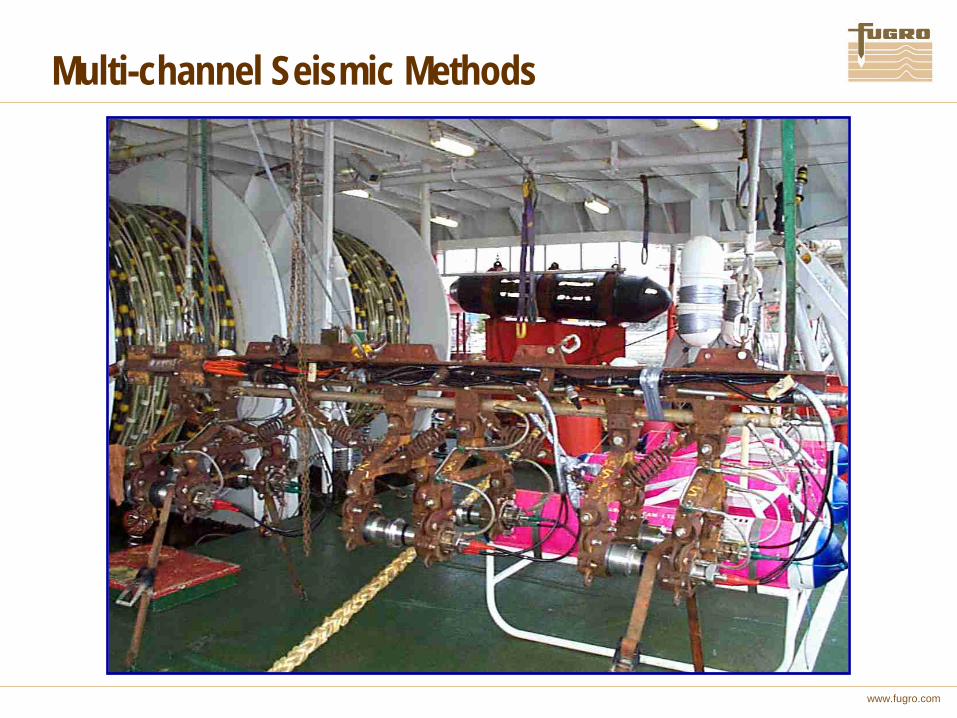
Multi-channel Seismic Methods
www.fugro.com
Multi-channel Seismic Methods
www.fugro.com
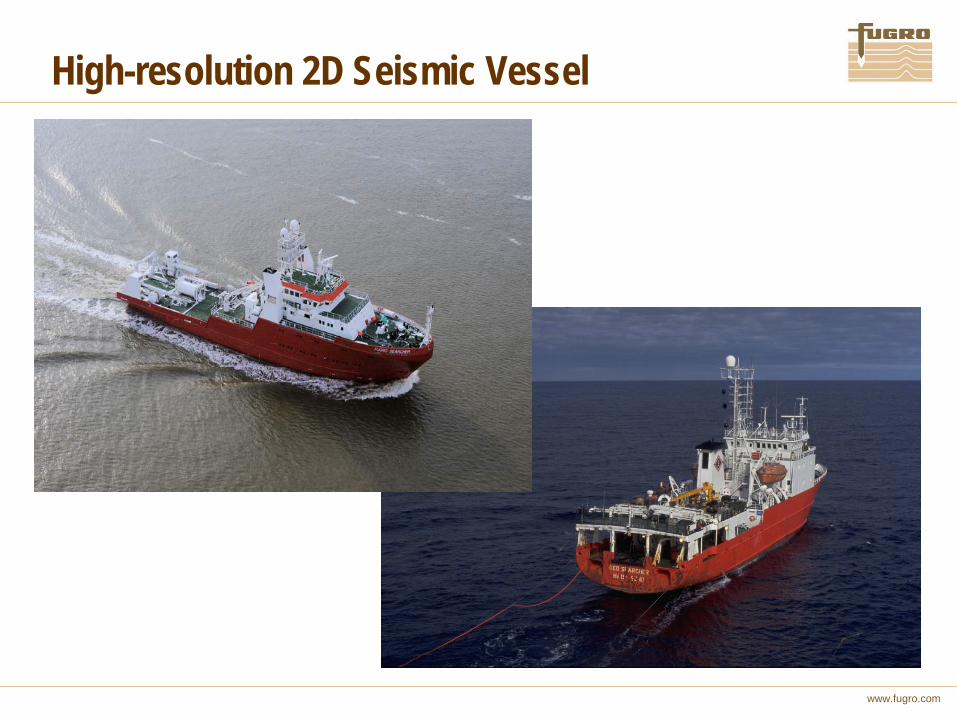
High-resolution 2D Seismic Vessel
www.fugro.com
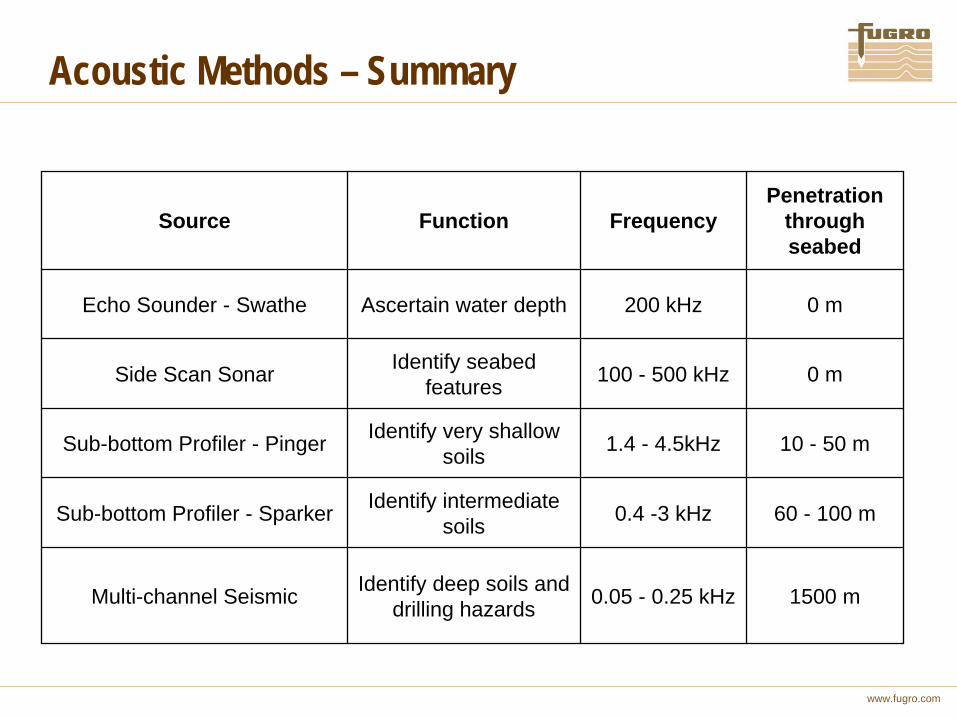
Acoustic Methods – Summary
Source Function FrequencyPenetration
through seabed
Echo Sounder - Swathe Ascertain water depth 200 kHz 0 m
Side Scan Sonar Identify seabed features 100 - 500 kHz 0 m
Sub-bottom Profiler - Pinger Identify very shallow soils 1.4 - 4.5kHz 10 - 50 m
Sub-bottom Profiler - Sparker Identify intermediate soils 0.4 -3 kHz 60 - 100 m
Multi-channel Seismic Identify deep soils and drilling hazards 0.05 - 0.25 kHz 1500 m

www.fugro.com
Grab Samplers
Gravity Corers
Vibrocorers
Cone Penetrometers
Boreholes
Geotechnical Sampling and Testing
www.fugro.com
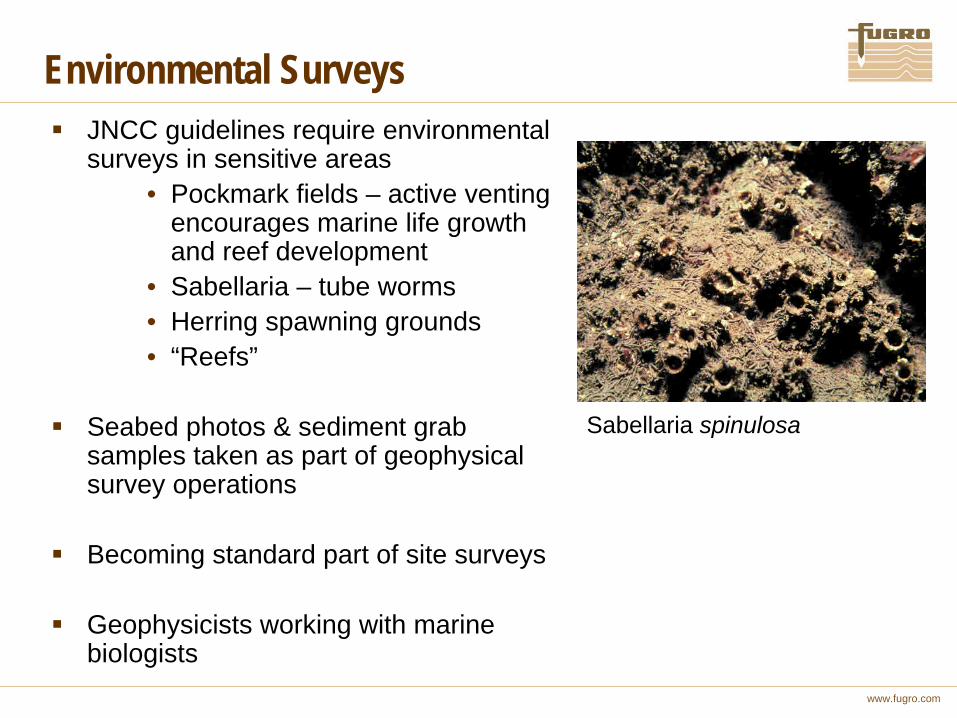
Environmental Surveys
JNCC guidelines require environmental surveys in sensitive areas
• Pockmark fields – active venting encourages marine life growth and reef development
• Sabellaria – tube worms• Herring spawning grounds• “Reefs”
Seabed photos & sediment grab samples taken as part of geophysical survey operations
Becoming standard part of site surveys
Geophysicists working with marine biologists
Sabellaria spinulosa
www.fugro.com
SITE SURVEYOPERATIONS
www.fugro.com
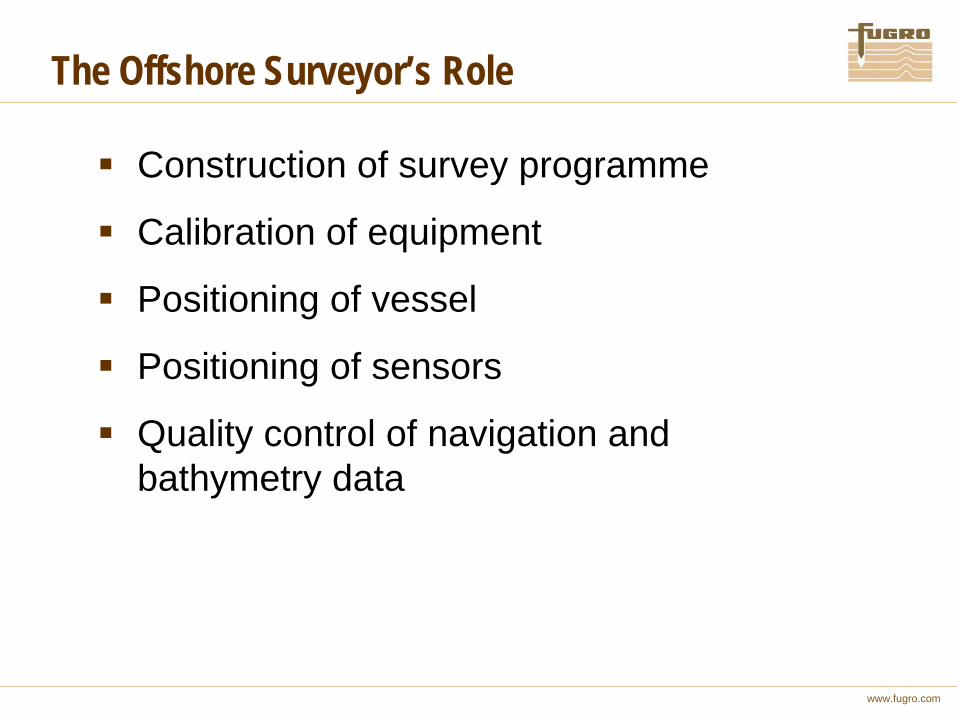
Construction of survey programme
Calibration of equipment
Positioning of vessel
Positioning of sensors
Quality control of navigation and bathymetry data
The Offshore Surveyor’s Role
www.fugro.com
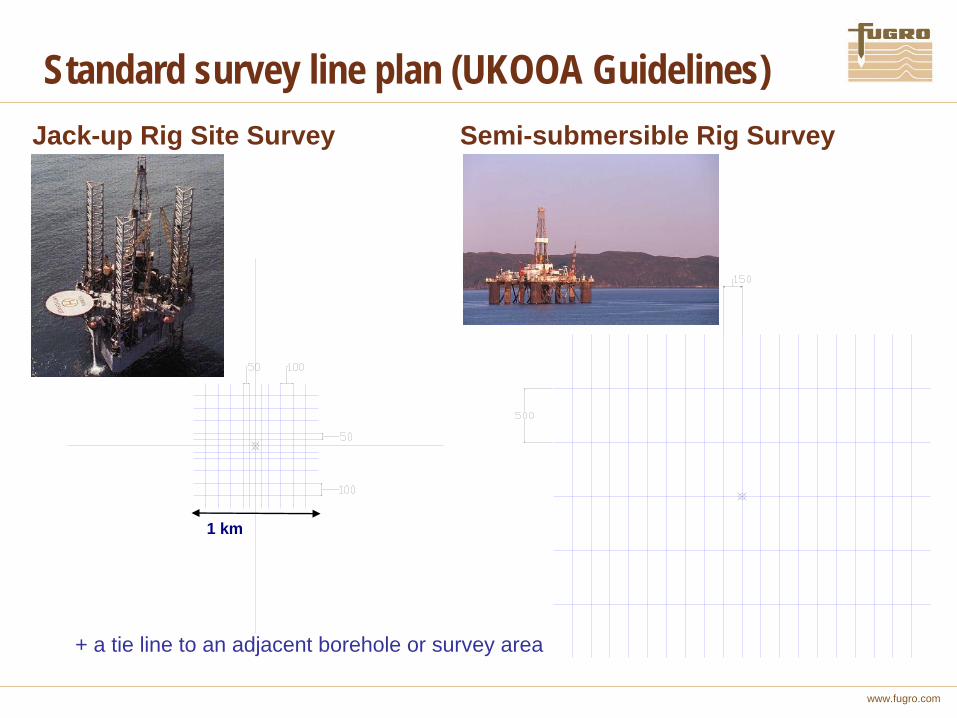
Standard survey line plan (UKOOA Guidelines)
1 km
+ a tie line to an adjacent borehole or survey area
Semi-submersible Rig SurveyJack-up Rig Site Survey
www.fugro.com
RECENT DEVELOPMENTS
AUV SURVEYS
www.fugro.com
The Deep Water Solution
Traditional survey methods have numerous drawbacks to the acquisition of geophysical data in deep water areas
For deep water areas better resolution and better positioning is needed
The survey industry’s solution:
The Autonomous Underwater Vehicle (AUV)

www.fugro.com
Fugro’s “Echo Surveyor” AUV
Kongsberg HUGIN 3000.
Semi-autonomous vehicle independently powered and controlled (cable free).
Depth rated to 3000 metres.
Aided Inertial Navigation System provides extremely accurate positioning.
Positional accuracy of the AUV is less than 5 metres, significantly better than towed systems.
AUV Operations
www.fugro.com
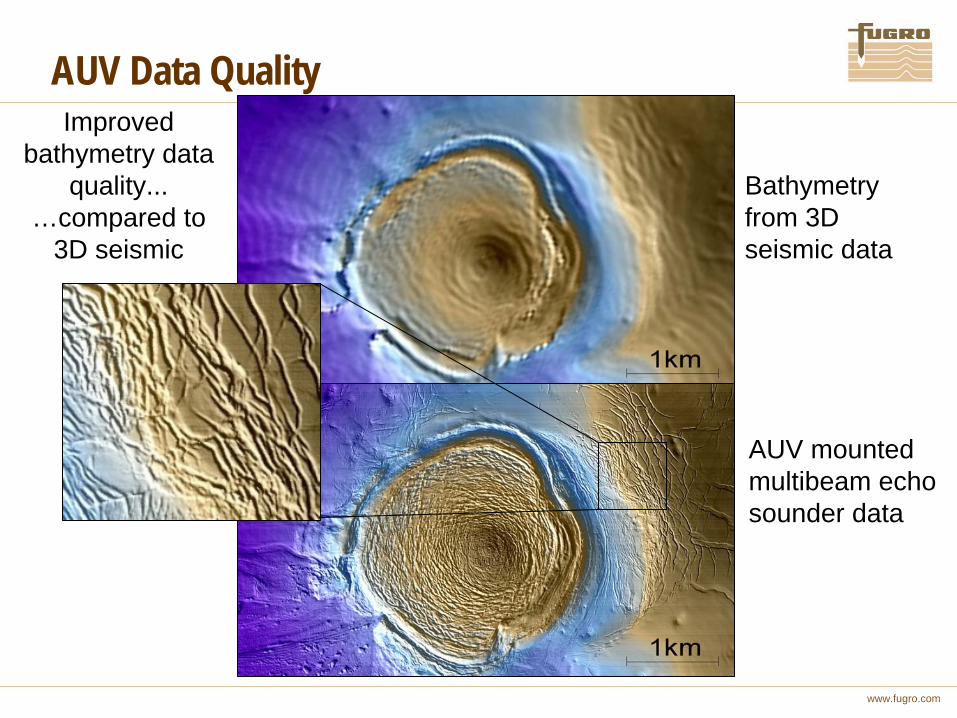
AUV Data Quality
Bathymetry from 3D seismic data
AUV mounted multibeam echo sounder data
Improved bathymetry data
quality... …compared to
3D seismic
www.fugro.com
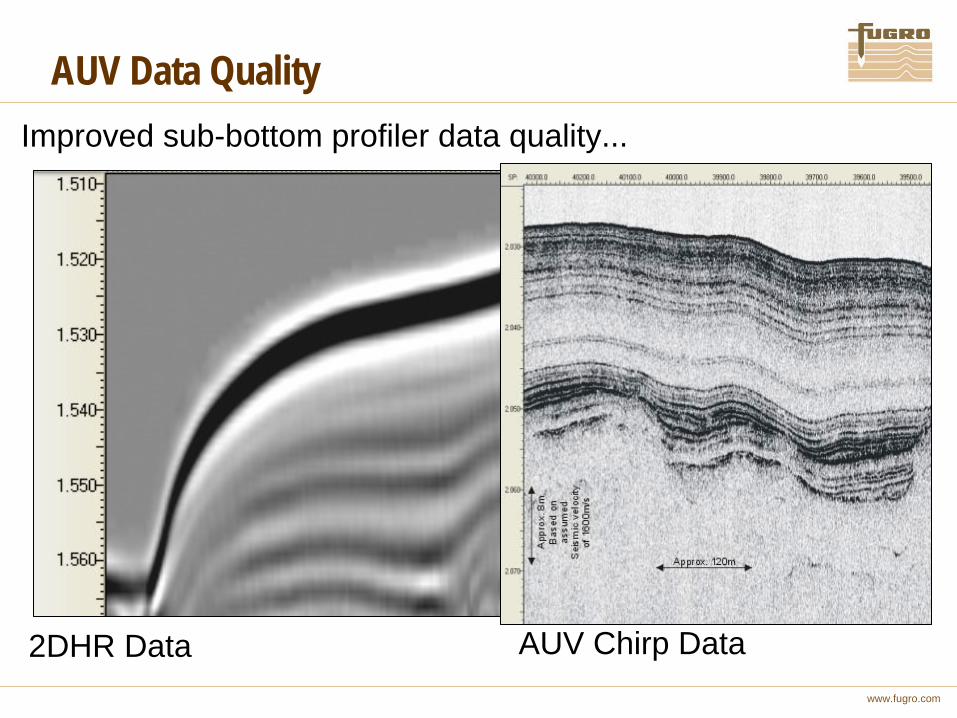
AUV Data QualityImproved sub-bottom profiler data quality...
2DHR Data AUV Chirp Data

www.fugro.com
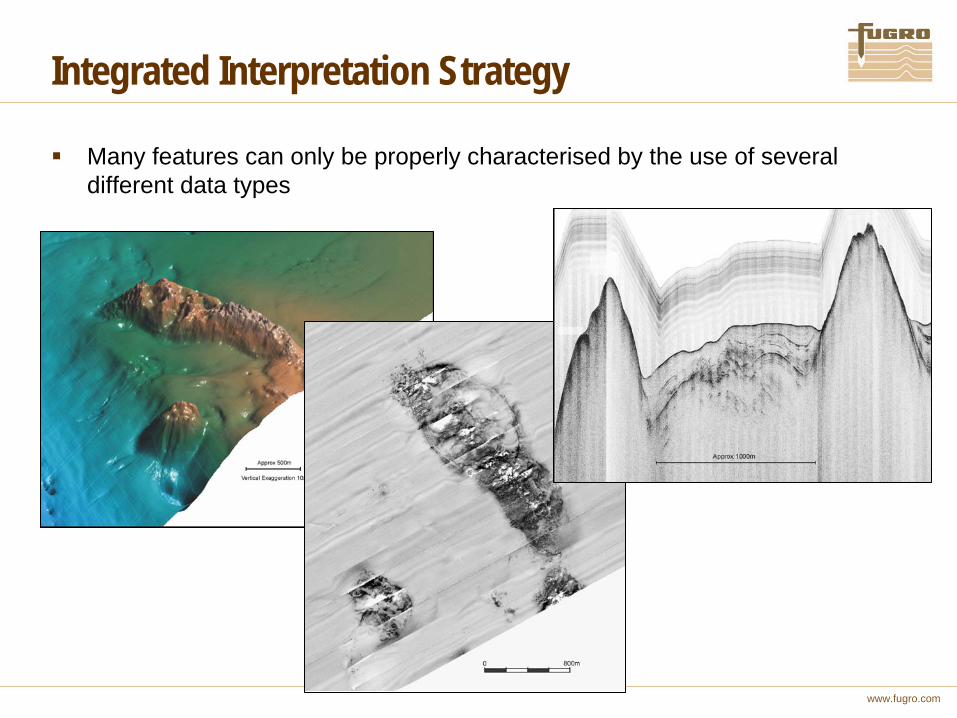
Integrated Interpretation Strategy
Bring together all data types and background information together on one platform – SMT Kingdom Suite
SMT
Multi-layer Sonar Mosaics
Shaded Relief Bathymetry
Chirp
2DHR / 3D
Contoured BathymetryCultural Data
www.fugro.com
Integrated Interpretation Strategy
Many features can only be properly characterised by the use of several different data types

www.fugro.com
INTERPRETATION AND
PRESENTATION
www.fugro.com
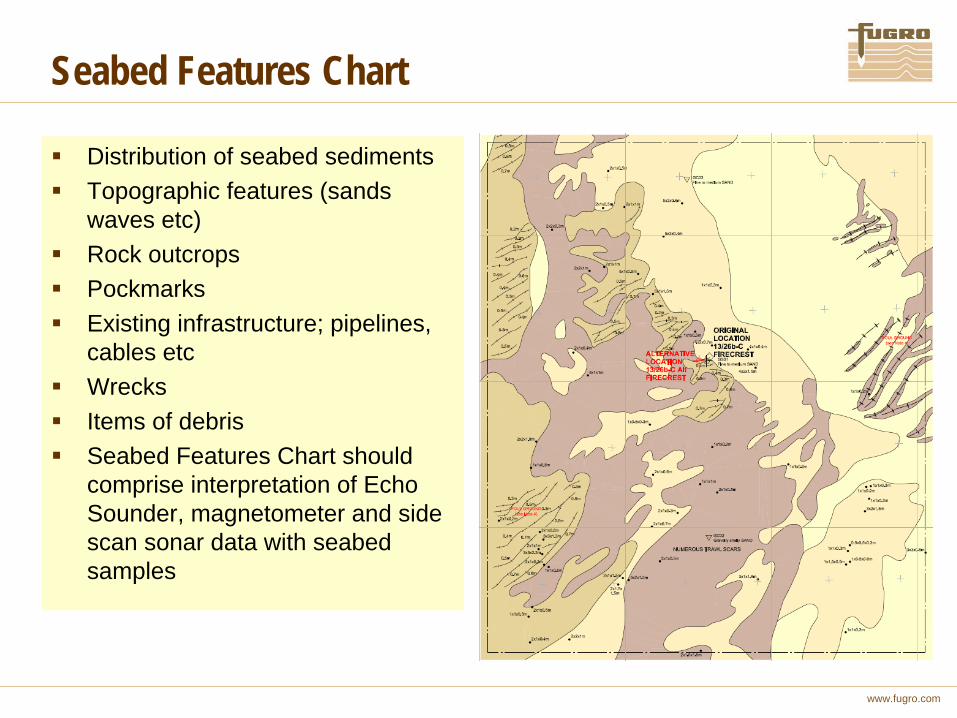
Seabed Features Chart
Distribution of seabed sediments
Topographic features (sands waves etc)
Rock outcrops
Pockmarks
Existing infrastructure; pipelines, cables etc
Wrecks
Items of debris
Seabed Features Chart should comprise interpretation of Echo Sounder, magnetometer and side scan sonar data with seabed samples
www.fugro.com
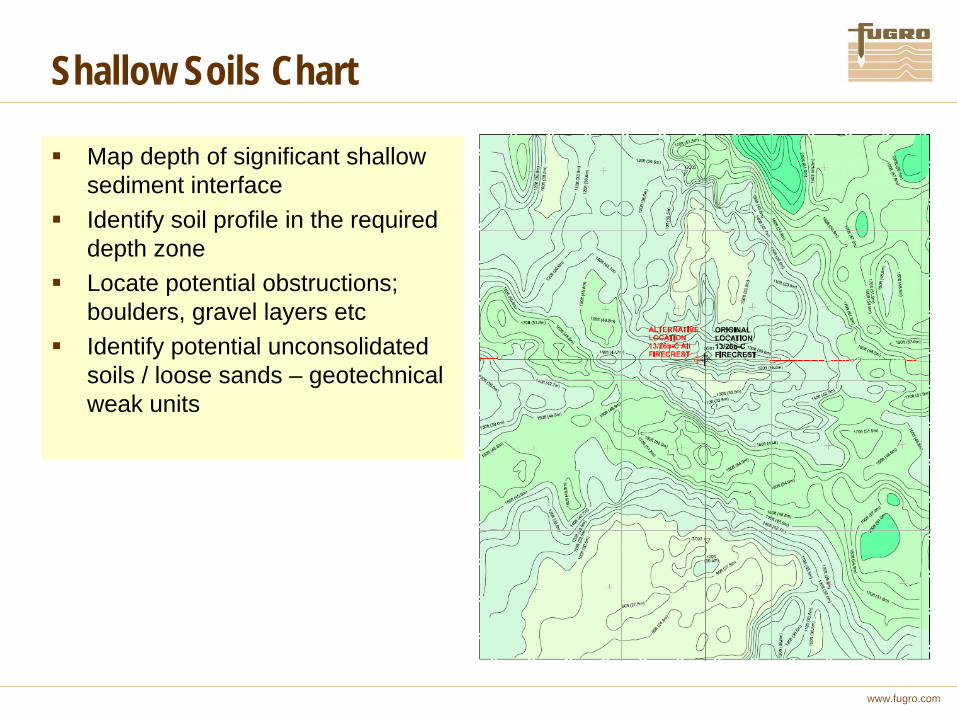
Shallow Soils Chart
Map depth of significant shallow sediment interface
Identify soil profile in the required depth zone
Locate potential obstructions; boulders, gravel layers etc
Identify potential unconsolidated soils / loose sands – geotechnical weak units
www.fugro.com
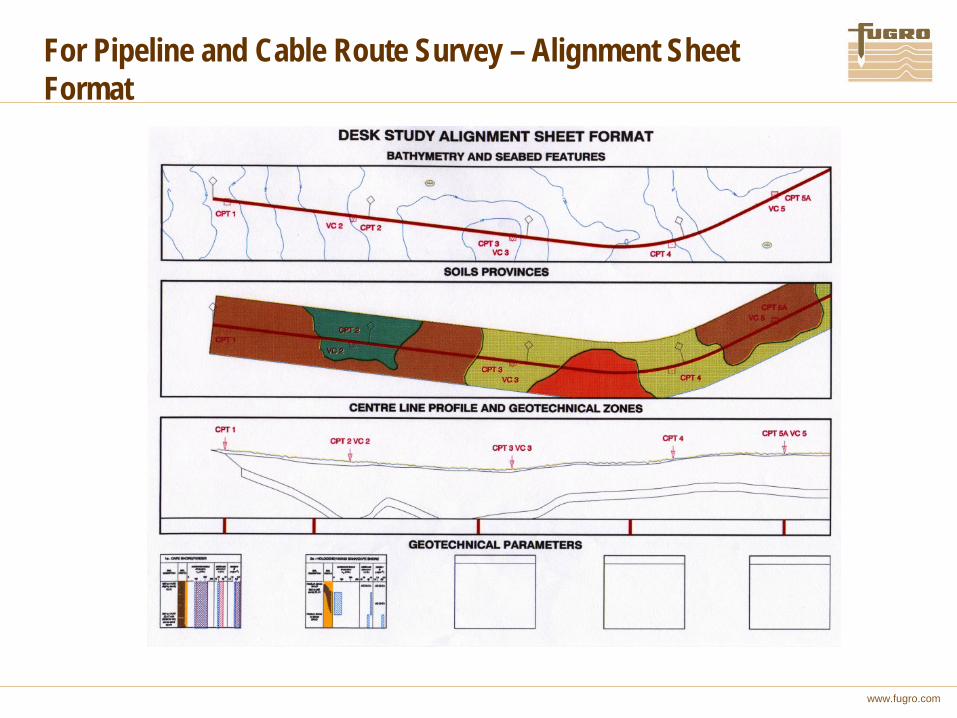
For Pipeline and Cable Route Survey – Alignment Sheet Format
www.fugro.com
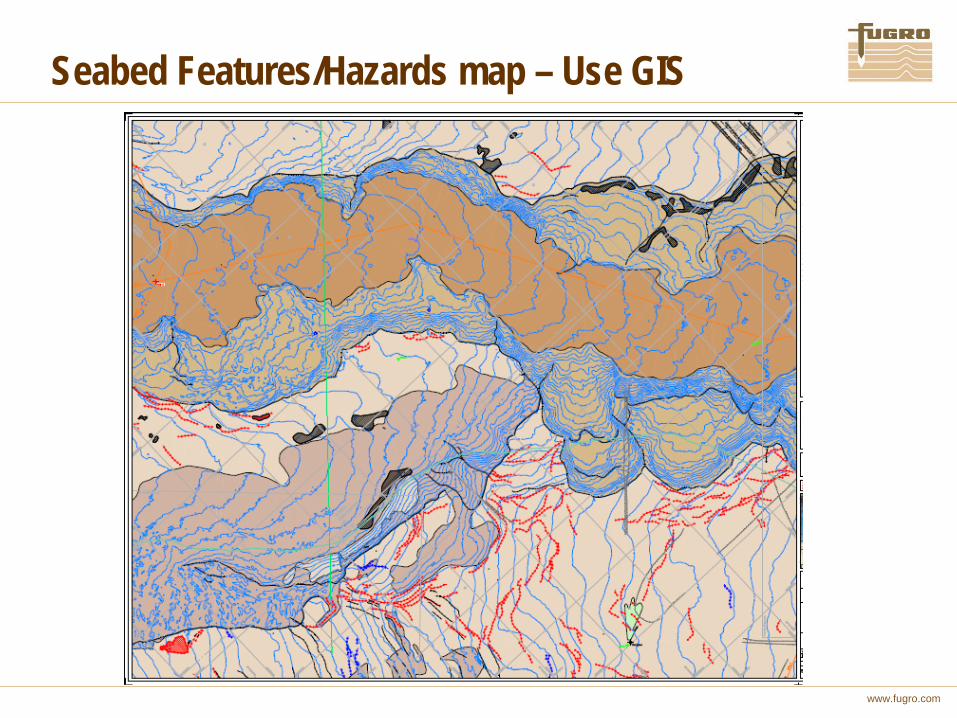
Seabed Features/Hazards map – Use GIS

www.fugro.com
Thank You