noaa accoustic sound in water.pdf
TRANSCRIPT

8/14/2019 NOAA accoustic sound in water.pdf
http://slidepdf.com/reader/full/noaa-accoustic-sound-in-waterpdf 1/32
Serial No. 278
D E P A R T M E N T O F C O M M E R C E
U. S. COAST AND GEODETIC SURVEY
E. LESTER JONES, DIRECTOR
VELOCITY OF SOUND INSEA WATER
Commander N. H. HECK
U. S. Coast and Geodetic Survey
and
Ensign JERRY H. SERVICE
U. S. Coaat and Geodetic Surrey
Special Publication No. 108

8/14/2019 NOAA accoustic sound in water.pdf
http://slidepdf.com/reader/full/noaa-accoustic-sound-in-waterpdf 2/32
National Oceanic and Atmospheric Administration
ERRATA NOTICE
One or more conditions of the origina l docum ent may affect the quality of the image, such
as:
Discolored pages
Faded or light ink
Binding intrudes into the text
This has been a co-operative project between the NOA A Central Library and the Climate
Database M odernization Program, National Climate Data Center (NCD C). To view the
original docum ent, please contact the NOAA Central Library in Silver Spring, MD at
(30 1) 7 13-2607 x124 o r www.reference@,nodc.noaa.gov.
LASON
Imaging Contractor12200 Kiln Court
Beltsville, MD 20704- 1387
January 19,2007

8/14/2019 NOAA accoustic sound in water.pdf
http://slidepdf.com/reader/full/noaa-accoustic-sound-in-waterpdf 3/32
8/14/2019 NOAA accoustic sound in water.pdf
http://slidepdf.com/reader/full/noaa-accoustic-sound-in-waterpdf 4/32
C O N T E N T S
Introduction-- - - - - - - - - - - - __ - - - - -. . . .. .. .. - - .. .. ~ - - - - - - - - - - - - - - - - -
RBsum6 of existing information on velocity of sound- - - - - ..- - . - - - - - - - - -.
Theory- - - - . .. - - - - - - _ _ _ - - - - - .. . .-. - - - - - - - - - - - ... - - - - - - - - - - - .Method ol preparing velocity tables. ~ - - - - . - - . - - - . - - - - - - -
Adiabatic corrections t o velocity. . ~ .. . . . .. - - .. . . . - . - - .
Accuracy of velocity tnhlc No. 13 _ _ _ _ _ r _ _ _ _ _ _ _ _ - _ _ _ _ _ _ _ _ _ _
CornpariHon of computed velocities with directly niertsured vclocit iex- - -Comparison of surface vclocit,ies_.- - - - - - - - - - - - - - - - - - - - - - - -
Comparison of vertical velocities to great depths- - - - - - - - - - - - - - - - - - .Sources of e r r o r _ _ - _ - - - - - _ - - _ - - - - - - - - - - - - - - - - - - - - - - - - - - - - - - - - - - - - . -Applicability of computed velocities t o acoustic sounding--_- - - - - - - - - - -
ILLUSTRATIONS
1. Map showing oceanographic cruise of steamer G u id e - -____.- - _ _ - - _ _
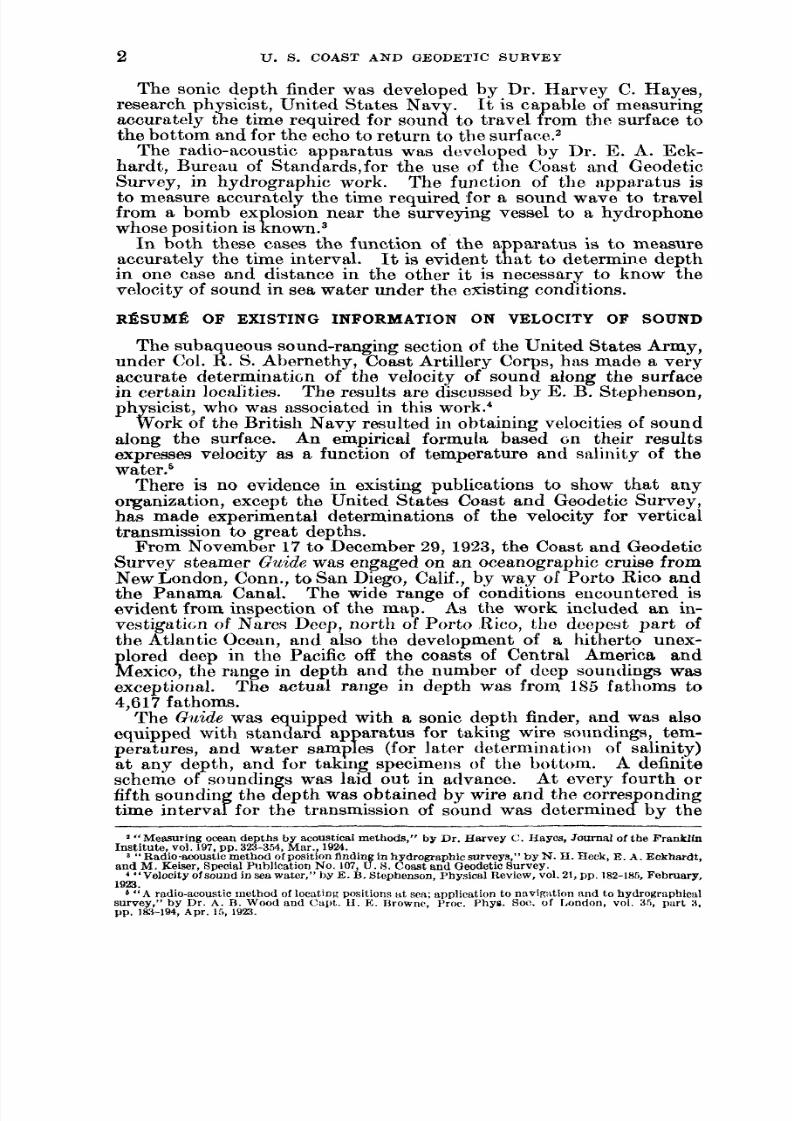
2. Curves showing variation of M and with depth-________.
_ - _ - _ _ _ _3. Curves phowing variation of vclocity with depth, temperature, and
TABLES
1. Specific volume of sea watcr for all depths, temperatures, and salinities-2. Base values of M _ _ _ _ - _ _ - _ _ _ _ - - _ _ _ _ _ _ _ _ _ _ _ _ _ _ _ __ _ _ _ _ _ _ _ _ - _ _ _ _ _ _3. Salinity corrections to M _ _ _ _ _ _ _ _ _ _ _ _ _ _ _ _ _ _ _ - _ _ _ _ _ _ _ _ _ _ _ _ _ _ _ _ _ _ _ _4. Temperature corrections t o M _ _ _ _ _ _ _ _ _ _ _ _ _ _ _ _ _ _ _ _ _ _ _ _ _ _ _ _ _ _ _ _ _ _ _6. M for all depths, temperatures, a nd salinities- - - - _ _ - - _ _ _ _ _ _ _ _ _ _ _ _6-10. Tables involved in the adiabatic corrections to velocity - - - - - - - - - - -
11. Computed velocities for soundings of steamer G u i d e - - - - - - - - - - - - - -12. Comparison of measured with computed velocities- - - - - - - - - - - - - -
13. Velocity of sound in sea water for all temperatures, depths, andsalinities- - - - - - - - - - - _ - - - - - - - - - - - - - - - - - - - - - - - - - - - - - - - - - . - .. - - -
I11
psge1
24613161717172425
3
7
14
89101111151822
26

8/14/2019 NOAA accoustic sound in water.pdf
http://slidepdf.com/reader/full/noaa-accoustic-sound-in-waterpdf 5/32
VELOCITY OF SOUND IN SEA WATER
BY
Geodetic SurveyCommander N. H. HECK and Ensign JERRY H. SERVICE,U. 8. Coast and
INTRODUCTION
While the subject of sound has always been recognized as one of theimportant divisions of hysics and certain phases of it have beenthorou hly investigate$ other phases have remained almost un-touche until recent1 . An especial example of this is the transmis-sion of sound throug sea water. Possible application in navigationwas recognized just prior to the World War and some progress wasmade in the design of apparatus, but it was the development of thesubmarine as a menace to shipping and the consequent need fo r meth-ods of counteracting its activities that led to concentrated investi a-tion by the leading physicistv of this and other countries. Suita% emeans of setting up sound waves ca able of transniission through long
them were among the results of this investigation.
z
distances and receivers capable or detecting faint sounds reaching
After the war interest was on the contrary,every effort was made to findknowledge. This is evidenced of organizationscontinuing in or takin u the States the Navy
this addition to
Department develo e8 tEt? sonic depth finder; the War Departmentperfected methods Por accurately determining the velocity of soundalong the surface and made important determinations of velocity; theCoast and Geodetic Survey and tho Bureau of Standards jointlydeveloped the radio-acoustic method for use in hydrographic survey-in
%he British Navy during the same eriod has been at work on
graphic Office has s tu die it he velocity of sound along the surface;the German Hydrographic Office has studied the theoretical velocityof sound with special reference to use in obtaining de th. These
information
acoustic methods for obtainin the deptE of the water and has madedeterminations of velocit aF ng the surface; the French Hydro-
statements are made o n the basis of the latest availab published
1 “Modern navi ational devices ” by F . E. Smith Engineering vol 117 pp 299-300,Mar. 17, 1924,“Acoustical metaods for depth skmding,” Nature.’vol.113 p 4b3- M&. & 1924.“ A ra$io-acoustic method of locsting positions at 888: Ap&&ion to navigation and to hydrographid
surveys, by Dr. A. B . Wood and Capt. H . E. Mrowne, Proc. Phys.8oc. fLondon, vol. 36, part 3, pp. 1s-
194 Anr. 15. I XB__,_ r _ _.“The soundingof the sea by aound,”by P.Marti (hydrographicengInew of the French Navy), La Na-tu50 Au 20,1921, pp. 125-121.
8/14/2019 NOAA accoustic sound in water.pdf
http://slidepdf.com/reader/full/noaa-accoustic-sound-in-waterpdf 6/32
2 U. S COAST AND GEODETIC S U R V E Y
The sonic depth finder was developed by Dr. Harvey C. Hayes,research ph sicist, United States Nav . It is ca able of measuring
the bottom and for the echo to return to the surf aw 2The radio-acoustic a paratus was dcvolo ed by Dr. E. A. Eck-
Survey, in hydrographic work. The function of the apparatus isto measure accurately the time required for a sound wave to travelfrom a bomb ex losion near the surveying vessel to a hydrophone
In both these cases the function of the a parstus is to measure
in one case and distance in the other it is necessary to know thevelocity of sound in sea water under tho existing conditions.
RESUME O F E XIS T ING INFORMATION ON VELOCITY OF SOUND
The subaqueous sound-ranging section of the United States Army,under Col. It. S. Abernethy, Coast Artillery Corps, has made a veryaccurate determinatim of the velocity of sound along the surfacein certain localities. The results are discussed by E. B. Stephenson,ph sicist, who was associated in this
6 o r k of the British Navy resulted in obtaining velocities of soundalong the surface. An empirical formula based Gn their resultsexpresses velocity as a function of temperature and salinity of thewater.6
There is no evidence in existing publications to show that anyorganization, except the United States Coast and Geodetic Survey,has made experimental determinations of the velocity for verticaltransmission to great depths.
From November 17 to December 29, 1923, the Coast and GeodeticSurvey steamer Guide was engaged on an oceanographic cruise fromNew London, Conn., to San Diego, Calif., bg way of Porto Rico andthe Panama Canal. The wide range of conditions encountered isevident from inspection of the map. As the work included an in-vestigation of Nares Deep, north of Porto Rico, the doepest part oft h e Atlantic Ocean, and also the development of a hitherto unex-
lored deep in the Pacific off tho coasts of Central America andbexico, the range in depth and the number of deep soundings wasexceptional. The actual range in depth w a s from 185 fatlioms to4,617 fathoms.
The Guide was equip ed with a sonic depth finder, and was alsoequipped with standarcf ap aratus for taking wire soundings, tem-
at any depth, and for taking specimens of the 1)ottonr. A definitescheme of soundin s was laid out in advanoe. At every fourth orfifth soundin the epth was obtained by wire and the corres onding
accurately tKe time required for soung to travel Pom the surface to
hardt, Bureau of Stan2 rds,for the use of t e Coast and Geodetic
whose position isKn ~ w n . ~
accurately the time interval. It is evident tR a t to determine depth
peratures, and water sampP s (for later duterminntiori of salinity)
Bime intervaPfor the transmission of sound was dotermine by the%
3 “Measuring ocean depths by acoustical methods,” by Dr Harvey C:. Hayes, Journal of the FranklinInstitute. vol. 197. DD. 323-354. Mar.. 1924.

8/14/2019 NOAA accoustic sound in water.pdf
http://slidepdf.com/reader/full/noaa-accoustic-sound-in-waterpdf 7/32
9
sonic depth finder. Temperatures and water samples were obtainedat the surfacc, a t the depth of 200 fathoms, and at the bottom. Inone case in t h e Atlantic and one in the Pacific aerial tern eratureaand water s:emplcs wcre chtained from surface to bottom. 8arrival
VELOCTTY OF SOUND I N SEA R A T E R
at San Di 0 ho water samples were turned over t o the Scripps

8/14/2019 NOAA accoustic sound in water.pdf
http://slidepdf.com/reader/full/noaa-accoustic-sound-in-waterpdf 8/32
4 U. S. COAST A N D G E O D E T IC SURVEY
until the velocities obtained by simultaneous depth and time deter-minations had been studied and a rational basis for applying theo-retical velocities had been developed.
Inasmuch as the piano-wire soundings, which were taken with
s ecial care in recognition of their importance in connection with
observations with the sonic depth finder, taken with 0 ual care, were
made available a reliable series of measurements of the velocity ofsound in sea water under a wide ran e of conditions. Owina to strong
soundings, to faint echoes, to instrumental difficulties, and to othercauses, a few of the determinations are less reliable fhan others, andsuch velocities are given less weight than those obtained under goodconditions.
Early in the cruise of the Guide i t became evident that the velocityincreased with the depth in spite of the fact that the tern eraturo
ested that velocity is a function not only of temperature and salinityf u t also of pressure. Work was begun on the problem of findingthe relation, based upon reliable theoretical grounds, of velocity totemperature, ressure, and salinity. The authors of this ublication,
general ’supervision over acoustic de th and position determinationwork of the Guide, and Ensi n Jerry %. Service, United States Coastand Geodetic Survey, an ogcer of the Guide, who had had previous
experience in physical research, succeededin finding a solution of thisproblem. It is the purpose of this publication to present the resultsob this solution in a form convenient for practical use, as well as toshow how the problem has been solved.
THEORY
The Newtonian equation for the velocity of sound in a givenmedium suggested itself as a logical and reliable foundation uponwhich to work. Sir Isaac Newton first showed rigorously, reasonin
any given medium is given by the-equation
tKe velocity of sound, were direct measurements of depth, and the
direct measurements of time, it is evident tha t the wor% of the Guide
surface currents in a few places a%ecting the accuracy 07 the wire
fell and the salinity remained practically the same. This P ct sug-
Commander E. H. Heck, Coast and Geodetic Survey,wEo exorcised
from fundamentals, that the velocityof transmission of spund throug
v = ;&;ticity ____f the medzmJ density of the medium
By “elasticity of the medium” is meant the ratio:
Increase of pressure applied to the medium
kesdting decrease in volume expressed as a fraction
The “density of the medium” is, of course, the mass per unit
volume, and the mass and volume must be expressed in units corre-s ondin to those of the force and area, respectively, in the pressure.
of the original volume.

8/14/2019 NOAA accoustic sound in water.pdf
http://slidepdf.com/reader/full/noaa-accoustic-sound-in-waterpdf 9/32
VELOCI lb O F SOUND IN SEA WATER 5
It has seemed most satisfactory to make use in the a plication ofNewton’s equation of the opecific-volume data tabulatexin DMeteorology and H drography, art 1, by V. Bjerknes and?%Sandstrorn, publisheiin 1910 by t t e Carnegie Institutionof Washinton. These s ecifio volumes are based upon the very precise wor
of Knudsen, Ekman, and others. The use of these tables wassuggested by Dr. George F. McEwen, of the Scripps Institution,who also gave other valuable advice and assistance. These specificvolumes are probably nowhere in error by more than 1 part in 10,000,and for the most pa rt are correct to 1 part in 100,000. The specificvolume is, of course the reciprocal of the density and can thereforebe used directly in the application of Newton’s equation.
The specific volumes tabulated by Bjerknes and Sandstrom areno t directly measured but are built up as the sum of directly measureds ecific volumes and directly measured changes in s ecifio volume&e to pressure, tern erature, and salinit changes. ?t is possible,
values of the elasticity of sea water, which elasticities are probablynowhere in error b as much as 1 er cent. It will now be shown
of velocity.In the first place it should be stated that as unit of pressure the
bar, which equals lo6dynes per cma, was used in this work. It wasfirst necessary to reduce the depth for which velocities were to becomputed from fathoms to meters, and thence t o dynamic meters bymeans of Table 3H. The dynamic meter is a unit used to take intoaccount the increase in the force of gravity with de th. By means of
were then founb:It is desirable to explain a t this point, the form in wbich the specific-
volume tables of Bjerknes and Sandstrom have been compiled.Seven tables are re uired which are as follows:
O O C . tem erature and 35 (35 parts per thousand) salinity forevery 10Bcibars pressure f om 0 o 10,000 decibars.
Table 9H is a table of salinity corrections to specific volume andhas a range from salinity O& (pure water) to salinity 39&.
Table 10H gives tem erature corrections to specific volume and
’Ifable 11H is a table of combined salinity-temperature corrections.Table 12H is a table of combined salinity-pressure corrections.Table 13H is a table of combined temperature-pressure corrections.Table 14H is a table of combined salinity-temperature-pressure
corrections.It will be noted that each of these tables is designated by a number
followed by H. In what follows i t wil l be understood that tables sodesignated are Bjerknes and Sandstrom tables without mention of thenames of those authors.
It should be understood that the corrections in Tables 9H and lOH
are firsborder corrections and that the corrections in Tables 11H,12H, 13H, and 14H, are additional second-order corrections.
R1;
therefore, by taking d fferences, t o obtain9om the tables satisfactory
how Bjerknes and 8 ndstrom’s tabPs were used in the computation
Table 15H the ressur0 in decibars obtaming at tle various depths
Table 8H gives ghe specific volumes of sea water in cm3/gm at
ran es from - ’ to 29’
e

8/14/2019 NOAA accoustic sound in water.pdf
http://slidepdf.com/reader/full/noaa-accoustic-sound-in-waterpdf 10/32
6 U. 6. C O A S T AND GEODETIC SURVEY
and Sandstrom’s tables.given can be pu t into the form
The definition of elasticity which has been
Elasticity= increase of pressure in dynes/cm a
resulting decrease in sp. vol. in ern ”/gm
specific volume in cm ”gm
Increase of pressure is always taken as 10 decibars or 10” dyneslcmz.“Resulting decrease in sp. vol.” may bc designated by dw. S p e
The elasticity equation then becomescific volume may be designated by w
106 l O 6 vElasticity =- - =-.
dw dv-.
V
Furthermore, in order to have dv a whole number instead of asmall decimal, it is found convenient to use 1o”dw instead of dw,necessitating multiplying the numerator also by lo6,which gives:
10 11wElasticity= dw)
1Since density=u we have from Newton’s equation
Yin m / s e c . = 1 0 3 v J ~ w0
10V in fathoms/sec.-5.468 x 10 2 v d m
I n addition to facility in entering tables, this form lends itselfwell to the use of reciprocal and square-root tables and multiplyingmachines, with consequent ease and speed in obtaining velocities,
METHOD OF PREPARING VELOCITY TABLES
In order that the velocity of sound may bo obtained in accord-ance with equation (2) at any place, the water from tho surface totho bottom is considered in 200-fathom layers and the mean tem-perature and salinity for each layer is obtained from the best avail-able source of information. The velocity for the entire depth isthen taken as the mean of the various layer velocities.
According1 ,Velocity Table No. 13, pages 26-27 gives the velocityfo r the possi le range of temperature and salinity f o r the surfaceand for the depth corresponding to the middle of each 200-fathom
layer.The formation of a table of values of consisted simply of taking
8/14/2019 NOAA accoustic sound in water.pdf
http://slidepdf.com/reader/full/noaa-accoustic-sound-in-waterpdf 11/32
7ELOCITY O F SOUND I N SEA WATER
10sV(Vfv. PEC. VOL. OF SEAWATER IN C M 3 W )
U
-
-UI
2
2::I
‘I0
rr0
SIs k203u
w
w
t

8/14/2019 NOAA accoustic sound in water.pdf
http://slidepdf.com/reader/full/noaa-accoustic-sound-in-waterpdf 12/32
8 U. S. COAST A N D GEODETIC SURVEl
TABLE
[ 08 u ( -spaoinc volume of sc3 water expressed in Igm
Depth
(fathoms)
Surfaceand100.
97,873'97,92397,799 97,Bw97 72797 778
97: a2 97: 3397.510 97,661
97,437 07,480
97' 63497'705
97,781 97,82497 707 97 76197'634 97'67997'Wl 97'00597:488 97:53397,415 97,46097,342 97,388
97,70397,62997,65597,481
2%97,281
97, 46497,39197,31897,24597,17397,101
97,028
97,74097,06697,59397,51997 44697,37397,300
97 m97 43097: 68
2%97,141
97,089
97,67097,59697,52197,44797,373
$E97,42997,35597,28297,20997,13097,083
86,mi
97,641
97,417
97,196
87,39897,32497,251
97,10497,031
96,968
97,177
97,61697,64097,46697,39197,31697,24197,167
97,59697,62097 44597369
97,21997,144
97:294
97,570 97.58197 493 97 60497:417 97:42997 340 97 35297:m 97:27797,188 97,20197,112 97,126
31323334353637
313233343536
37
97 645 97 689 97 639197 6W97'472 97' 617 97) 6697' 61897'400 97' 446 97'495 97' 647
97 266 97 302 97 35297 404
97:112 97: 159 97: I9 97:282
97: 28 97: 373 97:423197: 475
97' 184 97) 30 97'28197'333
300 (554d e c i -bars).
97,31797 241
97,09097,01596940
96: 865
97: 166
977:094701
96,6,723m1
97 Mo
96,87196: 945
97 489'97640
97? 02 97) .54
97:06997:112
97: 4ld97: 48897 34497 39697' 274 97' 326
97'131 97' 183
500 (923d e c i -bars).
97 350
9720497' 132
96:917
97: 277
07'08096'968
97,438
97,22397:284
97:rn
97,31097,23797,16397,091
96, 75
97 01996:847
31 97 16432 97:07833 97 00334 Qd9m35 98'86330 96'77837 983704 96,746
700 (1,293d e c i .bars).
97,24097,16897, 9597,02696,964
97,286
97'00196'930
97,21497 14297' 071
96: 869
97,08497,01096,93696866
96,72196:793
96, 49
97,05396,97996,90696 03496:761
Q 7 9 0 2 796, 53
96180896:733
98, 87
96 878
96,060
31 9698832 98'914
36 96'69130 961617
a3 9B)84034 96'7%
37 98:64a,
Depth(fathoms)
1,100 (2,036deci-bars).
31 86 041 98 056 98 068 98 085 1,900(3,627deci-
33 95'898 9$913 9519% 9$84334 96828 '%:E40 96864 &E7116 96 76.5 96 77 96 784 96 801if3&Ss4 9iee80 9d713 9673137 95,613 9$628 94643 95,881
31 95,880 95,905 95,Q20 96,936 2,100(3,902ded-
33 94748 95:764 94778 9b:7e63 96 677 96 682 96 707 96 724
36 9$636 96.1551 96:EXtI 9 i W37 96466 96:482 96,4971 96615
32 9$969 96.1883 9i696 96'013 bars).
32 95 819 95 834 96 848 95 E M bars).
3; 95.'608 9 im 951637 9dW
96,88896,614
96,64296,46896,39686,32396,261
96,66796,693
96,44696,37396, 00
96, x1
96,
1,300 (2,406dd-bars).
96668os:48596,41396.341~ g ,6996,19796,128
98, 3296,46996,38796,31496,24296,16996,088
96,36396,28096,21796 14496:072
2,300(4,271bars).
ideci-1,500 (2,780ded-bars)
96 7399518879s 6979g:528
9i38695 4.5096:316
8/14/2019 NOAA accoustic sound in water.pdf
http://slidepdf.com/reader/full/noaa-accoustic-sound-in-waterpdf 13/32
VELOCTTT OF SOUND IN SEA WATER
TABLE-Continued
. - - --.94,48894,41894,35294,28594,219
94,34994,28194,21894.15094,084
94,21294,14594,08094,01493,948
94,07994,01193,94793,88293,818
9
3,900 (7,308 deci-bars).
4,100 (7,888 drci-bars).
4,300 (8,070 deci-bars).
4,500 (8,451 dsci-bars).
Depth (fathoms:
93,94493,87793,81393,74893,683
2,700 (5,020 ded .bars).
4,700 (8,834 deci-bars).
2,800 (5,404 deci.bars).
4. 504. 50
4. 604. 49
3,100 (5,780 ded.
bars).
2,5002, 6002 7002: 00
3,300 (8,167 d dbars).
4. 174. 15
4. 144.13%
3,500 (0,647 d e dbars).
5 OOo 3.87 7,500
5 200 3.83% 7,700
5: 100 3.85 7,600
6'300 3.8356 7,800
3,700 (6,927 deobbars).
4.37%4.384. 354. 334 31%
4.304.29
4.27%4.204. 25
Temperature (dggreescentigrade)
s, 500
8,8003,800
2
$E4, 2004,3004,400
a00
4. 003.99%
3.953.93%3.94%
95,44295,37195,30295,23295,10395,09495,026
95,15595,08695,01794,94894, 879
95,01194,94294,87494, XOB94,737
94,86094,79794,72894,661m. 593
94,72394,85494,58794'52094,452
04,68294,514
94,44794,38094,313
4400 3.71 8 , o O
6 500 3.70%6:600 3. 69
6 700 3.68%6800 3.89de00 3.05
9.$ 181 95; 19885,112 95,12995,044 94080
95,174 95,19195, lop 95,12295,036 95,05494,907 94+98594,89Q 94,918
94,888 94,90494,810 94.83594,749 94,78894.881 94,700w.oi4 84,833
94,744 94,78294,674 04,69391,608 94,02794,641 94 . m94,474 94,493
94,004 94,82494,535 94,555
94,409 94,48994,402 94,42294,338 94,355
-I-95,494 3195,423 3295,358 3395,285 3495,217 3595,149 3896,080 37
Temperature (degrees
centigrade) l - - -
. -- ---.94,44394,37094,30894,242m, 170
94,30694,23894,17294,10694,040
94,18794,10194,03593.90993, m3
94, a3393,90893, w193, n3893,770
93,89793, 83183,78093,70193,836
. --. .
. --.
. --.
.-.
-_ -_ -_94,48594,39794,33194,28494,199
94, a2894,26094,19594,12994, w
m, 18094,12394.05890,99283,927
94,05793,98993,92593,86093,795
93,92193, 85493,79093,72593,681
__ Depth (fathoms)
2
TABLE
volume in cma/gm co6espo&ing to 1 bar increase in pressure)]
\
[ fa, ( fts, -lOIdw. a t 3&% alfnitp Oo C and standttrd pressure, where dr-decrease i n specific
Pressure(decibsrs)
0100200300400
500600700800Qoo
::%::E1,400
15001: 000
I, 7001 8001:800
Mas, a, F
3. 80%3. 59
3. 583.57%3.5Ojg
3.553.54%3.53%3. 523.52%
3.51%3. 503.48%3.47 43. 47

8/14/2019 NOAA accoustic sound in water.pdf
http://slidepdf.com/reader/full/noaa-accoustic-sound-in-waterpdf 14/32
10 U. S. COAST AND GEODETIC SURVEY
. -~. _. - ~. __-___--__Decihars 0 10 20 30
__ ___________8,200....-. 93,989 83,986 93,982 93,9798 3O...... ._.._______.__....8:400 __.___3,919 93,915 03,912 93,YU8
70 71 70 71
~
._
40 60 GO 70 80 90
.__--__.-_________
93.975 93,971 93,968 93,964 93,861 93,967. .~.~_._____-_. . ._____-. ---- - - - . . . . - - -__________
93,w)5 83,801 83,697 93,894 83,890 93,88770 70 71 70 71 70
__ ~-.___
Depthswhere Correc-
a plicable tion( h o r n s )
Salinity (O/oO)
~ ___
0-1,300a06
2,500-2,700 +.0531_______..__..__..___....., 5~ ) -2 ,300 +.os
Depthswhere Correcl-
nDplicahle tion(fathoms)
Salinity (O / oO )
0-2, hOO +o. 01%
3,7004,700 +.00%34.._.._.__.__...___..-..._,7o(t3,600 + . n i

8/14/2019 NOAA accoustic sound in water.pdf
http://slidepdf.com/reader/full/noaa-accoustic-sound-in-waterpdf 15/32
VELOCITY O F SOUND I N SEA WATER 11
0-300600703QOO
o300M)o700
Temperature (degreescentigrade)
-0.26-.24-.24-.23
-.n-.24-.%
._____-. -.. -
1...................
0-1, loo1,XO(t2,3002,501t3,3003,,W0-4,1004,3CHl-4,700
2-................ -.05-.04 4- .04 14..................-. 03 1- .03
3. - --. - - - - --.
4-........................
-.-.. 1,900-2,700
0-1, loo1 ,3Wl , 700
@-1,300
0-500700-1,100
0-300
6.. ........................
a.... ......................
-.05% lG..- ....................
-.my,-.oQ I8........................
-.13
--.174(1 m... .....................-.17
-.22o.-. ......................
0looa00600700
TABLE. - -Tetnperat i~re correc t ions to M
- .38-.37-.36-.36-.36
Depthswhere Correc- Temperature (degrw
applicable 1 t ion /I centigrade)(fatboms)
4.434. 42
4. Q4. 374.364.34
4.374. 354. 4
4. 124.314.294.28
4.40
____l ,w3,3001 -0.02 iL...............
3, sw 4,7 oo -. 01>4
4.304. 38
4. 354. 334.324.30
4. 334. 314. 30
4. 284. 74.254. 24
4.30
4. 284. 64. 234. 224.20
4.194. 17
4.224. 214.1Q4. 184.16
4. 154. 13
DepthsCorrec-
0-100 -.351w =:::.33
TABLE
[ M M-lOado, wheredo-decreacie in speciflo volume in cms/gm corresponding t o 1bar increase i n pressure]
Depth (tsthoms)
_ -
l d i ni t Y'O/GU
-
31323334353637
313233
34353037
31323334353637
313233343h
3837
0
_.
4. 5G4. 564. 534. 524.604. 41)4. 47
4.804.484. 47
4. 454. 444. 424.41
4.454. 444. 424.414. 394. 384. 38
4. 94. 38
4. 3b4. 33
4. 24. 0
4.30
-2
4.614. 604.484. 474.454. 44
4. 54.434.4
4. 404.3Q4. 374.36
4. 404. 3Q4.374.364. 344.334. 31
4. 344.334. 314. 304. 28
4. 274.25
4.42
-4.474. 484. 444. 34.414. 404.38
4. 414.394. 8
4. 364. 54. 334.32
4. 384. 354.334.324.304.294.27
4.304.294. 274. 284.24
4. 34.21
Tempera tur e (degrees centigrade)-10
-4.344. 334. 314. 304. 284.274. 26
4. 284. 264. 26
4. 234. 224.204.19
4, 244. 234.214.204. 184.174. 16
4. 184.174. 164. 144.12
4. 114.09
-12
-4.314.304. 284. 274.264. 244. 2a
4. 264. 234. n4. 204. 104. 174.16
4.214. a04. 184.174. 164. 144.12
4. 164. 144. 124.114.09
4. oe4.06
4.23 4.204.21 4.184. 20 I 4.17
4.18 4.154.17 4.144. I5 4. 124.14 4.11
4.O5 I4 o1
-18
-4. 234.224. 204. IQ
4. 174. 164.14
4. 174. 164. 14
4. 124. 114. 084.08
4. 134.124. 104. OB4.074. 084.04
4.084.074. 064.044 02
4.013. QQ
0
-4.214.204. 184. 174.164. 144. 12
4. 164. 144. 13
4. 114.104.084.07
4. 11e 104. 084. 074. 054. 044.02
4.064.054. 034.014. 00
3. 993. 97

8/14/2019 NOAA accoustic sound in water.pdf
http://slidepdf.com/reader/full/noaa-accoustic-sound-in-waterpdf 16/32
U. S. COAS T A N D GEODETIC SURVEY
TABLE-Continued
3 .89
3 .883 .863 .843.82
3.873 .87
3 .843 .833 .823.80
8.86
3.833.82
3 .803 .78
3 .783 .773 .703 .763 .73
3 .743 .723 . 7 13.703 .69
3.81
I3 . 8 1 . _ ._____3.80 _ _ _ _ _ _ _ _3 .78
__._____3.76 __._____3 .78 _ _ _ _ _ _ _ _3 .75 __._____3 .74 __ ._____3 .73 _ _ . _ _ _ _ _3 .71 __._____3 .72 __._____3 . 7 0 - - ~_ _ _ _3 .09 _ _ _ _ _ _ _ _3 .68 __._____3 . 6 7 . . , . _ _ _ _
a . 7 0 . ~ -_ _ _ _qew-____._- -____-________
3,100_ _ _ _ _ _ _ _ _ _ _ _ _ _ . _ _ _ _ _ _ _
3,300-- . _ _ _ _ _ _ _ _ _ _ _ ____.__
3,500-___- ._ . - -___- .____ .__
3,700--__.__- - _ _ _ _ . _ _ _.__
8.853 .843 . 8 3
3.80
3 . m3 . 7 93.783 .773.16
3.703.743 .733 .723.71
3 .723.713.703.69
3.673.683.00
a. 8a
3 .693 .083.673 .06
3 .643.653 . 8 3
__._- - -__ .______ _ . ____--._-_ ___.______ _ . _ _ _ _ _- - .__ -__
Depthfathoms)
1,900
Temperature TBmmmture
-3
4 . 0 44 . 0 24 . 0 14 . 0 03 . 9 83 973 9 6
4.013 . 9 93 . 9 83.973 . 9 53 . 9 43.93
3.953.933.923.913 . 8 93.883 . 8 7
3.613.903. a3.883.863.863 . 8 4
--_
2 4
4.26 4.214.23 4.194 .22 4 .184 .20 4 .164 .19 4 .164.17 4.134.16 4 . 1 2
4.21 4.104 .10 4 .144 .18 4 .134.10 4.114 .16 4 .104 .13 4 .084 .12 4 .07
0
_I4 .304 .284.274 .264 .244. 224.21
4.a54 .234 .22
4 .194.174 .10
4.204. 184.174 .164 .144 .124 .11
4.1s4 .144. 134.114 . 0 94. OR4. OB
4. m
--31 4.0932 4.0733 4. 0834 4.0635 4.033 6 4 . m37 4.01
4.17 4.134 . 1 5 4 ~ 1 14 .14 4 .104 .12 4 .084.11 4.074 . 0 8 4 . 0 54.w 4.04
4.07 4 .064.06 4.034 .04 4 .024 . 0 3 4 . 0 14 .01 3 .994 . 0 0 3 . 9 83.99 3.97
2 . 1 m1 1.M32 4.0433 cw3 4 4 . m36 4.00
37 3.9838 8.88
4.13 ~ _ _ _ _ _ .4 .10 _ _ _ _ _ _ .4 .09 _..____
4.07 __.___
4 . 0 8 _ - _ _ _ _ _4 .04 ...___.4.03 _ - _ __-.
3.98 3,963
3 .86 3 .933.96 3.94
31 4.0032 3.9833 3.9734 3.9636 3.9430 3.9337 3.82
4.16 4.114. 14 4.094 .13 4 .084 .11 4 .064 .10 4 .064 .08 4 .034 . 0 7 4 . 0 2
2.m
3. 89
4 .11 4 .064 .10 4 .064. OB 4 . 0 34 .07 4 .024 .06 4 .004 .04 3 .994 .02 3 .97
I
31 3.8632 3.9533 3 .9434 3.9336 3.9136 3.9037 3.89
3.89 3-693 .93 3 .913.92 3 . 9 03.91 3.893.89 3.873.88 3.863.87 3.86
=======
Depthfathoms)
3
Temperature(degreescantigrade)
-2
_ _
_ _ ^ . _
__-._
3 . 6 23.003.693. 683.67
3.673 . 6 63 . 6 53.643. K
3. M3. g3.6;3. 613. M
3. 613.M3.4(3.4f3.4;
3. 4<3.4:3' 443.42
3.4:. I _ .
..-._.
0 Io3132333436a637
a334363637
333436
37
3334353037
33343638
373334
3-3
... - .__.___
3.063 . m3.623.613.60
3. Bo3 .69
3.573.60
8.673.563.66
3.63
3.643.633. 623 .613. 60
3 .493 .483.473.46
3.45
a. MI
a.M
. _ - _ _ _
._.___
_ _ 3 .923 .913 . 8 9
3.873 .883. ti4
a. 88
3.873 .883. L?43 .833 . 8 23 . 8 13.79
_-.___
3 .043. Ba3 .613.803.59
3 .693 .683.673.663.56
3 .563.663 .643. 6.33 .62
3, -533 .623.613 .603 .49
3.483.473. 483.46
3 .44_____.
~ - - - - -.
1, loo
4,300
4, wo
4 ,700. 713 .703.693 .08
3.663.673 .66
8/14/2019 NOAA accoustic sound in water.pdf
http://slidepdf.com/reader/full/noaa-accoustic-sound-in-waterpdf 17/32
VELOCI CY OF SOUND IN SEA WATER 13
0-13-14-14-15
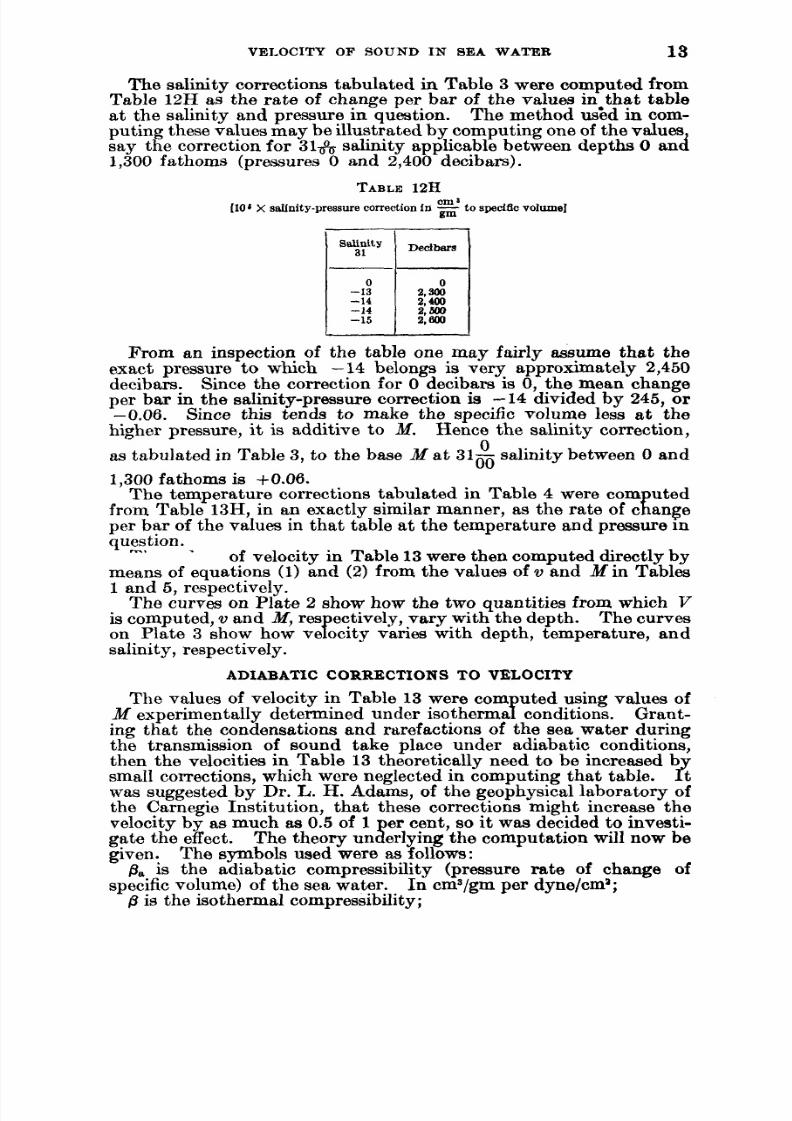
The salinity corrections tabulated in Table 3 were computed fromTable 12H as the rate of change per bar of the values in that tableat the salinity and pressure in question. The method us'ed in com-puting these values may be illustrated by computing one of the valuessay the correction for 31& salinity applicable between depths 0 and
1,300 fathoms (pressures 0 and 2,400 decibars).TABLE2H
(101x sdnity-pressure correction in o speciflo v o ~ u m e jgm
0
a' 5002: 800
I I
From an inspection of the table one may fairly assume that theexact pressure to which -14 belongs is very approximately 2,450decibars. Since the correction for 0 decibars is 0, the mean changeper bar in the salinity-pressure correction is -14 divided by 245, or-0.06. Since this tends to make the specific volume less a t thehigher pressure, it is additive to M. Hence the salinity correction,
as tabulated in Table 3, to the base M a t 3 1 ~alinity between 0 and
1,300 fathoms is $0.00.
The temperature corrections tabulated in Table 4 were corn uted
per bar of the values in that table a t the temperature and pressure inquestion.
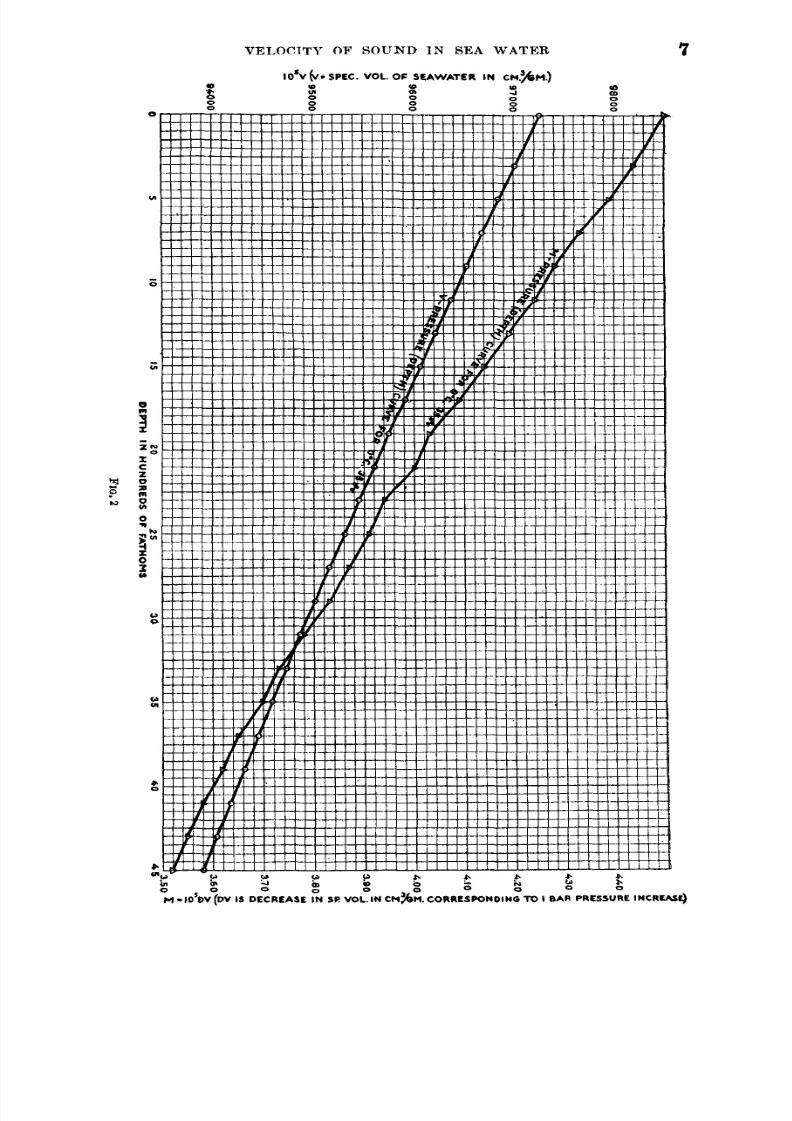
of velocity in Table 13were then computed directly bymeans of equations (1) and (2) from the values of v and M in Tables1 and 5 , respectively.
Tho curves on Plate 2 show how the two quantities from which Vis computed, v and H,es ectively, vary with the depth. The curves
salinity, respectively.
0
from Table 13H, in an exactly similar manner, as the rate of c ange
%
on Plate 3 show how veP city varies with depth, temperature, and
M experimentally determined under isotherma conditions. Grant-
ADIABATIC CORRECTIONS TO VZLOCITY
The values of velocity in Table 13 were corn uted using values of
ing that the condensations and rtlrefactions of the sea water duringthe transmission of sound take place under adiabatic conditions,then the velocities in Table 13 theoretically need to be increased bsmall corrections, which were neglected in computing that table. 8was suggested by Dr. L. H. Adams, of the geophysical laboratory ofthe Carnegie Institution, that these corrections might increase the
velocity by as much as 0.5 of 1 er cent, so it was decided to investi-gate the effect. The theory un Perlying the computation will now be

8/14/2019 NOAA accoustic sound in water.pdf
http://slidepdf.com/reader/full/noaa-accoustic-sound-in-waterpdf 18/32
14 U. 5. COAST AND GEODETIC SURVEY
0,ki the spec%c heat at constant volume, in ergs per gram per
C,, is the specific heat at constant pressure;degree cenFigrade;

8/14/2019 NOAA accoustic sound in water.pdf
http://slidepdf.com/reader/full/noaa-accoustic-sound-in-waterpdf 19/32
VELOCITY O F SOUND IN SEA WATER 15
aa Tand that C, -C,=
aa Twhence C, =C,- ~
B
In other words, the adiabatic compressibility, which probablyobtains durin sound transmission, is less than the isothermal com-
aa Tpressibility, w l ch is what Ekman measured and Bjerknes used in his
are given herewith of
rections to the velocities under various conditions. Since the unitof pressure used for /3 was tho bar, or lo6dynes/cm2,a unit of energyin C, equal to loe ergs, or 1 decijoule, was necessary.
TABLE
[ ola a ( )p-temperature rate of changeof specificvolume, in per degree cantigrade,of BBB wateram
of salinity 35 3
Temperalure in degrees centigrade
6 I 1 0 I 1 6 1 2 0
Depth (fathoms)
The above valueswere computed by means of Tables 10H and 13H
TABLB
[ 0ag ,9- ( )T-isothermal p r a m ate of change of speoifio volume, InEaer bar, of 888 water of
salinity 35k]am
0
Temperature in degrees centigrade
6 I 1 0 1 1 8 1 2 0
Depth (fathoms)
I 1
8/14/2019 NOAA accoustic sound in water.pdf
http://slidepdf.com/reader/full/noaa-accoustic-sound-in-waterpdf 20/32
16 TJ. S. COAST A N D GEODETIC S U R V I P
TABLEI0
metersper second (lower line)][Adiabatic corrections to velocity, in fathoms per second. For the surface corrections are also given in
Depth (fathoms)Temperature in degrees cantigrade
1 0 1 6 1 1 0 1 1 6 1 2 0
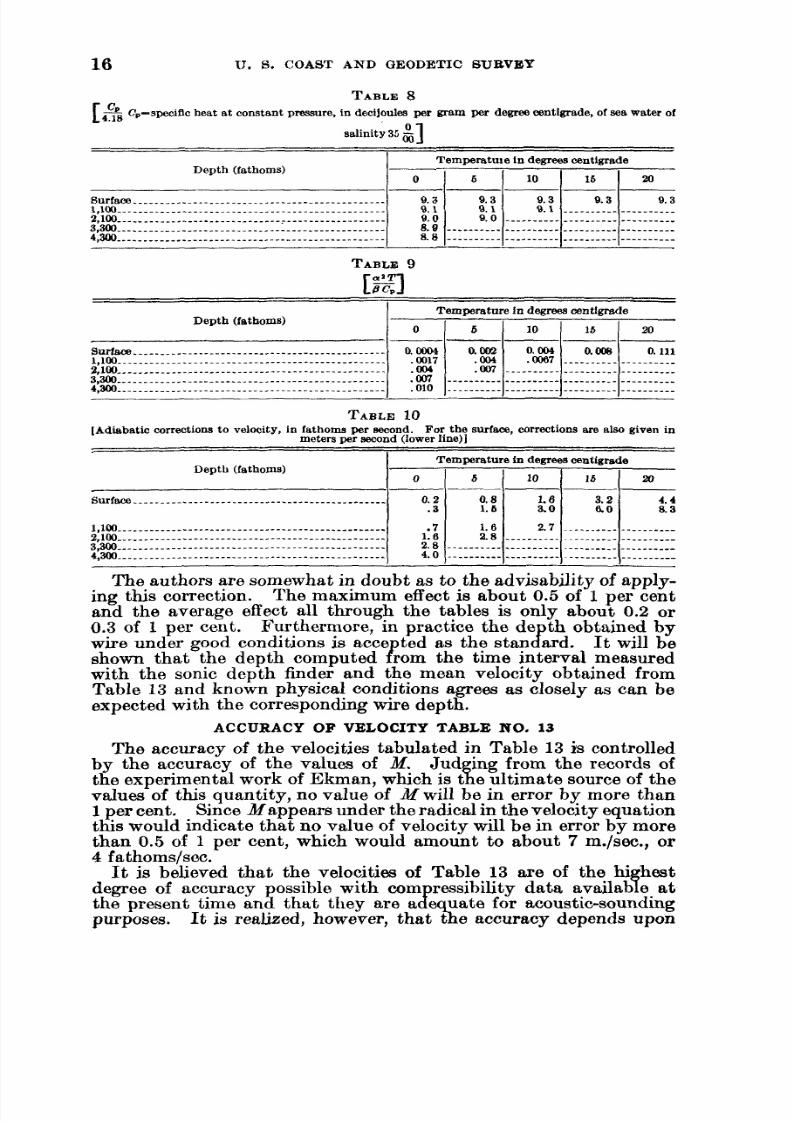
The authors are somewhat in doubt as to the advisability of apply-ing this correction. The maximum effect is about 0.5 of 1 per centand the average effect all through the tables is only about 0.2 or0.3 of 1 per cent. Furthermore, in practice the de th obtained by
with the sonic depth finder and the mean velocity obtained fromTable 13 and known physical conditions agrees as closely as can beexpected with the corresponding wire depth.
wire under good conditions is acce ted as the stanBrd. It will be
shown that the depth computedP
om the time interval measured
ACCURACY OF VELOCITY TABLE NO. 13
The accuracy of the velocities tabulated in Table 13 is controlledby the accuracy of the values of M. Jud ing from the records of
values of this quantity, no value of M will be in error by more than1 per cent. Since Nappears under the radical in the velocity equation
this would indicate that no value of velocity will be in error by morethan 0.5 of 1 per cent, which would amount to about 7 m./sec., or
the experimental work of Ekman, which is t%e ultimate source of the
8/14/2019 NOAA accoustic sound in water.pdf
http://slidepdf.com/reader/full/noaa-accoustic-sound-in-waterpdf 21/32
VELOCITY O F SOUND I N S E A WATER 1 7
whether the values of Mused in the table are the true values. Furtherstud is bein given by one of the authors to the possibility of obtain-i n g J ectly Born the results of Ekman's compressibility experimentsmore precise values of M.
COMPARISON OF COMPUTED VELOCITIES WITH DIRECTLY
MEASURED VELOCITIESCOMPARJSON OF SURFACE VELOCITIES
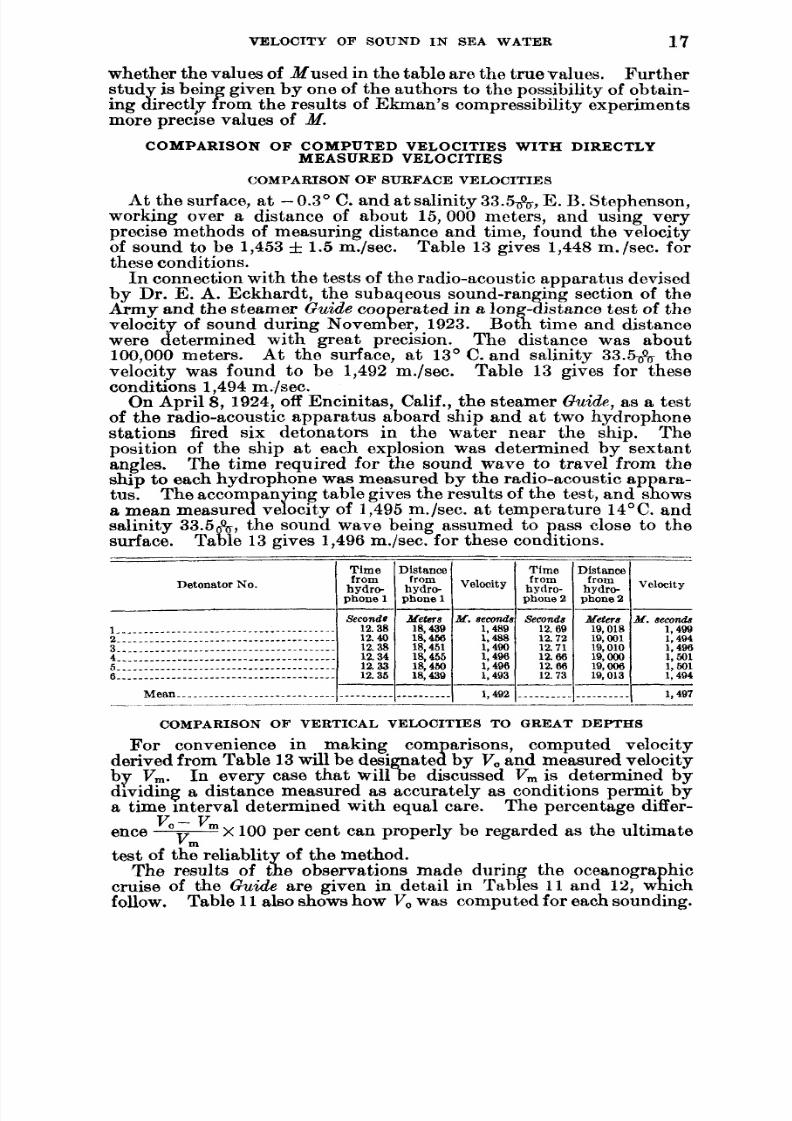
At the surface, at - .3"C. and at salinity 33.5&, E. B. Stephenson,working over a distance of about 15,000 meters, and using veryprecise methods of measuring distance and time, found the velocityof sound to be 1,453 1.5 m./sec. Table 13 gives 1,448 m./sec. forthese conditions.
In connection with the tests of the radio-acoustic apparatus devisedby Dr. E. A. Eckhardt, the subaqeous sound-ranging section of theArmy and the steamer Guide coo erated in a on -distance test of the
were determined with great precision. The distance was about100,000 meters. At the surface, a t 13" C. and salinity 33.5& thevelocity was found t o be 1,492 m./sec. Table 13 gives for theseconditions 1,494 m./sec.
On April 8, 1924, off Encinitas, Calif., the steamer ChLicZc, as a testof the radio-acoustic apparatus aboard ship and at two hydrophonestations fired six detonators in the water near the ship. Theposition of the ship a t each explosion was determined by sextantangles. The time required f o r the sound wave to travel from theship to each hydrophone was measured by the radio-acoustic ap ara-
salinity 33.5 ass close to thesurface. Tahe 13 gives 1,496 m./sec. for these con8tions.
velocity of sound during Novemger, 1923. Bota time and distance
tus. The accom an 'ng table gives the results of the test, and s iwsa mean measureB fe ocity of 1,495 m./sec. at temperature 14°C. and
, the sound wave being assumed to
hydro-phone 1
Detonator No.
Distancefrom
hydro-phone 1
Mela818,43918,4E018 451
14 5618,4bo18,438
- - - -_ _ _ _
M. econds Seconds1.489 I l Z . f l 9
Distance
phone 2
19,010
19, OOO19,00819,013 1,494
1,497
C O M P A R I S O N OF VERTICAL VELOCITIES TO GREAT DEPTHS
For convenience in arisons, computed velocityand measured velocity
by .VF. In every case that V , is determined byderived from Table 13 will be
dividmg a distance measured as accurately as conditions permit bya time interval determined with equal care. The percentage differ-
ence - 100 per cent can properly be regarded as the ultimatevr

8/14/2019 NOAA accoustic sound in water.pdf
http://slidepdf.com/reader/full/noaa-accoustic-sound-in-waterpdf 22/32
bottom
--3.3
3 4 9
2 4. _ _ * - _ _
2.635.1
__ - -_ -_35 1
3.035.2
2.335.0
1.535.1
2.5
35.2
_ _ - _ - _ _35.1
____.__
35.1
1
935
812
1035
814
2036
829
1936828
1936
828
1936
828
2136
831
21
36831
2136
831
2236
833
3udace
13. 934.8
15.034.9
2 2 636.3
21.136.4
21.336.4
21. 73 5 9
23.536.4
25 1
36. 3
25. 136.0
26.335.8
200fathom
6.23.50
6.434.9
17.636.4
17.736.4
17.736.4
17.536.4
17.936.5
17.4
36. 5
17.636.4
17.236.3
35810
35810
1036
821
1036
821
1036
821
1036
821
1036
821
10
36821
1036
821
1036
821
5 7
--5 4
35812
5 435
812
93582a
935822
9358n
935
822
936
822
9
35832
935
822
935
822
11
335
816
35816
35825
35825
35825
35825
35€25
35825
35825
35825
13
--_ _ _ _- _ _ __ _ _ _
4 335
819
7 635
827
7 635837
7 635
827
7 635
827
7 635
827
7 6
35827
7 635
827
7 635
827
- - - _- -- -- - - -
- - - -_ - - _- - -
35837
35837
35839
35839
35841
35839
35839
35839
_ _ _ _. .
_ _ _ __ - _ __ _ _ _- - -
3 335
839
3 335a39
4 335
839
4 335
839
5 435
841
4 3
35839
4 335
839
4 335
839
35825
35823
35825
35827
35825
35821
. - - -
. - - -
35825
35823
35821
35821
--..I
7 6
35827
6 535
824
7 635827
8 735
829
7 635
827
5 435
822
--..- - -._.___
7 635
827
6 635
827
5 535
824
5 535
824
. .___
- - -
. .
--.- - -
-. .
. .
. . .
- - - -
TABLE1
IObserved t e r n e r a -
tures csntigra& andsalinities
dopted temperstures, Salinities, and tabular velocitlesfor depths expressed in hundreds of f a t h o m
Numberof-din1 -
3
-
535
807
535
807
'1536
825
1436624
1436
824
1436
824
1436
824
14
36824
1436
824
1436
824
-
9
35815
435
815
835
824
835
824
835
824
835
824
835
824
8
35824
835
824
835
824
-
15
-
_._.- _ -_._.
335
823
535
828
535
828
535
828
535
828
535
828
5
35828
535
828
535
828
-
17
__.__..
- -_.
335
826
435
829
435
829
535
831
535
831
435
829
5
35831
535
831
535
831
-
19
-_ - -_ - __ _ _
335830
435
831
435
831
435
831
435
831
436
831
4
35831
435
8 1
435
531
-
21
-
335
832
S35
832
435
834
435
834
535
836
4
35834
435
834
435
834
l
I 25
26.
36.
25.35.
25.:36.
w.36..
23.36.l
27. :35.1
26.:
35 :
2 5 . 734. I
2 5 . 735. a
26.83 & 4
26.8S O
27.336.0
m. 834 9
18.:
36.2
16.a 1
17. I36.3
19.236.4
17. 736.4
16.736.3
17. 636.3
17. 63.55
17.036.2
13.436.0
12 536.3
13.538.3
13.835. 6
-0. :
35.
2. <
35.
2 :35.
2. t
36.;
2. ;35..
2.
4. (
35.1
4 . 23 5 . 3
4. 13 5 1
4.035.2
4 035.3
3. 935. 2
z
3483:
213t
831
2:3t
833
z38
833
2136
831
n36833
2235
832
2235
832
2135830
2036
929
1936327
2036i29
2035128
10
36821
1036
821
1036
821
1136
822
1036
821
936
819
'I35
514
1035
320
1035
735I14
735115
7
120
E
3:824
735
822
835
824
935
825
835
824
635
82o
- _ -- _ -.--
835
824
735522
635
320
635
435I15
$20
.__
_ - _-.-
35B
43:9
535
635
331
535328
335124
3m
.--
. ~ -
. _ _
635I31
635I31
535828
53528
_.._ _ .-..
_ _ .__.~ . .
14
36824
1436
824
1436
824
1536
825
1436
824
1336
823
1135
819
1335
821
1335
821
936
316
5
35831
335
826
535
831
535
831
535
831
335
826
_ _ __ _ _
635
834
535
831
435
829
435829
.___
_.__
_...
__._
_ _ _ ___._
4
35834
. _ _ _
. _ _ _
435
834
435
834
435
834
...
._..
.-..
-..
....
.-..
535
836
535838
435
534
._._
_.__
..__
_.__
-.
._._
.___
.._̂
. _ _ _ I
4
35831
335
830
435
831
535833
535
833
..-
__.
__.
-.
--.
--.
635
835
535
833
435
832
435
8 2
_.__
-.-
__..
_.__
_ _ _ _
2 2
35 35844 849
-- - -- - ---.~ - -- --.
3 335 35846 851
3 335 35
846 851
3 335 35
846 851
-.- .-. .
I
3:8%
3:82(
f3:
82:
;I821
93:
821
735
818
435
812
a35
822
835
820
635
516
635
316
535116
._..
.__ .
861%I865%1867% 870%I::::::841
I-. .
36 35116 815
9 1
8/14/2019 NOAA accoustic sound in water.pdf
http://slidepdf.com/reader/full/noaa-accoustic-sound-in-waterpdf 23/32
2 2 234 34
823 828
34 34823 828
2 234 34
823 828
34 34823 828
34 34823 628
34 34825 829
34 34825 8%
3 _.__.
2 2 2
2 2 2
2 2 2
3 3 3
3 2 2
34 .........825 .........
34830
34830
....
.-..
....
34830
34830
34831
34830
.___
34a35
34835
234
835
234
835
...
2 2 234 34
837 wo
2 2 234 34837 840
.............
.............
.............
.............
.............
.............
2 ....
34 ....837 .-..
2 ....34 ....
837 _ - - -
......... ....
2134844
844
. -
. .
. -.
. .
234
848
2 23 4 3 4848
........
........- -.
........
........
........
........
-.
- -.
........
........-.
-. . -
.......
........
~... -
.-__
_-_.
_ _ _ _. .
~ - -. .
.-__
. - -- - -
___.
.__.
_ _ _ _- -- ---.-
.___
........
........
........
........
........................................
................................... 816
.........................................
.........................................
................................... 821
TABLE1-Continued
Adopted temperatures, salinities, and tabular velocities for depth s expressed in hundreds of fathoms)bserved temper a -tures centigrade andsalinlties
. . . . . . . . . veJ l l iumberof sounding c
otton
-
3
_
-..
...
_..
933
814
833
81 1
733809
834
812
934
814
E
3481:
3481:
5
3481'
I3'
81:
5
-.--
-..
..-
734
312
633
810
534808
634
810
734
812
734
811
634
81C
1
3481:
t3'SI(
-
'I
-._-..-..
.__.
634
315
534
434
911
434
811
634
815
634
815
534
813
634
815
c34812
313
c9
-
___.
__.-
_ _ _ _5
34817
434
815
334
812
__.
_ _ __ - -
534
817
534
817
434
815
534
817
434
815
19 21 I 23 25 \ 27 29 31 1 33 j 35 37 3g 41 43 1 45
-20
20
32335
32325
20323 2 5
1833
824
20338%
2034
827
1934
1934
8261934
828
1834
828
am
urfaa
____.
.__-.
2. e34. e
1. <34 t
2 f
3 4 1
.___ .34.t
2
34.1
2. ,34.
2 :
34.
2
84
2
34.
24..................
25..................
26..................
........................... .......... ..........
.............................. ..... ..... .....................
.......... .......... 819
......... ..... .................
..--._._ ..........
...................
.-.-............................. ........ ..... .......... .............. 815
.............. ................... 813
........................
................... ____.I................... ...............-----........................
.............. .................... - - - - L
............................
............................. ...........
.............................
2 ...............................34 .............................._
828 818
.................... _-----..... .................... 8231
2 ....................-34 ............... ....
828 ._._I.............. ..... ..... ..........
_____.
133.6
1 3 53 2 6
9. 933.1
1 2 03 1 3
13.434.6
11.334.4
11.134.7
1 2 734.6
11.634.4
26.831.4
26 431. 1
26.63 2 7
27.832 1
27.333.0
27.133.3
27.13 4 . C
25. 733. t
26. 133 t
3 :3 4 3 '818 82:
3 (
818 82(
3 '
818 82:
3 :3 4 5
818 821
34 3;
3 4 3 .
27.333.8
27.333.8
23.534.1
n.34.0
2 7 .833.8
? s a33.8
28.234.1
23.534.7
19. 134.2
18. 534. 3
16.833.9
16.833.9
15.733.9
1.834.2
12.034.7
ia 934.7
10. 634.7
12 034.7
13. 734.7
10.434.5
11. 134.6
9.634.0
6. 134.4
7.934.0
7. 434.0
a034.1
2. 534.6
2. 434.6
2 334.5
1. 834.6
2 834.6
2 9
2034
827
2034827
1834
825
1934
826
2034827
2134
829
1934826
1734
823
1434
818
1234
816
1234
816
1234
816
1234
816
-
834
812
834812
734
810
834
812
834
812
1034
817
834
812
834
812
734
810
634
808
634
808
634808
634808-
634
810
634810
634
810
634
810
634
810
34812
634
810
634
810
634
810
534
8c41
534
808
534
808
434
807
1
-
534
813
534813
534
813
534
813
534
813
634
815
534
813
534
813
534
813
434
811
534
813
434
811
334809
-
434
815
434815
434
815
434
815
434
815
534
817
534
817
534
817
434
815
434
815
434
815
334
812
..-.
..__
_ _ _ .
-
334
816
334ai6
334
816
334
816
334
816
434
818
434
818
434
818
434
818
334
816
434
818
334
816
- ~ .
.-.
--.
-
334
818
334818
334
81s
334
818
334
818
434
821
434
821
434
821
334
818
334
818
434
821
234
816
._..
._._
.-.-
-
234
820
234820
234
820
234
820
234
820
334
822
334
822
334
822
234
820
234
820
334
872
234820
-
3
...............34 ....................................852 .............................. 828
........................................I I I I H818
......................../................1 _ _ _ _ ................... 819
. ..I .......... ..... .--..I ......
.................... _ . . _ . I ................
................................... 822
.........................................I i / i l........................ . - - - - .............................................. 824i / / I H
834.6
. _ _ _ _ __ _ _ _ _ _
2 434.5
2.434.5
2 434.6
1.534.5
2. 434.3
.............
.............
...~--.................
..............
.____ _ --..-
.............___.I._.̂ _..-
34828
234
823
234
828
2348'23
....._ _ I ..... .... I_ ........ .............................................
.............
.............
... .........

8/14/2019 NOAA accoustic sound in water.pdf
http://slidepdf.com/reader/full/noaa-accoustic-sound-in-waterpdf 24/32
22
Fathoms1,1671,937
U. S. COAST AND GEODETIC SURVEY
Seconds1.4642.382
TABLEo. 12
NORTE ATLANTIC OCEAN
1................2 _ _ _ _ _________.
3................4................5................6................7................8................9................10................1 1 ................12.-..............13................14................15................16.____ _ _ _ _ ___._
11-21 3911-22 3811-22 3711-23 3511-23 3211-24 2911-25 2711-26 2411-26 2311-27 2111-28 I911-30 1912-01 1912-02 2012-03 1912-03 19
333207032944064609234003441 13607
CARIBBEAN SEA
71 3071 0070 0670 2970 3670 2770 3170 1869 1268 0166 5265 056 5 2466 4467 3267 51
...................2,6252,9842,9883.0303 0603’0272:9654,5151,9744,0753,2344,6171,817
I7 5016 5715 1513 231 1 3510 029 36
_ _ _ _ _ _ _ _ -3.5223.6493.6363.7043.6393.6255.4402.3254.8043.9315.5652.154
24................25. ...............26................27. - - - - - -._-.__.28. ...............29. - - -30................31................32.-. - - - - - - - - - _ -33................34................
-. -. - -
83831831838383184182.5837833841823
35.. ..............36. ...............37. -.. . - - -
--.- - -- - - 1.9_ _ _ _ _ _ _ _ _ 1.3_ _ _ _ _ _ _ _ _ _ . 2
. 6 ____._
_ _ _ _ _ _ _ _ . I
1.6 ____.__._
1.4 .........._--______..9_ _ - _ _ _- _ - 1.3
1. 2 ..........
1. 3 .................... 2.4
38................39 - - - _ _ _ _ _ _ _ _ _ _ _40. ...............41................42................43................44................45.. ..............46.. -. -._ _ - - - - -
17................18................19. ...............20................21................22................23................
-___-
12-0312-0412-0612-0512-081%0712-07
Depth Timeby wire intervalI
819831828824823818828
1.2 .........._ _ _ _ .-.--. 0.7.......... 3.4
1. 5 ...........7 ...........2 ..........2.6 ..........
12-1312-1312-14lSl612-1512-16
7 34 78 566 19 79 026 10 81 1 1
6 14 84 267 48 84 068 47 84 55
Fathoms/aec.
797813
825
81581381.5818818818827818828828818819822824
820818A17816821813810
819
67 4168 1571 1674 0277 0579 0879 49
0 . 4 _ _ _ _ _ _ _ _ _ _3.0 ..........
..___..___.1- - - _ _ _ __ _ _ 1.4
3.3 - _ _ _ _ _ _ _ _.......... 1.8.......... .5__._.___. . ?.......... .5.......... 1.4.......... 3.6.......... 2.7.......... 1.I.-.._ .___ 4.......... 1.8
.......... .42.6 ........... I --.__ _ _ _ _
.......... .7
.......... 1.1
.......... 3.5
........A 1.3
2. n ..........
-37.2+ .W
44) -10.4
-0.24
24818301:3M807736
1,7631,8941,9283,1612 0203:4723,4262,0512,1712,5222,660
2,2121,7832,0301,9392,4971,569702
I I
.3022.2971.7161.104.a95
2.2272.2742.3453.7962.4584.1363.9902.4402.8313.0573.174
2.6862.2372.4892.3593.0021.884.E65
8572,8312,3392,2061 9191: 084
1. 0593.3842.7292.7162.3501.329.a28
809837857812817816808
PACIFIC) OCEAN
I I
It is seen from Table 12 that the average percentage differencebetween V and V,, for the entire 44 determinations is 0.2 of 1 percent. Further, it has been computed that the probable error of a

8/14/2019 NOAA accoustic sound in water.pdf
http://slidepdf.com/reader/full/noaa-accoustic-sound-in-waterpdf 25/32
VELOCITY OF SOUND IN SEA WATEB 23
In determining V, the assum tion is made that the echo returns
bottom is sloping, the reflected sound wave which is received willfollow the line passing throu h the vessel normal to tho slope. If
time intervals measured will be too small and Vm mll be too great,
and wcordingly the aver e percentage difference could not possibly
rthle conclusion is thttt if a 6,500-mile cruise with all kinds ofbottom conditions, including several deeps, fails to show the effectof slope, areas of steep slope are of relatively insi Scant extent.
To test this conclusion further, slopes for tf positions wheresoundings 24 to 46, inclusive (Pacific Ocean), were taken, werededuced from the best available information, including the work ofthe Quide and wire soundings by other vessels of the Coast andGeodetic Survey.
from a point vertically below the sB,p. It is of course true that , if the
many of the soundings are t a en a t places of considerable slope, the
be 89 near zero as shown7 the anal-ysis of Table 12. The inevit-
These are given in the following table:
1 0 0 4 2 _ _ _ _ _ _ _ _ _ _ _ _ O M )0 30 43 _ _ _ _ _ _ _ _ _ _ _ _ _ 1 480 60 44 ... _ _ _ _ _ _ _ _ _ 0 000 40 46- . - - * - - - _ _ _ _ _ 0 560 30 40 _ _ _ _ _ _ _ _ _ _ _ 0 120 05
I I I I II I____The mean slope is about 1" with a madmum of 0 .
It must not be inferred that steep slopes do not exist. They are
important geographical features of interest to the eobgist and of
cedure the velocity of sound can be determined without appreciableerror due to slope.
The agreement between V,,and V , has been tested by determiningthe average pe rcen tqe difference and the rohable error of a singlevalue for all the soundings of Table 12. Agetter test is the exami-nation b the wme method of characteristic groups, each of approxi-
Soundings 5 to 10, inclusive, of general de th of 3,000 fathoms,
give an average percentage difference of 0.2 of 1 per cent, with aprobable error of n single value of 0.8 of 1 per cent. Serial temper-atures and salinities were taken a t sounding No. 7.
articularly rigid tost is the a plication to three soundings takenin%res Deep, north of Porto 8100,angin from 4,075 to 4,617fathoms. For these the average percentage iifference was 0.5 of 1per cent, with a probable error for a single value of 1 1 per cent.
For a group of four soundings, Nos. 18 to 21, inclusive, in theCaribbean Sea, with depths from 1,900 to 2,800 fathoms the aver-
e percentage difference was 0.5 of 1 per cent, with a prohable error
For a group of nine soundings, Nos. 36 to 44, inclusive, in the
concern toethehydrographer and ocean0 apher. r he purpose ofthe discussion has been to bring out the Y ct that by proper pro-
mately tKe same physical conditions and general depth.
taken over a level portion of the sea floor o the North Atlantic,
oT a single value of 1.6 per cent.

8/14/2019 NOAA accoustic sound in water.pdf
http://slidepdf.com/reader/full/noaa-accoustic-sound-in-waterpdf 26/32
24 U. 5 COAST A N D GEODETIC SUR'VEY
With differing conditions it should follow that in different regionsvelocities for the same depth should vary. This is found to be thecase. Soundings Nos. 3 n the Atlantic and 44 n the Pacific form anexample of this kind, with velocities 828 and 821 fathoms/sec.,
respectively, the depth at each being a proximately 2,500 fathoms.
depths. Sounding No. 23, depth 185 fathoms, and sounding No.34,depth 3,472 athoms, both have a computed velocity of 828 fathoms/sec.
Also in some cwes the velocities are tEe same for widely differing
SOURCES OF ERROR
The agreement between V , and V, which has been shown by theabove study of Tables 11 and 12 is seen to be remarkably good whenit is considered how many elements enter into a compmson of thesetwo quantities and what sources of error there are in the determi-nation of each of these elements. These sources of error will be dis-cussed in some detail.
Errors in the determination of V , include errors in the determi-nation of depth by wire sounding, and errors in the measurement ofof the time interval with the sonic depth finder.
The accuracy of the determination of depth by wire soundingdepends upon the skill with which the soundin is taken. Thecommanding officer of the steamer Guide, Lieut. mmander R. F.Luce, Coast and Geodetlc Survey, showed exce tional skill in handl-
during every sounding. In only a few cases were the currents
strong enough seriously to affect the accuracy of the wire measure-ment. The accuracy of the registering sheave was tested by run-ning over it a measured length of wire, and the error was found tobe ne ligible. Change in length of the wire with temperature was
weather conditions, fortunately was absent during most of thecruise of the Guide.
The question of the accuracy of time-interval determination undcrservice conditions is of special interest because previously to thecruise of the Guide the apparatus had not been submitted to the testof continuous check against wire soundings in depths such as to make
the time intervals large. The essential precaution is the maintenanceof eriod of disk rotation a t exactly 10 seconds, which the tuning-forR governor usually accom lishes. The depth finder used was ofthe first type developed by Koctor Hayes and had some operatingdefects that have been remedied in later types. One of these was thedifficulty of reducing the loudness, as heard in the phones of theoriginal oscillator sound so as to be com arable with that of the echo.When the oscillator is operated a t fulPpower it is often extreme1difficult to hear the echo and synchronize it with the original s o u n iThe strength of echo also varies with the character of the bottom, so
that in some cases the echo was faint in moderate depths and strongin great depths. Precision of synchronism depends very largely on
ing the vessel, and the wire was kept as nearPy vertical aa possible
also Bound negligible. One common source of error, unfavorable

8/14/2019 NOAA accoustic sound in water.pdf
http://slidepdf.com/reader/full/noaa-accoustic-sound-in-waterpdf 27/32
VELOCITP O F SOUND IN SEA WATER 25
In the studies so far made i t seems to be important chiefly in depthslesa than 500 athoms. It is therefore advisable in a given region ofmoderate depths to take the ersonal equation into account.
consistency is obtained. On one occasion a special effort was madeto determme the ultimate possibilities under exceptionally favorable
conditions. For five soundings in depths rangin rom 535 to 702fathoms the maximum difference of m y value of 5: from the meanwas 1.5 fathoms/sec.
The accuracy of the determination of Vo depends not o n l upon
abilhy of the adopted values of tern erature and salinity. The
it has been brought out that there is a possibility of small errors inthe tables themselves and in the method of deriving M from thetables. The reliability of the ado ted values of temperrtture andsalinity depends on whether they gave been actually measured orinter olated betwcen such measurements as in the case of the Guide
Theanalysisof all the resups indicates t hat a atisfactory degree of
the fundamental corrections of the method but also upon ti reli-
fundamental correctness of the method as been fully discussed, and
or wi ether they have been derived from less reliable sources.
APPLICABILITY OF COM PUTED VELOCITIES TO ACOUSTIC SOUNDING
During the cruise of the Guide depths were determined at 150ositions by the sonic depth finder alone, using computed velocities.
gome of these determinations were in the vicinity of previous wiresoundings obtained by various Coast Survey vessels and the agree-ment was found to be very satisfactory. This brings up the importantquestion as to whether satisfactory soundin s can be made with the
control afforded by wire measurements and determinrttions of tem-perature and salinity. I n this case it would be necessary to obtainthe adopted tern eratures and salinities from the best available pub-lished values. #hem are found in various publications.R
Such a proceduro will give results much nearer the truth than theadoption of a single value of the velocity of sound for all conditions.
It would obviously be of advantage to have tables ex ressing
out that such tables can not be of universal application, but it is
probable that they can be prepared for regions of considerableextent provided that the physical conditions of tHe sea water arkapproxmately the same throughout the region.
sonic depth finder alone, using computed ve ocities, but without the
velocity as a function of depth alone. It has been clearly E rought
“A study of the saltrdty of the surfsoe water inthe North PacIBo Oceanandin the adjacent incloaeci
“bas spezh&e Oewlcht des M e 8 r w ~m NordLt Pacieschen O w n in Zusammenhange mitTemperaturund StrUrnungsewthden,” by Adolph Wadenkohl, Dr. A. Petermann’sQeogr. Mitteilmgen
” by A. Q. Clark, Bmithsonian MiscalleneousCollections, vol. (10, No. 13, Deo. 4, 1912.
-1697. Heft XII.“Expl&atb-d the United States Coast and Geodetic Survey steamer Barhe in the western AtlantiFI
January-Mar& 1a4 under the direction of th e United States Bureau of Fisheries,” “Oceanoby Henry B. Blgelow, App. V to the Report of the U. 8.Commission of Fisheries for 1916. #&au of
hy.
F?$xria Dooument No. 833 1917.The emperaturea s d o ravlties, and aelinftles of the Weddell Sea and of the North and South
Atlantic Ocean I’ b kr. 8. Bruce,Andrew King, and D. W . Wilton, Transactions ofthe Royal 8ooietyof EdInbuwh. h l ,T . Part T. n 71. 1l)lClfi.
G p apMsaher hastalt, heraw bpol b Prof.’Dr.A . 8upm 45 Band 1888 Ootha Justus Perthes
8/14/2019 NOAA accoustic sound in water.pdf
http://slidepdf.com/reader/full/noaa-accoustic-sound-in-waterpdf 28/32
26 U. 8. C O A S T A N D G E O D E T I C SURVEY
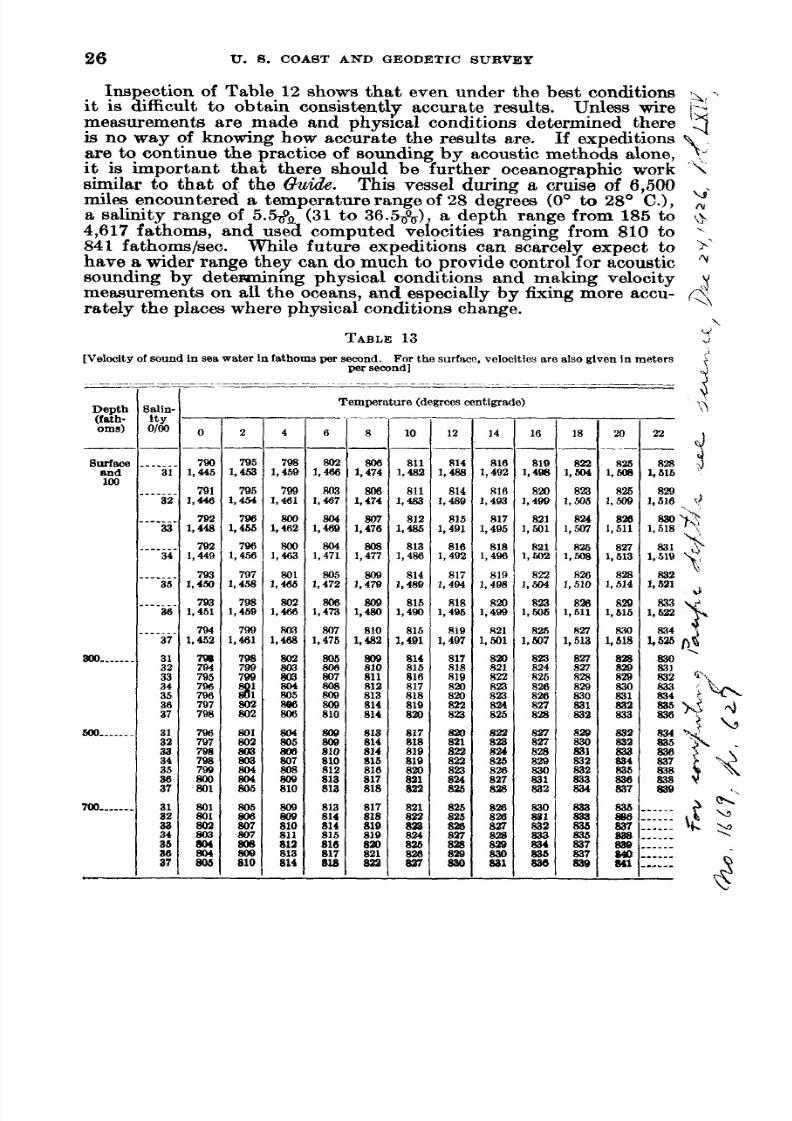
Ins ection of Table 12 shows that even under the best conditions '\. -.it is Bifficult to obtain consistently accurate results. Unless wire 1-r
a salinity range of 5.5-& (31 to 36.w a deptr ange from 185 to <%\
measurements are made and physical conditions determined there 3is no way of knowing how accurate the results are. If expeditionsare to continue the practice of sounding by acoustic methods alone, -it is important that there should be further oceanographic work .;similar to that of the Gruide. This vessel during a cruise of 6,500 ~.miles encountered a temperature range of 28 de ees (Oo to 28' C.),
4,617 fathoms, and used computed veiocities ranging from 810 to :.841 fathoms/sec. While future expeditions can scarcely expect to ).
have a wider range they can do much to provide control for acoustic c\r
sounding by detewaining physical conditions and making velocitymeasurements on all the oceans, and especially by fixing more accu- 4rately the places where physical conditions change.
\
U141,488
8141,489
8161,491
8161,402
8171,494
8181,496
8191,497
81781881982082082a823
8ao821
822823824
826
826
823
8%
TABLE3
8161,492
R101,493
8171,496
8181,496
8191,498
am1,488
R211,Wl
am8218228238238%825
822828
825828827
8 2 6 8 3 8
828
828an828
8
an
[Velocityof sound in sea water in fathoms per second. For the surfaco, velocities are also given in meters
aOO.....-.
I
313233
35as37
a4
8urrace ---_.-
and I 31100
500______.132aa34368837
M o _ _ _ _ _ _ 31
aa34aa
Temperature (degrees centigrade)
0
_ _
7801,445
7911,448
7921,448
7821,449
7931,450
793
1,451
7941,452
7Q794795786798797798
79079779878879p800801
801
801soa803
2
795
1,453
7951,454
7961,465
7961,458
7971,458
7981,459
7991,461
79a799
802802
801
803803804804806
805
806807807
wa
4
7981,459
7991,461
8001,462
8001,463
8011,466
802
rn1,488
8028038038048058wi808
804806808807808BOB810
BOB
BOB810811
8021,466
803I 467
8041,488
8041,471
805I 472
m1,473
807I 476
m808807SOB808809810
808808810810812813818
813
814814815
8
-806
1,474
8061,474
8071.476
8081,477
8081,478
BOB1,480
8101,482
808810811812813814814
813814814816816817818
817
810819ai8
10
8111,482
8111,663
8121,686
8131,488
8141,489
8161,480
8151,491
814815816817818819820
8178188198198208al823
821
82282.8824
10
8191,498
8201,499
8211 , 601
8211 m
8221,604
8231,606
8251,607
8238248258%828827sal
827821828828830831832
830
S1
a33saa
18
82L1,
8231.506
8241 , m
8261,ws
8261,510
8261,611
R271,513
827827828828830831
839830831832832833834
g)a
a835836
839
'20
-.-
U2.6
1,WB
82-54 508
8261,611
8271,613
8281,514
8281,516
RW1,618
8
g2Q828830831833833
832aaaa84836838837
836
886837888
aaa
828l 616
8291,518 . \

8/14/2019 NOAA accoustic sound in water.pdf
http://slidepdf.com/reader/full/noaa-accoustic-sound-in-waterpdf 29/32

8/14/2019 NOAA accoustic sound in water.pdf
http://slidepdf.com/reader/full/noaa-accoustic-sound-in-waterpdf 30/32
VELOCITY O F SOUND IN SEA WATER 27
_-
Depth(fathoms)
4 6
TABLE3-Continued
Temperature I Temperature
. .._____. . .__
3,700
- - _ _ _ _ _
- - _ _ _ _ _. _ _ _ _ _ _ _
.-.....
3,900-._.___- . _ _ _ _ __ ~ _ _ _ _ _4,100
.-. _ _ _ _ _
. - ._____- > _ _ _ _ _
.- ._____
.-._____4,300
. I _ _ _ _ _
.- _ _ _ _ _
-
0
803804805805808
an7aG9
806807808809809810R11
808
HI0811812
814814
813814815R18818817817
818817818819820821822
n13
I
852 854854 856855 858
855 857858 858
856 856866 857a57 858857 859858 880
E60 881880 861861 862861 863862 883
863 883883 889868 864864 866
864 866
2
808808SO9810811812813
811812813814814815818
814
814816818817818R18
817RI8819820821822823
820821822823824826826
-.
8588.58858859860
859860861862862
....-..-.. 864 868 888
_ _ _ .--....66 867 8604, ,XKl 886 867 870
_ _ _ . _ _ _ _ _ _68 867 870~ _ _ _ _ _ 867 868 871
__._._..__89 871 873_ _ _ _ _ _ _ _ _ _ 889 872 8744,700 870 872 875
_ _ _ _ --.... 871 873 875_ _ _ _ _ _ _ _ _ _ 872 873 876
-2
843
844R4.5846
84884884985085 1
8518528538548%
853854854855856
n44
- - O
827 31 821828 32 822829 33 823830 34 824831 35 825832 36 825833 37 826
-...- SI 823..... 32 824_ _ _ _ _ 33 825_..._4 825..... 35 828___..6 827_ _ _ _ _ 37 827
....- 31 828
-.... 32 829..... 33 828
._.__8 832_ _ _ _ _ 37 832
.--.. 31 830___..2 831___._3 831..-.- 34 832_ _ _ _ _ 35 833_..__8 834_ _ _ _ _ 37 836
_.._.1 833___._2 834____.3 835.____4 838
____.6 837-__.-7 838
_..__4 a30..... 35 si
_ _ _ _ _ 3s a36
-
1
aa825825828827827828
R25826827827828828828
830
$3 1832832833834834
833833834834835838837
8368378388383 8
839841
-.
-
2
-
825827827828829829830
827828829830831&?1832
832
x33
R35838837837
835836838837838839839
$18839840
840841R42843
a34
-
. _I___
826827828829830831831
828829830831832833833
833
834835R36K37$3 8838
R38837838838839839840
839840841
842843843844
1,900
2. 100
2, 3 w
2 m
2,700
--- 1

8/14/2019 NOAA accoustic sound in water.pdf
http://slidepdf.com/reader/full/noaa-accoustic-sound-in-waterpdf 31/32
vessel for the reduction o f Fehling’s solution in a
hot water bath. The handling o f ordinary contain-
em while hot during filtration is dif6cult and m e w
tain. Comfortable and safemanipulation of the fl astr
by the ring “handle” is possible almost immediately
after removal from tbe bath, if the flask is set into
cold water, or held u d e r the tap for a few seconds.
Rinsing witb hot water is Mxomplished with equal
ease and safety. Nearly six hundred sugar deter-
minations have been *an without a single loss whenthis special “ringed &rak” was used.
C H A ~ L E ~.R o a ~ a sDEPUTXMTOF W A H Y ,
COWMbo AoWtXEATXUL & W E ,
FapT COLLINB, C%QEADo
SPECIAL ARTICLES
CORRECT VELOCITIES FOR ECHO SOUND-
ING IN THE PACIFIC OCEAN
SPECIALublication No. 108, United States Coast
and Geodetic Survey, “Velocity of Sound in SeaWater? gives tablea from which may be derived, by
velocity of sound to use in echo sounding, provided
that the temperature and salinity of the water are
known.If we know the average 8 M d conditions of tem-
perature and salinity for any ocean for all depths,
tables can be prepad which indicate regions
throughout which the same velocities can be used for
given depths without introducing material error. De-termination of the extent of such regions and the
velocities to be used in each is the purpose of t h i s
paper. The resdts show that the information can
be given in a simple and easily used table for theentire Pacific Ocean.Informationas to mean annual temperature at the
surfam and at v r r ious depths was obtained from the
publication %e Warme Verteilung in den Tiefen
des Stilien Ozeans” by Gerhardt Schott and Fritz
Schu. The information was amplified from the Re-port of the Scientific Results of the Challenger Ex-pedition, Physics and Chemistry, Vol. 1. Information
regarding salinity was obtained from an atlas ofthirty-one maps published by the Deutsche Seewarte
in 1896 and from the Challenger report just men-
tioned.
For convenience, a map of the North Pacific waa
selected which gave the outlines of the Innd and
tion the average
to use, the same
Seasonal changes of temperature were neglected, aa
these d e c t only the two upper layers and the secondlayer but Slightly. While the variation of tempera-
ture at the surface during the B B B S O ~ s cons
in the temperate mnes, the average tem
the upper Iayer does not vary much.With the temperature and salinity fixed for each
layer, the proper velocity fo r any desired depth was
obtained ftom the tables of Special Publication No.108, applying the adiabatic correction. The veloci-
ties were tabulated for 600 fathoms, l,zoO, etc., to
5,400 fathoms, the greatest depth known.
The form of Wle adopted as most convenient was
not a velocity t&e, but a percentage convetion table.
In practically all mho sounding now being carr iedon, all soundings re computed for a standard velocity
and all that is needed is the correction to apply for
the proper velocity. The percentage of correction tobe applied is equal to the proper velocity divided by
the standard velocity, minus one. Thus,if standardvelocity is 800 fathoms per sectond and proper veloc-
ity is 824 fathoms per second, the percentage o f cor-
rection is 3.0. The United S t a b Navy and theCoaat and Qsodetio Survey have adopted the above

8/14/2019 NOAA accoustic sound in water.pdf
http://slidepdf.com/reader/full/noaa-accoustic-sound-in-waterpdf 32/32
6% SCZENCE [VOL.LxIv No. 1669
named standard velocity of 800 fathoms (4,800 feet)
per second. So long es the standard velocity is less
than any adopted proper velocity, the correction is
additive.
The percentages of correction were compiled on a
similar map to that used fo r temperature and salinity.The next, operation was to determine the extent of
the region for which the same table might be used
Inspeetion of the map showed tbat for aU inter-
there was little departure from the mean value for5 5 ~ - 1 . - - 0 * 3 lm 3 *o 2'6 3'2 4.0 4'6 5'2
50-40 _____.6 1.0 1.5 2.0 2.6 3.3 4.0 4.6 5.2
35 ....."._13 1.4 1.7 2.2 2.8 3.4 4.1 4.8 5.3he entire region. Mean percentages of correction
were adopted for each layer and the rule was adopted 300 N400 2.0 1.7 2.0 2.5 3.0 3.6 4.2 4.9 5.4
that in general the range of the comted sounding 450 S _......._.._.3 1.4 1.7 2.2 2.8 3.4 4.1 4.8 5.3
should not exceed five fathoms on either side of the 50 .... ....--...... 0.6 1.0 1.5 2.0 2.6 3.3 4.0 4.6 5.2
mean. Fur the r inspection showed that for all inter- 55 ._. _.._.3 0.5 1.1 1.7 2.3 3.0 3.7 4.3 4.9
sections on parallels 40 and 50" N. a seeond table 60 . . -0.0 0.1 0.7 1.5 2.1 2.7 3.5 4.1 4.7
would suace. A still dser en t table was found necea-
sary for the north part of Bering Sea, deep portion For the benefit of those who wish to use metersapproximately in Lat. 60 N. These three tables and a different standard value, Table 6 has been pre-
with interpolation between them cover the entire North pared, giving the computed velocities in fathoms andPacific except the adjacent seas on the west side and meters corresponding to the percentage corrections in
the shoal portion of Bering Sea. Tables 1 o 4.
The area of the South Pacific was then examined,
Table givea 5.2. Correction is 270 fathoms and cor-
rect sounding 5,470.
TABLE 5
PERCENTAGESF CORRECTIONO BE h p p mm TO ECHOSOUNDINGS~ I_
Depth in fathoms0 0 0 0 0 0 0
Lat- 0 ~ 0 0 0 0 0 0without introducing appreciable emr. 8 z- 2- ; 2- 4 2- $- z-=tions from and including 3 0 N. to the equator 60 N ...,_...I..-. 0.0 0.5 1.1 1.9 2.5 3 8 3.9 4.5 5.1
.
_-
TABLE 6
S. The tables follow.
___ . _ _ _________I _____
--Table 1 Table 2 Table 3 Table 4
Fathoms 60" N 50" 8 40" S 60 s50-40" N, 30" N to
600 .....
1,200.....
1,800. ...
2,100 .....
3,000 .....
3,600 .....
4.200 .....
4,800__.__.
5,400 .....
0.0
0.5
1.1
1.9
2.5
3.2
3.9
4.5
5.1
0.6
1.0
1.5
2.0
2.6
3.3
4.0
4.6
5.2
2.0
1.7
2.0
2.5
3.0
3.6
4.2
4.9
5.4
0.0
0.1
0.7
1.5
2.1
2.7
3.5
4.1
4.7
In order that interpolation may be easy, and only
one table be needed, the information has been rear-
ranged in Table 5.
Examples of w e of table: At 35 N., 140 W. an
echo sounding of 2,923 fathoms was obtained using
600 1,097 799 1,461
1,200 2,194 804 1,471
1,800 3,292 809 1,479
2,400 4,389 815 1,491
3,000 5,486 820 1,499
3,600 6,584 826 1,511
4,200 7,681 831 1,519
4,800 8,778 836 1,529
5,100 9,875 841 1,537
805 1,472 815 1,492 799 1,461
808 1,478 813 1,488 801 1,465
812 1,485 815 1,492 806 1,474
815 1,492 820 1,500 812 1,485
821 1,501 824 1,507 817 1,494
826 1,511 828 1,515 822 1,504
833 1,522 833 1,524 828 1,515
837 1,530 839 1,534 833 l p2 2
842 1,539 844 1,542 838 1,532
Salinit ies w e d : 34 ass used from 30" N. to 40 S.,
except 33 at 20 N. rom 160 to 130 W., nd at10 N. from 140 to 120 W. For all other areas,
salinity 33 was adopted. Error introduced by this
practice is small.To show that the m r nvolved in using the tablea
for the large regiom adopted is not great, Table I
was prepared. The equatorial region is selected as
it has a greater range than the others. The reation