noaa – national marine fisheries service week three ... · 2008 luth cruise – week two page ......
TRANSCRIPT

WEEK Three SEPTEMBER 8 – 14
Studying Leatherback Use of Temperate Habitat Along the Central California Coast
Weekly Science Summary Scott Benson (Chief Scientist)
After an important and well-deserved rest for scientists and crew, the NOAA Ship David Starr Jordan crossed beneath the Golden Gate bridge on Monday morning for the last time this year under a thick blanket of low clouds. Joining us this leg are acousticians, George ‘Randy’ Cutter and Juan Zwolinski; oceanographer,Steven Bograd; leatherback turtle expert, Peter Dutton; teacher at-sea, Mary AnnePella-Donnelly; and Amy Hapeman from the Office of Protected Resources –Permit Division at Head Quarters. We’re also carrying some new equipment thisleg. Bruce McFarlane (SWFSC – Santa Cruz, California) provided us a another netfor jellyfish trawls to replace the net that was destroyed just prior to the end of thefirst leg…thanks Bruce! Randy and Juan (SWFSC – Advanced SurveyTechnologies) have brought a pole-mounted multi-beam and side scan sonarsystem to characterize epipelagic fish and jellyfish that are too close to the surfaceto be detected by our downward-looking transducers.
With our new pole-mounted acoustic systemproviding a new vibration to the David StarrJordan, we immediately transited 20-40 milesoffshore to an area where the aerial surveyteam had found a few turtles and somescattered jellyfish during the previous FridayWe also managed to find a few jellyfish withinthis shelf habitat among numerous humpbackwhales and a few blue whales. Afterwards, wetransited to the north side of Point Reyes.
During prolonged relaxation events, warm water within the Gulf of theFarallones will move northward and around the point, hugging the immediatecoast, creating exceptional leatherback foraging conditions in front of the PointReyes National Seashore. We suspected that conditions were good for such ascenario after reviewing some remotely sensed data and monitoring themovements of a turtle that carries a satellite tag we attached during September2007. Upon arrival at our destination, we were not disappointed… giganticproportions of large Chrysaora fuscescens (sea nettles)! Our tagged turtle was in thislocation while we were in San Francisco and she left some calling cards of her visitwith numerous partially eaten jellyfish floating languidly at the surface. Weattempted a brief two minute trawl to sample the jellyfish but our replacement netcould not hold the haul, releasing the jellyfish back into the sea. Score one for thejellyfish. Disappointed and covered with stinging jellyfish slime, we proceeded todip net a few of the creatures before retreating offshore again.
2008 LUTH CRUISE
CHIEF SCIENTIST:
Scott Benson
CRUISE LEADER:
Scott Benson
SURVEY
COORDINATOR:
Annette Henry
SCIENTISTS (A-Z):
Steven Bograd
Randy ‘George’ Cutter
Peter Dutton
Karin Forney
Justin Garver
Elizabeth Zele
Juan Zwolinsky
VISITORS:
Amy Hapeman
TEACHER AT SEA:
Mary Anne Pella-
donnelly
NOAA – National Marine Fisheries Service
Scott Benson holding a sea nettle
“Upon arrival at our destination, we were not disappointed… gigantic
proportions of large Chrysaora fuscescens
(sea nettles)!”
Justin Garver in the oceanography lab
Weekly Science Summary - Continued
Victor Pinones, Joao Alves, and Peter Dutton piecing together the “Franken-net’
2008 LUTH CRUISE – WEEK Three Page 2
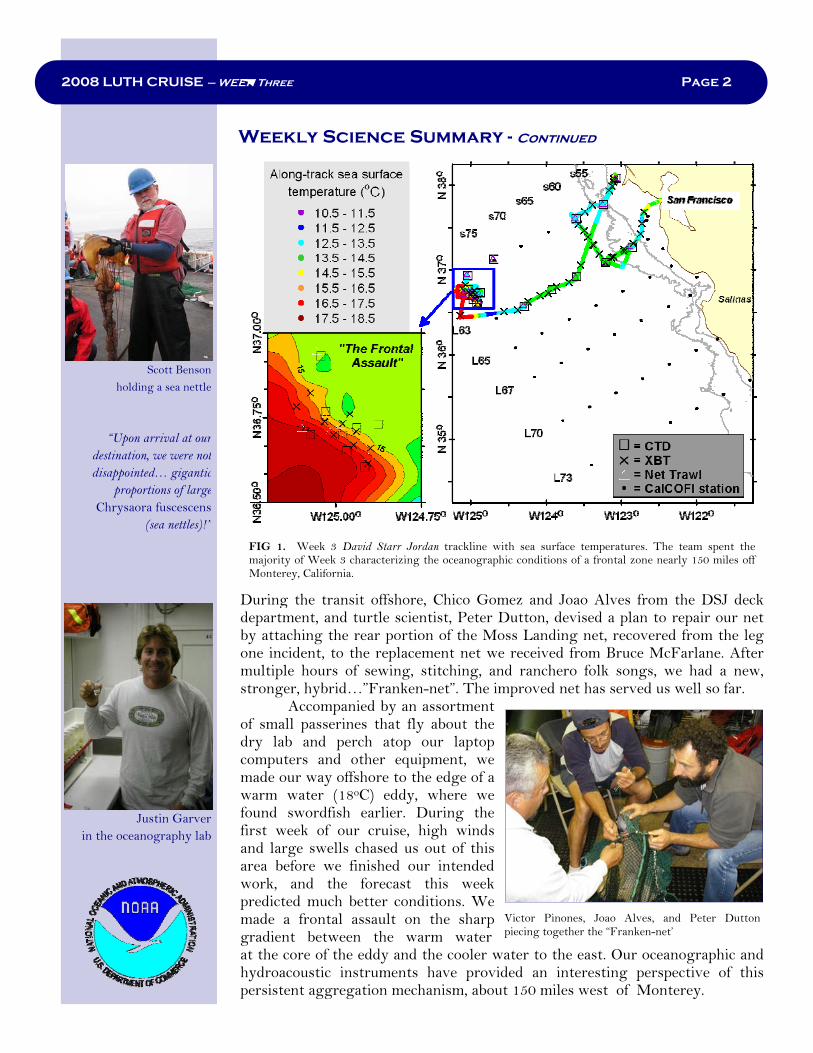
FIG 1. Week 3 David Starr Jordan trackline with sea surface temperatures. The team spent the majority of Week 3 characterizing the oceanographic conditions of a frontal zone nearly 150 miles off Monterey, California.
During the transit offshore, Chico Gomez and Joao Alves from the DSJ deck department, and turtle scientist, Peter Dutton, devised a plan to repair our net by attaching the rear portion of the Moss Landing net, recovered from the leg one incident, to the replacement net we received from Bruce McFarlane. After multiple hours of sewing, stitching, and ranchero folk songs, we had a new, stronger, hybrid…”Franken-net”. The improved net has served us well so far.
Accompanied by an assortment of small passerines that fly about the dry lab and perch atop our laptop computers and other equipment, we made our way offshore to the edge of a warm water (18oC) eddy, where we found swordfish earlier. During the first week of our cruise, high winds and large swells chased us out of this area before we finished our intended work, and the forecast this week predicted much better conditions. We made a frontal assault on the sharp gradient between the warm water at the core of the eddy and the cooler water to the east. Our oceanographic and hydroacoustic instruments have provided an interesting perspective of this persistent aggregation mechanism, about 150 miles west of Monterey.

The associated strong currents and gradient orientation made for somechallenging brain twisters as we’ve ascended the learning curve of sampling thisfeature. The adaptive sampling regime has been mentally exhausting butworthwhile, yielding small trawl yields of sea nettles, moon jellies, andnumerous sea gooseberries. Previous telemetry data of leatherback movementshas indicated occasional use of similar offshore waters. Although prey is muchless abundant in these deep offshore areas in comparison to the coastal zone, webelieve we have found a fast food hotspot on the trans-Pacific highway, anddocumented the physics that create it. The week ended with good evening’s haulof Humboldt squid – right at the edge of the front, of course. We’ll bring backsquid parts for our colleagues at SWFSC–Fishery Ecology Division, Santa Cruz.
2008 LUTH CRUISE – WEEK TWO Page 3
Peter Dutton holding a Humbolt squid
(Dosidicus gigas)
Seabirds such as the Black-footed Albatross (above) were anticipated during LUTH, but birds such as the Western Tanager (below) unexpectedly took residence on the ship when more than 100 miles offshore, probably blown off course during their southbound migrations.
Weekly Science Summary - Continued
2008 LUTH CRUISE – WEEK Three Page 3
Net-tows just northwest of Point Reyes during Week 3 yielded substantial jelly hauls. These hauls proved too large for the net to handle and the catch was lost when the net opened up.
Regardless of weather conditions and light levels, the CTD was deployed up to five times daily on Leg 2 of LUTH 2008. Pictured here are Karin Forney and Liz Zele deploying the CTD on one of the calmer sea days.
Computer programming and analysis of satellite weather data has been an around-the-clock exercise during LUTH 2008. Pictured here are Steven Bograd and Karin Forney discussing yet another computer application to enhance data collection efforts.
2008 LUTH CRUISE – WEEK Three Page 4
Jellies on the Edge
Deploying a bongo net during LUTH 2008
Before each trawl, the ‘big eyes’ were used
to search for marine mammals in the area
Common dolphin (Delphinus delphis)
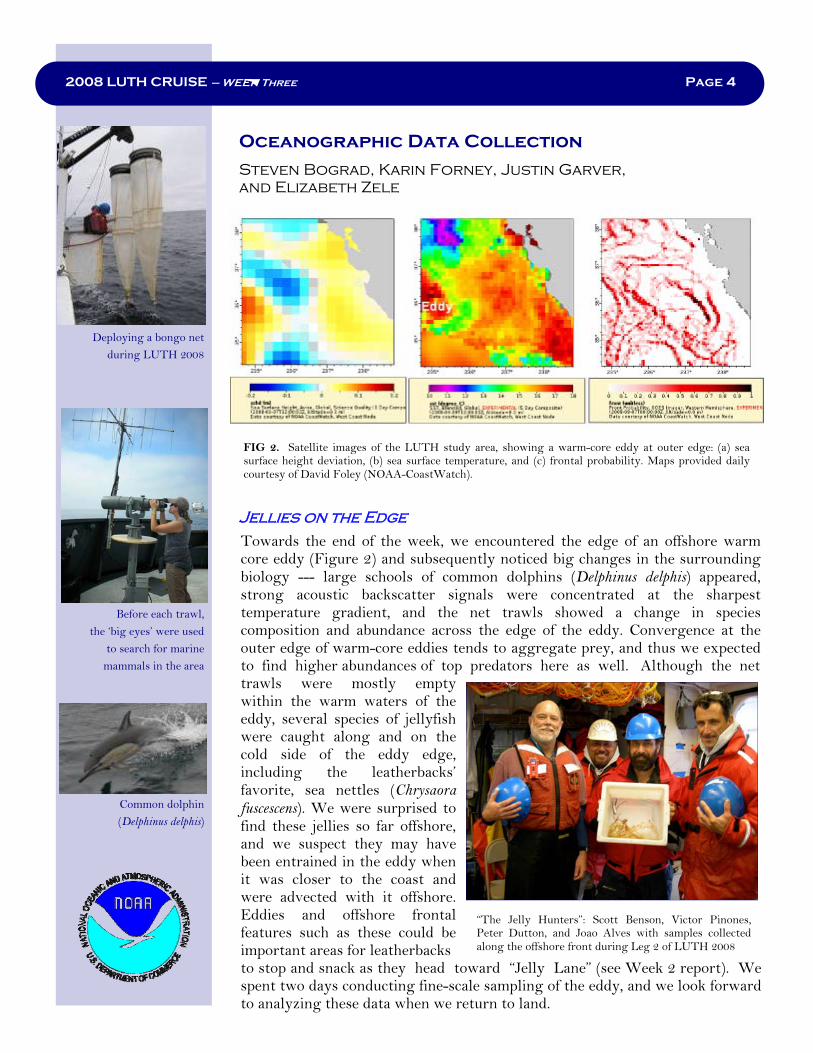
FIG 2. Satellite images of the LUTH study area, showing a warm-core eddy at outer edge: (a) sea surface height deviation, (b) sea surface temperature, and (c) frontal probability. Maps provided daily courtesy of David Foley (NOAA-CoastWatch).
Towards the end of the week, we encountered the edge of an offshore warm core eddy (Figure 2) and subsequently noticed big changes in the surrounding biology --- large schools of common dolphins (Delphinus delphis) appeared, strong acoustic backscatter signals were concentrated at the sharpest temperature gradient, and the net trawls showed a change in species composition and abundance across the edge of the eddy. Convergence at the outer edge of warm-core eddies tends to aggregate prey, and thus we expected to find higher abundances of top predators here as well. Although the net trawls were mostly empty within the warm waters of the eddy, several species of jellyfish were caught along and on the cold side of the eddy edge, including the leatherbacks’ favorite, sea nettles (Chrysaora fuscescens). We were surprised to find these jellies so far offshore, and we suspect they may have been entrained in the eddy when it was closer to the coast and were advected with it offshore. Eddies and offshore frontal features such as these could be important areas for leatherbacks to stop and snack as they head toward “Jelly Lane” (see Week 2 report). We spent two days conducting fine-scale sampling of the eddy, and we look forward to analyzing these data when we return to land.
“The Jelly Hunters”: Scott Benson, Victor Pinones, Peter Dutton, and Joao Alves with samples collected along the offshore front during Leg 2 of LUTH 2008
Oceanographic Data Collection
Steven Bograd, Karin Forney, Justin Garver, and Elizabeth Zele

Acoustic Studies
Randy Cutter and Juan Zwolinski
NOAA-National Marine
Fisheries Service
The offshore eddy offered an opportunity to examine acoustic backscatter and jellyfish occurrence across a strong oceanographic front. On September 12, weconducted a transect into the eddy and back out, to document biotic and abioticfeatures. As we transited from Point A to B (Figure 3), the EK60 echograms contained distinct patterns indicating aggregations of acoustic scatterersassociated with the rapid change in sea surface temperature at the front. Priorto arriving at the front, the record from the cooler water shows a narrow upper scattering layer (from the transducers to a depth of ~ 20 m), with sparse scatterers for all frequencies, and a denser aggregation from 25 to 50 m (Figure 4a). Evidence of turbulence and mixing water masses at the front, extending to a depth of 200 m was apparent in the 70 and 200 kHz echograms (Figure 4b). Where the surface temperature stabilized, an aggregation of scatterers was found from ~ 50 to 80 m depth in all frequencies (Figure 4c). In the area with warm surface water, the scatterers were aligned in a thin layer at the thermocline depth (Figure 4d). At the northern cold side of the front, the surface scatterer aggregation was dense from the transducer to 25 m in all frequencies, and to 50 m in 70 and 200 kHz (Figure 4e). Moving away from the front into cooler water toward the north, higher levels of scattering begin to appear in the dense surface aggregation (Figure 4f). Detailed analysis of these data are underway to apportion the scattering to biological groups and determine if the various spatial aggregations of scatterers were associated with different taxa.
2008 LUTH CRUISE – WEEK Three Page 5
Randy Cutter with yet another
Humbolt squid
Amy Hapeman, from the
NOAA HQ Permits Office was
a visitor on Leg 2, assisting
with a variety of research
activities on the Jordan
FIG 3. Map of the transect on 12 Sept. 2008, through a front, color-coded by sea surface temperature (°C), and LUTH 2008 stations from Leg 1 (left). Sea surface temperature record along the transect from Point A to B (right). Lower case letters correspond to echograms in Figure 4.
FIG 4. Echogram data screen, showing acoustic backscatter information. See text above.
2008 LUTH CRUISE – WEEK Three Page 6
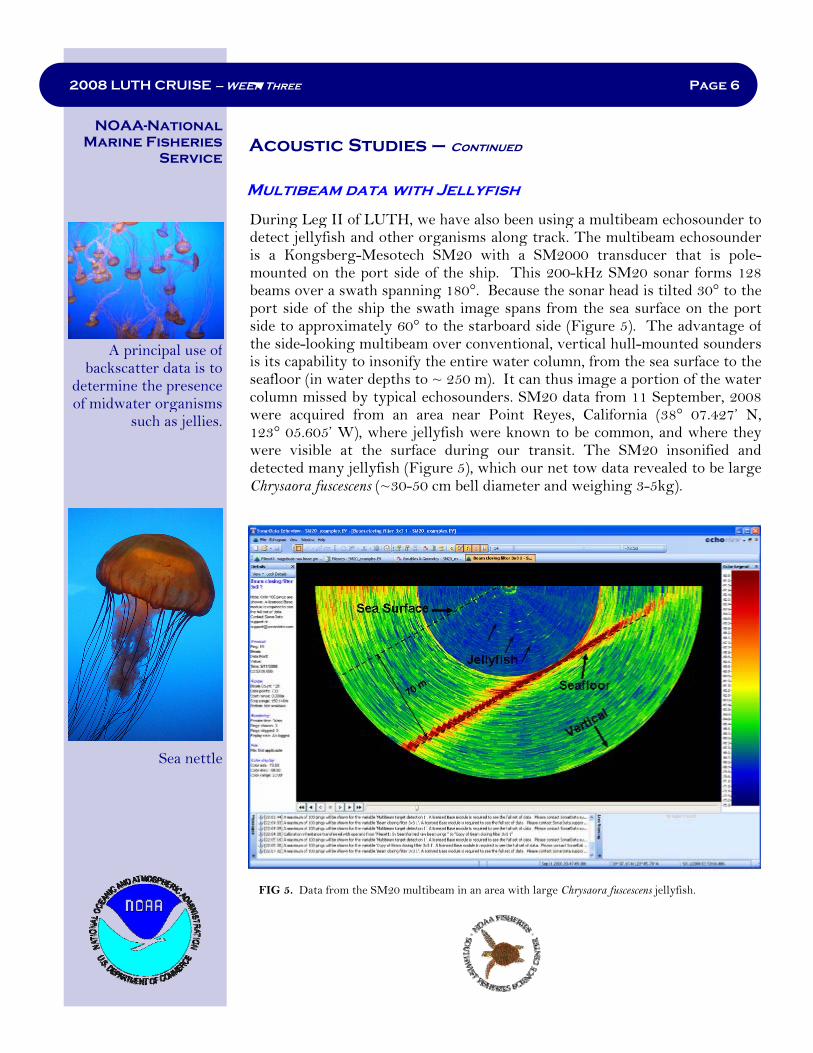
During Leg II of LUTH, we have also been using a multibeam echosounder todetect jellyfish and other organisms along track. The multibeam echosounderis a Kongsberg-Mesotech SM20 with a SM2000 transducer that is pole-mounted on the port side of the ship. This 200-kHz SM20 sonar forms 128beams over a swath spanning 180°. Because the sonar head is tilted 30° to theport side of the ship the swath image spans from the sea surface on the portside to approximately 60° to the starboard side (Figure 5). The advantage ofthe side-looking multibeam over conventional, vertical hull-mounted sounders is its capability to insonify the entire water column, from the sea surface to theseafloor (in water depths to ~ 250 m). It can thus image a portion of the water column missed by typical echosounders. SM20 data from 11 September, 2008were acquired from an area near Point Reyes, California (38° 07.427’ N,123° 05.605’ W), where jellyfish were known to be common, and where theywere visible at the surface during our transit. The SM20 insonified anddetected many jellyfish (Figure 5), which our net tow data revealed to be largeChrysaora fuscescens (~30-50 cm bell diameter and weighing 3-5kg).
Acoustic Studies – Continued
Multibeam data with Jellyfish
FIG 5. Data from the SM20 multibeam in an area with large Chrysaora fuscescens jellyfish.
NOAA-National Marine Fisheries
Service
A principal use of backscatter data is to
determine the presence of midwater organisms
such as jellies.
Sea nettle
2008 LUTH CRUISE – WEEK Three Page 7
Introducing the David Starr Jordan
ENS Kyle Byers
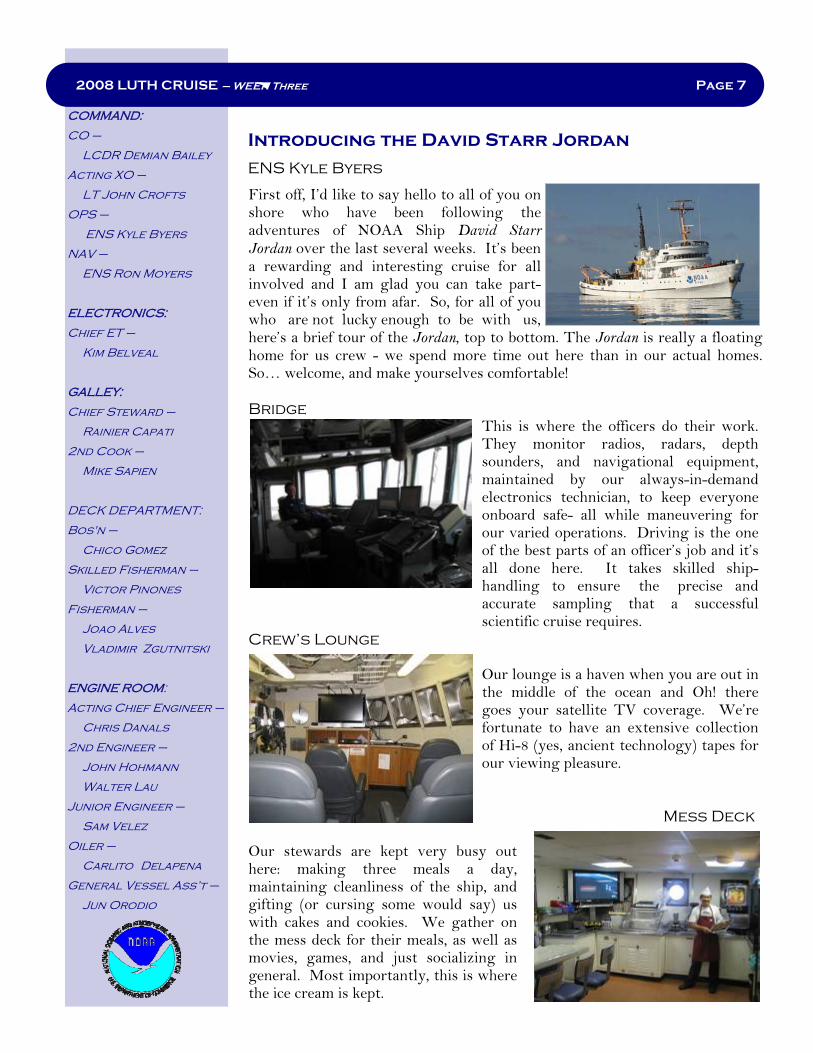
First off, I’d like to say hello to all of you on shore who have been following the adventures of NOAA Ship David Starr Jordan over the last several weeks. It’s been a rewarding and interesting cruise for all involved and I am glad you can take part- even if it’s only from afar. So, for all of you who are not lucky enough to be with us, here’s a brief tour of the Jordan, top to bottom. The Jordan is really a floating home for us crew - we spend more time out here than in our actual homes. So… welcome, and make yourselves comfortable! Bridge
This is where the officers do their work. They monitor radios, radars, depth sounders, and navigational equipment, maintained by our always-in-demand electronics technician, to keep everyone onboard safe- all while maneuvering for our varied operations. Driving is the one of the best parts of an officer’s job and it’s all done here. It takes skilled ship-handling to ensure the precise and accurate sampling that a successful scientific cruise requires.
Crew’s Lounge Our lounge is a haven when you are out in the middle of the ocean and Oh! there goes your satellite TV coverage. We’re fortunate to have an extensive collection of Hi-8 (yes, ancient technology) tapes for our viewing pleasure.
Mess Deck Our stewards are kept very busy out here: making three meals a day, maintaining cleanliness of the ship, and gifting (or cursing some would say) us with cakes and cookies. We gather on the mess deck for their meals, as well as movies, games, and just socializing in general. Most importantly, this is where the ice cream is kept.
COMMAND:
CO –
LCDR Demian Bailey
Acting XO –
LT John Crofts
OPS –
ENS Kyle Byers
NAV –
ENS Ron Moyers
ELECTRONICS:
Chief ET –
Kim Belveal
GALLEY:
Chief Steward –
Rainier Capati
2nd Cook –
Mike Sapien
DECK DEPARTMENT:
Bos'n –
Chico Gomez
Skilled Fisherman –
Victor Pinones
Fisherman –
Joao Alves
Vladimir Zgutnitski
ENGINE ROOM:
Acting Chief Engineer –
Chris Danals
2nd Engineer –
John Hohmann
Walter Lau
Junior Engineer –
Sam Velez
Oiler –
Carlito Delapena
General Vessel Ass’t –
Jun Orodio

David Starr Jordan (1851-1931)
ichthyologist, educator,
writer
The ship is named after Dr. David Starr Jordan
Dr. Jordan was one of the best-known naturalists
and educators of his time. He wrote more than 50
books and published over 600 scientific papers on
topics ranging from ichthyology (the branch of zoology dealing with
fish) to advancing world peace. In 1885, at the age
34, Dr. Jordan became president of Indiana
University. In 1891, he became the 1st president of Stanford University, a post he held for 25 years. Dr. Jordan was a member
of the California State Fish Commission, and his
investigations of the exploitation of the
salmon and fur seal populations helped save
these species.
2008 LUTH CRUISE – WEEK Three Page 8
Aboard the David Starr Jordan – Continued
Fantail The Jordan is a hard-working ship capable of a wide variety of operations- oceanographic tows, trawling, long-lining, ROV deployments, and the list goes on. The fantail is where most of our scientific operations happen. In support of these missions, we have a dedicated, experienced, and highly talented deck department that makes it all happen. Though I think they’re mostly in it for the fish.
Engine Room
Here is where we get our go-juice. We might not go fast (9 knots on a good day, 10 knots with a following sea, wind, and current), but we do go! This ship has been at it since 1965 - and it’s due to the hard work and expertise of our fantastic engine department that we continue to be able to support scientific research so consistently.
To truly experience the Jordan, you’ve just got to see it in person, stay aboard for a couple weeks, and fully immerse yourself in shipboard life. So maybe we’ll see you out here sometime!
A Brief History of the NOAA Ship David Starr Jordan
The David Starr Jordan was built in Sturgeon Bay, Wisconsin in 1964 and commissioned in San Diego, California, in 1966. The ship was designed and built for the U.S. Bureau of Commercial Fisheries, which later became part of the National Oceanic and Atmospheric Administration, for the purpose of fisheries research in the tropical Pacific. Since commissioning, the David Starr Jordan has logged over a million miles while studying the biological and physical oceanography of the eastern coast of the northern Pacific and the eastern tropical Pacific. The David Starr Jordan is an integral part of the marine mammal and sea turtle census efforts conducted by the Protected Resources Division of NOAA Fisheries’ Southwest Fisheries Science Center as well as support for the extensive fisheries research conducted by the Center’s Fisheries Ecology and Fisheries Resources Division. The vessel is operated by NOAA’s Office of Marine and Aviation Operations.

Aerial Surveys
Erin LaCasella During Week 3, the fog has been very persistent and kept us grounded, although it has made weather monitoring more straightforward with a consistent 1200- to 2000-ft deep layer of fog (Figs. 6a, b, c). Weather monitoring and decision making to fly can be rather challengingsince aerial surveys are a fine balance of conditions, typically between wind(Figure 6d) and fog. The disappearance of fog usually requires a frontal systemor the wind to blow it around, however too much wind affects the sea state,viewing conditions, and effectively the value of the data collected. Withrespect to fog and/or cloud cover, while flying surveys at 650 feet in altitudewe can potentially fly under a ceiling of clouds if high enough. The challengethen becomes the dark, sort of reflective appearance on the water (similar tothe back of aluminum foil), therefore inhibiting our ability to see into thewater column. Determining good weather conditions can be a fine line forsuccessful aerial surveys and, luckily, through constant monitoring we are ableto make appropriate calls. With the epic weather and survey time we hadduring Week 2 of LUTH we expected the weather window to come to a close.Hopefully Week 4 will bring good flying weather to complete offshore transects and potentially more turtle tagging with the Jordan.
NOAA-National Marine Fisheries
Service
AERIAL TEAM
COORDINATOR
Erin LaCasella
NOAA TWIN OTTER
PILOTS:
Nicole Cabana
Jason Mansour
OBSERVERS:
No Flights This week
Although there were no flights during Week 3, the
Aerial Team assisted in a big way, sending daily
emails to the Jordan with vital oceanographic
information. Pictured here is a sea surface
temperature image with LUTH oceanographic
sampling stations. Data courtesy of Dave Foley (JIMAR and SWFSC-
ERD). See Figure 2 for additional data examples.
2008 LUTH CRUISE – WEEK Three Page 9
FIG 6. Each day, when determining whether to conduct aerial operations, the LUTH aerial team used a variety of tools to monitor weather conditions. These included (a) the naked eye to look at fog presence near Monterey (pictured here is a fog layer rolling into Monterey Bay); (b) satellite weather images from a variety of websites (in this frame, a fog layer can be seen off most of California); (c) weather profiler data at Fort Ord, courtesy of the Naval Postgraduate School in Monterey (notice the pronounced inversion (i.e. fog) layer); and (d) daily GFS weather models showing wind patterns over North America.
a b
c d
2008 LUTH CRUISE – WEEK Three Page 10
A Log from our TEACHER AT SEA
Mary Anne Pella-Donnelly
The first week of the second leg of the LUTH survey has allowed me to observe the dynamic nature of scientific research. With the goal to determine the abundance of jellyfish in waters of different temperature ranges, we headed west to a region known to have a warm current eddy butting up against colder water. The NOAA Ship David Starr Jordan has worked to adapt to ever changing plans as the science team recalculates their net deployments due to oceanographic conditions around this temperature gradient. Net trawls and CTD deployments have been conducted at the cold edge and warm edge to discern which conditions are most favorable for jellyfish. The subsurface current has been a factor that was unexpected, and has caused some changes in plans due to the current pulling the boat.
As the teacher on board this leg, it is my goal to bring some of this research back to junior high students at the level they can understand it. Lessons are being developed using the data gathered to show students the practical applications of graphing skills, mathematical understanding, and how physics and physical science are used in oceanographic work. Each data set that is collected has the potential to give students an opportunity to take classroom instruction and use it to understand new research. The importance of accurate measuring, weighing and recording that data can be clearly seen.
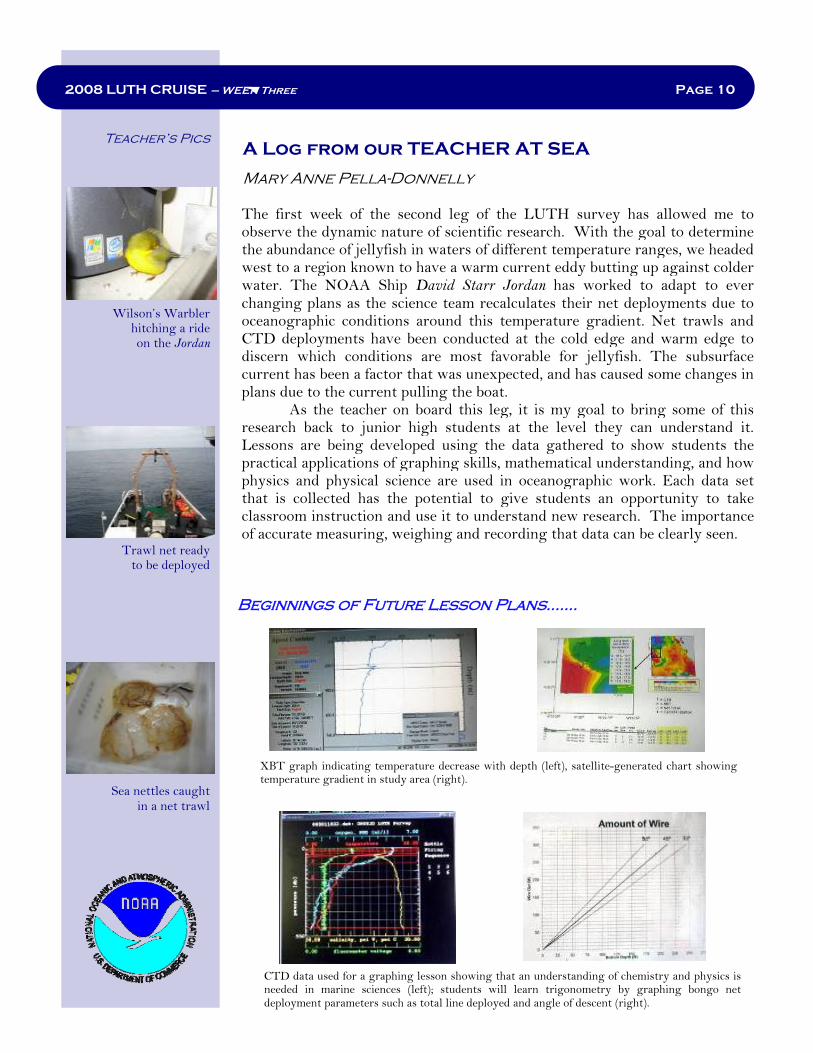
XBT graph indicating temperature decrease with depth (left), satellite-generated chart showing temperature gradient in study area (right).
CTD data used for a graphing lesson showing that an understanding of chemistry and physics is needed in marine sciences (left); students will learn trigonometry by graphing bongo net deployment parameters such as total line deployed and angle of descent (right).
Beginnings of Future Lesson Plans.......
Teacher’s Pics
Wilson’s Warbler hitching a ride on the Jordan
Trawl net ready to be deployed
Sea nettles caught in a net trawl