noaa nic snow analysis and blended products - …€¦ · noaa nic snow analysis and blended...
TRANSCRIPT

NOAA NIC Snow Analysis and Blended Products
Sean R. Helfrich1, Min Li2, and Cezar Kongoli3
1 NOAA/NESDIS/OSPO/NIC, NOAA NSOF Building, 4231 Suitland Road, Suitland, MD 20746, [email protected]
2 I.M. Systems Group, Inc. NOAA World Weather Building, 5200 Auth Road, Camp Springs, MD 20746
3 Cooperative Institute for Climate and Satellites, 5825 University Research Court, Suite 4001, M Square Building , University of Maryland, College Park, MD 20740

OUTLINE
• Background
• Current Products
• Future Products
• Conclusions

Introduction
• NOAA mapping snow since 1966.
• IMS used to generate first NOAA daily snow and ice product in 1997.
• Applied by NWP models, climate monitoring, satellite atmosphere retrievals, SSTs estimates, border patrol, drug enforcement, hydrologic mapping, wind mapping, soil moisture satellite estimates, etc.

MASIE
MASIE offers many regional
images and time series that
allow users to get data just
for their area of interest.
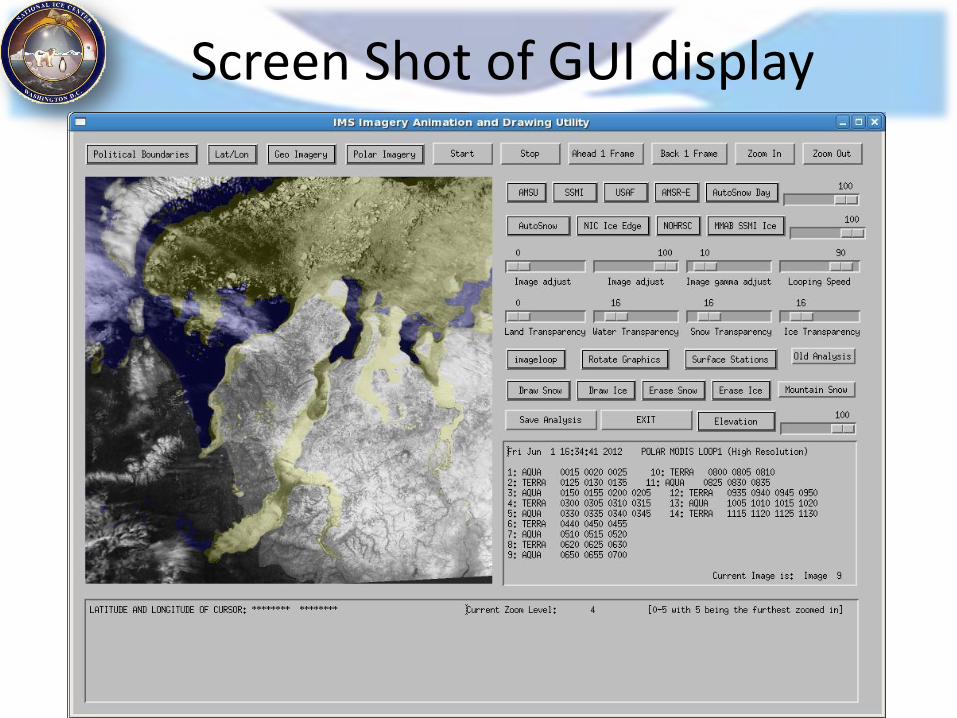
Screen Shot of GUI display

Input
Satellites
+
Other Sources
Radar Models Surface Obs Webcams Buoys Charts
Production Flow Outline
Pre Processing
Indirect Sources
Analyst Derived output
Output to Customers

IMS CONUS Validation
IMS Vs Surface SD
Chen et al., 2010 = % surface report and IMS Agreement
= # of NCDC stations

Current Capacities (2012)
Direct Input GOES (E & W)
MeteoSat (MSG & 7)
MTSAT
NOAA Automated Snow & Ice
AVHRR (Channels 1&3)
MODIS (Channel 8)
ASCAT
AMSU (Derived snow, ice, rain)
NIC Marginal Ice Zone
Surface Obs (METAR)
NOHRSC SNODAS
AFWA Snow Depth
SSMI/S (Derived snow, ice, rain)
MMAB Sea ice Cons
Indirect Input AVHRR (Channels 1,2,3a&b,5) MODIS (LANCE) OSCAT AMSU BTs RadarSat 1 & 2 Sea Ice Charts (NIC, CIS, DMI, SMHI, CG –
Japan, AARI)
Radar (USA, Canada, Europe, China) NWP models Foreign Snow analyses (Canada, Russia,
Japan, Slovakia, Germany, Norway, Sweden, Finland, etc)
COOP, CoCoRaHs, GHCN reports Webcams

IMS Capacities
Current Output – 4 & 24km Northern
Hemisphere Analysis
– Snow & Ice Cover
– ASCII, BIN, GeoTiff, Grib2*
– 1x day production
– Little Metadata
Future Output – 1, 4, & 24km Northern Hemisphere
Analysis
– Snow & Ice Cover
– ASCII, BIN, GeoTiff, Grib2
– 2x day production
– Improved MetaData
– Automated 2km Southern Hemisphere Analysis
– Date since last confirmed observation
– Snow Depth (with uncertainty values)
– Sea Ice Thickness (with uncertainty values)
– Same underlying Snow & Ice cover resample algorthrims
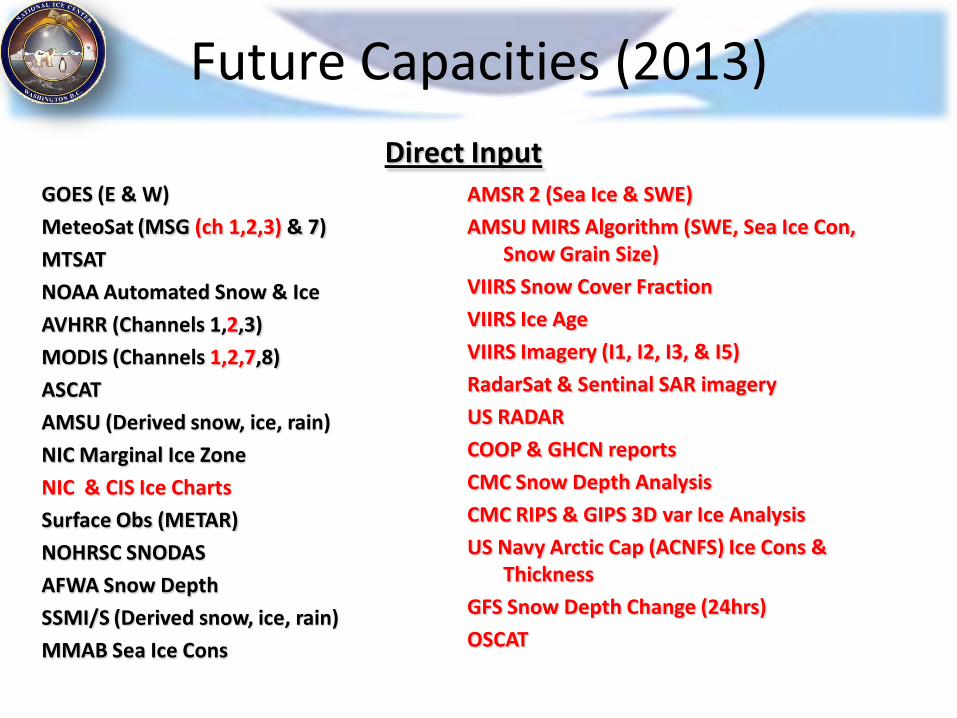
Future Capacities (2013)
GOES (E & W)
MeteoSat (MSG (ch 1,2,3) & 7)
MTSAT
NOAA Automated Snow & Ice
AVHRR (Channels 1,2,3)
MODIS (Channels 1,2,7,8)
ASCAT
AMSU (Derived snow, ice, rain)
NIC Marginal Ice Zone
NIC & CIS Ice Charts
Surface Obs (METAR)
NOHRSC SNODAS
AFWA Snow Depth
SSMI/S (Derived snow, ice, rain)
MMAB Sea Ice Cons
AMSR 2 (Sea Ice & SWE)
AMSU MIRS Algorithm (SWE, Sea Ice Con, Snow Grain Size)
VIIRS Snow Cover Fraction
VIIRS Ice Age
VIIRS Imagery (I1, I2, I3, & I5)
RadarSat & Sentinal SAR imagery
US RADAR
COOP & GHCN reports
CMC Snow Depth Analysis
CMC RIPS & GIPS 3D var Ice Analysis
US Navy Arctic Cap (ACNFS) Ice Cons & Thickness
GFS Snow Depth Change (24hrs)
OSCAT
Direct Input
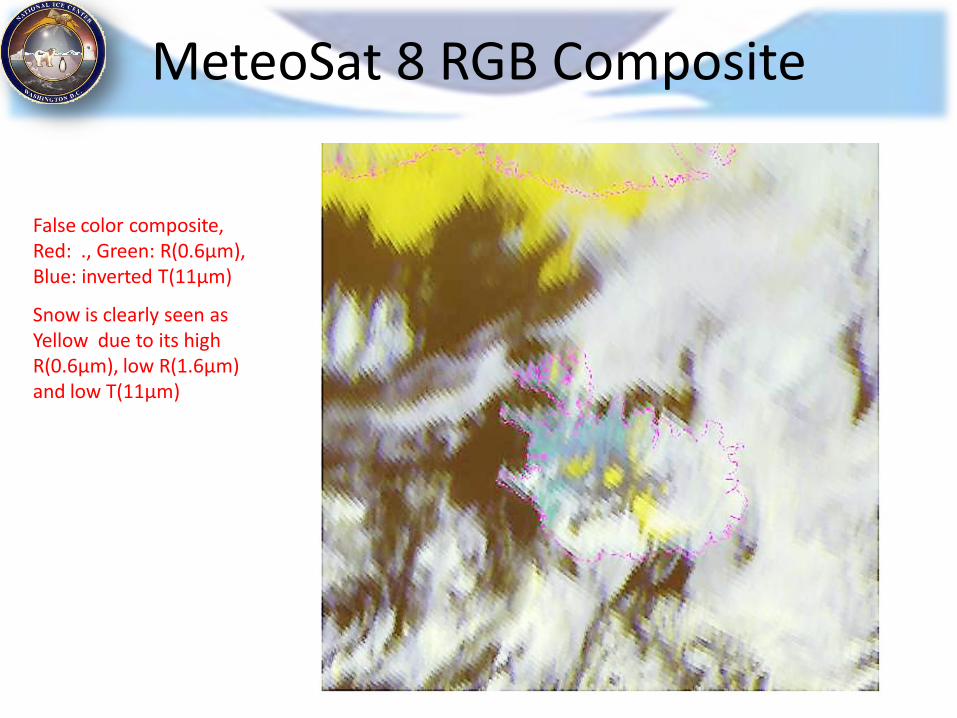
MeteoSat 8 RGB Composite
False color composite, Red: ., Green: R(0.6µm), Blue: inverted T(11µm)
Snow is clearly seen as Yellow due to its high R(0.6µm), low R(1.6µm) and low T(11µm)
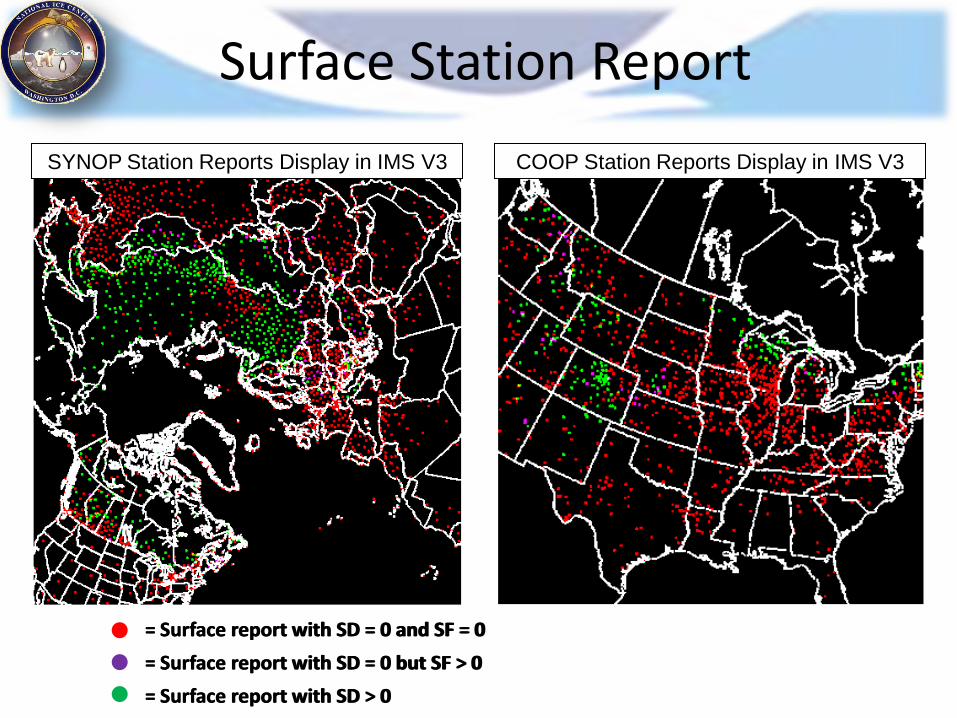
Surface Station Report
COOP Station Reports Display in IMS V3 SYNOP Station Reports Display in IMS V3
= Surface report with SD = 0 and SF = 0
= Surface report with SD = 0 but SF > 0
= Surface report with SD > 0
= Surface report with SD = 0 and SF = 0
= Surface report with SD = 0 but SF > 0
= Surface report with SD > 0

VIIRS I1,I2,I3 Composite
False color composite, Red: I1, Green: I2, Blue: I3
Snow is clearly seen as Yellow due to its high I1, I2 and low I3
IMS V3 will also apply I5, NCC, Ice Age, and Snow Fraction. Ice Concentrations will be added at a later date.

OceanSat 2 HH&VV composite Date: May 1st 2012
IMS Analysis
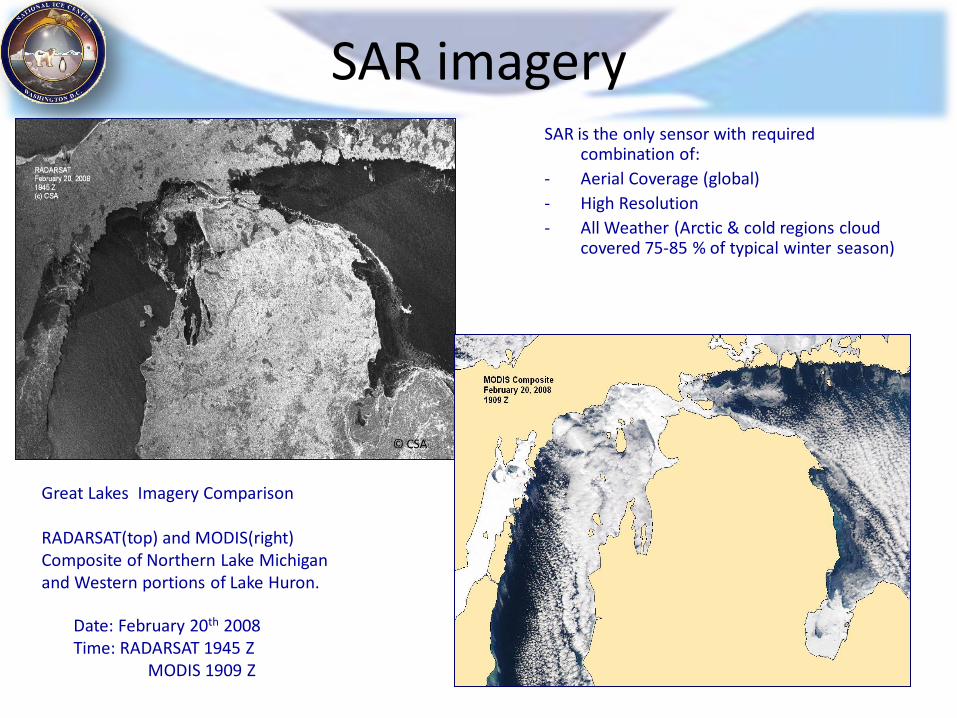
SAR imagery SAR is the only sensor with required
combination of:
- Aerial Coverage (global)
- High Resolution
- All Weather (Arctic & cold regions cloud covered 75-85 % of typical winter season)
Great Lakes Imagery Comparison RADARSAT(top) and MODIS(right) Composite of Northern Lake Michigan and Western portions of Lake Huron.
Date: February 20th 2008 Time: RADARSAT 1945 Z MODIS 1909 Z
© CSA

IMS Data Flow
PrePro SD Pro
1 km Image Sectors 4km Image Sectors 24 km World Images Information Files
GUI Pro
Analyst Pro
Final Pro
Snow Depth
ENVI Product
GeoTIFF Image
GIF Image
GRIB-2 Product
ASCII Product
IMS V3 GUI System
Analyst Products
CMC Snow Depth
Surface Data Hourly Reports
North Hemisphere ASI Product MTSAT Imagery
GOES EAST and WEST Image
MMAB SSM/ISea Ice Product
North America ASI Product SSM/I Products
NOAA 18 & 19 & Metop A AVHRR HRPT Imagery
VIIRS Composite Imagery and Derived Snow/Ice Products
NCEP GFS Snow Depth
North Hemisphere ASI “days since last update”
NOAA-18 & 19 & Metop A AVHRR GAC Composite Imagery
NIC Sea Ice Thickness / Concentrations
Snow Depth Station Report
US Radar Obs.
NAIS Sea Ice Model Output ACNFS Sea Ice Model Output
METEOSAT Image NOHRSC Snow Cover
AMSU rain rate and snow & ice coverage
ASCAT sea ice product
SAR Imagery
AMSR 12km & 6km Ice Concentration INDOEX Imagery
MODIS AQUA&TERRA HRPT Imagery USAF Products
Polar MODIS Imagery
MODIS False Color Imagery
NIC MIZ
GeoTIFF and Shapefile Products
ATMS Sea Ice and Snow OSCAT
Elevation & Land type
AMSU MIRS SWE
ATMS MIRS SWE
AMSR 2 SWE
External Input Data
Intermediate Products
External Output
Processing Unit
Legend
Surface Observations
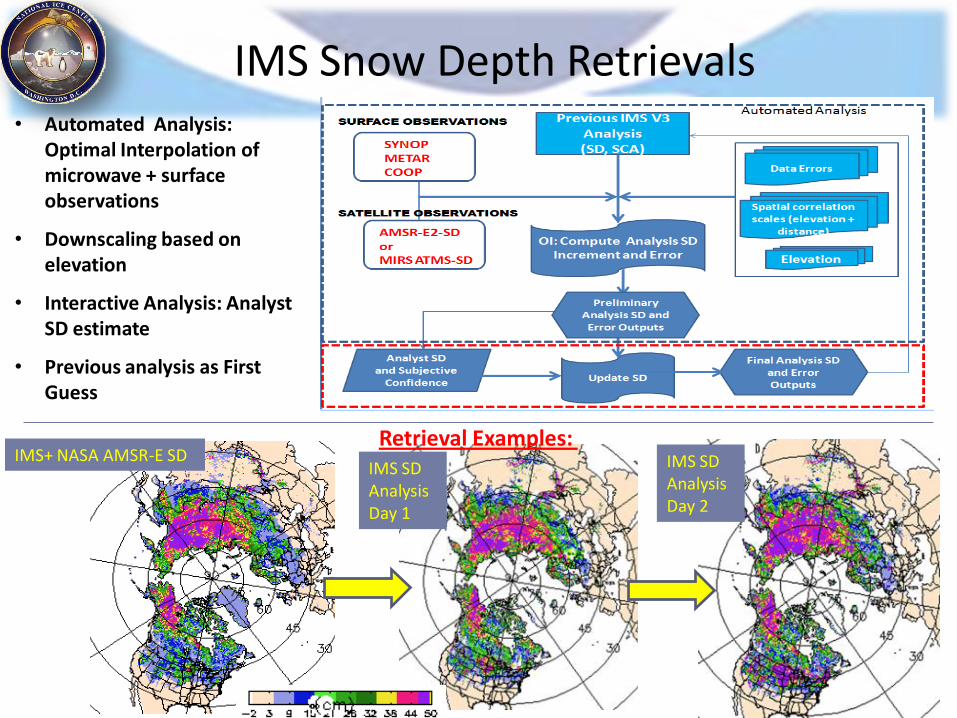
IMS Snow Depth Retrievals
• Automated Analysis: Optimal Interpolation of microwave + surface observations
• Downscaling based on elevation
• Interactive Analysis: Analyst SD estimate
• Previous analysis as First Guess
Retrieval Examples: IMS+ NASA AMSR-E SD
IMS SD Analysis Day 1
IMS SD Analysis Day 2
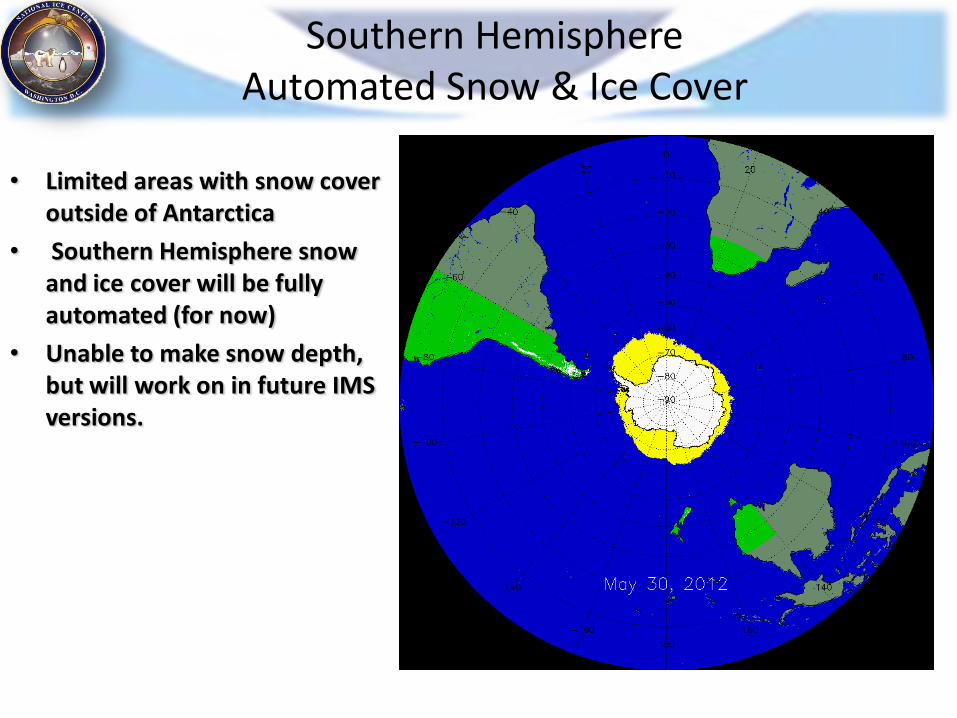
Southern Hemisphere Automated Snow & Ice Cover
• Limited areas with snow cover outside of Antarctica
• Southern Hemisphere snow and ice cover will be fully automated (for now)
• Unable to make snow depth, but will work on in future IMS versions.
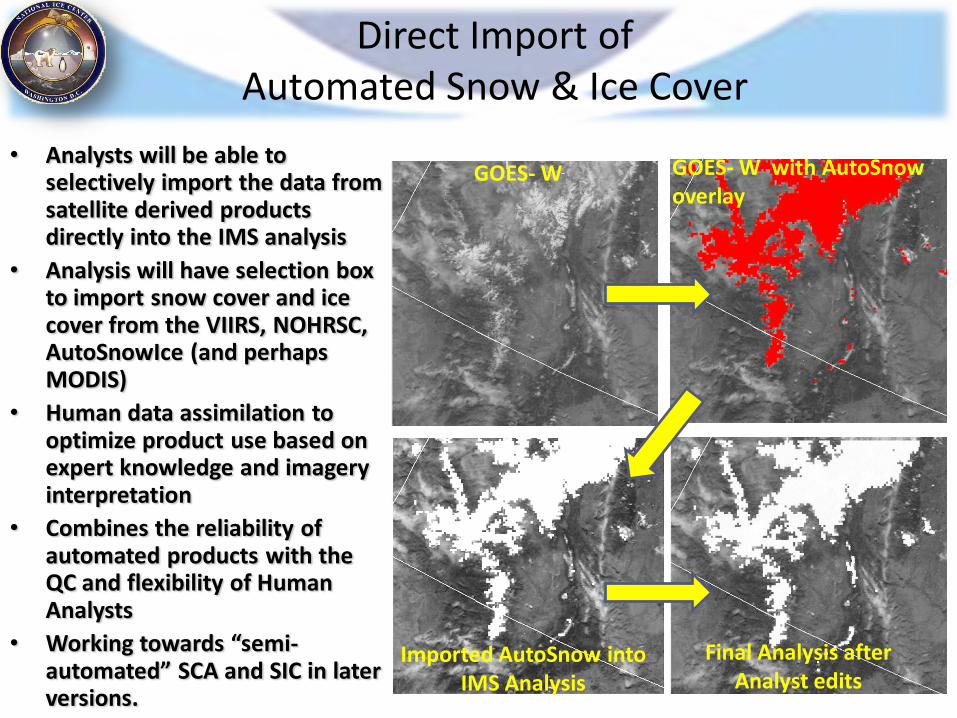
Direct Import of Automated Snow & Ice Cover
• Analysts will be able to selectively import the data from satellite derived products directly into the IMS analysis
• Analysis will have selection box to import snow cover and ice cover from the VIIRS, NOHRSC, AutoSnowIce (and perhaps MODIS)
• Human data assimilation to optimize product use based on expert knowledge and imagery interpretation
• Combines the reliability of automated products with the QC and flexibility of Human Analysts
• Working towards “semi-automated” SCA and SIC in later versions.
GOES- W GOES- W with AutoSnow overlay
Imported AutoSnow into IMS Analysis
Final Analysis after Analyst edits

Microwave Integrated Retrieval System (MIRS) SWE Products
Composite is based on MiRS currently daily running satellite sensors: N18,N19,Metop-A,F16 SSMIS,F18 SSMIS and NPP ATMS.
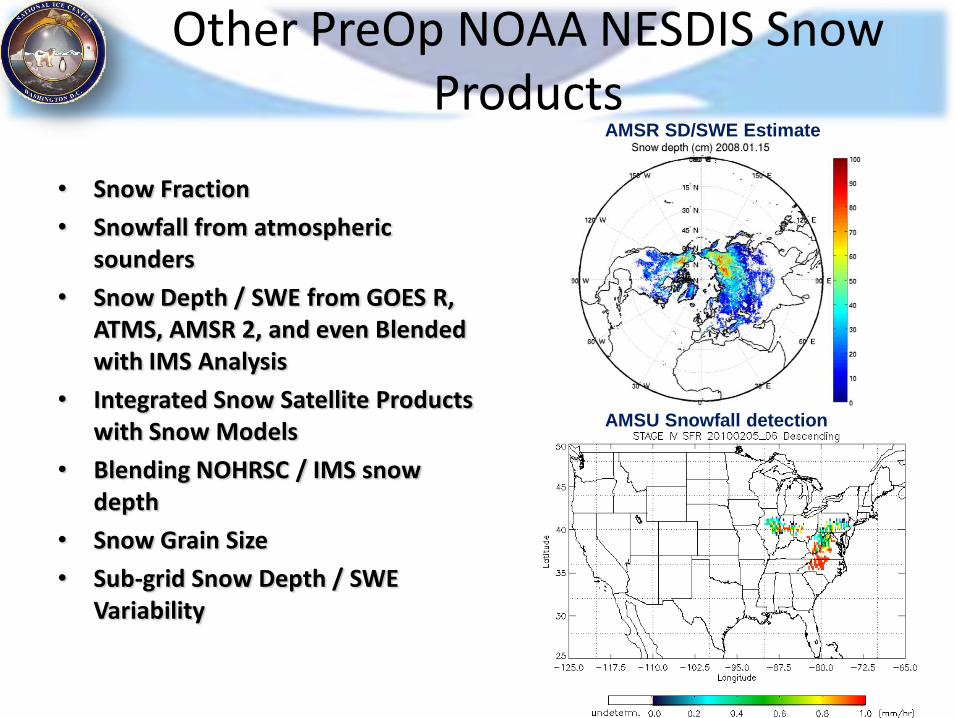
Other PreOp NOAA NESDIS Snow Products
AMSU Snowfall detection
AMSR SD/SWE Estimate
• Snow Fraction
• Snowfall from atmospheric sounders
• Snow Depth / SWE from GOES R, ATMS, AMSR 2, and even Blended with IMS Analysis
• Integrated Snow Satellite Products with Snow Models
• Blending NOHRSC / IMS snow depth
• Snow Grain Size
• Sub-grid Snow Depth / SWE Variability
Conclusions
• IMS V3 has many new imagery sources • System Design based on legacy code • Climate Monitoring applications considered for IMS V3 • All data formats more accessible • Return to date since last observed • Sea Ice Thickness output • Novel approach to global 4km Snow Depth, but
validation needed • Blending with automated data • IMS V3 Operational release August 2013 • Many new automated or semi-automated products for
snow are pending release

Questions?
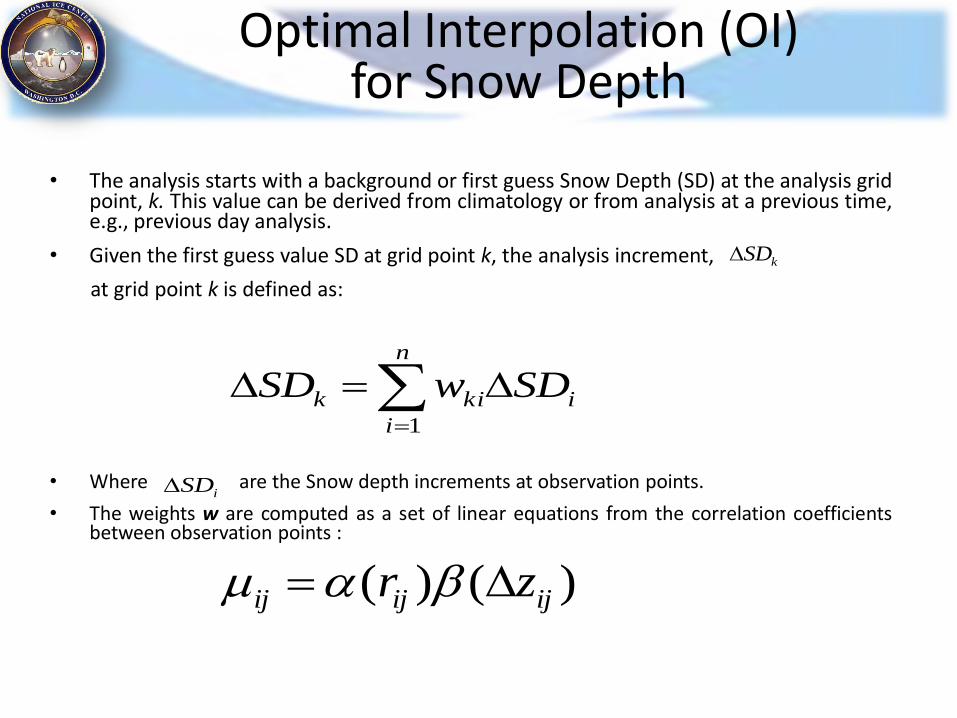
Optimal Interpolation (OI) for Snow Depth
• The analysis starts with a background or first guess Snow Depth (SD) at the analysis grid point, k. This value can be derived from climatology or from analysis at a previous time, e.g., previous day analysis.
• Given the first guess value SD at grid point k, the analysis increment,
at grid point k is defined as:
• Where are the Snow depth increments at observation points.
• The weights w are computed as a set of linear equations from the correlation coefficients between observation points :
n
i
ikik SDwSD1
kSD
)()( ijijij zr
iSD