noaa tm glerl-40. effect of channel changes in the st ... · pdf filenoaa technical memorandum...
TRANSCRIPT

NOAA Technical Memorandum ERL GLERL-40
EFFECT OF CHANNEL CHANGES
IN THE ST. CLAIR RIVER SINCE 1900
Jan A. Derecki
Great Lakes Environmental Research LaboratoryAnn Arbor, MichiganFebruary 1982
UNITED STATES NATIONAL OCEANIC AN0
DEPARTMENT OF COMMERCE ATMOSPHERIC ADMINISTRATION
Malcolm Baldriga John V. Byrne.
.Qcrfm Administrator
Environmental ResearchLaboratories
George H. LudwigDirector

NOTICE
Mention of a commercial company or product does not cbnstitutean endorsement by NOAA Environmental Research Laboratories.Use for publicity or advertising purposes of information fromthis publication concerning proprietary products or the testsof such products is not authorized.
ii

CONTENTS
Abstract
1. INTRODUCTION
2. METHOD
3. RESULTS
4. CONCLUSIONS
5. ACKNOWLEDGMENT
6. REFERENCES
Page
1
1
4
15
17
19
19

FIGURES
1. St. Clair-Detroit River system with location of waterlevel gages.
2. Comparison of 1900 and present areas at the Mouth ofBlack River gage section.
3. Manning's roughness coefficients for FG-MBR reach.
4. Manning's roughness coefficients for FG-DD reach.
5. Manning's roughness coefficients for MBR-SC reach.
6. Manning's roughness coefficients for DD-SC reach.
7. Upper St. Clair River water surface profile for presentand 1900 channel conditions.
Page
5
9
11
12
13
14
18
iv

TABLES
Page
1. St. Clair River hydraulic parameters for the present channel. 6
2. St. Clair River hydraulic parameters for the 1900 channel. 8
3. St. Clair River Manning's roughness coefficients for presentand 1900 channel conditions. 10
4. Results of computations for upper St. Clair River profilewith present and 1900 channel conditions during averagewater levels (1970). 15
5. Results of computations for upper St. Clair River profilewith present and 1900 channel conditions during high waterlevels (1973). 16


EFFECT OF CHANNEL CHANGES IN THE ST. CLAIR RIVER SINCE 190G1
Jan A. Derecki
Periodic man-made changes in the outlet of Lake Huronthrough the St. Clair River date back to the middle of the lastcentury. These artificial channel changes are well documentedduring the present century and consist of dredging for commercialgravel removal in the upper river during 1908-25 and uncompen-sated navigation improvements for the 25-ft and 27-ft projectscompleted in 1933 and 1962, respectively. The total effect ofthese changes on the levels of Lakes Michigan and Huron(hydraulically one lake) and on the upper St. Clair River pro-file was determined with dynamic flow models. The ultimateeffect of the above dredging was a permanent lowering of the lakelevels 0.27 m, which represents a tremendous loss of fresh waterresource (32 km3). This total lowering of lake levels is 0.09 mhigher than previous estimates, but present determinations repre-sent a more sophisticated approach.
It is unfortunate that appropriate hydraulic data for theprevious century are not available for the application of thismethod. In the late 1880's the levels of Lake Michigan-Hurondropped by 0.8 m. In contrast to the other Great Lakes, thelevels of these two lakes remained depressed afterwards,producing controversy about the reasons for this unexplaineddrop, namely, reduced precipitation and/or dredging. Existingestimates for the lake level drop due to unspecified dredgingprior to 1900 vary from under 0.1 m to over 0.4 m, an unaccep-tably large difference. Reduction of lake levels due to precipi-tation or dredging implies different lake level behavior in thefuture, which complicates water resource studies based on theanalysis of lake levels and related outflows.
1. INTRODUCTION
The Great Lakes represent a tremendous fresh water resource, and infor-mation on their levels and outflows is becoming progressively more importantfor water resource planning purposes and the operation of the presentlyregulated lakes (Superior and Ontario). Currently, this information in-cludes over 120 years, 1860 to date. Because of their size, the Great Lakespossess a large self-regulating capacity and the natural fluctuation oftheir levels is relatively small. During the 1885-1900 period, the levelsof the Great Lakes below Lake Superior dropped sharply, with the most acutedrops for Lakes Michigan and Huron (0.8 m). which hydrologically are con-sidered to be one lake. This drop in lake levels was accompanied by a
1GLERL Contribution No. 307.

corresponding reduction of basin precipitation and eventually the levels Oflakes other than Lake Michigan-Huron rebounded to their normal state. Thelevels of Lake Michigan-Huron remained depressed below previously estab-lished normals for reasons that have remained unexplained for severaldecades.
The reasons could be either natural, namely, basin precipitation per-sistently below previous levels; artificial, caused by man-made changes inthe lake outlet or drainage basin conditions; or a combination of bothnatural and artificial changes. Artificial changes in the Lake Huron outletthrough the St. Clair River for navigation improvements date back to 1856,when a channel was cut across sand bars in the St. Clair Flats area of thelower river to provide a 9-ft draft (International Joint Commission, 1976).Changes in land use affecting runoff characteristics from the drainage basinalso date back to the mid-1800's. The outflows from the Great Lakes arebased on stage-flow relationships derived from periodic flow measurementsmade after 1900. Since navigation improvements and commercial graveldredging in critical locations could make the channel more efficient, theapplication of the post-1900 St. Clair River stage-flow relationships to theprevious period, as was actually done, would make the 1860-1900 flows arti-ficially high. On the other hand, present regulation plans for LakesSuperior and Ontario, based on lake outflows determined for the post-1900period, would fail under more severe natural conditions.
There is some controversy regarding the reasons for, and correspondingmagnitudes of, the unrecovered drop in the lake levels during the 1880-1900period. Brunk (1961, 1963, 1968) conducted investigations to determine thedrop of Lake Huron levels using ratios of Great Lakes levels, St. Clair-Detroit and Niagara River flows, and basin precipitation records. He feltthat previously published regional precipitation (Day, 1926) for Lake Huronwas too high and modified these precipitation values. Brunk concluded thatmost of the drop in Lake Huron levels prior to 1900 was caused by dredgingof the lake outlet in the St. Clair River and that published flows for theSt. Clair-Detroit River prior to the drop (1860-1900) are excessive. Themagnitude of dredging-related lowering of Lake Huron levels prior to 1900determined by Brunk (1968) is 0.43 m (1.4 ft). Lawhead (1961). in a dis-cussion of Brunk's (1961) results, concluded that most of the decrease inLake Michigan-Huron levels during this period was due to precipitationchanges and that only 0.09 m (0.3 ft) could be attributed to the St. ClairRiver channel dredging. Additional lowering of the Lake Michigan-Huronlevels due to dredging after 1900 was not contested in the above studies.The additional drop in the lake's levels for the post-1900 period was esti-mated by the International Great Lakes Levels Board (1973) to total 0.18 m(0.59 ft). This total amount consists of uncompensated dredging for water-way improvements for the 25-ft and 27-ft navigation channels completed in1933 and 1962, respectively, and commercial gravel dredging in the upper St.Clair River in the vicinity of Point Edward, Ont., between 1908 and 1925.The effect of gravel dredging is estimated by the Levels Board to be about0.09 m (0.3 ft), which leaves about half (0.09 m or 0.29 ft) of the totallowering during this period to be attributed to uncompensated navigationdredging in the St. Clair River. Navigation dredging in the Detroit Riverwas compensated by dikes.
2

The unresolved Brunk-Lawhead controversy over the pre-1900 drop of LakeMichigan-Huron levels complicates water resource studies involving lakelevel analysis. If the late 1800's levels were high because of above-normalprecipitation, such high levels may occur again in the future; if the pre-vious high levels resulted from a less efficient outflow channel, it isunlikely they will be repeated. This problem was addressed by Quinn andCroley (1981) in a study based on precipitation climatology, which used morerecently determined precipitation data. Quinn and Croley concluded thatdredging prior to 1900 (1893-99) may be responsible for about 25 percent(0.2 m) of the total lake level drop of 0.8 m during the late 1800's (1886-92) and that published St. Clair River flows for the 1860-1900 period areexcessive. Most of the drop (0.6 m) was apparently caused by a long termchange in precipitation. As in previous studies, their determinationsinvolved assumptions and some rather weak input parameters, such as avail-able rainfall/runoff regressions with low correlation coefficients (0.26-0.85). The accuracy of all these lake-level-drop determinations may beclassified as relative, rather than absolute, and require further verifica-tion.
The present study was initiated to provide verification for both theunexplained drop in Lake Michigan-Huron levels prior to 1900 and for theuncompensated dredging effects after 1900, using the St. Clair River dynamicflow models. Although there is generally no controversy regarding theselater uncompensated dredging effects, with sufficient documentation (Inter-national Joint Commission, 1976; International Great Lakes Levels Board,1973; U.S. Senate, 1955; Joint Board of Engineers, 1927), the use of flowmodels for this purpose represents a more sophisticated approach than thoseemployed in previous estimates. The requirements for such a verificationstudy with the flow models are the channel cross-sectional areas and channelroughness coefficients for the appropriate periods. Determination of chan-nel roughness coefficients requires river flow measurements. Historichydrographic surveys and flow measurements for the Great Lakes were made bythe U.S. Lake Survey, a former Corps of Engineers District. Archive recordsfor the hydrographic surveys are presently maintained by the National OceanSurvey, NOAA, while those for flow measurements are stored by the DetroitDistrict, Corps of Engineers. The earliest hydrographic survey of the St.Clair River was conducted during 1867, providing cross-sectional areas priorto any significant channel changes, while a second survey in 1900 providedcross-sectional areas after the unexplained drop in Lake Michigan-Huronlevels and before the known uncompensated dredging during this century (25-and 27-ft channels and gravel removal). Channel roughness for the secondperiod was determined from flow measurements conducted during 1908-10. Flowmeasurements for the preceding period are not available. Although it waspossible to estimate channel roughness coefficients that appear reasonablefor this period, this was immaterial since analysis of the 1867 cross-sectional areas showed them to be grossly inadequate. Either the measure-ments were crude and inaccurate or the available small-scale field sheetsdid not permit reproduction of the areas with sufficient accuracy. Ineither case, this eliminated the first objective of the study concerning thechannel changes during the previous century. Consequently, only the uncom-pensated channel changes during the present century are evaluated.
3

2. METHOD
The Great Lakes Environmental Research Laboratory (GLERL) dynamic flowmodels for the St. Clair River are described by Derecki and Kelley (1981).These models are one-dimensional transient flow models based on equations ofcontinuity and momentum, with option for the surface wind stress effects.Disregarding wind stress effects, not used in this study, the equations ofcontinuity and momentum are expressed in terms of flow and stage
and
where Q= flow rate,Z= stage above fixed datum,x = distance in the positive flow direction,t= time,A = channel cross-sectional area,T= top width of channel,g= acceleration due to gravity,R = hydraulic radius, andn- Manning's roughness coefficient.
laQ-,QTcjT+ gn2 QfQf- -A at A2 at 2 208 A2 R413 = ".
(1)
(2)
The model solution uses an implicit finite-difference method withNewton-Raphson iterative algorithms for initiating the computations, whichcan be operated with variable time steps. Several versions of the modelsincorporating different river reaches are all confined to the upper one-third of the river, between a gage at Fort Gratiot, Mich., at the head ofthe river and a gage at St. Clair, Mich., 23 km downstream (fig. 1). Thisportion of the river contains most of the river slope and is usually free ofice concentrations during winter. The model programs are written in ageneralized manner and can be easily modified or adapted to other rivers byappropriate substitution of physical characteristics (cross-sectional areas,channel widths, roughness coefficients, etc.) and boundary conditions (down-stream and upstream controls). Model computations incorporate detailedchannel definition to indicate the actual river channel (table 1).
For the purpose of this study, it was necessary to use a model thatwould cover the entire upper river reach between Fort Gratiot and St. Clair,two of the oldest river gages in the system. Since none of the existingoperational models covered this reach, they were modified to obtain twodesired models, each comprising upper and lower reaches with "mid-point"locations at the Mouth of Black River and Dry Dock gages. For future
4

Edward
SCALE IN MILESUYY I, Il"Y.,lLI,
20 . . :,~Landing/~.,,
KILOMETERSPort Lambton
,&+~~~ L,$/ 3 ST CLAlR
ia Salle
FIGURE l . - -St . C la i r -Detro i t River system Oith location of mter tevet g a g e s .
5
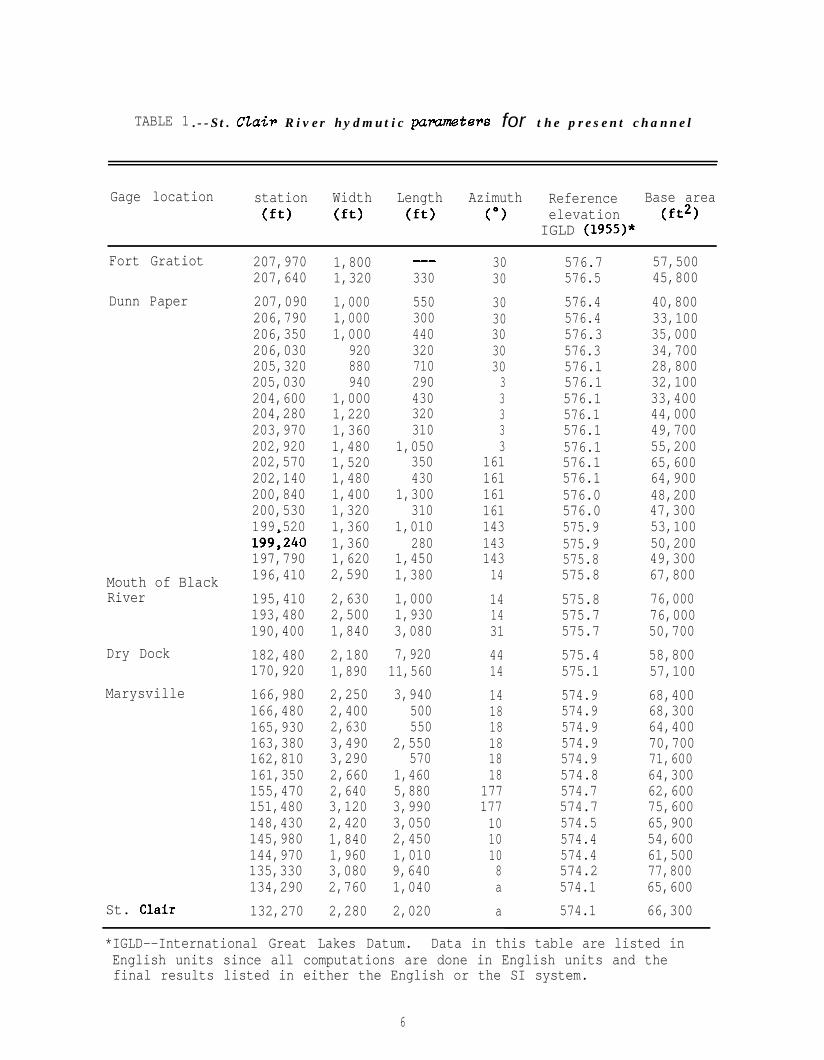
TABLE 1 . - -St . Ctair R i v e r h y d m u t i c pammeters for t h e p r e s e n t c h a n n e l
Gage location station Width Length Azimuth Reference Base area(ft) (ft) (ft) (") elevation (f-L*)
IGLD (1955)*
Fort Gratiot 207,970 1,800 --- 30 576.7 57,500207,640 1,320 330 30 576.5 45,800
Dunn Paper 207,090206,790206,350206,030205,320205,030204,600204,280203,970202,920202,570202,140200,840200,530199.520
1,000 550 30 576.4 40,8001,000 300 30 576.4 33,1001,000 440 30 576.3 35,000
920 320 30 576.3 34,700880 710 30 576.1 28,800940 290 3 576.1 32,100
1,000 430 3 576.1 33,4001,220 320 3 576.1 44,0001,360 310 3 576.1 49,7001,480 1,050 3 576.1 55,2001,520 350 161 576.1 65,6001,480 430 161 576.1 64,9001,400 1,300 161 576.0 48,2001,320 310 161 576.0 47,3001,360 1,010 143 575.9 53,1001,360 280 143 575.9 50,2001,620 1,450 143 575.8 49,3002,590 1,380 14 575.8 67,800
199;240197,790
Mouth of Black 196,410
River 195,410 2,630 1,000 14 575.8 76,000193,480 2,500 1,930 14 575.7 76,000190,400 1,840 3,080 31 575.7 50,700
Dry Dock 182,480 2,180 7,920 44 575.4 58,800170,920 1,890 11,560 14 575.1 57,100
Marysville 166,980 2,250 3,940 14 574.9 68,400166,480 2,400 500 18 574.9 68,300165,930 2,630 550 18 574.9 64,400163,380 3,490 2,550 18 574.9 70,700162,810 3,290 570 18 574.9 71,600161,350 2,660 1,460 18 574.8 64,300155,470 2,640 5,880 177 574.7 62,600151,480 3,120 3,990 177 574.7 75,600148,430 2,420 3,050 10 574.5 65,900145,980 1,840 2,450 10 574.4 54,600144,970 1,960 1,010 10 574.4 61,500135,330 3,080 9,640 8 574.2 77,800134,290 2,760 1,040 a 574.1 65,600
St. Clair 132,270 2,280 2,020 a 574.1 66,300
*IGLD--International Great Lakes Datum. Data in this table are listed inEnglish units since all computations are done in English units and thefinal results listed in either the English or the SI system.
6
reference, these models are identified by a three-gage system as FG-MBR-SCand FG-DD-SC.
The procedure employed in determining channel changes involved com-puting river flows with the present channel configuration, using currentwater level gage data, then matching these flows with the previous channelconfiguration modified by appropriate cross-sectional areas and channelroughness coefficients. The difference in water levels for the same flowwith present and previous channel configurations represents the effect ofchannel changes due to dredging. The ultimate effect of channel changes onthe water levels should be nearly the same during periods of low or highwater supply. This is demonstrated by computing the channel-change effectsfor 1970, a year of mid-range or average water levels, and for 1973, a yearof high water levels. To eliminate possible ice effects, the computationswere limited to the open-water season and, furthermore, were restricted tothe June-August period, which represents annual peak water levels.
The channel cross-sectional areas prior to the uncompensated channelchanges during this century were determined from the 1900 hydrographic sur-vey and used to evaluate dredging effects by both models. The 1867 cross-sectional areas were similarly determined, but as mentioned previously, theywere found to be inadequate, producing illogical results, and so were dis-carded. The upper St. Clair River hydraulic parameters for the 1900 channelare given in table 2. Basic input data are listed in English units sinceall computations are done in English units and the final results listed ineither English or SI units. Comparison of the 1900 and present areas at thesection corresponding to the Mouth of Black River gage location is shown infigure 2. As indicated, the present channel at this section has a nearlyuniform depth as a result of substantial dredging over most of the width.It is apparent that at least final stages of this dredging were connectedwith the 27-ft (8.2-m) navigation project completed in 1962. The presentnavigation channel at this location covers slightly over half of the riveron the United States or western side. It is a common practice to provideapproximately 2-ft (0.6-m) overdraft in deepening the navigation channels.During both the 25-ft and the 27-ft projects, dredged material was depositedin river areas where it would not interfere with navigation to partiallyoffset some of the effects on upstream water levels. This explains thefilling of the deeper portion of the river along the eastern bank. Thus,present river depth in this location is approximately 8.8 m (29 ft), withthe exception of a reduction in depth to 7.9 m (26 ft) along the easternboundary of the navigation channel and the overbanks. The assumption of a2-ft overdraft is verified by the average depth of the present channel atthis section, which is also about 8.8 m (29 ft). This compares with a valueunder 7.6 m (25 ft) in 1900, giving an la-percent increase in the cross-sectional area for the present period.
Calibration of the models for both periods consisted of computingroughness coefficients for each reach of the river bounded by water levelgages. The roughness coefficients were determined from Manning's formula

TABLE 2.-St. Clair River hydraulic pmumetere for the 1900 channel
Gage location Station Width(ft) (ft)
Reference Base areaelevation (ft*)
IGLD (1955)"
Fort Gratiot 207,970 2,100 575.52 65,720207,640 1,600 575.52 55,680
Dunn Paper 207,090206,790206,350206,030205,320205,030204,600204,280203,970202,920202,570202,140200,840200,530199,520199,240197.790
Mouth of BlackRiver
196;410
~195,410193,480190,400
Dry Dock 182,480170,920
Marysville 166,980 2,200 575.52 68,800166,480 2,400 575.52 68,720165,930 2,650 575.52 66,860163,380 2,950 575.52 68,980162,810 2,860 575.52 68,225161,350 2,530 575.52 70,045155.470 2,820 575.52 70,600151,480 2,700 575.52 74,555148,430 1,950 575.52 63,630145.980 1,920 575.52 66,530144,970 2,020 575.52 68,455135,330 2,900 575.52 80,980134,290 2,480 575.52 75,700
St. Clair 132,270 2,050 575.52 70.380
1,040 575.52 43,045960 575.52 40,700920 575.52 35,115880 575.52 33,678780 575.52 34,460800 575.52 33,555
1,000 575.52 37,9651,150 575.52 38,3951.250 575.52 41,8551,420 575.52 44,1631,480 575.52 45,1551,420 575.52 45,8051,200 575.52 41,1001,300 575.52 45,8501,100 575.52 42,9151,150 575.52 42,9701,580 575.52 49,2452,600 575.52 67,430
2,600 575.52 63,7202,400 575.52 57,4301,800 575.52 51,525
2,000 575.52 57,6651,840 575.52 60,155
*IGLD-International Great Lakes Datum. Data in this table are listed inEnglish units since all computations are done in English units and thefinal results listed in either the English or the SI system.
a

4 0
5 0
Comparison of Areas at 575.8 ftdatum: -
Present Area = 76,000 ft*1900 Area = 64,400 ft*
Area Difference = 11,600 ft*
60-
70,0
Percent Increase = 18%
I I I I I5 0 0 1000 1500 2 0 0 0 2 5 0
Feet From Western Shore
FIGURE 2.--COmpariSOn of 1900 and present areas at the Mouth of Black Riverg a g e s e c t i o n .
n _ 1.486 A R
Q
1/*
'(3)
where n - Manning's roughness coefficient,A - mean channel area,R = hydraulic radius,9 - flow rate,
Z, - water surface at upstream gage,Zd = water surface at downstream gage,AA = change in channel area between gages, andL = length of channel reach between gages.
The roughness coefficients for the present channel are based on 14 setsof flow measurements taken by the Corps of Engineers during 1959-77. Forthe 1900 channel, seven sets of flow measurements made during 1908-10 wereused. Although commercial gravel dredging in the upper St. Clair Riverstarted in 1908, there are no indications that channel changes in the first
9

581-
580 -
g 5 7 9 -
5$ 578-c!Jr0
LL%
5 7 7 -
z!iJ
$ 576-
n = O.O03506(FG)
0.028 0 . 0 3 0 0 . 0 3 2
Roughness Coefficient (n)
FIGURE 3.--Manning's roughness coefficient8 for FG-MBR reach.
10

:: 3 j i: s ‘9 - i 4 z 2c r
8 m 2 “0 CL s it Y? 1 ? 8 m :: s
__
_,
_
,.-~
,,..
~..,-
_1
._
..,
1,,1
,x_(...“.“i._
_ I
.,,‘.
“_
..,
,.,,.
II
,.,..,.. -
.
...,.,
8 & 5 ii 0 ii s ~0 -. CD 2 3
Sta
ge a
t F
ort
Gra
tiot
(ft)
ulol
cn-4 P
22
:z
3$
a3a
0Ei
1I
II
II
I1
2-J
E m
eo-4
wtg
”ocn
a
o+
. *-C
D rU
.*IU2
.gw
4.g
.Z
0 t
0 E2:
Gf?~
=T
01
I11
A$j
DA
DO
I 11
8O
Pn,
eo
2
-=
-
b f3t
gg 1
n-i r? ?n
1WV
IY0
z%8
zT2 -4 h -
“-~
,-;_
_,,“~
._
,- ____““
__,_
,,-,
, m
-w
_I--
.-
--.
--
--
----
--
--
---
--
---
__.~
. ,..
-“..-
.“~
~““.,-...-~

579
5 7 8
#Present7 3 n = 0.0236l a
7 3 ,Pre-projectn = 0.0245
?7 58.-m 576- Disregarded0
65
2 575-al
ii?5
5 7 4 -6 3
4‘ 6 4
\1900
l 64 In = 0.0263
573 -
5 7 2I I I I I
0 . 0 2 2 0 . 0 2 4 0 . 0 2 6 0 . 0 2 8 0 . 0 3 0
Roughness Coefficient ( n )
FIGURE 5.--Manning's roughness coefficients for MBR-SC reach.
12

5 7 9
5 7 6
5 7 7-lr
.L-20
5 7 6
s
z 5 7 5
i?G
5 7 4
5 7 2
7 3
::
7 7
Disr&rded
66a
.3
&Presentn = 0.0240
I4)Pre-project
In = 0.0252
Ii8 If8 I 081(
t%!g
60 ,6? O!. 6 2
,9546 3*I
0 . 0 2 2 0 . 0 2 4 0 . 0 2 6Roughness Coefficient
JO%,‘O0 8
%900n = 0.0274
e0 . 0 3 0
(n)FIGURE 6.--Manning's roughness coefficients for DD-SC reach.
13

few years were significant and these measurements should provide satisfac-tory indication of channel roughness conditions for the 1900 period. Therelationships between computed roughness coefficients for channel reachesalong the upper St. Clair River and the river stages at adjacent water levelgages for the FG-MBR, FG-DD, MBR-SC, and DD-SC reaches are shown in figures3-6, respectively. Best-fit relationships were derived for each reach byregression analysis (least squares) or graphic plots (means), as shown inthe figures. Some points were omitted in this derivation to eliminatepossible gage errors or questionable flow values. Since the 1908-10 flowmeasurements were made during similar river stages, they give no indicationof the variation in roughness with depth. The 1900 best-fit lines for theupstream reaches ware estimated using mean values for the 1908-10 measure-ments and slopes from the present channel. The relationships for downstreamreaches during the 1959-77 flow measurements were affected by regimenchanges associated with dredging for navigation improvements. For thesereaches, separate best-fit roughness coefficients were derived for eachregime, representing 1900, pre-project (through 1963), and present (startingin 1964) conditions. The calibrated roughness coefficients for the fourreaches are summarized in table 3.
TABLE 3.--St. Clair River Manning's roughness coefficients for present and1900 channel conditions
Reach. Channel Flowmeasurements
Roughness coefficient (n)
FG-MBR Present 1959-77 n = 0 . 0 0 0 3 5 0 6 (FG) - 0.172181900 1908-10 II = 0.0003506 (FG) - 0.16810
FG-DD Present 1959-77 n = 0 . 0 0 0 2 0 3 7 (FG) - 0.090531900 1908-10 n = 0 . 0 0 0 2 0 3 7 (FG) - 0.08803
MBR-SC Present 1964-77 n - 0.0236 (starting 1964)Pre-project 1959-63 n = 0.0245 (through 1963)1900 1908-10 n - 0 . 0 2 6 3
DD-SC Present 1964-77 n = 0.0240 (starting 1964)Pre-project 1959-63 n = 0.0252 (through 1963)1900 1908-10 n = 0 . 0 2 7 4
Gages: FG = Fort GratiotMBR = Mouth of Black RiverDD = Dry DockSC = St. Clair.
14

3. RESULTS
Results for the effects of channel changes in the upper and total St.Clair River by dredging during the present century (since 1900) for commer-cial gravel removal (1908-25) and navigation improvements (1933 and 1962)are presented in tables 4 and 5. These tables show June-August averagevalues for an average water level year (1970) and a high water level year(1973), respectively, given by two dynamic flow models developed specifi-cally for this purpose. Results from the two models agree closely, with amaximum variation of 0.01 m, which is well within limits of expectedaccuracy. Flow measurement accuracy for the Great Lakes connecting channelsis generally considered to be 2 percent, which is about 100 m3 s-1 for thenormal St. Clair River range of flows and is equivalent to about a 0.03-mdifference in head or water levels. These values represent zero com-putational errors and may be doubled for acceptable errors. The agreementfor the 2 years is also very good, with maximum deviations at Fort Gratiotof 0.01 m, showing that the effect of channel changes on water levels isnearly the same, regardless of water supply conditions. The effect of
TABLE 4.--Results of computations for upper St. Clair River profile withpresent and 1900 channel conditions during average wter levels (19701
Model
Elevation in meters Dredging effects (m)Flow River Present 1900 Channel Upper Total
m3 s-l gages channel upper total river river
FG-MBR-SC 6014 FG 176.49 176.67 176.76 -0.18 -0.27MBR 176.27 176.35 176.44 -0.08 -0.17SC 175.75 175.75 175.87 0 -0.12
FG-DD-SC 6023 FG 176.49 176.66 175.75 -0.17 -0.26DD 176.15 176.21 176.31 -0.06 -0.16SC 175.75 175.75 175.87 0 -0.12
Combined 6019 FG 176.49 176.66 176.75 -0.17 -0.26MBR 176.27 176.35 176.44 -0.08 -0.17DD 176.15 176.21 176.31 -0.06 -0.16SC 175.75 175.75 175.87 0 -0.12
Gages : FG - Fort GratiotMBR = Mouth of Black RiverDD = Dry DockSC = St. Clair.
15

TABLE 5.--Results of computations for upper St. Ctait River profiLe withpresent and 1900 channel conditions during high tXIter levels 119731.
Elevation in meters Dredging effects (m)Flow River Present 1900 Channel Upper Total
Model m3 s-l gag=s channel upper total river river
FG-MBR-SC 6567 FG 176.99 177.18 177.27 -0.19 -0.28MBR 176.75 176.83 176.93 -0.08 -0.18SC 176.23 176.23 176.35 0 -0.12
FG-DD-SC 6586 FG 176.99 177.17 177.26 -0.18 -0.27DD 176.63 176.69 176.79 -0.06 -0.16SC 176.23 176.23 176.35 0 -0.12
Combined 6577 FG 176.99 177.17 177.26 -0.18 -0.27MBR 176.75 176.83 176.93 -0.08 -0.18DD 176.63 176.69 176.79 -0.06 -0.16SC 176.23 176.23 176.35 0 -0.12
Gages: FG = Fort GratiotMBR = Mouth of Black RiverDD = Dry DockSC = St. Clair.
dredging in the upper St. Clair River on the levels of Lake Huron, indicatedby the Fort Gratiot gage at the head of the river, is a lowering of lakelevels by 0.18 m. Computed effects by the FG-MBR-SC and FG-DD-SC modelsvary, respectively, from 0.18 m to 0.17 m for 1970 and from 0.19 m to 0.18 mfor 1973. These effects at the Mouth of Black River and Dry Dock gages,about 4-km and a-km downstream, respectively, are reduced to a lowering ofriver stages by 0.08 m and 0.06 m.
The above determinations for the upper river dredging effects on lakeHuron levels agree well with previous total estimates published by theInternational Great Lakes Levels Board (1973). The Board lists the overalleffect for the total river as 0.59 ft (0.18 m), about half of which or 0.3ft (0.09 m) is attributed to commercial gravel removal and 0.29 ft (0.09 m),to uncompensated lowering of lake levels by the 25-ft and 27-ft navigationprojects. The uncompensated dredging in the lower St. Clair River, espe-cially the construction of the Cutoff Channel in the St. Clair Flats areafor the 27-ft project, is bound to have some negative effect on the levelsof the upper river and Lake Huron. This is verified in a study conducted bythe U.S. Lake Survey (1961) which, although indicating lower overall effect,
16

with similar amounts for the two navigation projects, shows that while theeffects of the 25-ft project are restricted mostly to the upper river. thoseassociated with the 27-ft project occur mainly in the mouth of the river.The total dredging effect published by the Levels Board appears, therefore,to be substantially underestimated.
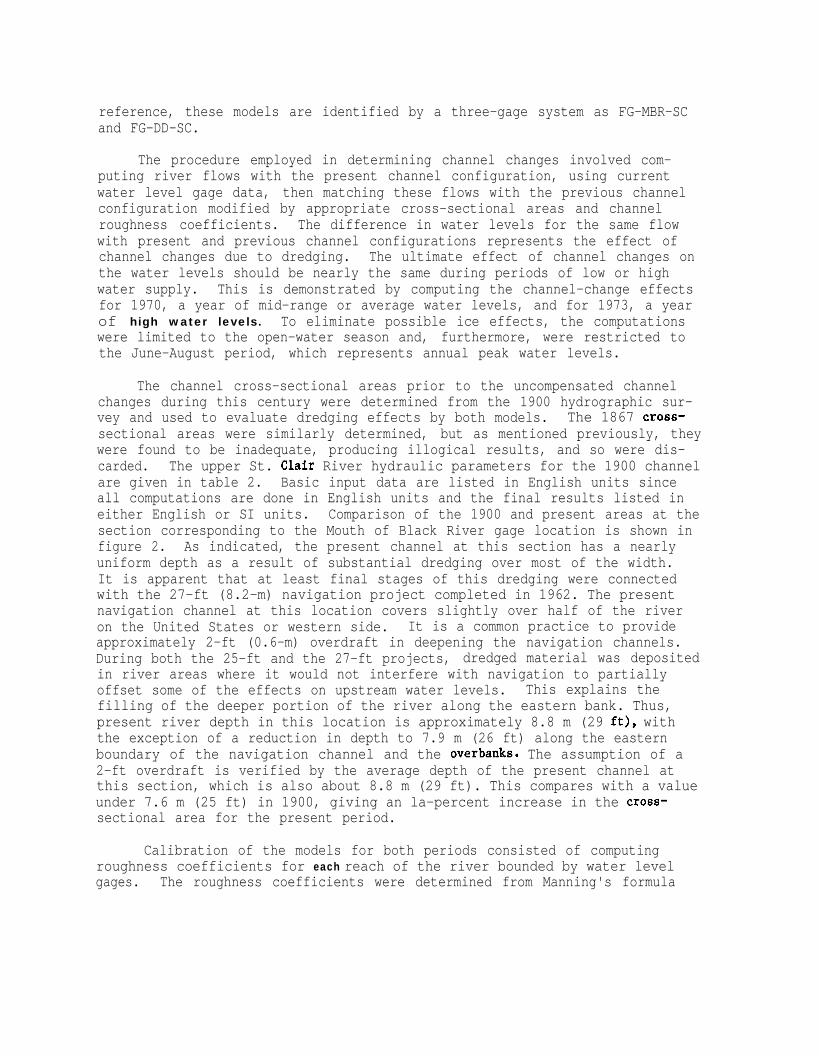
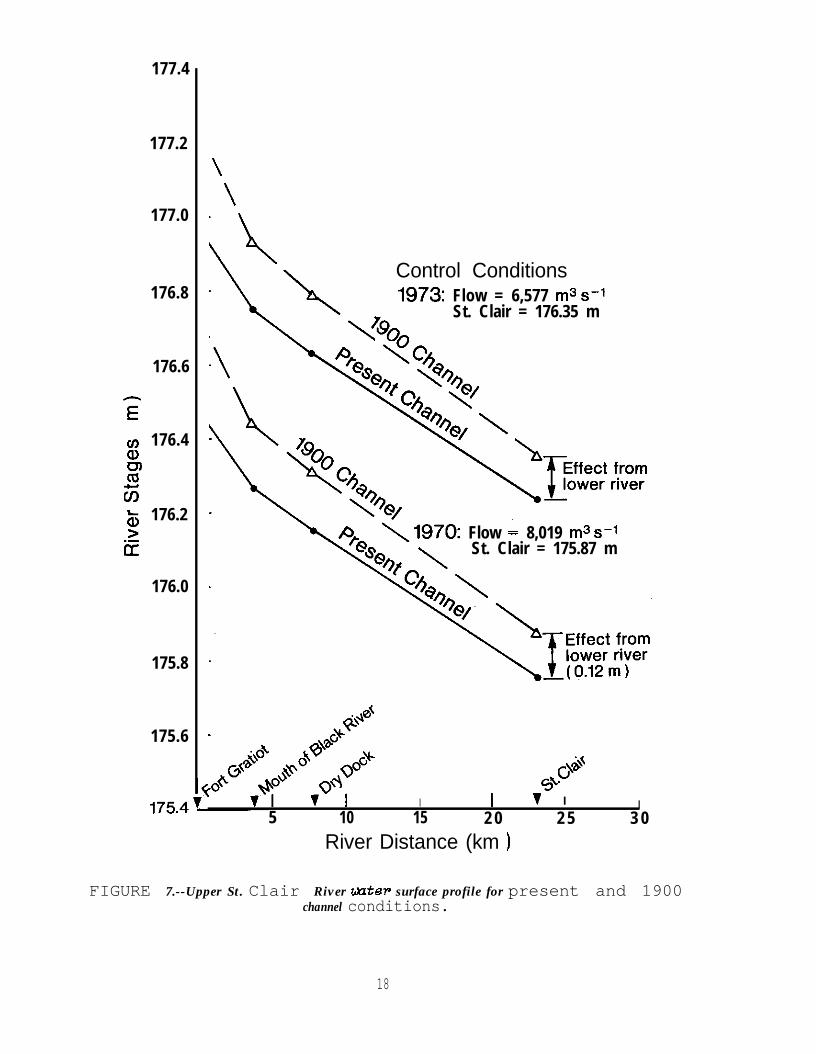
The lower St. Clair River is below the physical limits of the availablemodels and the dredging effects in this reach of the river have to besupplied as a model input before the total effects can be computed with themodels. This value was determined from a gage relationship based on avail-able data that shows that the water level at the St. Clair gage was about0.12-m (0.4-ft) higher during 1900. With this input, the total dredgingeffects were recomputed and show about 0.09-m (0.30-ft) additional drop inLake Huron levels due to dredging in the lower river. The ultimate effectof dredging in the entire St. Clair River since 1900 for gravel removal andthe two navigation projects is a lowering of lake levels (Fort Gratiot) by0.27 m (0.88 ft). The amount of lowering is reduced downstream to 0.18 mand 0.16 m at the Mouth of Black River and Dry Dock gages, respectively.Maximum deviations due to model accuracy or water supply conditions are 0.01m, as indicated previously for the upper river dredging effects. The upperSt. Clair River water surface profile for the present and 1900 channel con-ditions computed for both years are shown in figure 7. The profiles arenearly identical despite large differences in flows and water levels.
It is regrettable that a more detailed 1867 hydrographic survey is notavailable for more precise determination of cross-sectional areas of the St.Clair River channel during that period. Present determinations for thepost-1900 period indicate that the flow model method employed would be veryuseful in resolving the controversy about the causes and respective magni-tudes of the Lake Huron drop in water levels before 1900. Existing esti-mates for the dredging effects for that period vary from 0.43 m (Brunk,1968) to 0.09 m (Lawhead, 1961), vith the most recent estimate of 0.2 m byQuinn and Croley (1981). If the last estimate is correct, the levels ofLakes Michigan and Huron were lowered permanently by roughly similar amountsduring both the present and the previous centuries, with the total artifi-cial lowering due to dredging amounting to nearly half a meter (about 0.47m). This depth superimposed on the combined area of the lakes (117,400 km2)represents a volume of 55 km3, a tremendous amount of permanently lost waterresource. The loss exceeds approximately 16 times the volume of Lake St.Clair (3.4 km3), which is a large inland body of water by any standards butthose of the Great Lakes proper.
4. CONCLUSIONS
Artificial channel changes in the St. Clair River since 1900 includedredging for commercial gravel removal between 1908 and 1925 and uncompen-sated navigation improvements for the 25-ft and 27-ft projects completed in1933 and 1962, respectively. These channel changes increased the efficiencyof the Lake Michigan-Huron outlet through the St. Clair River and causedpermanent lowering of the lake's levels. The total effect of these man-madechannel changes is the lowering of the levels of Lake Michigan-Huron by 0.27
17
177.4
177.2
177.0
176.8
176.6
m 176.4
%3(I)& 176.2.g
176.0
175.8
175.6
\
\
Control Conditions1973: Flow = 6,577 m3 s-l
TQO.7St. Clair = 176.35 m
\ 1970: Flow = 8,019 m3 s-lSt. Clair = 175.87 m
G\&<3.
I I 7 I I5 10 15 2 0 2 5 3 0
River Distance (km )
FIGURE 7.--Upper St. Clair River mter surface profile for present and 1900channel conditions.
18

m. This depth superimposed on the combined area of Lakes Michigan and Huronrepresents a permanent water loss of 32 km3, which is more than nine timesgreater than the volume of Lake St. Clair.
5. ACKNOWLEDGMENT
The author thanks Dr. F. 8. Quinn of GLERL for the suggestion to conductthis study.
6. REFERENCES
Brunk, J. W. (1961): Changes in the levels of Lakes Michigan and Huron.J . Geophyw. Rew. 66(10):3329-3335.
Brunk, J. W. (1963): Additional evidence of lowering of Lake Michigan-Huron, Pub. No. 10, pp. 191-203, University of Michigan, Great LakesRes. Div., Ann Arbor, Mich.
Brunk, J. W. (1968): Evaluation of channel changes in St. Clair andDetroit River. Water Rewour. Rew. 4(6):1335-1346.
Day. P. C. (1926): Precipitation in the drainage area of the Great Lakes,1875-1924. M o n . Wea. R e v . 54(3):85-106.
Derecki, J. A., and Kelley, R. N. (1981): Improved St. Clair River dynamicflow models and comparison analysis, NOAA Tech. Memo. ERL GLERL-34,National Technical Information Service, Springfield, Va. 22151. 36PP.
International Great Lakes Levels Board (1973): Regulation of Great Lakeswater levels, Rept. to the International Joint Commission, pp. 43-47,IGLLB, Ottawa, Ont.-Chicago, Ill.
International Joint Commission (1976): Further regulation of the GreatLakes, IJC Rept. to the governments of Canada and United States, pp.21-23, IJC, Windsor, Ont.
Joint Board of Engineers (1927): St. Lawrence Waterway, Rept. of JBE togovernments of Canada and United States, U.S. Government PrintingOffice, Washington, D.C.
Lawhead, H. F. (1961): Discussion--Changes in the levels of Lakes Michiganand Huron. J . Ceophyw. Rew. 66(12):4324-4329.
Quinn, F. H., and Croley, T. E., II (1981): The role of precipitation cli-matology in hydrologic design and planning on the Laurentian GreatLakes, in Fourth Conf. on Hydrometeorol., pp. 7-11, AmericanMeteorological Society, Boston, Mass.
19

United States Lake Survey (1961): Hydraulic design memorandum, Great Lakesconnecting channels, effect of and compensation for deepening of theSt. Clair River for 25-foot and 27-foot projects, Rept. File No.3-3898, U.S. Army Corps of Engineers, Lake Survey District, Detroit,Mich.
United States Senate (1955): Senate Document 71, 84th Congress, 1stSession, U.S. Government Printing Office, Washington, D.C.
20