noaa/aoml/hurricane research division, miami, florida noaa · pdf filenoaa/nws/tpc/national...
TRANSCRIPT
-1-
A Re-analysis of Hurricane Andrew’s (1992) Intensity
Christopher W. Landsea
NOAA/AOML/Hurricane Research Division, Miami, Florida
James L. Franklin, Colin J. McAdie, John L. Beven II, James M. Gross, Brian R. Jarvinen,
Richard J. Pasch, Edward N. Rappaport
NOAA/NWS/TPC/National Hurricane Center, Miami, Florida
Jason P. Dunion
University of Miami/CIMAS and NOAA/AOML/Hurricane Research Division, Miami, Florida
and Peter P. Dodge
NOAA/AOML/Hurricane Research Division, Miami, Florida
Submitted to Bulletin of the American Meteorological Society
2 May, 2004 –Revised
Corresponding author address: Dr. Christopher W. Landsea. NOAA/AOML/Hurricane
Research Division. 4301 Rickenbacker Causeway, Miami, FL, 33149. Email:
Capsule: Hurricane Andrew, one of the United States’ worst natural disasters is upgraded
to a Saffir-Simpson Hurricane Scale Category 5 hurricane – the highest intensity category
possible
-2-
Abstract:
Hurricane Andrew of 1992 caused unprecedented economic devastation along its path
through the Bahamas, southeastern Florida, and Louisiana. Damage in the United States was
estimated to be $26 billion (in 1992 dollars), making Andrew one of the most expensive natural
disasters in U.S. history. This hurricane struck southeastern Florida with maximum 1 min surface
winds estimated in a 1992 post-storm analysis at 125 kt (64 ms-1). This original assessment was
primarily based on an adjustment of aircraft reconnaissance flight-level winds to the surface.
Based on recent advancements in the understanding of the eyewall wind structure of major
hurricanes, the official intensity of Andrew was adjusted upward for five days during its track
across the Atlantic Ocean and Gulf of Mexico by the National Hurricane Center Best Track
Change Committee. In particular, Andrew is now assessed by the National Hurricane Center to
be a Saffir-Simpson Hurricane Scale Category 5 hurricane (the highest intensity category
possible) at its landfall in southeastern Florida, with maximum 1 min winds of 145 kt (75 ms-1).
This makes Andrew only the third Category 5 hurricane to strike the United States since at least
1900. Implications for how this change impacts society’s planning for such extreme events are
discussed.
-3-
1. Introduction
The Atlantic basin hurricane database re-analysis project is an ongoing effort to extend the
database – known as HURDAT (Jarvinen et al. 1984) - back in time and to revisit and revise, if
necessary, the official tracks and intensities of tropical storms and hurricanes from 1851 to the
present (Landsea et al. 2004). Wind estimates from Atlantic basin tropical cyclones are recorded
in HURDAT in six-hourly intervals as the maximum 1 min surface [10 m] wind speed (in 5 kt
increments) within the circulation of the tropical cyclone. (Note that 1 kt = 0.515 ms-1.) HURDAT
is utilized in a wide variety of ways including climatic change studies, seasonal forecasting, risk
assessment for emergency managers, analysis of potential losses for insurance and business
interests, and the development and verification of official National Hurricane Center (NHC) and
computer model predictions of track and intensity.
While the Atlantic hurricane database has widespread and varied uses, HURDAT contains
many systematic and random errors that need to be corrected (Landsea 1993, Neumann 1994).
Additionally, as our understanding of tropical cyclones has advanced, surface wind speed
estimation techniques have changed over the years at NHC (e. g., Franklin et al. 2001), leading to
biases in the historical database that have not been addressed. Finally, efforts led by Jose
Fernandez-Partagas (Partagas and Diaz 1996) to uncover previously undocumented hurricanes of
the mid-1800s to early 1900s have greatly increased our knowledge of these past events. Based
on Partagas’ work, an extension from 1851 to 1885 has been incorporated into HURDAT and
substantial revisions have been made for the period 1886 to 1910. These changes were based
upon quality-controlled assessments and digitization of Partagas’ work and consideration of other
-4-
original data sources and studies (Landsea et al. 2004). (See the sidebar on “The Atlantic Basin
Hurricane Database Re-analysis Project”.)
Currently, re-analysis efforts are underway for the period of the 1910s through the 1990s.
Although Hurricane Andrew was originally slated to be examined sequentially under this project
in 2005, in the summer of 2002 NHC requested that the re-evaluation of this storm be addressed
more promptly. This decision was driven by recent findings on the surface wind structure within
the eyewall of major hurricanes and by the (then) upcoming ten-year anniversary of this
significant landfalling event. Hurricane Andrew caused an enormous amount of destruction in
southeastern Florida: over 25,000 homes were destroyed and more than 100,000 homes
damaged, 90% percent of all mobile homes in the region of landfall were leveled, over a billion
dollars damage was done to local agriculture, and total direct losses exceeded $26 billion
(Rappaport 1994). More than ten years later, the region still feels the effects from this hurricane.
For example, there has been a nearly ten-fold increase in average property insurance costs for
hurricane wind damage in some coastal locations and limited availability of privately
underwritten insurance (Chandler and Charles 2002).
Society needs reliable information as to the frequency and severity of past catastrophic
events to best plan for the future. Therefore, it is crucial that accurate historical accounts of the
characteristics of all tropical cyclones be obtained. This is of particular importance for
significant landfalling hurricanes like Andrew. Recently, our understanding of the surface wind
field in hurricanes has advanced dramatically (Franklin et al. 2003, Dunion et al. 2003). New
Global Positioning System (GPS) dropwindsonde observations in hurricane eyewalls, first
collected in eastern North Pacific Hurricane Guillermo in 1997, suggest that the intensities of all
-5-
hurricanes in the aircraft reconnaissance era up through 1998 should be re-examined when the
primary method for estimating surface winds was from flight-level wind adjustments.
In August 2002, NHC’s Best Track Change Committee, chaired by Colin J. McAdie with
members John L. Beven II, James M. Gross, Brian R. Jarvinen, Richard J. Pasch, and Edward N.
Rappaport, with Herbert Saffir serving as a non-committee observer, met to consider proposed
revisions to the official intensity of Hurricane Andrew both over the open ocean and at landfall.
Complete documentation of the presentations given by Edward N. Rappaport, James L. Franklin,
Mark D. Powell, Peter G. Black, and Christopher W. Landsea, email exchanges on the issue, the
committee’s full decision and the revised database can be found at:
http://www.aoml.noaa.gov/hrd/hurdat/index.html. The purpose of this paper is to provide a more
permanent summary of the evidence and issues considered by the committee, to record the
outcome of the reanalysis, and to discuss some of the implications of these changes.
2. Assessing maximum surface winds in hurricanes
The original NHC estimates of Hurricane Andrew’s intensity for most of its over-water
life cycle were based primarily upon an adjustment of aircraft reconnaissance flight-level winds to
the surface. In particular, Hurricane Andrew’s intensity at landfall in southeastern Florida was
largely determined shortly after its passage by adjusting the peak Air Force reconnaissance
aircraft 700 mb flight-level winds of 162 kt to 125 kt at the surface – an adjustment factor of
77%.a An analysis of Andrew by Powell and Houston (1996) came to a similar conclusion - that
a NHC’s operational estimate of Hurricane Andrew’s intensity at landfall in southeastern Florida was slightly lower – 120 kt. The operational wind speed and position estimates of all Atlantic basin tropical storms and hurricane are re-
-6-
maximum 1 min surface winds of 128 kt impacted the southeastern Florida coast. However, two
recent studies, Franklin et al. (2003) and Dunion et al. (2003) provide strong evidence that the
methodology originally used to assess the maximum 1-min surface wind in the post-storm
analyses of Hurricane Andrew (Rappaport 1994; Mayfield et al. 1994; Powell and Houston 1996)
resulted in winds too low for a substantial portion (~5 days) of the lifetime of the storm. (See the
sidebar on “New understanding of eyewall structure since Hurricane Andrew” for details that
have led to these changes in the methodology for determining intensity.)
Aircraft reconnaissance flights have been standard operating procedure since the 1940s for
tropical storms and hurricanes threatening land in the Atlantic basin. In the absence of
contradictory evidence, current operational practice at NHC is to estimate the surface maximum
1-min wind intensity of a hurricane at about 90% of the peak 10 s wind present at the 700 mb
level (i.e. the “90% rule” - Franklin et al. 2001, 2003). Such methodology likely will remain a
primary tool for assessing intensity in Atlantic basin hurricanes for at least the next few years.
3. Estimating Andrew’s intensity
a. Aircraft reconnaissance data
As Hurricane Andrew approached Florida in late August 1992, it was monitored almost
continuously by Air Force reconnaissance aircraft measuring flight-level winds at 700 mb and
obtaining minimum sea level pressure data. At 0810 UTC, about an hour prior to Andrew’s
landfall in mainland southeastern Florida, an Air Force reconnaissance aircraft at 700 mb
analyzed soon after the event for a post-storm “best track” assessment, which may differ slightly from that given in real-time.
-7-
measured a 10 s average wind of 162 kt. Application of a 90% adjustment factor to this flight-
level wind produces a surface wind estimate of 146 kt. Similarly adjusted 10 s average flight
level winds at 0809 and 0811 UTC yield surface values of 140 and 141 kt, respectively. During
the aircraft’s subsequent pass through the hurricane, an additional 10 s report at 0918 UTC yields
a surface value of 137 kt using the same reduction. The importance of these additional
observations is that they indicate that the flight-level observation at 0810 UTC was not an
isolated condition.
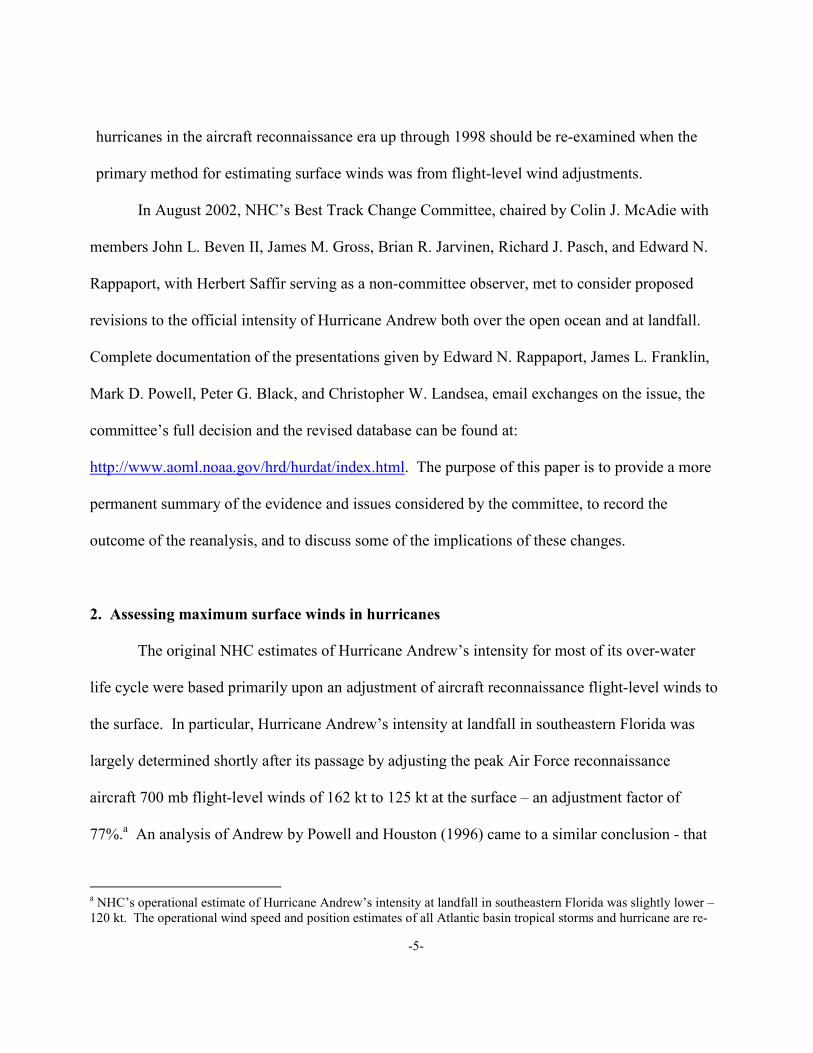
Analyses from the current H*Wind surface wind algorithm (Dunion and Powell 2002)
provide a marine exposure surface wind estimate of 153 kt, or 94% of the flight-level
observations from the 0810 UTC reconnaissance data (Fig. 1). This result is in reasonable
agreement with the recommended adjustment from the Franklin et al. (2003) methodology.
Assuming that the 162 kt flight-level aircraft wind was representative of the peak 700 mb
winds that were present in Andrew’s circulation, a surface adjustment factor of 77% is required
to diagnose Andrew at 125 kt as originally assessed. Of the seventeen hurricanes examined by
Franklin et al. (2003), none were observed with GPS dropwindsondes to have a mean adjustment
factor this low in the eyewall. The lowest observed ratio - 83% - was found in Hurricane
Bonnie - a weakly convective storm with a large eyeb. Furthermore, the adjustment factor to
provide surface winds appears to increase when the boundary layer winds are very high (Dunion
et al. 2003, Franklin et al. 2003) and when vertical motions are particularly vigorous (at least 1.5
m/s absolute vertical velocity between the ocean’s surface to 2000 m - Franklin et al. 2003).
-8-
Andrew likely satisfied both of these conditions at its landfall in southeastern Florida. Thus,
there is little evidence from the dropwindsondes datasets to support Andrew having a lower than
normal adjustment factor in the eyewall region.
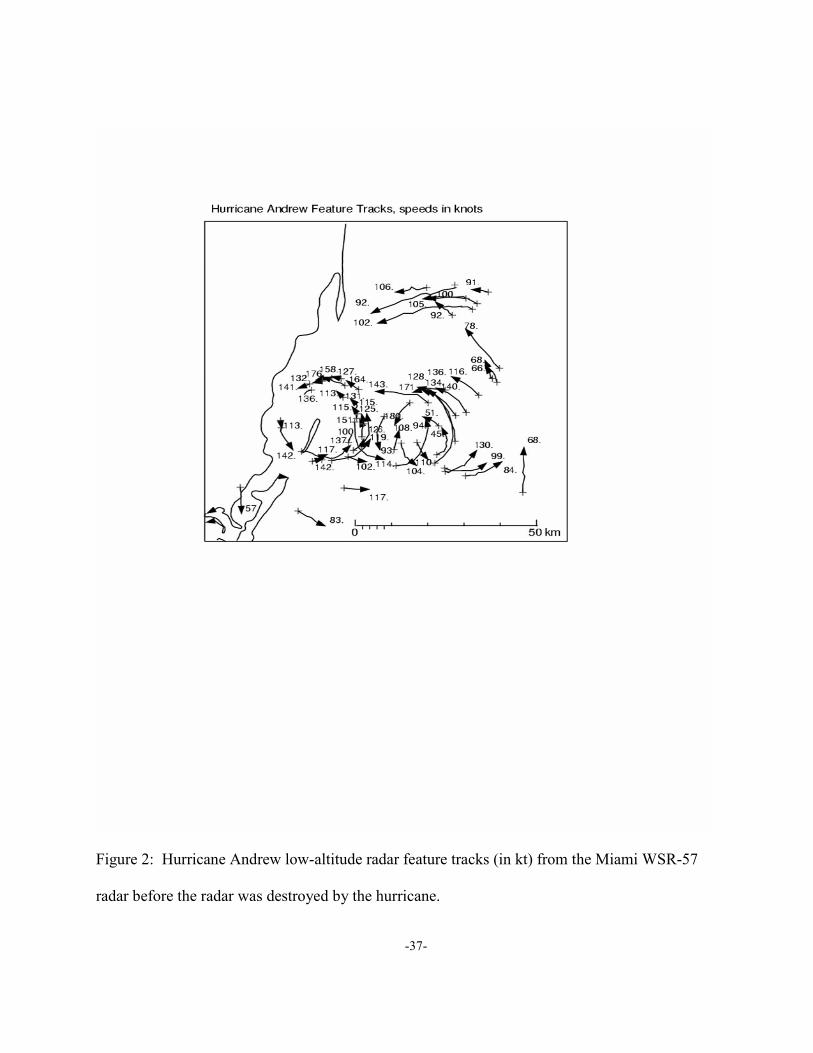
b. Radar-derived wind vectors
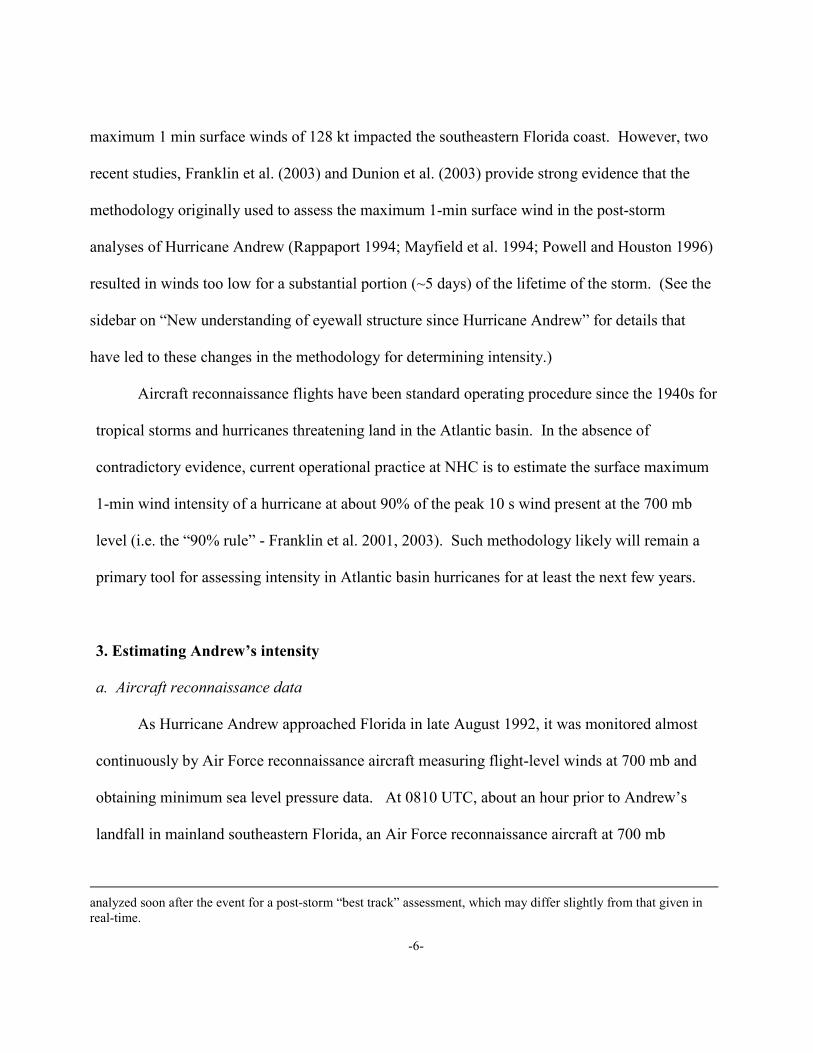
Low-altitude radar feature tracking presented by P. Dodge to the committee suggested
surface winds similar to those implied by applying a 90% adjustment factor to the flight-level
data. Figures 2 and 3 show vectors based on feature tracking from the Miami WSR-57 radar
outside and within Andrew's eyewall just prior to landfall in southeastern Floridac. This
technique has been demonstrated to provide lower tropospheric wind vectors in the circulation of
a hurricane that are comparable to those measured by aircraft. Tuttle and Gall (1999) reported
agreement with 700 mb flight-level winds to within 10%, though the radar-derived winds have a
relatively noisy signal and must be quality-controlled before use. The three highest feature
speeds found in the Andrew data were 171 kt at 700 m at 0739 UTC, 176 kt at 400 m at 0839
UTC, and 180 kt at 1100 m at 0730 UTC (Fig. 2), with heights based upon the radar tilt and
distance from the radar site. The strongest of these velocities does not appear consistent with
nearby radar feature tracks. Making the assumption that the average of the remaining two
observations (174 kt) represents the maximum eyewall winds near the boundary layer top (BLT),
we can adjust this wind to the surface using mean dropwindsonde profiles. Applying the
Franklin et al. (2003) eyewall mean profile for the strongest BLT wind speeds in their sample
b However, hurricanes with stable boundary layers moving north of the Gulf Stream over cool waters, such as Gloria of 1985 (Powell and Black 1990) and Bob of 1991 were analyzed to have surface to flight-level wind ratios as low as
-9-
(135-155 kt, their Fig. 12) gives an 82% adjustment factor and a surface wind estimate of 143 kt.
The Dunion and Powell (2002) methodology was also applied to these new radar-derived
wind vectors. Their analysis system suggests that these low-altitude radar feature tracks
correspond to winds of 148 kt at the ocean’s surface, again in close agreement with the estimates
from the Franklin et al. (2003) methodology.
c. Surface observations
The NHC Best Track Change Committee reviewed the available surface observations
from Andrew’s landfall to determine whether they were consistent with the dropwindsonde-
based adjustments of flight-level and radar winds discussed in the previous two sections. In
particular, they focused upon two key observations: the Fowey Rocks and R. Fairbanks data
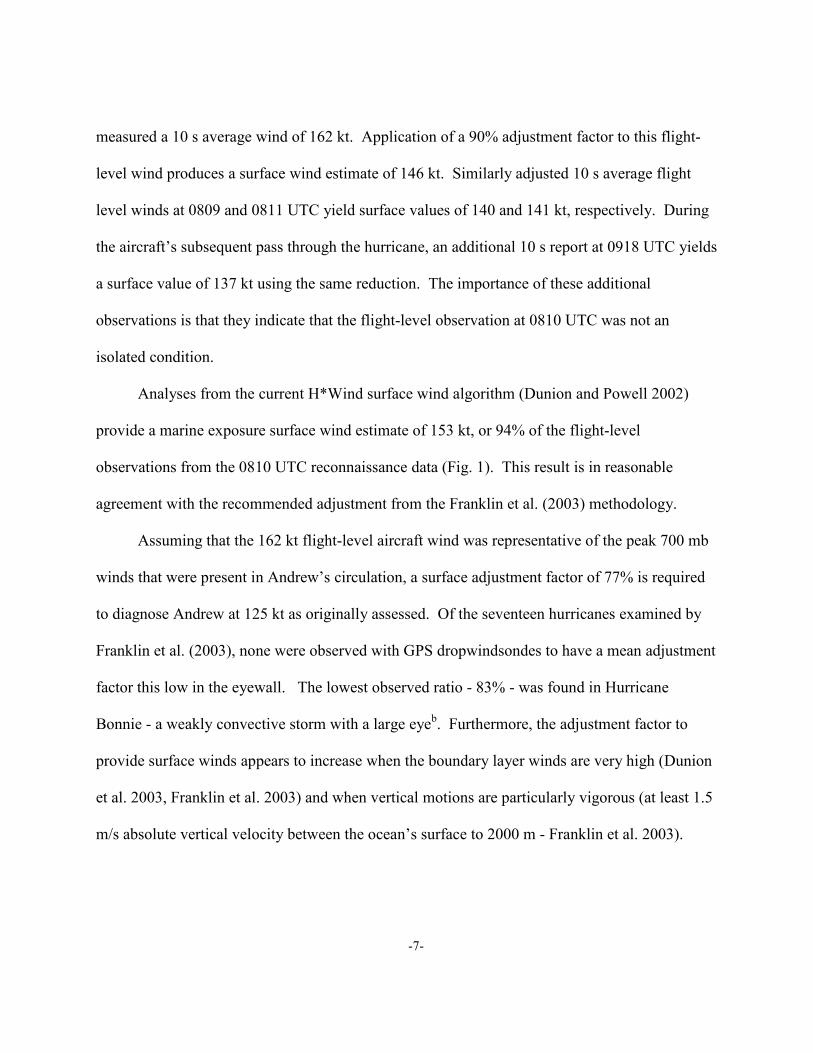
(Rappaport 1994, Mayfield et al. 1994, Powell et al. 1996). The Fowey Rocks C-MAN weather
station (elevation 44 m) reported a peak 2 min mean wind of 122 kt at its last hourly transmission
before it failed after 0802 UTC. This adjusts to approximately 111 kt for a maximum 1 min
surface (10 m) wind valid for over open water exposure. At this station, the winds increased
dramatically in the last hour of reporting. In particular, an 18 kt increase in the 10 min mean
wind between 0749 and 0759 UTC (not shown) in conjunction with the location of the station
relative to Andrew’s eyewall (Fig. 3) provides strong evidence that the surface winds at that
location had not yet leveled off and would likely have continued to increase to substantially
higher values had it survived for at least a few more minutes. (Typically, the surface radius of
55% based upon buoy observations. c See loop of this radar reflectivity data at: http://www.aoml.noaa.gov/hrd/hurdat/andrew_cells.jpg
-10-
maximum wind occurs at the inner edge of the eyewall or even just inside the eye when viewed
by radar in the lower troposphere - Marks et al. 1992). Based upon the position of the Fowey
Rocks station, the movement of Hurricane Andrew, and an estimate of the surface radius of
maximum wind for that portion of the storm, it is calculated by J. Beven that the station would
likely have encountered the peak winds in the northern eyewall at about 0820 UTC, about 20
minutes after its final report. Assuming a linear increase of winds during this time (a
conservative estimate), the peak 10 min mean station wind may have reached 145 kt. After
adjusting for both station height and averaging period, this converts to approximately 148 kt for a
maximum 1 min surface (10 m) wind valid for over open water exposure.
R. Fairbanks, an amateur weather observer located in Perrine, noted a peak gust of 184 kt
(corrected to 154 kt after adjusting for the overestimation bias of this type of instrument) from
his home-based anemometer just before it failed. This observation was believed to be consistent
with a 1 min open terrain surface wind of about 119 kt, after employing typical gust factors
(Powell et al. 1996). The Fairbanks observation had no wind direction associated with it and
only an approximate time (0830 to 0900 UTC). The strongest winds experienced at the location
of the Fairbanks’ home were probably not earlier than 0900 UTC, based upon Miami radar
imagery extrapolated to the time the inner edge of the eyewall and the surface radius of
maximum winds would have encountered the home (Powell et al. 1996).
As a result, C. Landsea argued that both the Fowey Rocks and Fairbanks instruments
appeared to have failed before the strongest winds of Andrew arrived, because these observations
-11-
were taken in the northwest portion of the eyewalld outside of the surface radius of maximum
winds. The peak winds were likely closer to the storm’s center in the northern portion of the
eyewall (Fig. 1). Thus neither of these observations seem to represent the maximum winds of
Hurricane Andrew at landfall in southeastern Florida.
Inspection of these surface observations in comparison with surface-reduced flight-level
data in Figure 1 did not suggest a large inconsistency, though it is difficult to directly compare
them for three reasons. First, the flight-level data primarily were in radial legs running north-
south and east-west, which did not coincide well spatially with the Fowey Rocks and Fairbanks
observations near the time of landfall after compositing the data with respect to the hurricane’s
center. Secondly, the Powell and Houston (1996) methodology for estimating the surface radius
of maximum wind (which was used in Figure 1) appears to be too large (11 nmi [20 km] versus
8-9 nmi [15-17 km]) compared with the observed location of the wind center and the highest
storm surge, which was thought to coincide with the peak surface windse. Thus the strongest
surface winds in Figure 1 were spread out too far radially, making direct comparisons of
extrapolated flight-level winds from H*Wind analyses and in-situ surface observations
problematic. Finally, because of the turbulent and transient nature of the hurricane wind field, it
d The Fairbanks observation may instead have been in the north eyewall if it occurred around 0900 UTC, but the time of the measurement and thus its storm-relative location at the time of the peak gust measured are uncertain. e The location of the peak storm surge caused by a hurricane can be influenced by a number of factors besides radius of maximum wind, including coastline shape, local offshore bathometry/inland topography, astronomical tides, wave set up, inflow angle, etc. (i.e., Jelesnianski 1993). However, for the specific case of Hurricane Andrew’s landfall in southeast Florida, these factors appear to be secondary in comparison to the surface radius of maximum winds for forcing the peak storm surge location along the coast. Sensitivity testing using SLOSH run with the observed Hurricane Andrew characteristics (track, central pressure, environmental pressure) and varying the RMW demonstrates the primary influence of RMW for this specific case. These runs suggest that only with a smaller RMW (8-9 nmi versus Powell and Houston’s [1996] 11 nmi) does one match the observed storm surge pattern and location of the peak surge value. (It is, however, possible that the open exposure to the ocean east of the area of peak storm
-12-
is not straightforward to make direct comparisons between a storm-centered composite of the
adjusted flight-level winds and a small number of in-situ observations. It would take a
systematic discrepancy over many observation points to determine that the standard 90% flight-
level adjustment factor was
invalid for a particular storm.
d. Winds at the coastline and over land
While there was unanimous agreement among the presenters and committee members that
Andrew’s intensity was under-analyzed during its open water approach to southeastern Florida,
there was lengthy discussion whether these strong winds were also felt along the coastline and
over land. Current understanding is that the well-developed hurricane boundary layer is different
over land than it is over water and that there must be a transition zone at or near the coastline
between these two regimes. It was suggested (Powell et al. 2003) that the winds in the northern
eyewall were weakened by increased roughness presented by shoaling and breaking waves in the
shallow waters between the fringing reefs, Biscayne Bay, and the coastline before the storm
made landfall. In this case Biscayne Bay may not have represented a typical marine exposure
with small roughness length, but instead may have been more consistent with conditions
experienced in an over-land environment with open exposure terrain. However, recent analyses
of ocean waves within Hurricane Bonnie at landfall in North Carolina show that waves do not
generally increase in height from shoaling in shallow waters, but instead show a large decrease
surge may have allowed for additional wave impacts, which are not explicitly modeled by SLOSH and may somewhat complicate the RMW analysis).
-13-
from offshore (8 to 10 m mean wave heights) to the coastal locations (4 to 5 m) (Walsh et al.
2002). While the bathymetry of the waters offshore of south Florida where Andrew hit is
somewhat different from North Carolina, if such decreased wave heights did occur, it is not clear
what these would imply when combined with breaking waves for changes to the roughness
length relative to the open ocean.
J. Franklin presented the committee with an analysis of available GPS dropwindsondes
near shore (within 10 km) and offshore (10-60 km) in the right eyewall of hurricanes making
landfall in the United States. This preliminary study suggested that there could be some reduction
in surface winds along the immediate coastal waters. A very limited sample of 19
dropwindsondes in the eyewalls of weak to moderate hurricanes shows an apparent 5-10%
reduction of surface wind as the coastline is approached. Using this alteration to the Franklin et
al. (2003) surface wind methodology gives maximum 1 min winds at the coast of roughly 130 to
140 kt. However, given the extremely small sample of dropwindsondes (i.e. 10 near shore and 9
just offshore) and lack of any major hurricanes in this coastal analysis, such results were
considered by the Best Track Change Committee to be too speculative to be applied at this timef.
Clearly, more dropwindsonde data are needed both in the transition zone between land and water
as well as in the hurricane boundary layer over land to properly assess the degree to which a
hurricane’s surface winds over open water reach the coastline.
e. Other evidence for Andrew’s intensity
-14-
While the primary pieces of evidence for altering Hurricane Andrew’s intensity came from
revised extrapolations of flight-level winds and radar feature track data, other information on the
intensity was also available and considered in the re-analysis. These were the continued central
pressure drop after the measurement of the peak aircraft wind report, pressure-wind relationships,
surface pressure gradients, high altitude radar reflectivity eyewall core velocities from the WSR-
57 radar in Tampa, satellite intensity estimates, storm surge modeling runs, and surveys of wind-
caused damage. These measuresg were mainly consistent with the revised surface wind estimates
discussed in earlier sections, though they were of secondary importance to the final NHC Best
Track Change Committee decision.
4. Best track changes
After considering the presentations regarding various recommendations for the revisions
of Andrew’s best track intensities, the NHC Best Track Change Committee made alterations to
the winds in HURDAT for Hurricane Andrew (Table 1 and Figure 4) for the dates of 22 to 26
August. These changes were made to Hurricane Andrew’s intensity data for the time while the
storm was over the Atlantic Ocean just east of the Bahamas, over the Bahamas and south Florida,
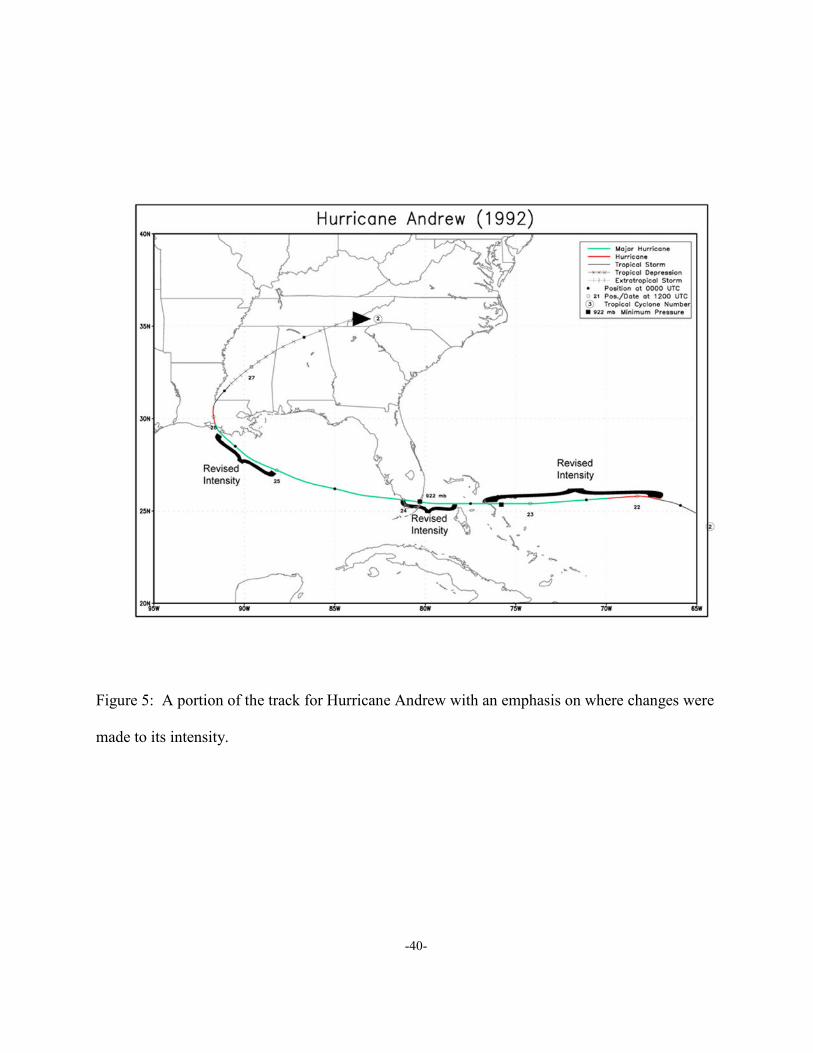
over the Gulf of Mexico and at landfall in Louisiana (Fig. 5). Neither the best track positions nor
the central pressure values of Andrew were adjusted. The alterations in wind intensity were
based upon the Franklin et al. (2003) methodology, which is consistent with the work of Dunion
f The National Hurricane Center’s operational estimates as well as the post-storm best track assessments have historically made the assumption that an otherwise steady-state hurricane’s maximum winds over water do survive to the coastline. g Discussion of these parameters can be found in the writeup by the presenters for the Hurricane Andrew re-analysis deliberations at: http://www.aoml noaa.gov/hrd/hurdat/index.html .
-15-
et al. (2003) and Dunion and Powell (2002) as discussed earlier. The changes to HURDAT were
applied for these dates as aircraft reconnaissance observations were available throughout this
period and there were limited in-situ surface observations indicative of the maximum 1 min
surface winds. The revisions make Andrew a Saffir-Simpson Hurricane Scale (SSHS – Saffir
1973, Simpson 1974) Category 5 (i. e., maximum 1-min surface winds of at least 136 kt)
hurricane at landfall in both Eleuthera Island, Bahamas and in southeastern Florida. The
maximum 1-min surface wind for Hurricane Andrew at landfall in mainland southeastern Florida
near Fender Point (8 nmi [13 km] east of Homestead) at 0905 UTC 24 August was officially
estimated to be 145 kt. (The original 1992 NHC best track landfall intensity estimate was 125
kt.) The peak intensity of Andrew, originally assessed at 135 kt, was reasoned to be 150 kt at
1800 UTC 23 August just east of the northern Bahamas.
5. Discussion of uncertainties
The purpose of the re-analysis efforts is to ensure the most accurate historical hurricane
record possible, one that is consistent with contemporary science. It has been suggested that the
record in the case of Andrew should not have been changed, in part because of the uncertainty
surrounding the maximum surface wind. However, the Committee recognized that no storm’s
intensity can be determined with complete accuracy; the surface observations are almost never
sufficiently comprehensive, and indirect measures of surface wind must always be used.
Uncertainty in a wind speed estimate should not be an obstacle to revising an earlier estimate that
is inconsistent with the observations, especially if it has benefited from new advances in science
and understanding.
-16-
Powell et al. (1996) indicated an estimate of + 20% procedure error in assigning surface
winds from flight-level aircraft reconnaissance wind data in their original methodology. For the
maximum 1 min surface winds in Andrew that they analyzed, this ranges from 103 to 153 kt,
reflecting the large uncertainty in the analysis methodology at that time. Franklin et al.’s (2003)
examination of several hundred over-ocean hurricane eyewall dropwindsondes indicated that
while the mean ratio of surface to 700 mb winds was about 90%, the standard deviation was about
19%. This value is similar to the variability suggested by Powell et al. (1996).
However, this does not mean that the uncertainty in estimating peak surface winds from
flight-level data is necessarily about 20%. It is important to distinguish between the following
two questions: 1) given a wind observation taken at 700 mb somewhere in the hurricane eyewall,
what is the underlying concurrent wind at the surface; and 2) given a storm's maximum wind at
700 mb, what is the storm's maximum sustained wind at the surface? The 19% standard deviation
is directly applicable only to the first question posed above. This variance is not appropriate for
estimating the variability in the ratio of the storm's maximum surface to maximum 700 mb winds.
The variance of the latter quantity is not known, but should be less than 19%, as illustrated by the
following example.
Imagine a steady-state storm in which the maximum 1 min wind at the surface is 90 kt,
while the maximum 1 min wind at 700 mb is 100 kt. Over time, the precise location of the
maxima at both the surface and 700 mb may vary, but the peak values present at each level
remain constant. By assumption, the variance of peak surface to peak 700 mb wind is zero. Even
so, if the eyewall of this storm were to be sampled by GPS dropwindsondes, the dropwindsonde
-17-
surface to 700 mb wind ratio will still have a large variance, because (a) the wind distributions are
not necessarily the same at the two levels, so a dropwindsonde that samples the maximum at 700
mb will not necessarily sample the surface maximum, and vice versa, and (b) the dropwindsondes
do not measure a 1 min wind, but measure whatever turbulence they happen to fall through during
a 0.5 s interval. These factors contribute to the high variance in adjustment factor ratios computed
from individual dropwindsondes, but it has very little to do with the relationship between peak
winds from level to level. While a precise measure of the procedure error in applying the 90%
rule may not be obtainable currently, mean eyewall profiles from different storms (Franklin et al.
2003) suggest that it may be near 10% (i.e., that the actual surface wind to 700 mb flight level
ratio for Hurricane Andrew would have been between about 80 and 100%).
It is acknowledged that the re-analysis presented here of Andrew’s intensity at landfall in
southeastern Florida (and elsewhere in its lifetime) is not known with exact certainty, nor will it
ever be. However, it is concluded here that Hurricane Andrew’s intensity is very likely to be in
the range of 136 to 155 kt for the maximum 1 min surface winds that impacted the coast at
landfall in mainland southeastern Florida with a best single estimate of 145 kt. It is quite unlikely
that Andrew was a 125 kt hurricane at landfall (Category 4) as originally thought, consistent with
the uncertainty discussion above. It should be noted that these Category 5 conditions likely
occurred on land only in a small region in south Dade County close to the coast in Cutler Ridge.
Most of the region in the county south of Kendall Drive (25.7 oN) received Category 4 or
Category 3 hurricane conditions. Peak gusts over oceanic conditions and over land were likely to
be on the order of 160 to 170 kt, based upon typical gust factors utilized (e.g. Powell and Houston
-18-
1996). (See the sidebar on “Implications of Hurricane Andrew’s Re-analysis in the United
States”.)
While this re-analysis does not preclude revisiting of Hurricane Andrew’s intensity in the
future if needed, it is the official estimate at this time. We are working within the bounds of the
state of the science to interpret surface wind conditions in hurricanes. The violent inner core of
major hurricanes has always been an area with a dearth of in-situ measurements of the peak
winds. Numerous uncertainties remain (e.g., how representative was the 162 kt flight-level winds
of the peak winds in Andrew at 700 mb; how much intensification to Andrew’s windfield
occurred after the reconnaissance plane left the north eyewall; how surface winds in hurricanes
are altered in general at the ocean/coast interface; how further stratifications to the dropwindsonde
data may provide better surface wind estimates for various right versus left asymmetries and
flight-level wind speed, convective or stability regimes?). Continued data collection and research
are strongly encouraged to help clarify these important issues. However, it is realized that despite
progress into scientific uncertainties, the exact wind speeds caused by Hurricane Andrew in
southeastern Florida and elsewhere will never be known with complete accuracy and confidence.
Summary:
• 1992’s Hurricane Andrew originally was assessed to have reached a peak intensity and
Bahamian/U.S. landfall intensity of SSHS Category 4, based primarily upon
adjustment of flight-level winds to the surface.
-19-
• Research using GPS dropwindsondes in the late 1990s and early 2000s has
demonstrated that stronger winds exist at the surface in the hurricane eyewall than
originally believed.
• A re-analysis of Hurricane Andrew’s intensity considering this new understanding
indicates that Andrew’s maximum 1 min surface winds for much of its lifetime were
substantially stronger than was analyzed earlier. In particular, Hurricane Andrew is
now estimated to have reached Category 5 status at its landfall in both the northern
Bahamas and in southeastern Florida.
• Continued research is needed to better understand the surface winds in strong
hurricanes in a variety of differing environmental conditions and at the ocean/coast
boundary, in particular.
• Because of this reclassification, the return period of catastrophic hurricanes like
Andrew increases from about 15 years to at least 50 years for south Florida. Thus the
risk from Andrew-like hurricanes at that location is significantly less than previously
estimated.
Acknowledgments:
The first author acknowledges the support of NOAA/NASA Grant #GC02-093 - The
Atlantic Hurricane Database (HURDAT) Re-analysis Project. The authors wish to thank Mike
Black and Krystal Valde for their contributions toward better understanding of the hurricane’s
violent inner core wind structure. Additional thanks go to Pete Black and Mark Powell for their
presentations of surface pressure gradients/surveys of wind-caused damage and surface wind

-20-
estimation, respectively, for the NHC Best Track Change Committee’s deliberations. Lenworth
Woolcock provided support for both figure preparation as well as web site development and
maintenance. Kind suggestions and recommendations for this re-analysis and paper were also
provided by several additional people: William Bredemeyer, Steve Feuer, John Gamache, Paul
Hebert, Jeff Kepert, Paul Leighton, Charlie Neumann and Hugh Willoughby.
-21-
Box 1: The Atlantic Basin Hurricane Database Re-analysis Project
The Hurricane Research Division (HRD) of NOAA’s Atlantic Oceanographic and
Meteorological Laboratory is engaged in an effort to extend and improve the quality of NHC’s
original North Atlantic best track and intensity database, HURDAT, from 1851 to the present
<http://www.aoml.noaa.gov/hrd/data_sub/re_anal.html>. Employing consistent analysis methods
and modern interpretations, the HRD HURDAT reanalysis project is helping to correct multiple
errors and biases, determine better landfall attributes, and provide additional track and intensity
data for tropical cyclones included in the database (Landsea et al. 2004). Through inspection of
historical meteorological records and accounts, previously unknown tropical cyclones are also
identified and considered as candidate storms to be added to the database. All recommended
changes to HURDAT are subsequently submitted to NHC’s Best Track Change Committee for
approval.
As of early 2004, an extension of HURDAT from 1851 through 1885 was added to the
database and a reassessment was conducted for tropical cyclones already in HURDAT for the
period of 1886 to 1910. These alterations resulted in the addition of over 262 new tropical
cyclones and revisions made to another 185 of the 456 total tropical storms and hurricanes that
are in the latest version of the database between 1851 and 1910. While Hurricane Andrew’s
changes reported here were expedited for special reasons, current work is focusing upon the re-
analysis of the remainder of the 20th Century and will be included into HURDAT in sequential
order. It is anticipated that alterations and additions to the database will be needed even up
through the 1990s due to changes in our understanding of the structure of tropical cyclones, better
-22-
analysis tools available today, and the uncovering of meteorological observations not available or
utilized operationally or in previous post-storm analyses.
The implications of a changing “best track” dataset are multifold. In the societal aspect,
eventual benefits of an improved meteorological record of tropical storms and hurricanes include
a more accurate assessment of extreme event risk for insurance interests, building code designers
and emergency managers. For tropical meteorologists, a more complete, consistent and reliable
HURDAT will mean, for example, a homogeneous record to evaluate and better predict
interannual, decadal and interdecadal variability in Atlantic basin tropical cyclone activity as
well as better standards to evaluate and validate models for track and intensity of tropical
cyclones. However, a changing database does present somewhat of a “moving target” for studies
that utilize HURDAT. For example, as tropical cyclone tracks and intensities are altered, official
and model-based errors in past years will also change. Moreover, even the benchmarks for
assessing skill in tropical cyclone track and intensity predictions (i.e., the “no-skill” models of
CLIPER [McAdie and Lawrence 2000] and SHIFOR [DeMaria and Kaplan 1999], respectively)
will need to be re-derived once there exists a stable database after the re-analysis is complete. In
the meantime, researchers in the field should be aware that the officially-assessed track and
intensity of storms that they are studying may be changed in the near future. While such changes
may be somewhat problematic in the short-term, a uniformly analyzed, improved quality tropical
storm and hurricane database will be beneficial in the long run for all users of HURDAT.
-23-
Box 2: New understanding of eyewall structure since Hurricane Andrew
A key issue confronting both operational estimates and post-analysis assessments of
hurricane intensity is the most appropriate way to adjust flight-level winds typically at 700 mb
down to surface wind values. Ten-second averages of the flight-level wind in the inner core of
hurricanes are assumed to represent a 1-min average wind (Powell et al. 1991). Longer
averaging of the flight-level winds would tend to underestimate the true maximum 1-min wind
speeds because the aircraft does not remain long in the peak gradient region on a radial flight
track, especially in relatively small hurricanes like Andrew. The best method for adjusting these
winds to the surface had previously been unclear, as the most thorough study of flight-level
winds to surface wind observations (i.e. Powell and Black 1990) contained mainly tropical storm
force maximum winds and few observations in the eyewall region.
A new understanding of the surface wind structure in hurricanes was made possible by an
advance in technology - the GPS dropwindsonde (Hock and Franklin 1999), which provided the
first detailed wind profile in a hurricane’s eyewall from flight-level to the ocean surface. Near
surface data from individual dropwindsondes have compared favorably with concurrent
observations from moored buoys and Coastal-Marine Automated Network (C-MAN) stations
(Houston et al. 2000) and co-located Stepped Frequency Microwave Radiometer data (Uhlhorn
and Black 2003), although both of these studies have limited observations from the core of major
hurricanes. While individual GPS dropwindsondes provide only a momentary slice of data
(which is not even a vertical profile because of the inflowing and swirling flow that the drop
encounters in the hurricane eyewall), a judicious partitioning and averaging of the
dropwindsondes can provide useful wind mean wind conditions within the hurricane.
-24-
Franklin et al. (2003) examined several hundred over-ocean GPS dropwindsonde profiles
in the hurricane eyewall and have shown that the mean ratio of surface to 700 mb winds is about
90% in the eyewall region. Franklin et al. recommended a set of adjustment factors for the
interpretation of tropical cyclone flight-level data. The results from the drop profile analysis in
Franklin et al.’s (2003) study provide a way to infer winds at one level from those at another.
This adjustment assumes a similar averaging time at both levels, but is not constrained to any
particular averaging time. For the stronger (right hand) side of the eyewall, they found that the
mean surface-700 mb ratio was between 86% and 90%. Thus without additional information,
estimates of the surface maximum 1 min wind intensity of a hurricane at the National Hurricane
Center are assessed to be about 90%h of the peak 10 s wind observed at the 700 mb level from
aircraft.
Recent work by Dunion and Powell (2002) and Dunion et al. (2003) also supports a
revised flight-level-to-surface wind adjustment in the context of the Hurricane Research
Division’s Hurricane Wind Analysis System (H*Wind) surface wind analyses of tropical
cyclones. H*Wind is an analysis tool that can assimilate a variety of observations within a
tropical cyclone to produce a storm-centered few-hour composite of the surface wind field
(Powell 1980, Powell et al. 1996, 1998). Given sufficient observations, the analyses can be used
to make estimates of the maximum 1 min winds, as well as radii of tropical storm force or
hurricane force winds.
Using information from the GPS dropwindsondes, techniques were developed to improve
h This factor is at the high end of the range established by the dropwindsondes (86%-90%), in part because of simple rounding of the midpoint of this range, but also to account for the likelihood that the cyclone’s highest 700 mb wind
-25-
H*Wind’s adjustment of aircraft flight-level winds to the surface. Dunion and Powell and
Dunion et al. utilized the dropwindsonde data to revise the H*Wind algorithms in a two-step
process. First, analyses of the dropwindsondes show that the original H*Wind assumption that
700 mb flight-level winds were equivalent to mean boundary layer (0 to 500 m) winds produced
an underestimation of the true boundary layer winds. Second, the dropwindsondes showed that
the over-ocean surface to mean boundary layer wind ratio reached a minimum at mean boundary
layer wind speeds of 100 to 110 kt. This ratio was found to increase with stronger winds, in
contrast to an assumed steadily decreasing ratio with stronger boundary layer winds previously
utilized in H*Wind (Dunion et al. 2003, Powell et al. 2003). The combined effect of these two
new changes to H*Wind produces substantially higher (10-20%) analyzed maximum 1 min
surface winds for major hurricanes, particularly when based on reductions of aircraft
reconnaissance data from 700 mb. For major hurricanes, the new H*Wind methodology
provides surface wind analyses with marine exposure from extrapolated flight-level wind
observations that generally agree to within 5% of the Franklin et al. (2003) estimates.
Such agreement between the two methods may not be surprising, since they are both based
upon new formulations from the nearly identical sets of archived GPS dropwindsonde data. It is
worth noting, however, that both methodologies had limited data available in the extreme high
wind range typical of that found in Hurricane Andrew’s eyewall, though both schemes included
dropwindsondes from Hurricane Mitch when it was a SSHS Category 5 system. Another
consideration is that the dropwindsondes had a higher failure rate in providing winds near the
speed was not sampled during the typical “figure 4” tracks routinely flown through hurricanes by reconnaissance aircraft.
-26-
surface under extreme conditions. This limitation was partially overcome by filling in the profile
down to 10 m with mean conditions from hurricane eyewall dropwindsondes that did provide
wind data to the ocean’s surface, as long as the filled in dropwindsonde reported winds down to
no higher than 30 m (Dunion et al., 2003; Franklin et al., 2003). This technique to maximize
surface wind observations was likely conservative in its surface wind estimates because of the
observed tendency for the surface winds to increase relative to the boundary layer average winds
in higher wind regimes.
-27-
Box 3: Implications of Hurricane Andrew’s Re-analysis in south Florida
One example of a practical aspect of the outcome of Andrew's re-analysis is the potential
impact on building codes and insurance rates. Previously, Hurricane Andrew was estimated to be
a SSHS Category 4 hurricane at landfall in south Florida (comprising Pinellas, Hillsborough,
Manatee, Sarasota, Charlotte, Lee, Collier, Monroe, Miami-Dade, Broward, Palm Beach, Martin,
St. Lucie, Indian River and Brevard counties). During the 20th Century, there are relatively
complete records for this region (Landsea et al. 2004). Prior to Andrew’s reclassification, six
Category 4 and one Category 5 hurricanes struck southeastern Florida – the 1919 Key West
hurricane, the 1926 Great Miami hurricane, the 1928 Lake Okeechobee hurricane, the 1935 Labor
Day (Category 5) hurricane, the 1947 Broward hurricane, 1960’s Hurricane Donna in the Florida
Keys, and Andrew (updated from Jarrell et al. 1992). This gave an average return period for
“Andrew-like” hurricanes (i.e. Category 4 or 5) of about 15 years for the south Florida region,
though these occur rather unevenly in time during the 20th Century. However, with Andrew being
re-classified as a Category 5, it becomes one of two such tropical cyclones to strike the area in
100 years. Thus the return period is equal to or greater than 50 years for a direct strike on the
region by an Andrew-type hurricane, now upgraded to Category 5.
This conclusion may be somewhat counterintuitive at first, but is more understandable if
one puts Andrew into context with the other catastrophic south Florida hurricanes of the 20th
Century. Previously, with Andrew considered a Category 4 hurricane at landfall, it was
considered as strong as – and roughly as damaging as – the 1919, 1926, 1928, 1947, and 1960
hurricanes. But elevating Hurricane Andrew to a Category 5 means that it is unlikely that these

-28-
other five Category 4 hurricanes could cause the same type of extreme destruction that the 1992
hurricane caused, if these systems were to hit today’s southeast Florida. It is noted though that
the 1926, 1928 and 1947 hurricanes were substantially larger in size than 1992’s Andrew, so that
they might cause more widespread though locally less severe damages if they were to hit today.
(Moreover, it appears unlikely that any of these five remaining Category 4 hurricanes that struck
south Florida will be re-analyzed at a higher category based upon Dunion et al. [2003] and other
preliminary assessments.) Thus the new classification alters the assessed odds of an “Andrew-
like” hurricane impact from an uncommon occurrence to a rare event.
This rough assessment agrees with specific calculations from HURISK (Neumann 1987).
This program synthesizes information from the entire HURDAT database to provide detailed
statistics for more localized regions, including average return periods for various thresholds of
wind speeds of interest. For the original and revised assessed intensities of Andrew at landfall,
the return periods for various intensity hurricanes passing within 50 nmi (93 km) are quite
different: 36 years at > 125 kt (original Andrew best track intensity) and 82 years at > 145 kt
(revised Andrew best track intensity). However, the return periods for various wind speed
thresholds do not themselves change significantly near Miami-Dade County, Florida with the
alteration of one datapoint (i.e. Andrew’s estimated intensity), as one would expect from a large
database of over 100 years of tropical storms and hurricanes to impact this region.
For the public, government agencies, insurance companies, wind engineers, building code
designers and others interested in the return period of extremely devastating hurricanes, the
category assigned is quite important. The implication of the above calculations is that originally
-29-
an Andrew-like impact could be expected about every 35 years in Miami-Dade County (every 15
years for all of south Florida), while the reclassification means that an Andrew-like event is now
expected to strike Miami-Dade County about once in 80 years (every 50 years for all of south
Florida). Such information should be of use for those involved with long-range planning for the
region.
-30-
References:
Chandler, M., and J. Charles, 2002: Hurricane insurance stirring a fight. The Miami Herald,
Miami, Florida, 19 February 2002.
DeMaria, M., and J. Kaplan, 1999: An updated Statistical Hurricane Intensity Prediction Scheme
(SHIPS) for the Atlantic and eastern North Pacific basins. Wea. Forecast.,14, 326-337.
Dunion, J. P., C. W. Landsea, S. H. Houston, and M. D. Powell, 2003: A re-analysis of the
surface winds for Hurricane Donna of 1960. Mon. Wea. Rev., 131, 1992-2011.
Dunion, J. P. and M. D. Powell, 2002: Improvements to the NOAA Hurricane Research
Division’s surface reduction algorithm for inner core aircraft flight-level winds. Preprints of the
25th Conference on Hurricanes and Tropical Meteorology, American Meteorological Society, San
Diego, 581-582.
Franklin, J. L., L. A. Avila, J. L. Beven, M. B. Lawrence, R. J. Pasch, and S. R. Stewart, 2001:
Atlantic hurricane season of 2000. Mon. Wea. Rev., 129, 3037-3056.
Franklin, J. L., M. L. Black, and K. Valde, 2003: GPS dropwindsonde wind profiles in hurricanes
and their operational implications. Wea. Forecasting, 18, 32-44.
-31-
Hock, T. R, and J. L. Franklin, 1999: The NCAR GPS dropwindsonde. Bull. Amer. Meteor. Soc.,
80, 407-420.
Houston, S. H., P. P. Dodge, M. D. Powell, M. L. Black, G. M. Barnes, and P. S. Chu, 2000:
Surface winds in hurricanes from GPS-sondes: Comparisons with observations. Preprints of the
24th Conference on Hurricanes and Tropical Meteorology, American Meteorological Society, Ft.
Lauderdale, 339.
Jarrell, J. D., P. J. Hebert, and M. Mayfield, 1992: Hurricane experience levels of coastal county
populations from Texas to Maine. NOAA Tech. Memo. NWS NHC 46, Coral Gables, Florida, 152
pp.
Jarvinen, B. R., C. J. Neumann, and M. A. S. Davis, 1984: A tropical cyclone data tape for the
North Atlantic Basin, 1886-1983: Contents, limitations, and uses. NOAA Technical
Memorandum NWS NHC 22, Coral Gables, Florida, 21 pp.
Jeslesnianski, C. P., 1993: The habitation layer. Global Guide to Tropical Cyclone Forecasting,
WMO/TD – No. 560, World Meteorological Organization Technical Document, Geneva, 4.1-
4.29.
Landsea, C. W., 1993: A climatology of intense (or major) Atlantic hurricanes. Mon. Wea. Rev.,
121, 1703-1713.
-32-
Landsea, C. W., C. Anderson, N. Charles, G. Clark, J. Dunion, J. Partagas, P. Hungerford, C.
Neumann and M. Zimmer, 2004: The Atlantic hurricane database re-analysis project:
Documentation for the 1851-1910 alterations and additions to the HURDAT database.
Hurricanes and Typhoons: Past, Present and Future, R. J. Murnane and K.-B. Liu, Eds.,
Columbia University Press, in press.
Marks, F. D., R. A. Houze, Jr., and J. F. Gamache, 1992: Dual-aircraft investigation of the inner
core of Hurricane Norbert. Part I: Kinematic structure. J. Atmos. Sci., 49, 919-942.
Mayfield, M., L. Avila, and E. N. Rappaport, 1994: Atlantic hurricane season of 1992. Mon. Wea.
Rev., 122, 517-538.
McAdie C. J., and Lawrence M. B., 2000: Improvements in tropical cyclone track forecasting in
the Atlantic basin, 1970-98. Bull. Amer. Meteor. Soc., 81, 989-998.
Neumann, C. J., 1987: The National Hurricane Center Risk Analysis Program (HURISK).
NOAA Technical Memorandum NWS NHC 38, Coral Gables, Florida.
-33-
Neumann, C. J., 1994: An update to the National Hurricane Center “Track Book”. Minutes of the
48th Interdepartmental Conference, Miami, FL, Office of Federal Coordinator for Meteorological
Services and Supporting Research, NOAA, A-47 – A-53.
Partagas, J. F.-, and H. F. Diaz, 1996: Atlantic Hurricanes in the second half of the Nineteenth
Century. Bull. Amer. Meteor. Soc., 77, 2899-2906.
Powell, M. D., 1980: Evaluations of diagnostic marine boundary layer models applied to
hurricanes. Mon. Wea. Rev., 108, 757-766.
Powell, M. D., and P. G. Black, 1990: The relationship of hurricane reconnaissance flight-level
measurements to winds measured by NOAA’s oceanic platforms. J. Wind Eng. Ind. Aerodyn., 36,
381-392.
Powell, M. D., P. P. Dodge, and M. L. Black, 1991: The landfall of Hurricane Hugo in the
Carolinas: Surface wind distribution. Wea. Forecasting., 6, 379–399.
Powell, M. D., and S. H. Houston, 1996: Hurricane Andrew's landfall in South Florida. Part II:
Surface wind fields and potential real-time applications. Wea. Forecasting, 11, 329-349.
Powell, M. D., S. H. Houston, L. R. Amat, and N. Morisseau-Leroy, 1998: The HRD real-time
surface wind analysis system. J. of Wind Engng. and Indust. Aero., 77 & 78, 53-64.
-34-
Powell, M. D., S. H. Houston, and T. A. Reinhold, 1996: Hurricane Andrew's landfall in South
Florida. Part I: Standardizing measurements for documentation of surface wind fields. Wea.
Forecasting, 11, 304 - 328.
Powell, M. D., P. J. Vickery, and T. A. Reinhold, 2003: Reduced drag coefficient for high wind
speeds in tropical cyclones. Nature, 422, 279-283.
Rappaport, E. N., 1994: Hurricane Andrew. Weather, 49, 51-61.
Saffir, H. S., 1973: Hurricane wind and storm surge. The Military Engineer, 423, 4-5.
Simpson, R. H, 1974: The hurricane disaster potential scale. Weatherwise, 27, 169 & 186.
Tuttle, J. and R. Gall, 1999: A single-radar technique for estimating the winds in tropical
cyclones. Bull. Amer. Meteor. Soc., 80, 653-668.
Uhlhorn, E. W., and P. G. Black, 2003: Verification of remotely sensed sea surface winds in
hurricanes. J. Atmos. Ocean. Tech., 20, 99-116.

-35-
Walsh, E. J., C. W. Wright, D. Vandemark, W. B. Krabill, A. W. Garcia, S. H. Houston, S. T.
Murillo, M. D. Powell, P. G. Black, and F. D. Marks, Jr., 2002: Hurricane directional wave
spectrum spatial variation at landfall. J. Phys. Ocean., 32, 1667-1684.
-36-
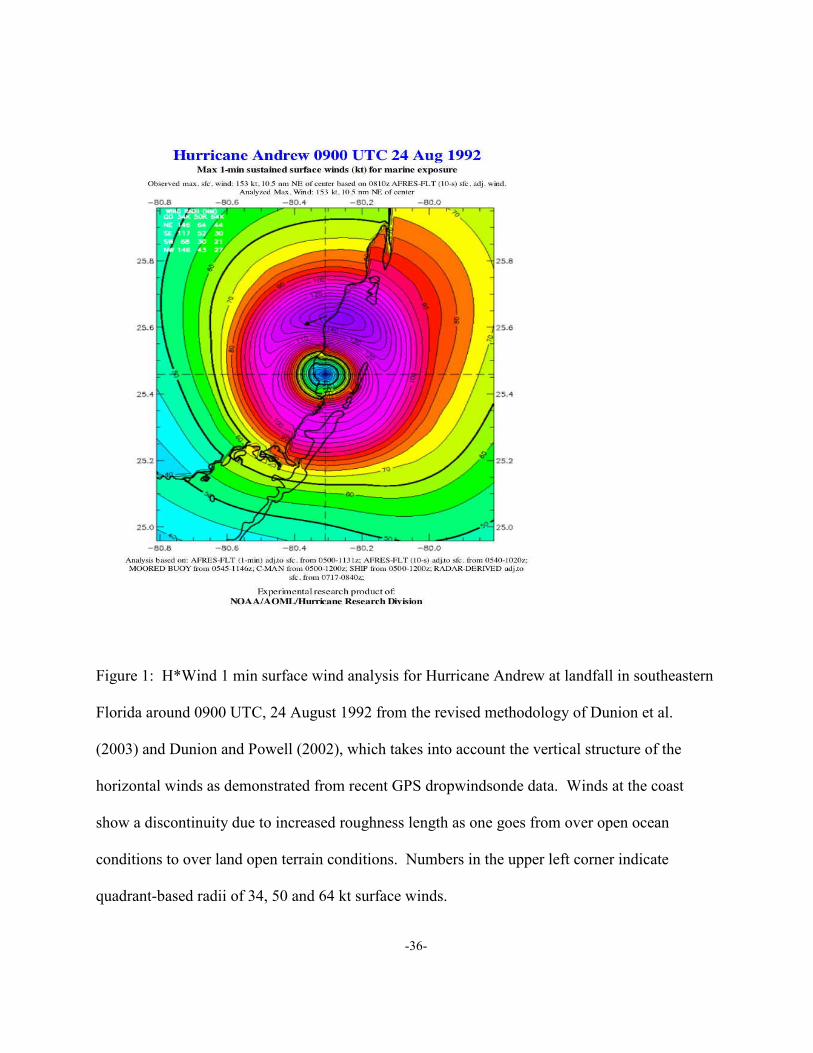
Figure 1: H*Wind 1 min surface wind analysis for Hurricane Andrew at landfall in southeastern
Florida around 0900 UTC, 24 August 1992 from the revised methodology of Dunion et al.
(2003) and Dunion and Powell (2002), which takes into account the vertical structure of the
horizontal winds as demonstrated from recent GPS dropwindsonde data. Winds at the coast
show a discontinuity due to increased roughness length as one goes from over open ocean
conditions to over land open terrain conditions. Numbers in the upper left corner indicate
quadrant-based radii of 34, 50 and 64 kt surface winds.
-37-
Figure 2: Hurricane Andrew low-altitude radar feature tracks (in kt) from the Miami WSR-57
radar before the radar was destroyed by the hurricane.
-38-
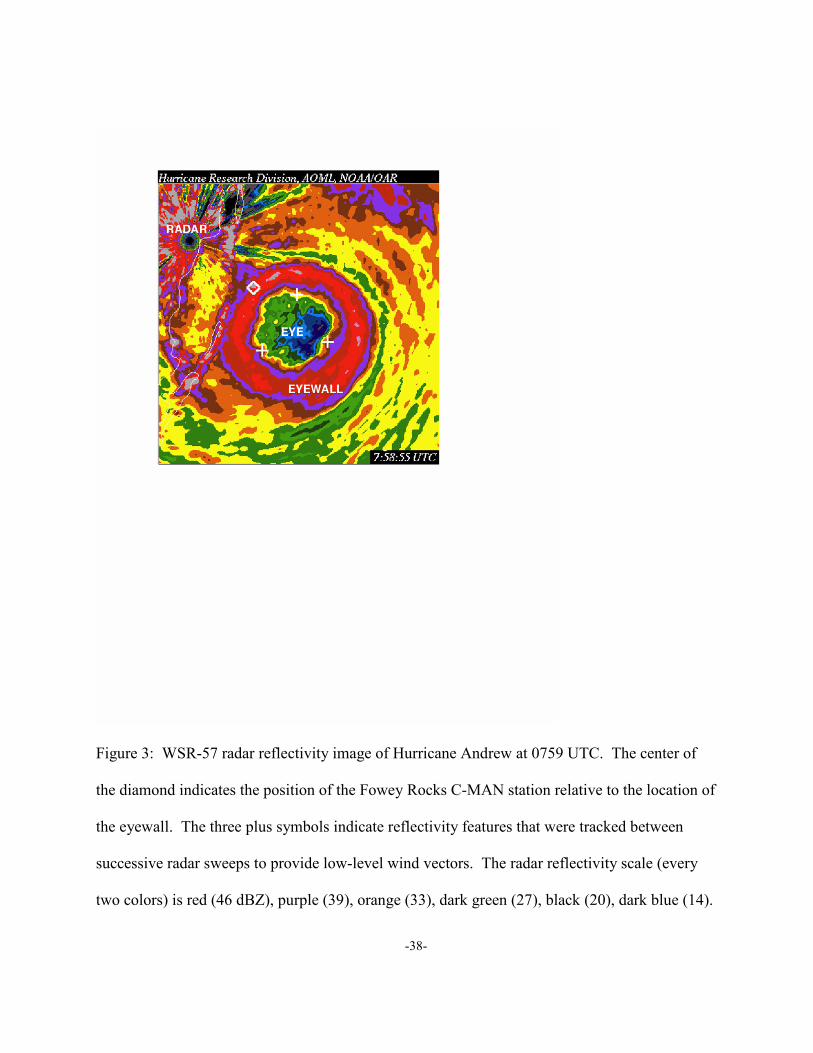
Figure 3: WSR-57 radar reflectivity image of Hurricane Andrew at 0759 UTC. The center of
the diamond indicates the position of the Fowey Rocks C-MAN station relative to the location of
the eyewall. The three plus symbols indicate reflectivity features that were tracked between
successive radar sweeps to provide low-level wind vectors. The radar reflectivity scale (every
two colors) is red (46 dBZ), purple (39), orange (33), dark green (27), black (20), dark blue (14).
-39-
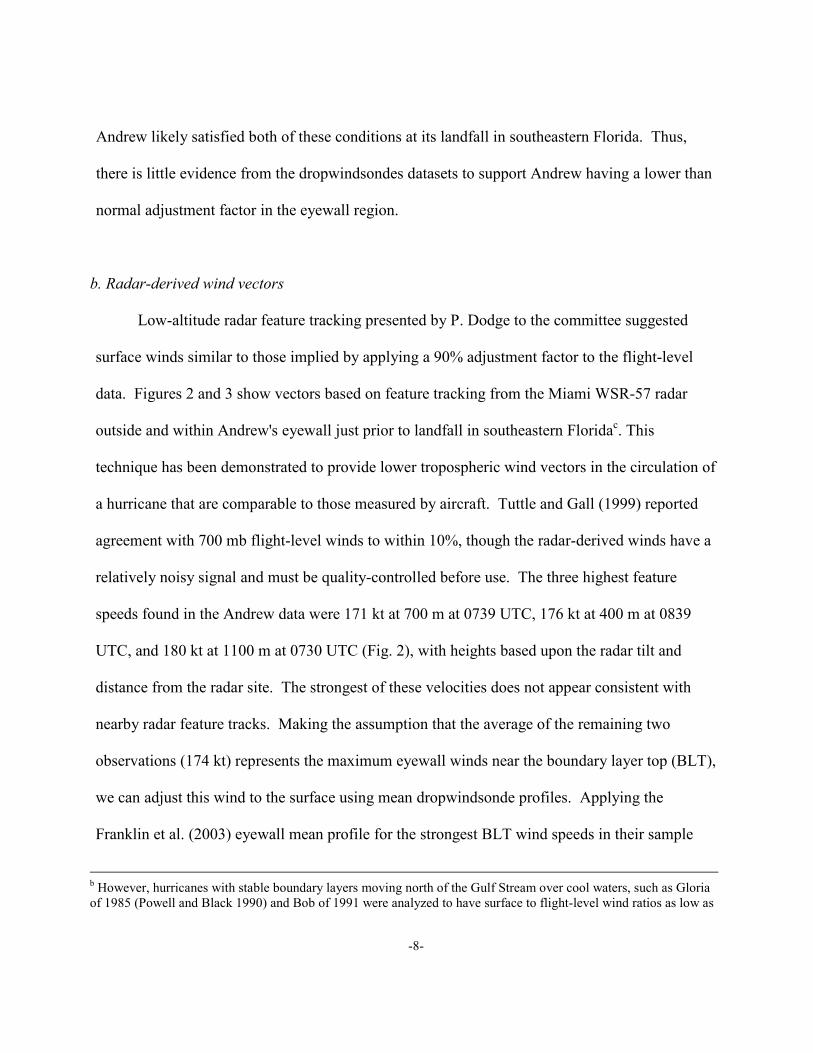
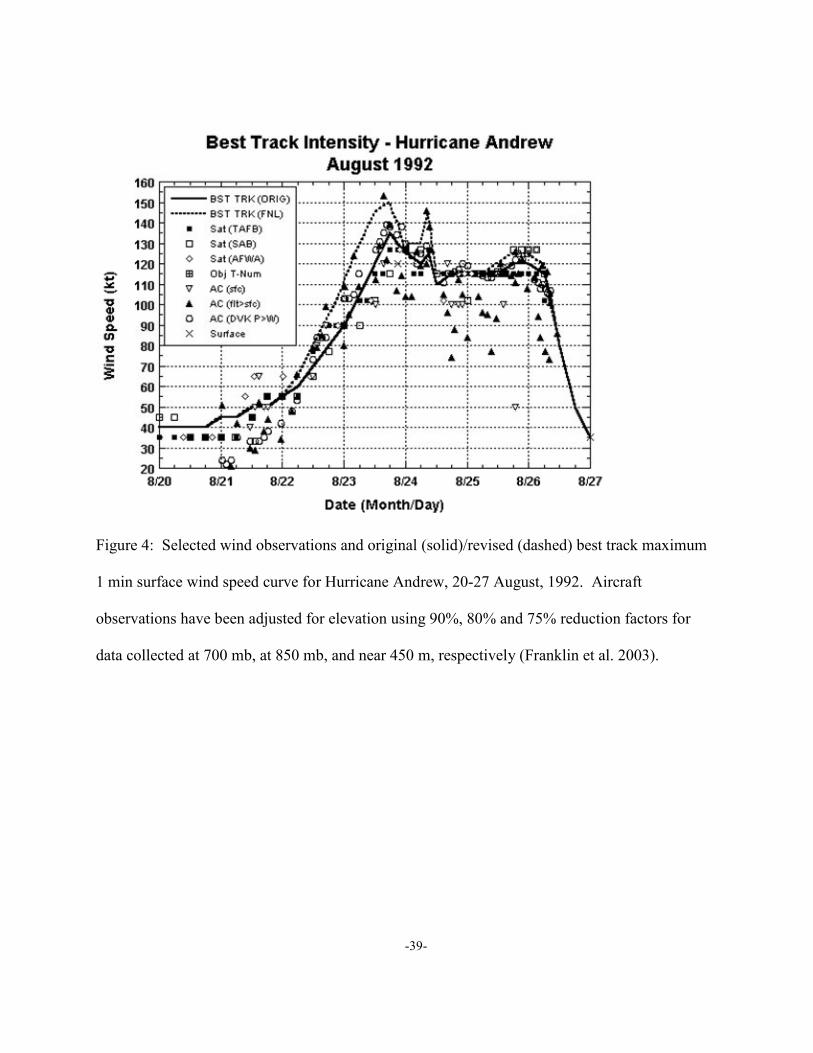
Figure 4: Selected wind observations and original (solid)/revised (dashed) best track maximum
1 min surface wind speed curve for Hurricane Andrew, 20-27 August, 1992. Aircraft
observations have been adjusted for elevation using 90%, 80% and 75% reduction factors for
data collected at 700 mb, at 850 mb, and near 450 m, respectively (Franklin et al. 2003).
-40-
Figure 5: A portion of the track for Hurricane Andrew with an emphasis on where changes were
made to its intensity.
-41-
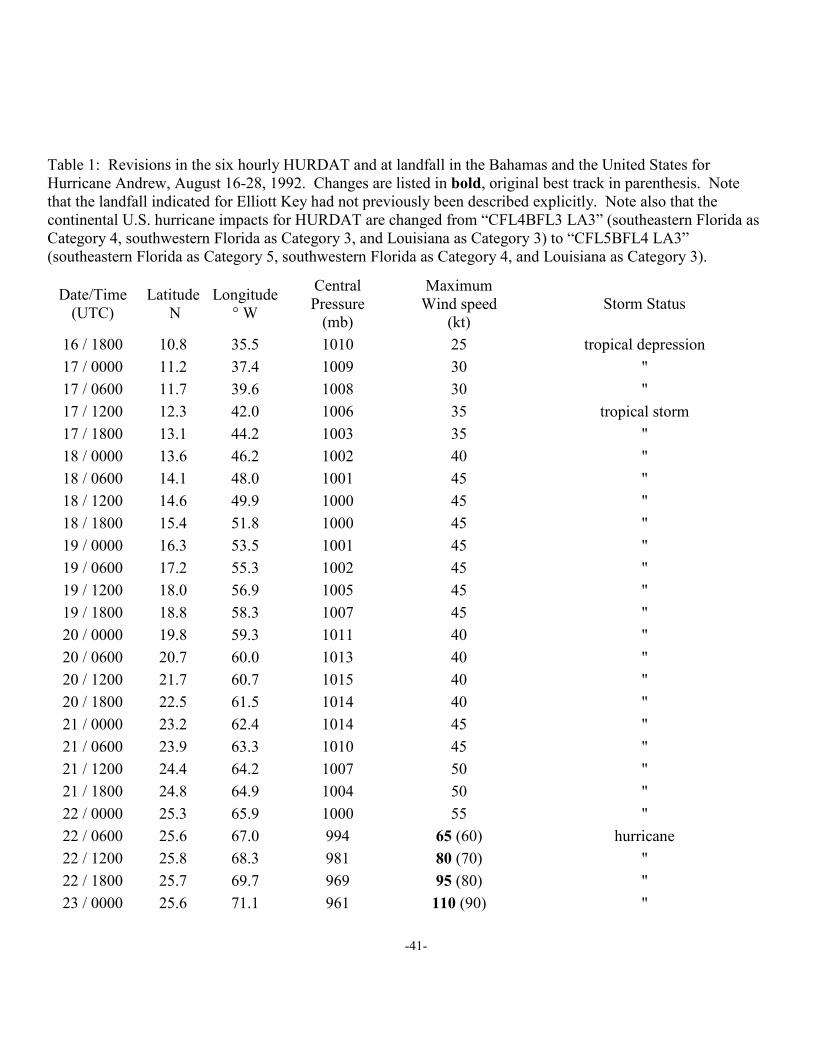
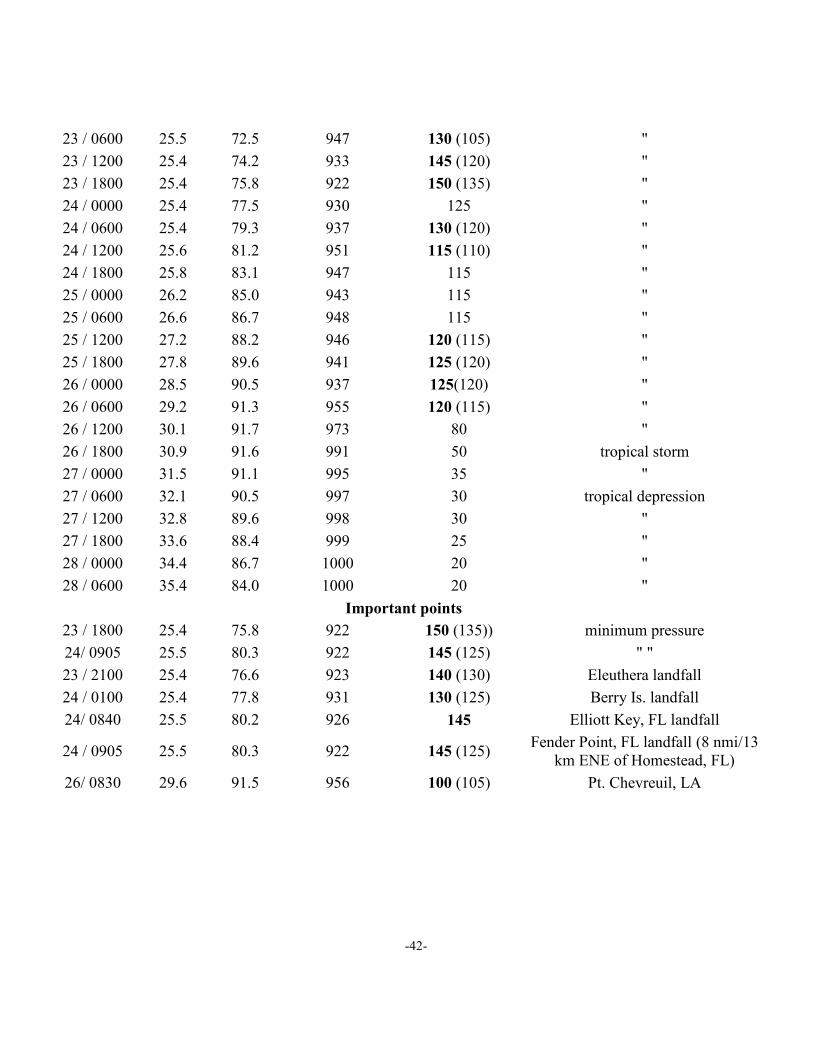
Table 1: Revisions in the six hourly HURDAT and at landfall in the Bahamas and the United States for Hurricane Andrew, August 16-28, 1992. Changes are listed in bold, original best track in parenthesis. Note that the landfall indicated for Elliott Key had not previously been described explicitly. Note also that the continental U.S. hurricane impacts for HURDAT are changed from “CFL4BFL3 LA3” (southeastern Florida as Category 4, southwestern Florida as Category 3, and Louisiana as Category 3) to “CFL5BFL4 LA3” (southeastern Florida as Category 5, southwestern Florida as Category 4, and Louisiana as Category 3).
Date/Time (UTC)
Latitude N
Longitude ° W
Central Pressure (mb)
Maximum Wind speed
(kt) Storm Status
16 / 1800 10.8 35.5 1010 25 tropical depression
17 / 0000 11.2 37.4 1009 30 "
17 / 0600 11.7 39.6 1008 30 "
17 / 1200 12.3 42.0 1006 35 tropical storm
17 / 1800 13.1 44.2 1003 35 "
18 / 0000 13.6 46.2 1002 40 "
18 / 0600 14.1 48.0 1001 45 "
18 / 1200 14.6 49.9 1000 45 "
18 / 1800 15.4 51.8 1000 45 "
19 / 0000 16.3 53.5 1001 45 "
19 / 0600 17.2 55.3 1002 45 "
19 / 1200 18.0 56.9 1005 45 "
19 / 1800 18.8 58.3 1007 45 "
20 / 0000 19.8 59.3 1011 40 "
20 / 0600 20.7 60.0 1013 40 "
20 / 1200 21.7 60.7 1015 40 "
20 / 1800 22.5 61.5 1014 40 "
21 / 0000 23.2 62.4 1014 45 "
21 / 0600 23.9 63.3 1010 45 "
21 / 1200 24.4 64.2 1007 50 "
21 / 1800 24.8 64.9 1004 50 "
22 / 0000 25.3 65.9 1000 55 "
22 / 0600 25.6 67.0 994 65 (60) hurricane
22 / 1200 25.8 68.3 981 80 (70) "
22 / 1800 25.7 69.7 969 95 (80) "
23 / 0000 25.6 71.1 961 110 (90) "
-42-
23 / 0600 25.5 72.5 947 130 (105) "
23 / 1200 25.4 74.2 933 145 (120) "
23 / 1800 25.4 75.8 922 150 (135) "
24 / 0000 25.4 77.5 930 125 "
24 / 0600 25.4 79.3 937 130 (120) "
24 / 1200 25.6 81.2 951 115 (110) "
24 / 1800 25.8 83.1 947 115 "
25 / 0000 26.2 85.0 943 115 "
25 / 0600 26.6 86.7 948 115 "
25 / 1200 27.2 88.2 946 120 (115) "
25 / 1800 27.8 89.6 941 125 (120) "
26 / 0000 28.5 90.5 937 125(120) "
26 / 0600 29.2 91.3 955 120 (115) "
26 / 1200 30.1 91.7 973 80 "
26 / 1800 30.9 91.6 991 50 tropical storm
27 / 0000 31.5 91.1 995 35 "
27 / 0600 32.1 90.5 997 30 tropical depression
27 / 1200 32.8 89.6 998 30 "
27 / 1800 33.6 88.4 999 25 "
28 / 0000 34.4 86.7 1000 20 "
28 / 0600 35.4 84.0 1000 20 "
Important points
23 / 1800 25.4 75.8 922 150 (135)) minimum pressure
24/ 0905 25.5 80.3 922 145 (125) " "
23 / 2100 25.4 76.6 923 140 (130) Eleuthera landfall
24 / 0100 25.4 77.8 931 130 (125) Berry Is. landfall
24/ 0840 25.5 80.2 926 145 Elliott Key, FL landfall
24 / 0905 25.5 80.3 922 145 (125) Fender Point, FL landfall (8 nmi/13
km ENE of Homestead, FL)
26/ 0830 29.6 91.5 956 100 (105) Pt. Chevreuil, LA