nocoug 201311 ten outrageous performance tips outline sql1 on {sql with hint} create outline sql2 on...
TRANSCRIPT

Ten Outrageous Performance Tips
Chris Lawson

Ten Outrageous Performance Tips
Chris Lawson
10 1/2

A Lesson from a junior programmer
Keep Your Eyes Open!
Outrageous!
• “Outrageous” means effective, not complicated. • Ever surprised by simplicity of a technique? • Great techniques are often simple • So, what other techniques have I missed?

Keep Your Eyes Peeled!
• No Marketing—no fluff. • Ten actual performance tuning discoveries. • Some of the ideas discussed here may be
old-hat to many readers—but maybe not!

Housekeeping Notes• All code listings in this paper are changed. • I took liberty with formatting. • Different (and simpler) names used.
Don’t stress over scripts

TIP 1: EASY SQL HINTS USING STORED OUTLINES
• Baffling! • Why do DBAs avoid hints + outlines ? • Despite threats, are reportedly still in Oracle 12. !
So, let’s check ‘em out.

A stored outline preserves an execution plan: !1. You turn-on outline capture. 2. You run the sql. 3. Oracle captures sql and exec plan. 4. Oracle stores sql hints. 5. If sql is run again, Oracle use those sql hints.
What is a Stored Outline?

Instead of preserving, we change plans.
But Wait That’s Not All!

• Create two outlines: ▫ One the “regular” sql. ▫ Another using a sql hint. !
• We now have 2 stored outlines: Sql 1: No hint >> Outline 1 (bad plan) Sql 2: hint >> Outline 2 (good plan) !• Now, reverse hints! • Oracle will apply hints from Sql 2 when it sees Sql 1.
For a Different Execution Plan

Create outline sql1 on {sql with hint} Create outline sql2 on {regular sql}
!Update outln.ol$hints set ol_name = decode(ol_name, ‘sql1’, ‘sql2’, ‘sql2’, ‘sql1’) where ol_name in (‘sql1’, ‘sql2’);
Here’s the Switch

Create outline sqlz for category tune on Merge into tab1_gt gt using ( Select /*+index(a) */ … Create outline sqlz_fix for category tune on Merge into tab1_gt gt using ( Select … !Update outln.Ol$hints set ol_name = decode(ol_name, ‘sqlz_fix’, ‘sqlz’, ‘sqlz’, ‘sqlz_fix’) where ol_name in (‘sqlz’, ‘sqlz_fix’);
Outline Example
• Get the precise sql. • Extra blanks OK. • I use sql at end of AWR/Sql report
Some Traps!

Pitfall 1: AWR Spaces
What if the extra blanks occur as part of the functionality of the sql?
AWR report removes extra whitespace
Yea, yea, so what?

• My code had a clause like this: orig: where col1 like '% abc %' altered: where col1 like '%abc%‘ !• Missing the blanks means the outline won’t work! • I had to alter outline script to add back extra blanks.
Don’t Change
My Code!

• Hints stored in outline are not simple hints. • Outlines typically have many more hints. • More complicated syntax—”extended” format. • This ensures that the plan is consistent.
Pitfall 2: Hint Count
Who cares about number of hints?

When Outline Created, Oracle Saves Number Of Hints
• If you import an outline, a secret process will recount hints, and compare to stored value.
• If the actual doesn't match Hintcount, a bad thing happens—Oracle drops the outline!
• My sad tale.

• When you do the "hint switch“ you will likely end up with a different number of hints.
• You might have started with 10 hints, but after switch, you might have 12 hints.
• So good idea to verify Hintcount. !
Let’s see an easy way to check the actual number of hints per outline.
Hint Count

Update Hintcount
Select ol_name, count(*) from Outln.ol$hints
Group by ol_name; Select ol_name, Hintcount from Outln.ol$

Questions on Outlines?

Tip 2: Easy Sql Profiles
• Don’t work all the time, but--a very useful tactic. • Very easy (when they work) • We have > 100 stored outlines, and one sql profile. • I was “forced” to investigate profiles for query that
would not work properly with a stored outline.

Tell me More!
• A sql profile is not actually an execution plan. • It’s a set of sql hints, stored in the data dictionary,
ready for next time sql is run. • This is similar to stored outlines, but the sql hints
are of a different kind. How different?

How do Sql Profiles Work?
• They use large amounts of cpu time checking different plans, and gleaning better statistics. !
• They spend more time to glean more information !
They use same optimizer that produced poor execution plan in the first place!

Hints, Hints Everywhere
• Outline uses sql hints to preserve execution plan • Like “full” or “index.” • Sql profile hints give optimizer extra
information that it normally would not have. !
Outline tends to lock-in a plan, profile makes optimizer smarter.

What do I do?
• Step 1: Create the Tuning Task • Step 2: Run The Tuning Task • Step 3: Get Recommendations • Step 4: Apply The Profile • Step 5: Confirm Profile is Enabled

Step 1
Create the Tuning Task
• Call Dbms_Sqltune.Create_Tuning_Task
• Provide a specific sql_id
• Give time-limit
Step 2: Run Tuning Task
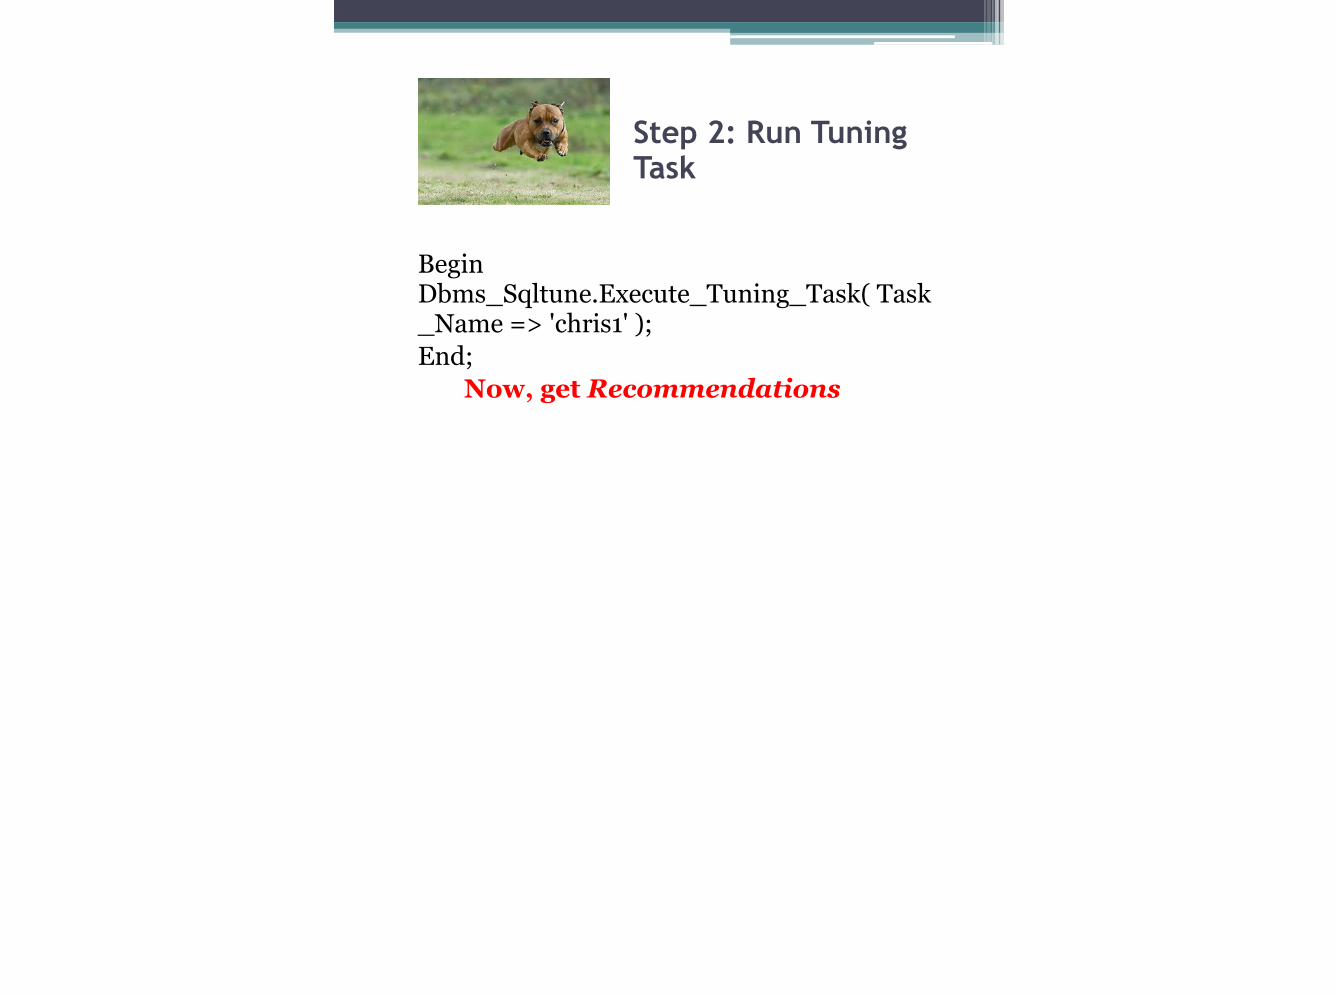
Begin Dbms_Sqltune.Execute_Tuning_Task( Task_Name => 'chris1' ); End; Now, get Recommendations

Step 3 Recommendations
Set Long 9999 Set Longchunksize 1000 Set Linesize 100 Select Dbms_Sqltune.Report_Tuning_Task( 'chris1') From Dual; !
This long report will include a summary of recommendations

Step 3 Look for this:SQL Profile Finding (see explain plans section below) !A potentially better execution plan was found for this statement. ! Recommendation (estimated benefit: 67.35%) ------------------------------------------ - Consider accepting the recommended SQL profile.

Step 4 Apply Profile
Execute dbms_sqltune.accept_sql_profile (task_name => 'chris1', replace => TRUE);
Step 5: Confirm Enabled
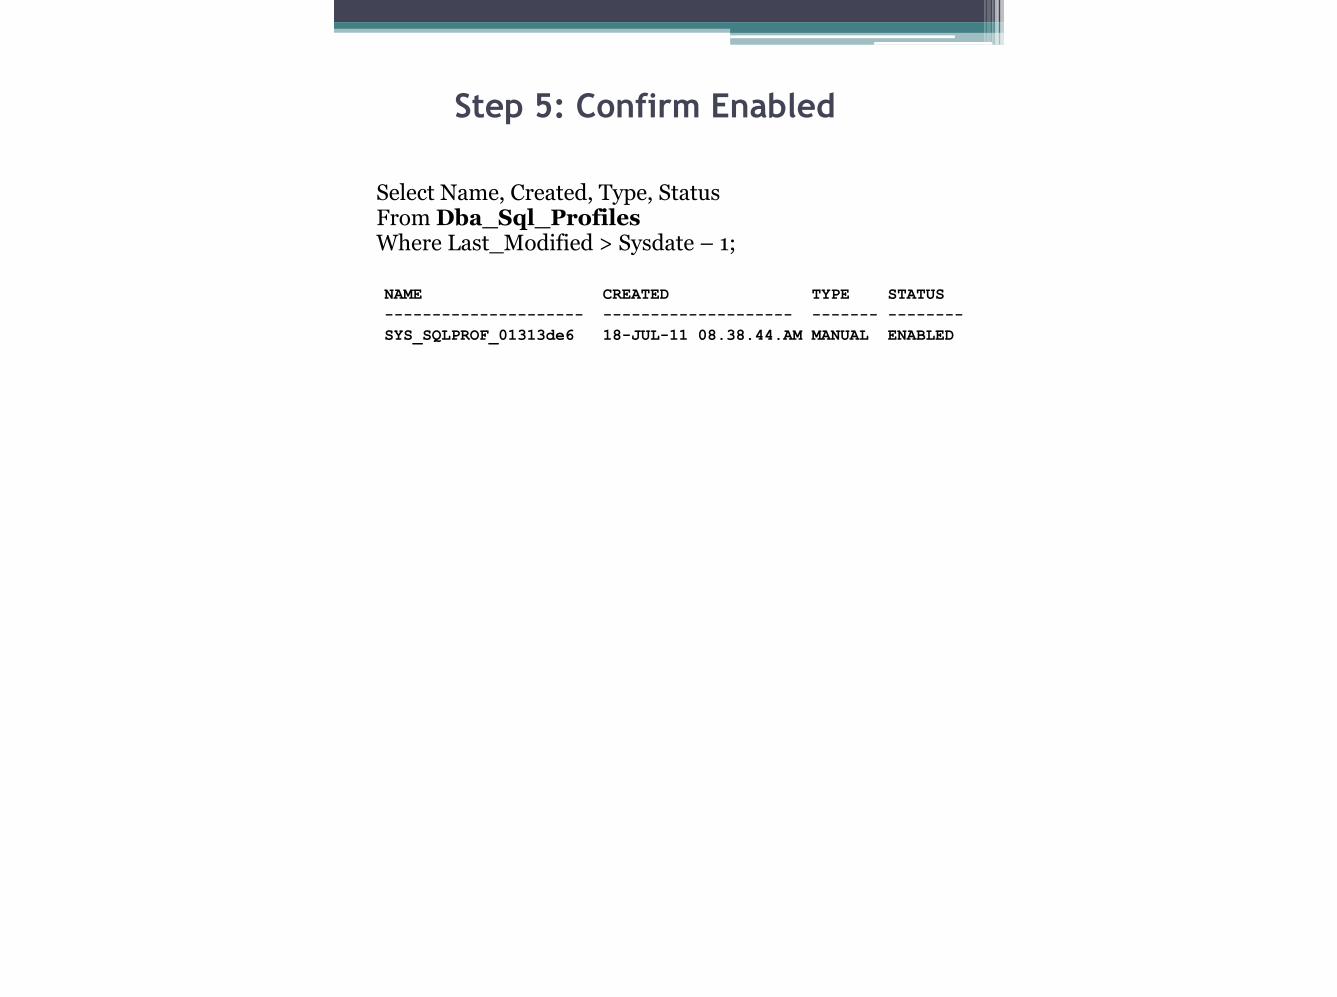
!Select Name, Created, Type, Status From Dba_Sql_Profiles Where Last_Modified > Sysdate – 1; NAME CREATED TYPE STATUS --------------------- -------------------- ------- -------- SYS_SQLPROF_01313de6 18-JUL-11 08.38.44.AM MANUAL ENABLED

Behind the Scenes
• What is Oracle doing with a sql profile? • What kinds of sql hints are being applied? • You can see the hints by joining
Sys.Sqlobj$Data Od, Sys.Sqlobj$ !
What do the hints look like?

Sql Profiles !
Actual Hints !OPT_ESTIMATE(@"SEL$AF73C875", TABLE, "S"@"SEL$4", SCALE_ROWS=3024) !OPT_ESTIMATE(@"SEL$26", TABLE, "X$KSQEQ"@"SEL$26",SCALE_ROWS=8208.205) !OPT_ESTIMATE(@"SEL$34", TABLE, "X$KTCXB"@"SEL$34",SCALE_ROWS=162.5641)
!•Opt_Estimate hint supplies cardinality information. •Scale_Rows parameter scales the estimate of the rows
!

Sql Profiles: A Big “Plus”
Profile can handle changing literals (unlike stored outline)
Use Force_Match, like this: dbms_sqltune.accept_sql_profile(task_name => 'chris1', -
replace => TRUE, force_match => TRUE);

Sql Profiles “Minus”
!
• Syntax awkward if you need to supply sql. • For instance, if database has recently started. • Especially awkward if sql has quotation marks. • Stored outline is trivial to create for specific sql.

Questions on Profiles?

I Only Have 10 Min Attention Span
SO these headlines…

DBA’s No Longer Needed?
• Oracle’s 10g Tuning Guide: “Automatic SQL Tuning … automates entire SQL tuning process” • 11g Tuning Guide, more modest:
“Automatic SQL tuning automates the manual process, which is complex, repetitive, and time-consuming.”

Wisdom from Greatest Philosophers on
Performance Tuning
Newly Discovered:

“Gain competence in art of tuning, rather than proficiency in a tool.”
Socrates, 450 B.C., Greece

“Always know which table should be the driving table.”
Plato, 400 B.C., Rome

“I think a lot about nested-loops joins versus hash-joins.”
Albert Einstein, 1942, Princeton University

“Stored Outlines are our friends!”
Mr. Rogers, 1980, Studio B, Hollywood

“Take care of the Oracle optimizer, and it will take care of you.”
Dr. Phil, 2013, Oprah Show, Hollywood

And Now,
Back to the Program

TIP 3: ADD SQL HINTS TO SQL PROFILE
• Like we did for stored outlines so no code change. • Just a little more difficult than with outline. !
Here’s our scheme

Here’s How I Add Hints to Profile
• Find the sql of interest in shared pool • Run sql with added hint. • Find the hinted-sql in the shared pool • Create profile having original sql text with
hints from modified sql.
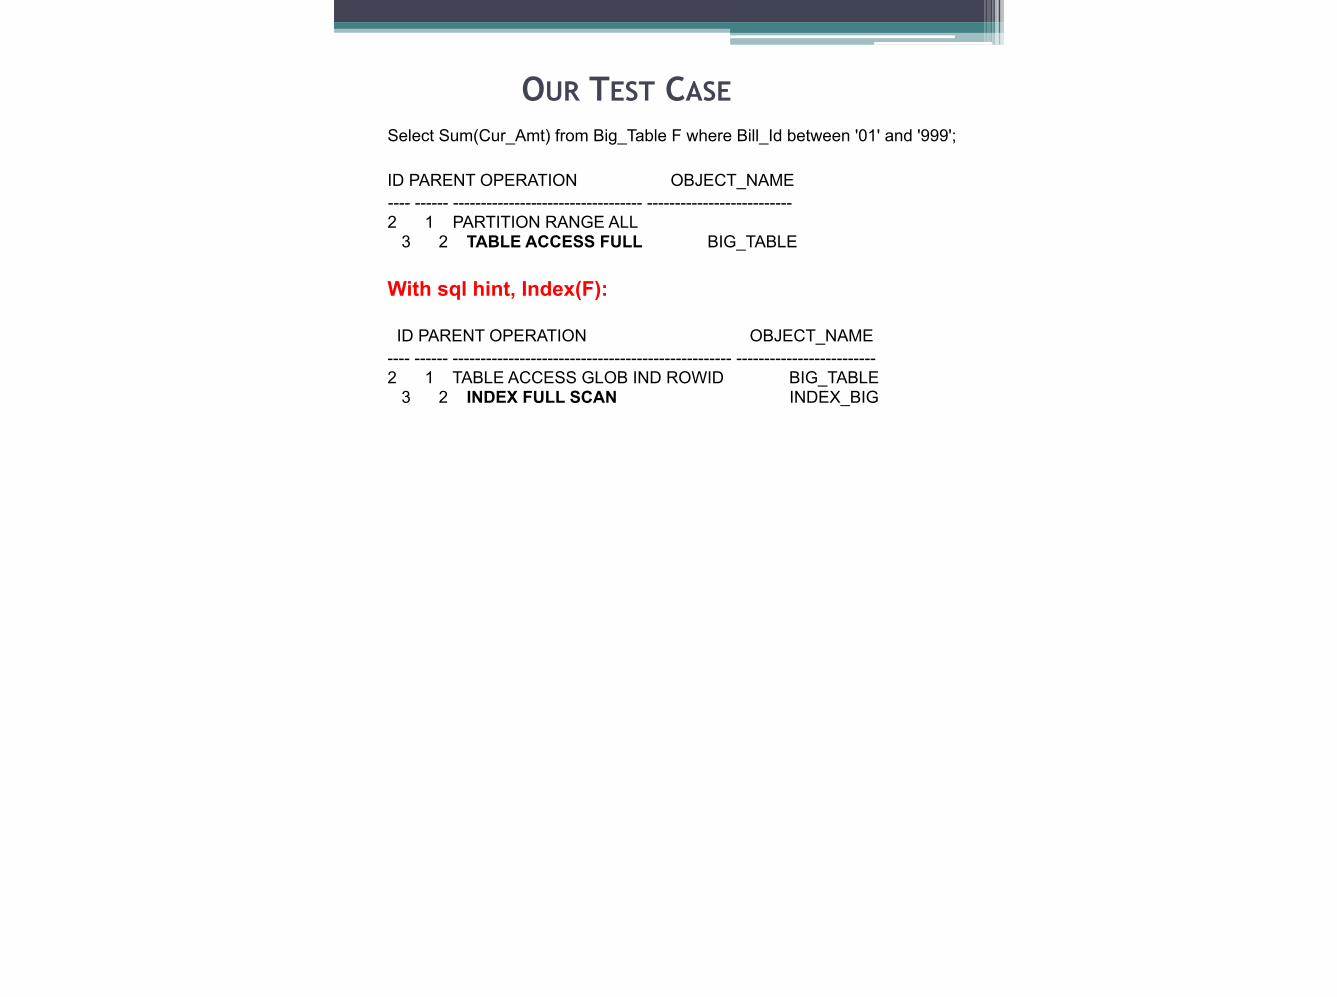
OUR TEST CASESelect Sum(Cur_Amt) from Big_Table F where Bill_Id between '01' and '999'; !ID PARENT OPERATION OBJECT_NAME ---- ------ ---------------------------------- -------------------------- 2 1 PARTITION RANGE ALL 3 2 TABLE ACCESS FULL BIG_TABLE With sql hint, Index(F): ID PARENT OPERATION OBJECT_NAME ---- ------ -------------------------------------------------- ------------------------- 2 1 TABLE ACCESS GLOB IND ROWID BIG_TABLE 3 2 INDEX FULL SCAN INDEX_BIG

First, Find Sql in Shared Pool
Get Sql_Id, Child_Number for original sql: !Select sql_id, child_number, sql_text from v$sql Where upper(sql_text) like 'SELECT%SUM(CUR_AMT)%FROM%BIG_TABLE%BETWEEN%' Sql_Id: braqrgb7ap00j Child_Number: 0

Now Run Hinted Sql
Select /*+Index(F) */ Sum(Cur_Amt) from Big_Table F where Bill_Id between '01' and '999'; !Step 3: Now find new sql in Shared Pool Query V$Sql just like before, but find the new sql: Sql_Id: 9f2kfv3521q79 Child_Number: 0

Sounds Like Outline Trick!
Using Pl/Sql do this: !• Get good hints from hinted sql • Get original sql text • Create profile using new hints & original text

1: GET “GOOD” HINTS
begin select extractvalue(value(d), '/hint') as outline_hints bulk collect into good_hints from xmltable('/*/outline_data/hint' passing (select xmltype(other_xml) as xmlval from v$sql_plan where sql_id = '9f2kfv3521q79' and child_number = 0 and other_xml is not null)) d;

REFERENCE: XML
!!!xmltable('/*/outline_data/hint‘ !passing (select xmltype(other_xml) as xmlval
PARSES XML WHICH PART OF XML
SOURCE OF THE XML
XML TYPE ‘CONSTRUCTOR’
COLUMN NAME

2: GET ORIGINAL SQL TEXTselect sql_fulltext into orig_text from v$sql where sql_id = 'braqrgb7ap00j' and child_number = 0;

3: CREATE PROFILE NEW HINTS
+ ORIG TEXT
dbms_sqltune.import_sql_profile( sql_text => orig_text, profile => good_hints, name => 'SQLPROFILETEST'); end;

SQL*PLUS AUTOTRACE SHOWS PROFILE USED
-------------------------------------------------------------------------------------------------------------------
| Id | Operation | Name | Rows | Bytes | Cost (%CPU)| Time | Pstart| Pstop |
-------------------------------------------------------------------------------------------------------------------
| 0 | SELECT STATEMENT | | 1 | 18 | 18507 (1)| 00:03:43 | | |
| 1 | SORT AGGREGATE | | 1 | 18 | | | | |
|* 2 | TABLE ACCESS BY GLOBAL INDEX ROWID| BIG_TABLE | 599K| 10M| 18507 (1)| 00:03:43 | ROWID | ROWID |
| 3 | INDEX FULL SCAN | INDEX_BIG | 606K| | 2386 (1)| 00:00:29 | | |
-------------------------------------------------------------------------------------------------------------------
Note -----
- SQL profile "SQLPROFILETEST" used for this statement
ANOTHER WAY TO SPOT
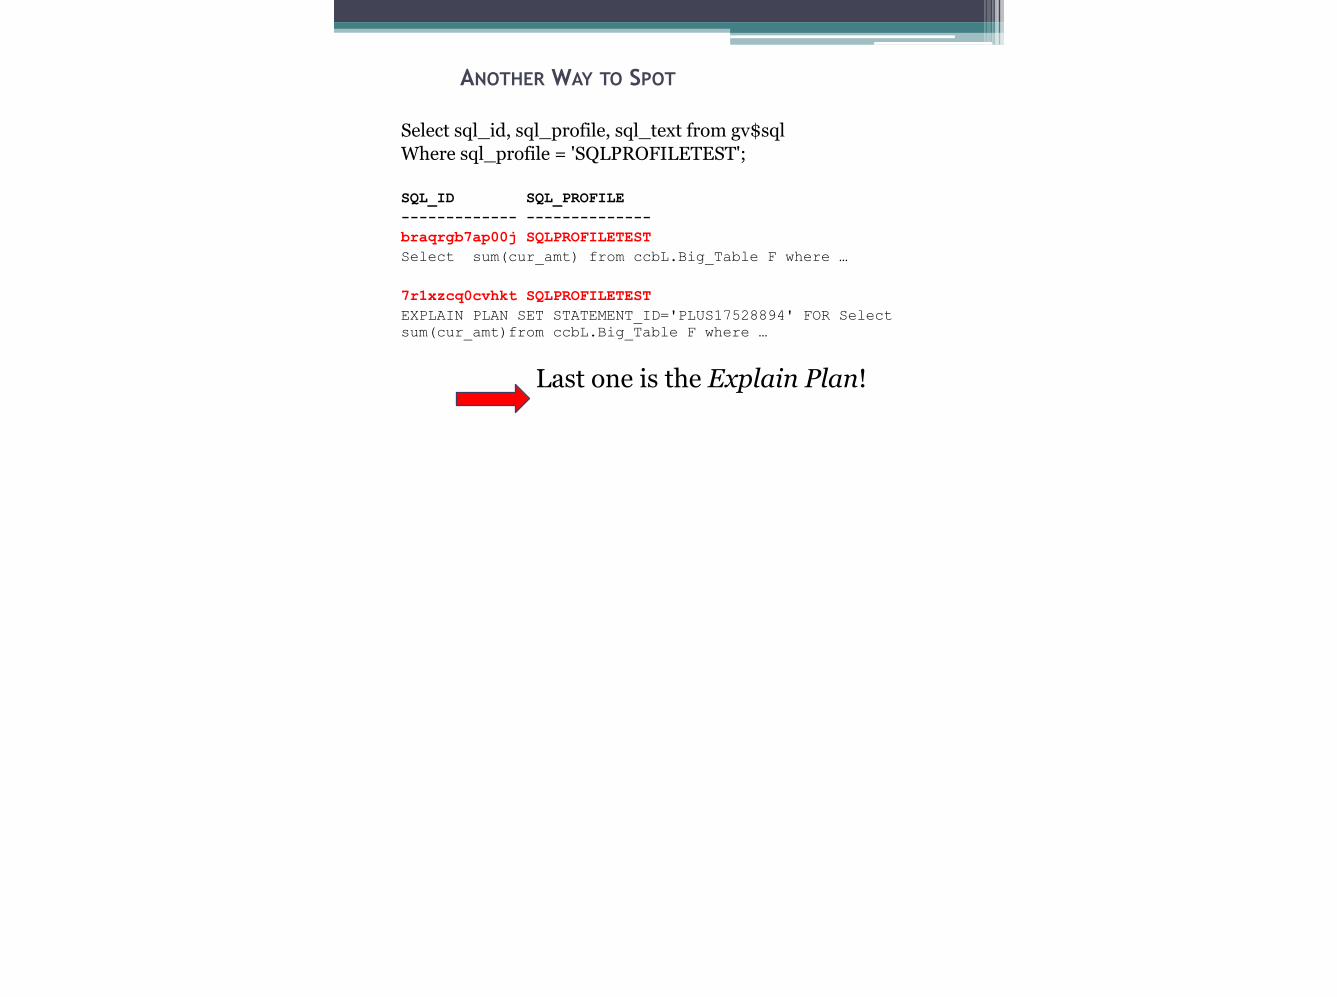
Select sql_id, sql_profile, sql_text from gv$sql Where sql_profile = 'SQLPROFILETEST'; !SQL_ID SQL_PROFILE ------------- -------------- braqrgb7ap00j SQLPROFILETEST Select sum(cur_amt) from ccbL.Big_Table F where … 7r1xzcq0cvhkt SQLPROFILETEST EXPLAIN PLAN SET STATEMENT_ID='PLUS17528894' FOR Select sum(cur_amt)from ccbL.Big_Table F where …
Last one is the Explain Plan!

What’s in the New Profile?
Select extractvalue(value(d), '/hint') as the_hints from xmltable('/*/outline_data/hint' passing (select xmltype(other_xml) as xmlval from v$sql_plan where sql_id = 'braqrgb7ap00j' and child_number = 0 And other_xml is not null)) d;
THE_HINTS IGNORE_OPTIM_EMBEDDED_HINTS OPTIMIZER_FEATURES_ENABLE('11.2.0.2') DB_VERSION('11.2.0.2') ALL_ROWS OUTLINE_LEAF(@"SEL$1") INDEX(@"SEL$1" "F"@"SEL$1" ("BIG_TABLE"."MATCH_EVT_ID"))
ISSUE: This Method Requires we Run the
Sql
• We grabbed hints/text from shared pool. • So must have actually have run the sql. • We can also get these from a "Dba_Hist" table.
Running sql a problem?

CAN’T I JUST RUN THE SQL?
• May not be possible to run sql in Sql*Plus when it originates from a Java application.
• Bind variables may be called, ":1" or ":2.” • So, you will have to run a modified sql, using
bonafide bind variables, and get those hints. • The point is, it's an annoyance.

AN ALTERNATIVE
• We normally get the hints from the shared pool • But you could manually form the hints. • Tricky, given the number and tricky format of
extended hints. • However, other DBAs have demonstrated this.

OUTLINES TRUMP PROFILES
• Couldn't get a profile to work, no matter what.
• I finally gave up, and tried outline, but got error, "Outline Already Exists.“
• What?? I forgot that I had earlier created an outline for the same sql.
• My profile was"trumped" by the outline.

OTHER INFO ON OUTLINES & PROFILES
• Ten Surprising Performance Tactics available on OracleMagician.com
• Special credit to the great research by Kerry Osborne and Randolf Geist.

FOR REFERENCE--GET GOOD HINTS FROM HINTED SQL declare good_hints sys.sqlprof_attr; orig_text clob; l_profile_name varchar2(30); begin select extractvalue(value(d), '/hint') as outline_hints bulk collect into good_hints from xmltable('/*/outline_data/hint' passing (select xmltype(other_xml) as xmlval from v$sql_plan where sql_id = '9f2kfv3521q79' and child_number = 0 --HINTED SQL and other_xml is not null)) d; --GET ORIGINAL SQL TEXT select sql_fulltext into orig_text from v$sql where sql_id = 'braqrgb7ap00j' and child_number = 0; --orig sql --CREATE PROFILE USING NEW HINTS WITH ORIGINAL TEXT dbms_sqltune.import_sql_profile( sql_text => orig_text, profile => good_hints, name => 'SQLPROFILETEST'); end; /

Questions on Sql Profiles?

TIP 4: WHAT'S ALL THAT UNDO?
• On large system, we create gigantic index. • But, we ran out of undo space, and job failed. • Did our job really need 1/2 TB of undo? • How can we find undo usage? ! We can use Dba_Hist_Undostat
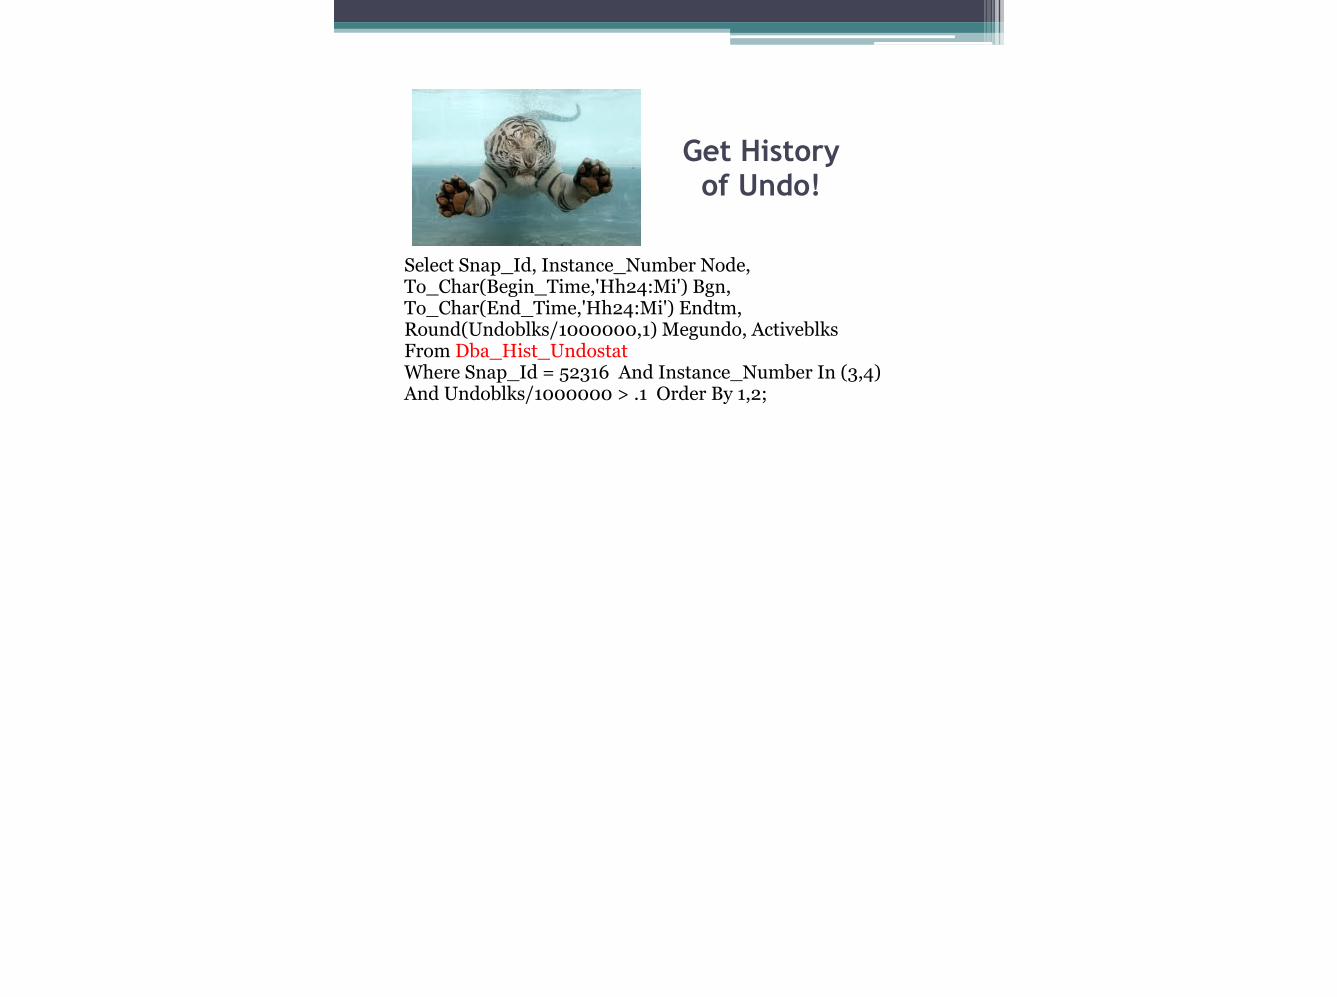
Get History of Undo!
Select Snap_Id, Instance_Number Node, To_Char(Begin_Time,'Hh24:Mi') Bgn, To_Char(End_Time,'Hh24:Mi') Endtm, Round(Undoblks/1000000,1) Megundo, Activeblks From Dba_Hist_Undostat Where Snap_Id = 52316 And Instance_Number In (3,4) And Undoblks/1000000 > .1 Order By 1,2;

Multiple Entries? SNAP_ID NODE BGN ENDTM MEGUNDO ACTIVEBLKS -------- ---------- ----- ----- ---------- ---------- 52316 3 07:32 07:42 .2 156400 52316 3 07:22 07:32 .2 142064 52316 3 06:52 07:02 .2 116464 52316 3 07:02 07:12 .3 164592 52316 3 07:12 07:22 .3 209648 52316 3 07:42 07:52 .2 103152 52316 4 06:55 07:05 .1 79312 52316 4 07:05 07:15 .2 81232
• Multiple entries not helpful Let’s summarize for node
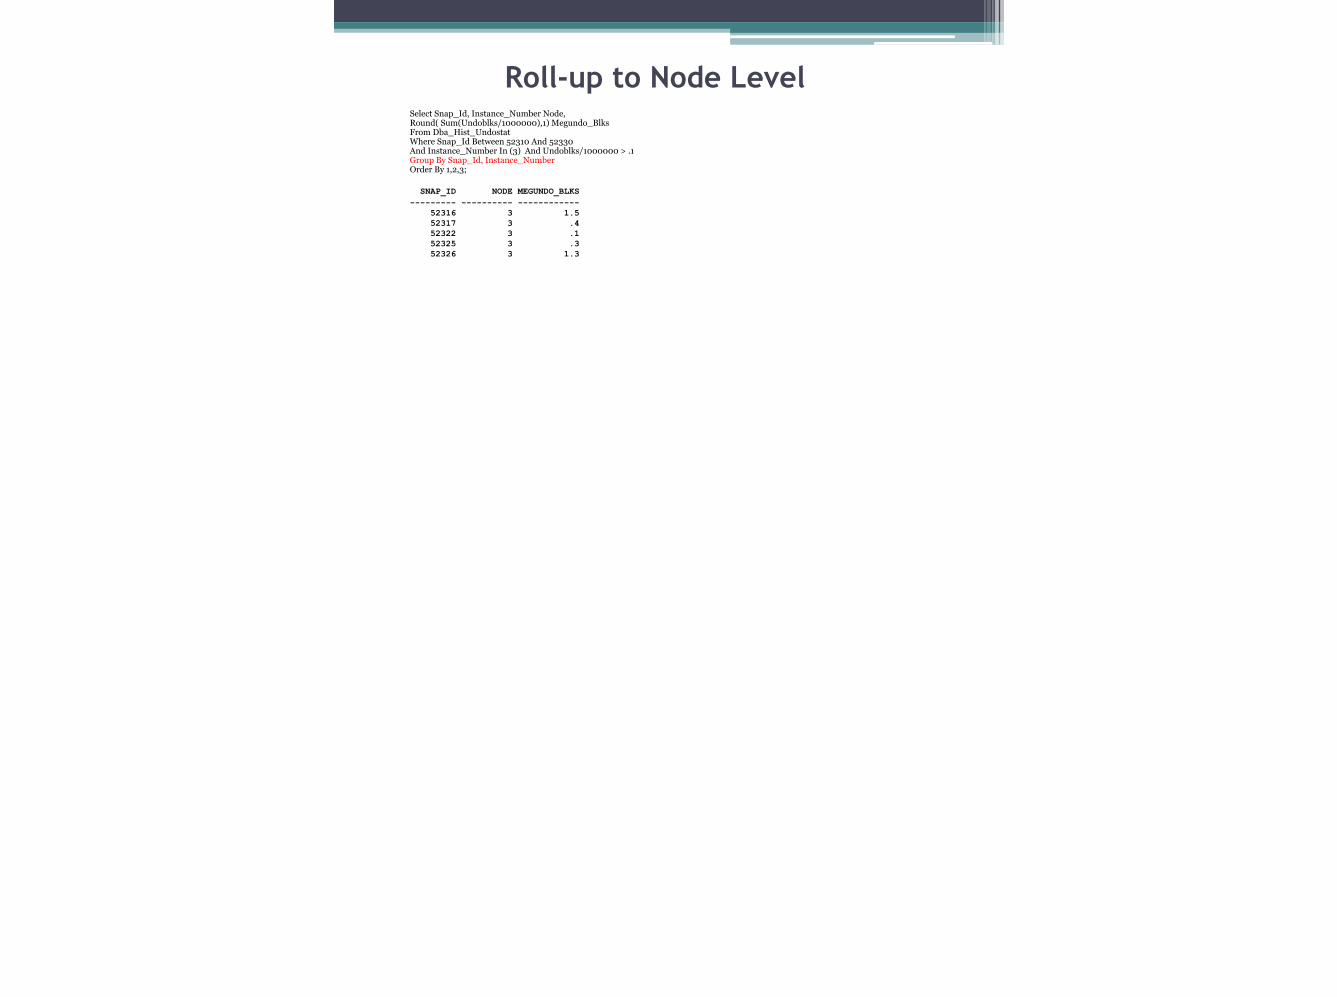
Select Snap_Id, Instance_Number Node, Round( Sum(Undoblks/1000000),1) Megundo_Blks From Dba_Hist_Undostat Where Snap_Id Between 52310 And 52330 And Instance_Number In (3) And Undoblks/1000000 > .1 Group By Snap_Id, Instance_Number Order By 1,2,3; ! SNAP_ID NODE MEGUNDO_BLKS --------- ---------- ------------ 52316 3 1.5 52317 3 .4 52322 3 .1 52325 3 .3 52326 3 1.3
Roll-up to Node Level

ANOTHER WAY: DBA_HIST_SYSSTAT
Select Distinct Snap_Id, Instance_Number Node, Stat_Name, Value From Dba_Hist_Sysstat Where Snap_Id Between 52316 And 52330 And Stat_Name Like 'undo change%' And Instance_Number = 3; SNAP_ID NODE STAT_NAME VALUE -------- ---------- -------------------------- ---------- 52316 3 undo change vector size 1.6331E+12 52317 3 undo change vector size 1.6351E+12 52318 3 undo change vector size 1.6352E+12 52319 3 undo change vector size 1.6360E+12 ! Format confusing

THE FORMAT CONFUSES ME!
• Results show Bytes of Undo. • Huge values, since cumulative.
1) Sort by Snap_id 2) Convert to Megabytes 3) Use function, Lag to get delta

MORE USEFUL FORMAT
Select Distinct Snap_Id, Instance_Number NODE, ROUND(((Value - Lag(Value,1) Over(Order By Snap_Id)))/1000000,1) MBYTES_UNDO From DBA_HIST_SYSSTAT Where Snap_Id Between 52315 And 52322 And Stat_Name Like 'undo change%' SNAP_ID NODE MBYTES_UNDO -------- ---------- ----------- 52316 3 8404.7 52317 3 1948.2 52318 3 165.4 52319 3 751.7

COUNTING BYTES UNDERCOUNTS TOTAL
BLOCKS
It's not simply a matter of dividing the megabytes of undo by the block size.
Tiny transaction uses at least 1 undo block.

LIMITATIONS?
• These scripts summarize at instance level. • We don't know specific user or session. We'll figure that one out next

WARNING:THE FOLLOWING TIP
HAS NEVER BEFORE BEEN SEEN BY HUMAN EYES

TIP 5: FIND THE BIG "UNDOERS"
• We found total undo usage, but didn't really know exactly who was doing that.
• This tip takes us a bit further down the path. • Let’s try some other Dba_Hist tables

HOW ‘BOUT THESE?
1. Dba_Hist_Active_Sess_History 2. Dba_Hist_Sessmetric_History 3. Dba_Hist_Sess_Time_Stats !
1. Not interested in the active sessions. 2. Records summaries of blocked user sessions. 3. Has Streams metrics.

A PRE-EXISTING SOLUTION?
• We run job saving session info 10 mins • We join v$session, v$process, v$sessmetric
v$transaction • We save the data in Da_Session_History. • Size not an issue.

REF: OUR PROCEDURE
insert into da_session_history select sysdate, s.inst_id, s.sid,s.serial#, p.spid,
s.username, s.status, s.machine, s.program, s.sql_id, s.sql_child_number, s.sql_exec_start, s.module, s.logon_time, s.last_call_et,s.pq_status, s.blocking_instance, s.blocking_session, s.event, s.p1, s.seconds_in_wait, s.service_name, m.begin_time, m.end_time, m.cpu, m.physical_reads, m.logical_reads, t.start_date, t.used_ublk from gv$session s, gv$process p, gv$sessmetric m, gv$transaction t where s.inst_id = p.inst_id and s.inst_id = m.inst_id and s.sid = m.session_id and s.serial# = m.serial_num and s.paddr = p.addr and s.status='ACTIVE' and s.inst_id = t.inst_id(+) and s.saddr = t.ses_addr(+);

NOW, FIND THE BIG UNDOERS
Select to_char(snap_time,'mon-dd HH24:MI') TM, inst_id INST, sid, username, Machine, sql_id, trans_start_date, used_ublk From Da_session_history Where snap_time between To_date('17-apr-2013 09','dd-mon-yyyy hh24') And to_date('17-apr-2013 14','dd-mon-yyyy hh24') And Used_ublk > 1000 And Username <> 'SYS‘ ! don’t want to see background processes

THE EVIL-UN-DOERS?
INST USERNAME SQL_ID TRANS_STA USED_UBLK ----- ---------- ------------- --------- ---------- 6 CCBPBCAPP 1rywbwh9na1r7 17-APR-13 6013 6 CCBPBCAPP 6mm8qf07d2qn8 17-APR-13 5633 6 CCBPBCAPP 07run4gmh3p3g 17-APR-13 1151 4 CCBPSMAPP 5mks1rz3rgfub 17-APR-13 1249 We see some undo users on nodes 4 and 6 on April 17.

Questions on Finding Undo?

WAKE-UP! BEST ONES ARE COMING UP!

TIP 6: RAC: CAN SQL EFFICIENCY BE SECONDARY?
• What? Efficiency not important? • Them is fighting words to performance DBA !
! Sql efficiency is usually critical.

Tell Me More!
• We assume that a job's runtime will be determined by adding the sql runtimes.
• On RAC, however, there are some sneaky considerations that are even more important.
! Let’s check “multithreading.”

THE JOY OF MULTI-THREADING
• This is very common on RAC. • Large number of threads run on each node. • Like "divide and conquer,” we chunk little pieces,
and crank-up lots of processors. !
Hey, isn’t there a better option?

FULL TABLE SCANS ARE OUR
FRIEND
• We could take advantage of Oracle's multiblock read efficiency.
• This requires, that the data be partitioned in a certain way, or—
• At least, Oracle can access all the data needed in one pass.

STOP YER WHINING!
• We often see designs that aren't optimal. • Multithreading may or may not be the wisest
choice, but it's a very common. • It’s just so appealing! • So we might as well stop whining.

BACK TO THE PROGRAM: REAL CASE SCENARIO
• Big RAC system, billing cycle uses hundreds of threads over 4 nodes.
• Run similar sql millions of times. • Sql is tuned and runs well. • Biggest sql: Sql_Id--"g8r," or simply G8R.

HOW CAN THIS BE?
• Support group noticed that the last threads always finish an hour later on Node 3.
• The pacing sql was our old friend, G8R. • How can last threads always end up on node 3? • This cannot be simply chance.

MORE MYSTERY
• Sql runtime: G8R ran similar on all nodes. • Just a tiny bit of variation--not nearly enough to
explain the laggard. !
Let’s compare avg runtime

RUNTIMES EQUAL!
Time per Sql
Secs
0.0
0.5
1.0
1.5
2.0
Hour

SO WHAT’S THE BIG DEAL?
• We wondered how often sql was commanded. • If Sql commanded less, it will do less. • On our cluster, it was important that all the
nodes be "driven" equally fast. • We graphed execution count for “fast” and
“slow” nodes.
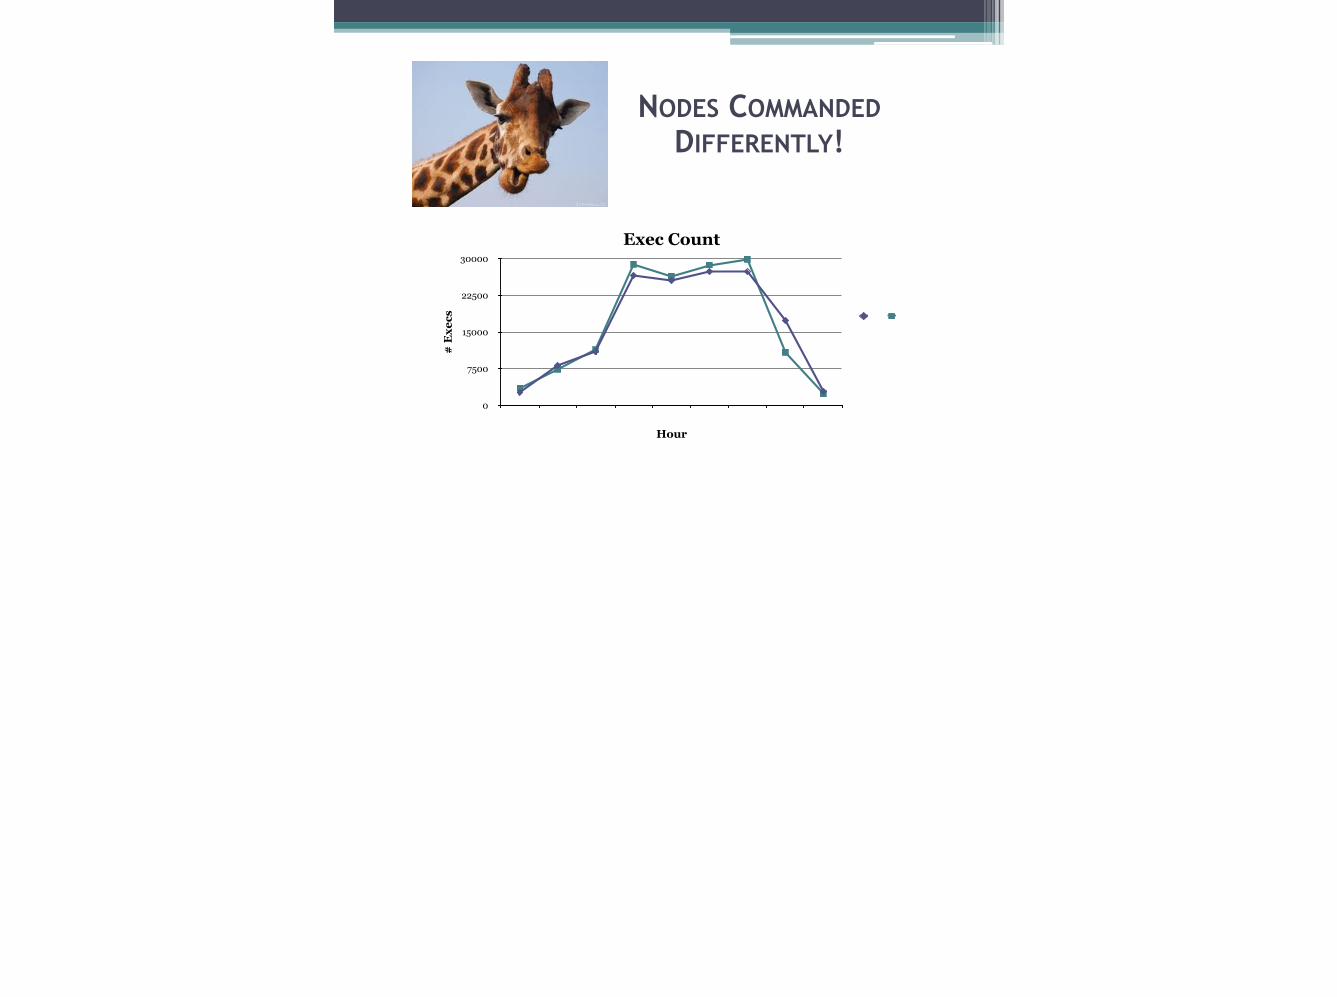
NODES COMMANDED DIFFERENTLY!
Exec Count
# E
xecs
0
7500
15000
22500
30000
Hour

FAST NODE SENT COMMANDS FASTER
• Through the night, executions ramps-up. • But fast node is completing somewhat more
executions during the peak times. • So fast node has fewer to do at the end. • But slow node drags on, later.

WHY IS SLOW NODE DOING LESS?
• Is it busy doing something else? • Check time Oracle was actually doing work. !
Metric is in AWR reports and in DBA_HIST_SYSMETRIC_SUMMARY

WHAT?? SLOWER NODE IS LESS BUSYDB Time
Min
utes
0
175
350
525
700
Hour

EXPLAIN, PLEASE
• Slow node was less busy running sql. • Slow node was running cooler than fast node! !
Conclusion: Application feeding Oracle fewer sql to process.

MORE SLEEP, LESS WORK?
• On the slow node, there was a network issue related to some Unix settings.
• So, time to send/receive commands was longer. • So that instance spent more time idle. Runtime was not related to efficiency

Questions on Sql Efficiency?

No one in my company knew the following tip

Tip 7: Does Oracle Pad the Numbers?
• Affects both functionality as well as performance.
• Big and surprising impact. !
Plus, it confused me.

I’m Confused!
• I thought that strings are only "equal" if the two are absolutely identical.
• In Oracle, however, this is not true. • Let’s look at actual case. First, I needed actual binds.

Ref: Getting Bind Info
Select distinct a.inst_ID, to_char(last_captured, 'mon-dd-hh24:mi') cap, c.name||'/'||c.value_string bind_var From GV$sqlarea a, Dba_users b, Gv$sql_bind_capture c Where b.user_id=a.parsing_user_id And b.username != 'SYS' And c.address=a.address And a.sql_id = [TBD] Order by 1,2;

Only Me Gets Zero?
Var b1 Varchar2(10) Exec :b1 := 'DIV_YS'; !Select count(*) from Detail_Table where Level_2_code = :b1; COUNT(*) -------- 0
How ‘bout Char?
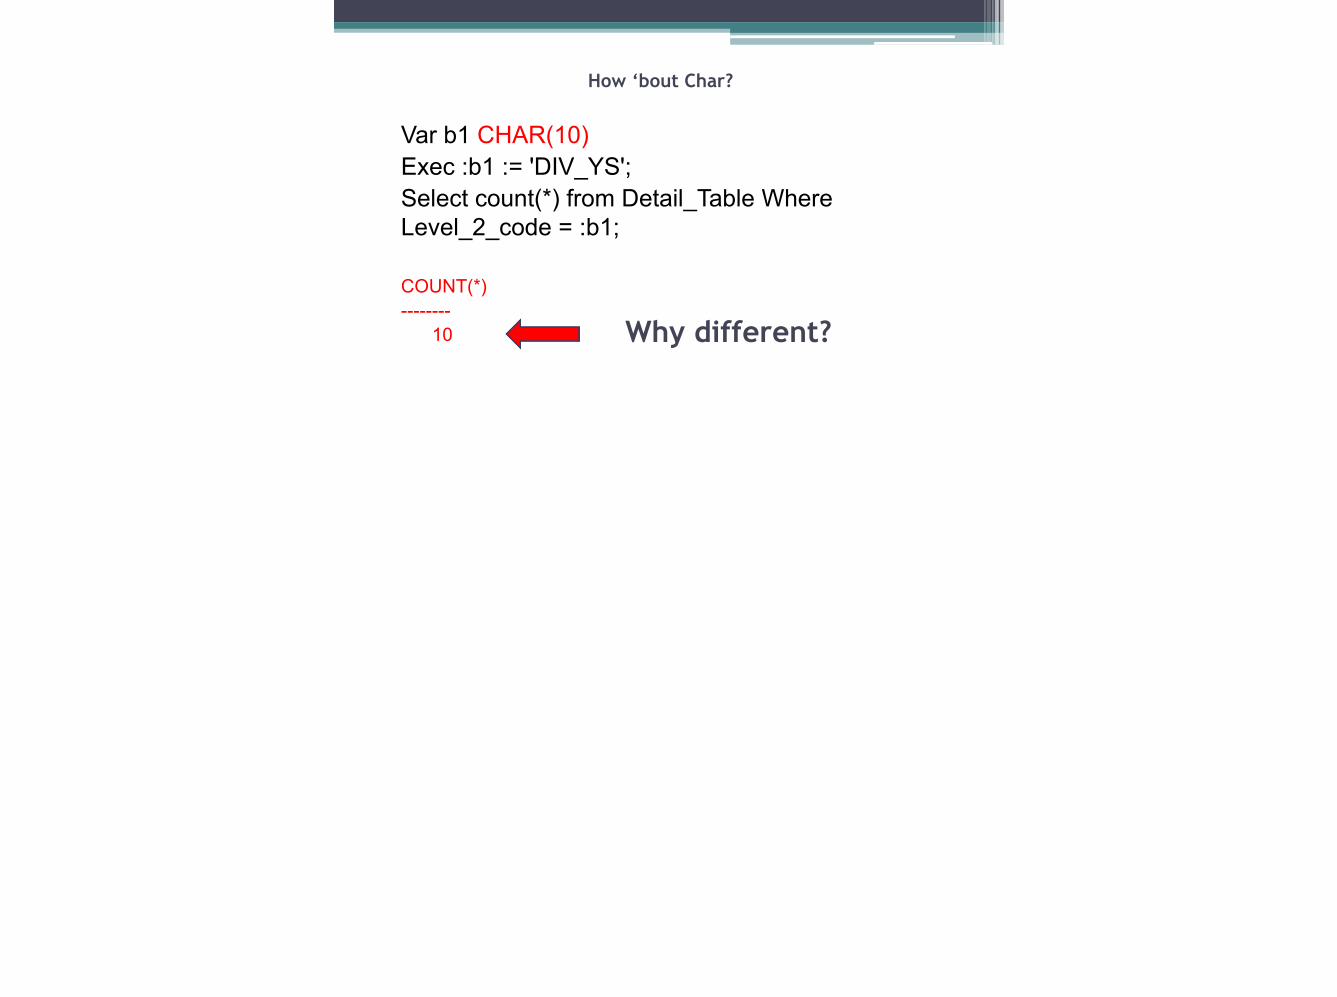
Var b1 CHAR(10) Exec :b1 := 'DIV_YS'; Select count(*) from Detail_Table Where Level_2_code = :b1; COUNT(*) -------- 10
Why different?

What Happened?
• When I switched to CHAR, Oracle switched to blank-padded comparison semantics.
• With this method of comparison, many rows in the table matched. !
When does this apply?

Happens When?
Per Sql reference guide: Oracle Database SQL Language Reference 11g Release 1 (11.1)
!“Oracle uses blank-padded comparison semantics only when both values in the comparison are either expressions of data type CHAR, NCHAR, text literals, or values returned by the USER function.”

The “Law”
1. If two values have different lengths, Oracle adds blanks to end of shorter one to make lengths equal.
2. Oracle then compares the values character by character up to the first character that differs.
3. If two values have no differing characters, then they are considered equal.
The Funny Result
This rule means that two values are equal if they differ only in the number of trailing blanks. ! So, for a CHAR field, 'A' = 'A '

Questions on “Padding”?

Tip 8: CARDINALITY FEEDBACK: NOT ALWAYS
A GOOD THING
• We often hear that sql ran bad, then good. • We rightly suspect the caching effect.
Here's a case where things worked opposite.

When First is Best?
• A user complained that his report ran fine the very first time, then miserable afterwards.
• I was intrigued, and ran an AWR/Sql report. • Last part of the execution plan:
Id Operation Name Rows Bytes Cost (%CPU) Time
13 * * * 00:00:01
14 SORT AGGREGATE 1 17
15 FIRST ROW
1 17 1 (0) 00:00:01
16 INDEX RANGE SCAN (MIN/MAX)
CMT138P0 1 17 1 (0) 00:00:01
Execution Plan
•cardinality feedback used for this statement

A Nasty Surprise
• With Cardinality Feedback on this sql, runtime was 1000x worse.
• Search of other AWR/Sql reports stored showed other cardinality feedback.
• Naturally, the user was not thrilled with this feature. ! So what is going on?

Help the Optimizer
• New for Oracle 11gR2, cardinality feedback gleans statistics from first sql execution.
• Can help if complex predicates make accurate estimation difficult.
• For example, several math expressions.

A Good Choice forThis Feature?
•In this query, how should optimizer handle? •Full scan or index range scan? !Select * from Inventory Where Qty_On_Hand < 100 AND Tab_Number = 12;

Finding Information• It uses feedback from first execution. • It's not a continuous monitoring system. • However, if there are multiple child cursors
for a sql, there can be multiple cases of feedback being used.
! Example--

An Example
Select Sql_id, Child_Number Child, Use_Feedback_Stats From v$sql_shared_cursor where sql_id = 'cn58bhkggqvj4‘; SQL_ID CHILD U ------------- ---------- - cn58bhkggqvj4 0 Y cn58bhkggqvj4 1 Y cn58bhkggqvj4 2 N cn58bhkggqvj4 3 Y cn58bhkggqvj4 4 Y cn58bhkggqvj4 5 N ***

Traces Showed This
• Cardinality feedback compares optimizer estimated cardinality to the actual cardinality.
• The estimated cardinality is called E-Rows, and the actual is called A-rows.
• If large gap, applies hint Opt_Estimate to change cardinality
!Some DBAs examined traces; first
execution had no hint; second had hint.

Beginning to Look Like Sql Profile
• Opt_Estimate is same hint used in sql profile. • So cardinality feedback is like having a Sql
Profile applied automatically. • The value Oracle uses in Opt_Estimate hint is
actual number of rows returned. • Well, that makes sense; what could be better
than the actual, empirical value?

Example of Hints
SELECT /*+ OPT_ESTIMATE (TABLE "D4" MIN=42.000000 ) OPT_ESTIMATE (INDEX_SCAN "D4" "DIM4_PK" MIN=56.000000 ) OPT_ESTIMATE (INDEX_FILTER "D4" "DIM4_PK" MIN=56.000000 ) OPT_ESTIMATE (TABLE "D2" MIN=56.000000 ) OPT_ESTIMATE (INDEX_SCAN "D2" "DIM2_PK" MIN=560.000000 ) * * *

I Have Issues!
• Scanty Documentation. • Unclear how cardinality feedback works with
optimizer_dynamic_sampling. • Some DBAs report dynamic sampling must be
set to level 4 for feedback to work.

Other Notes
• Let’s see how bugs get ironed out. • Note that the feedback information is only
kept until instance restart. • Feature is on by default, but may be turned
off at the system or session level: ! Alter system set "_optimizer_use_feedback" = false;
Questions on Cardinality Feedback?

WARNING: THE FOLLOWING TIPS MAY BE TOO
INTENSE FOR YOUNGER DBAS

TIP 9: WHEN FLASHBACK IS NOT TOO FLASHY
• Flashback - a misleading Name? • Catchy name, but FB often runs poorly. • On a production database, can take 10 hours. What?? How can that be?

RECONSTRUCTIVE SURGERY
• Oracle must reconstruct object as it was at a certain time.
• Hey—That’s same process as read-consistency! • Slow--one block at a time, going backwards
undoing each transaction. • But that’s not all!
Other issues with flashback make the process run slower
!Related to OTHER
transactions

Oracle Likes“Forward”
Before Oracle can reconstruct an object, it has to find what needs to be undone.
!Not trivial--especially on busy database.

TRANSACTION TABLE
• In each undo segment header there lies a structure known as the transaction table.
• Maybe a "list" would have been a better name. • It’s meta data pointing to undo records in that
undo segment. • For example, where to find actual undo block. ! This table only has room for 34 transactions.

TRANSACTION TABLE SLOTS
• So, slots are often overwritten. • Information is not lost but extra steps needed. • Can take millions of extra reads just to find
where to start. ! Hence, Oracle likes going Forward

ADDS MORE TIME?
• This preliminary work is before the "real work" of rebuilding the object.
• Finding where to start can be more costly than work to actually do the reconstructing.

Details, Schmetails• I have seen flashback queries require millions of
extra reads • Just for small table with only 20,000
transactions. !
Active session history shows sequential reads from undo tablespace.

A Logical, but Wrong Conclusion
• Reading Undo >> “Must be huge number of transactions on that table.”
• Not so--the reads were actually Oracle building meta data to find the transactions.

What About Old Info?
• Oracle stores old slot info at start of the new undo block that used that slot.
• So data is linked together so we can reconstruct transaction table

UNDOING THE UNDO?
• Hey, this sounds like "undoing the undo!" • You're right. Oracle calls it, "Transaction
Table Rollback." !
You can also get a summary in the AWR report, in the Instance Activity section:

HOW TO GET 10M DISK READS
Statistic Total per Second per Trans
transaction tables consistent read rollbacks 1,869 0.10 0.00
transaction tables consistent reads - undo records applied
9,577,664 531.95 3.91
AWR Instance Activity Stats
AHA!

Measuring Undo of the Undo?
• You can also see this event in real time, to get a feel for things.
• On busy system, it is likely happening all the time.
• Query V$Sessstat for
'transaction tables consistent reads’

REFERENCECol Module Format A22 Col Sid Format 99999 Col Program Format A20 Col Inst Format 9999 Col Trundo Format 9999999 Select One.Inst_Id INST, One.Sid, Substr(Program,1,20) PROG, Substr(Module,1,20) Mod, Value TRUNDO From Gv$Sesstat One, V$Statname Two, Gv$Session Three Where One.Statistic# = Two.Statistic# And One.Inst_Id = Three.Inst_Id And One.Sid = Three.Sid And Name = 'transaction tables consistent reads - undo records applied' And Program Not Like 'Oracle@%' And Value > 90000 Order By Value;

Sample Output
INST SID PROG TRUNDO ---- ------ ------------ -------- 7 1978 xtsora@cisxx01 157315 4 408 xtsora@cisxx01 178481
So 2 sessions rebuilding millions of records

So, the problem is,
what?
• Rebuilding "slots" in transaction table. • So, Oracle support says,
! “Keep more undo segments online.”
!• More slots available >> less reusing.

A Tricky Fix
• Set the underscore parameter, _rollback_segment_count.
• Overrides automatic undo process, and force more undo segments online.
• Thus, number of reused slots should go down.
• That's the theory, anyway!

Conclusion: How Will It End?
• How can you be sure it worked?
• We wonder about adverse effects.
• Why does database take undo segments offline in the first place?
• Caching effect better with fewer?
! Now, You Know the Issue!

Special thanks for his research to Jonathan Lewis,
Oracle Core: Essential Internals for DBAs and Developers
see esp Chapter 3

TIP 10: USE SQL PROFILE IN ODD WAY
• MV refresh never finished.
• It restarted refresh anew at 2:00 AM.
!Not good:128 tables set
PARALLEL DEFAULT
!This “helps” to max-out CPUs.

ACTUAL MV SQL
INSERT /*+ BYPASS_RECURSIVE_CHECK */
INTO TABLEX_MV" SELECT [plus lots more complicated SQL]

Hey, don’t we know the sql_id?
• We know the sql. • So we know sql_id.
• Can’t I just create a sql profile?

Remember Sql Profile Steps?
• Step 1: Create the Tuning Task • Step 2: Run The Tuning Task • Step 3: Get Recommendations • Step 4: Apply The Profile • Step 5: Confirm Profile is Enabled

CREATE TUNING SET
D l_sql_tune_task_id VARCHAR2(100); Begin l_sql_tune_task_id := DBMS_SQLTUNE.create_tuning_task ( sql_id => '6ggsjkphdwnwg', scope => Dbms_Sqltune.scope_comprehensive, time_limit => 200, [secs] task_name => 'chris3', description => 'chris3'); Dbms_output.put_line('l_sql_tune_task_id: ' || l_sql_tune_task_id); End; /

Run Tuning Task
BEGIN DBMS_SQLTUNE.EXECUTE_TUNING_TASK( task_name => 'chris3' );END;
/ !RECOMMENDATIONS Set long 9999 Set longchunksize 1000 !Select dbms_sqltune.REPORT_TUNING_TASK( 'chris3')
FROM DUAL; !!

Apply & Verify Profile
Execute dbms_sqltune.accept_sql_profile(task_name => 'chris3', replace => TRUE);
Select name, created, type, status, sql_text
From dba_sql_profiles
Where last_modified > sysdate – 1;

COMPARE HISTORICAL RUNTIMES
Query Dba_Hist_Sqlstat over recent snapshots. Select S.Snap_Id, To_Char(Begin_Interval_Time, 'Dd-Mon-Yy-Hh24:Mi') Beg, Executions_Delta EXECS, Rows_Processed_Delta ROWSP, Round(Elapsed_Time_Delta/1000000/60) Totalmins From Dba_Hist_Sqlstat S, Dba_Hist_Snapshot T where sql_id = '6ggsjkphdwnwg' and S.snap_id > 11330 And S.Instance_Number = T.Instance_Number And S.Snap_Id = T.Snap_Id Order By 1;

YEA! GREAT RESULTS!
! SNAP_ID BEG EXECS ROWSP TOTALMINS --------- --------------- ---------- ---------- ---------- 11331 10-Oct-12-14:00 0 0 60 11332 10-Oct-12-15:00 0 0 60 11333 10-Oct-12-16:00 0 0 60 11337 11-Oct-12-08:58 0 0 62 11338 11-Oct-12-10:00 0 0 59 11354 12-Oct-12-02:00 1 631173 4

Data Confuses Me!

SHOW GRAPHS, NOT DATA
GENIUS DBA!

Is That All?

Oh, and One More Thing …

Tip # 10.5 The Final Tip
Learn How to
Give Better Presentations

Get this Book

Sharing Tips !!
!
Sharing ideas is a hallmark of a top DBA.