noel j. shull - missouri gaming commission · noel j. shull, chair ... director, epsilon lambda...
TRANSCRIPT

Noel J. ShullChairman
Darryl T. JonesCommissioner
Samuel J. HaisCommissioner
Missouri Gaming Commission
Annual Report to the General AssemblyFiscal Year 2006

Mission Statementof the
Missouri Gaming Commission
To serve the citizens of Missouri by ensuring the integrity of charitable and commercial gaming and
by optimizing its social and economic impact on the state.

��
Table of ContentsMissouri Gaming Commission Mission Statement ............................................................... inside coverThe Commissioners ....................................................................................................................... 2Message from the Chairman ........................................................................................................ 3Message from the Executive Director ........................................................................................ 4Section 3�3.837 Report on Competitiveness .......................................................................... 5 Introduction .................................................................................................................................. 5 Competitive Impact of the $500 Loss Limit ............................................................................ 5 Competitive Impact of Missouri’s Gaming Tax Rate ............................................................. 5 Summary ........................................................................................................................................ 7Staff Report ...................................................................................................................................... 8 Enforcement .................................................................................................................................. 8 Administration .............................................................................................................................. 13 Information Technology ............................................................................................................. 16 Legal ................................................................................................................................................ 17 Corporate Securities and Finance .............................................................................................. 18 Missouri Gaming Commission Organizational Chart ............................................................ 19Gaming Market Report ................................................................................................................. 20 Introduction .................................................................................................................................. 20 Statewide Market ........................................................................................................................... 20 Kansas City Market ...................................................................................................................... 23 St. Louis Market ............................................................................................................................ 24 Other Markets ............................................................................................................................... 26Licensed Casino Locations ........................................................................................................... 28Charitable Gaming ........................................................................................................................ 29Problem Gambling ......................................................................................................................... 32Fiscal Year 2006 Report Appendices .......................................................................................... 37

2222
The CommissionersNoel J. Shull, Chair
Noel Shull has extensive experience in the financial services industry, primarily in the commercial lending area. He has served the Missouri Bankers Association as Chairman of its Governmental Affairs Committee. The U.S. Small Business Administration National Advisory Council Chairman appointed him Chairman of the Access to Capital Committee in 1988 and 1996. He has served on the board of directors for several banking institutions. Mr. Shull has volunteered on many charitable organization projects, including Missouri Cattlemen Foundation Board, Students in Free Enterprise International Exposition Judge, American Royal Governor and committees, and University of Missouri-Columbia Honorary Professors Programs. He received an undergraduate degree from UMC in finance and real estate and a graduate degree in banking from Southwestern Graduate School of Banking at Southern Methodist University in Dallas, Texas. Mr. Shull is a past recipient of the U.S. Small Business Administration Regional Financial Services Advocate of the Year award and the Kansas City University of Missouri-Columbia Business Alumni Chapter, 2004 Alumni of the Year award.
Darryl T. Jones
Samuel J. Hais
Darryl T. Jones was formerly employed by Southwestern Bell Telephone Company, now known as SBC, for 15 years as a planning and design engineer and later as a financial analyst. After his career with Bell, Mr. Jones took the bold step in becoming an entrepreneur by forming his own foodservice management company known as TRI-TEC, Inc. Over the past 10 years, he has strategically formed joint-venture partnerships with some of the giants of the foodservice industry: Levy Restaurants in operating the foodservice at the America’s Center and the Edward Jones Dome; HMSHost in operating the foodservice for Lambert International Airport; and Aramark in operating foodservice for the St. Louis Public Schools. Mr. Jones is currently volunteering numerous hours with several non-profit organizations: Trustee with Fontbonne University; Chairman, Garden District Commission; Board Director with Our Little Haven; and Board Director, Epsilon Lambda Foundation of Alpha Phi Alpha Fraternity. Some of his former civic duties include: Secretary/Treasurer, Missouri Housing Development Commission; Chairman, St. Louis Metropolitan Sewer District; St. Louis Public Schools Role Model Program; and Board Director of Inroads St. Louis. Mr. Jones and his wife, Villa, and sons are long-time residents of St. Louis City.
Sam Hais is a native Missourian, born and raised in St. Louis, Missouri and attended University City schools, St. Louis University, undergraduate and law school. Mr. Hais was an assistant prosecuting attorney in St. Louis County, a private practitioner specializing in trial practice, and in 1975, was appointed a County Magistrate. He was elected and retained as a Judge of the 21st Judicial Circuit numerous times over the years, and in 1991, was one of the founding members of the St. Louis County Family Court. He returned to the private practice of law in 2004, and is currently the managing partner of Hais, Hais and Kallen Law Firm in Clayton, Missouri. He is married and has two children. In addition to his service on the Missouri Gaming Commission, he is a member of a number of civic, charitable and local community organizations.

33
On behalf of the Missouri Gaming Commission, it is my pleasure to present the annual report for FY 2006. This report is submitted to comply with Section 313.837, RSMo, and contains an account of the Commission’s activities over the past year. The Commission has experienced much change over the past year with a change in management and in board composition. This transition will result in new ideas and renewed vigor. It is the Commission’s desire to further enhance Missouri’s reputation for quality performance and value-added service both to the public and to the gaming industry.
The report includes a summary of the status of each licensed gaming facility; a report of gaming tax and admission fee collections; an analysis of the gaming markets in Missouri; a summary of the responsibilities and activities of each section of the Commission’s staff; a report on the status of the gaming industry affirmative action programs; and an update on the Commission’s programs for problem gamblers and their families. The report also contains a section fulfilling the Commission’s statutory mandate to report to you on the effect of the loss limit on the competitiveness of Missouri riverboat casinos versus gaming facilities in neighboring jurisdictions. For the past decade, this Commission has reported to you that the data clearly shows the loss limit renders Missouri riverboat casinos less competitive versus its competitors in Illinois, Iowa and Mississippi. There has been little change in the data over the past decade.
The Commission would encourage the legislature to look closely at the impact of the $500 loss limit provision. The $500 loss limit is potentially costing the state $100 million dollars annually in additional gaming tax revenues. Members of industry have indicated previously that they would be willing to accept a 1% increase in the 18% state gaming tax as a trade off for the elimination of the $500 loss limit. At the same time, the problem gamblers’ programs should be reviewed and modified to adapt to a change in regulations as well as developing new additional sources of revenues to fund problem gamblers’ programs.
The gaming statutes also require the Commission to suggest changes in the adjusted gross receipts tax as provided in Section 313.822, RSMo. On pages 5-7, you will find a detailed analysis of Missouri’s gaming tax rate as it compares to the gaming tax rates in other riverboat gambling states.
The Commission recommends the General Assembly enact legislation directing that jackpot winnings of problem gamblers who have voluntarily excluded themselves from Missouri casinos be deposited into a fund for problem gambling prevention and treatment. Under the provisions of Missouri’s voluntary exclusion program, problem gamblers who have excluded themselves are ineligible to place a wager. Thus, if the problem gambler surreptitiously enters the casino, illegally places a wager and wins a jackpot, the current law allows the casino to keep the money. The Commission believes a better policy is to deposit the money into the Compulsive Gamblers Fund. We ask that you enact legislation authorizing the Commission to redirect the funds.
The state Auditor’s Office performed an audit of MGC in May, 2006 for the years ending 2003, 2004 and 2005. The following critical finding was noted as a result of the audit: “The Missouri Gaming Commission (MGC) does not have a comprehensive audit plan to identify and monitor the goals and responsibilities of the compliance audit section, as required by MGC policy. The audit section is responsible for performing comprehensive reviews and assessments of the level of compliance by casinos with applicable gaming statutes, regulations, internal controls, and good business practices. An audit plan will assist MGC officials in more effectively prioritizing and establishing the frequency of audits and determining whether audit function goals are realistic and objectives of the audit function are being met.” Ordinarily, this would have been a routine finding in the audit report. Sadly, however, this was a repeat finding by
Message from the Chairman

����
the Auditor’s Office from the 2000, 2001 and 2002 audits three years ago which had not been implemented as recommended. Current commissioners have prioritized this issue for correction and will work to ensure a comprehensive audit plan is developed to identify and monitor the goals and responsibilities of the audit function as required by MGC internal policy and procedure 4-01.
Clearly, developing and implementing an effective plan as required, and auditing the gaming facility licensees at least every two years with objectivity and a firm hand, will serve to further ensure the citizens of Missouri of the honesty and integrity of charitable and commercial gaming in this state.
The Commission also recommends legislation be adopted requiring casinos pay interest on delinquent admission fees. A decision by one of the Commission’s hearing officers pointed out that the current gaming statute provides specific language allowing the Commission to impose interest on delinquent adjusted gross receipts taxes. However, language authorizing the imposition of interest is missing from the section imposing an admission fee. Thus, the Commission cannot assess interest against delinquent admission fees until the legislature grants it the authority to do so.
Governor Matt Blunt appointed a new Commissioner, Sam Hais, in 2006. Commissioner Hais adds law enforcement expertise from his experience as a prosecutor and as a judge. The Commission employed Gene McNary as Executive Director in July, 2006. McNary not only has a law enforcement background, having served as St. Louis County Prosecuting Attorney, but also was commissioner of the Immigration and Naturalization Service which includes the Border Patrol. His extensive administrative experience as St. Louis County Executive and as head of the 18,000 employee INS ensures that MGC’s day-to-day operations will be in capable hands. One of McNary’s first moves was to employ the exceptionally competent and highly respected Superintendent of the Missouri Highway Patrol, Colonel Roger Stottlemyre, to be MGC’s Deputy Director over Enforcement. McNary and Stottlemyre are committed to keeping Missouri casinos honest and lawful operations while at the same time regulating an industry so important to Missouri, in a fair and objective manner. We look forward to two additional Commissioner appointments by the Governor. This will complete a turnover in the Commission, providing a new outlook with new management committed to excellence.
Message from the Executive DirectorIt is with great pleasure that I write this message as the new Executive Director of the Missouri
Gaming Commission. My goal is to continue the great work of the previous Executive Directors and to maintain the fine reputation of this agency. In the short time that I have been with the Commission, I have been impressed with the professionalism of the Commission staff and their dedication to protection of the public. The staff works constantly through training, advanced computer technology, and improved regulations to keep up with the ever-changing technology of the casino industry. As Executive Director, I intend to ensure that the games offered by the gaming companies are honest, that gaming assets are protected, and that public safety is maintained. Under my leadership, the Commission will require strict compliance with all laws and regulations, but will work cooperatively with licensees to allow them to meet their economic goals within the framework of regulatory compliance. I look forward to working closely with the Governor, the Legislature, and the Department of Public Safety in fulfilling the mission of the Missouri Gaming Commission for the benefit of the citizens of the State of Missouri.

��
Section 313.837 Report on CompetitivenessIntroduction Since its inception, the Missouri law governing riverboat gambling has included a loss limit of $500 per person for each “gambling excursion”. Missouri’s loss limit emulated an Iowa law that was repealed in 1995. Missouri is now the only jurisdiction in the world imposing a loss limit on its gambling customers.
Section 313.837, RSMo, requires the Commission to report annually to the General Assembly “the status of the competitiveness of Missouri excursion gambling boats when compared to the gaming tax rate of adjoining states and the effects of the loss limit imposed by subdivision (3) of Section 313.805, RSMo, on the competitiveness of the gaming industry in Missouri.”
Competitive Impact of the $�00 Loss LimitFor the past several years, the Commission has asked the General Assembly to consider legislation
repealing this requirement and thus allowing the Commission to step away from this often-volatile political issue.
Competitive Impact of Missouri’s Gaming Tax Rate The gaming tax rates imposed on riverboat gaming operations in Missouri have not changed since the first licenses were issued in May 1994. Missouri law imposes an 18% tax on the adjusted gross receipts (AGR) of riverboat gaming operators.1 In addition, a local tax of 2% on AGR is collected by the state and distributed to each home dock city or county.2 The statute also imposes an admission fee on the operators of excursion gambling boats in the amount of two dollars ($2) per patron, per excursion, which is split between the home dock community and the state.3 Furthermore, pursuant to Section 313.824, RSMo, excursion gambling boat operators are charged for the cost of gaming agents who are assigned to the riverboat with the responsibility of protecting the public. While the cost of Commission agents varies with each operation, the average annual cost is approximately $611,000 per gaming facility.
Illinois is currently reconsidering its tax policy. The Illinois legislature recently passed a bill lowering the top tax rate to 50%. At the time of this
writing, the bill awaits consideration from Illinois Governor Rod Blagojevich. While this will still put Illinois toward the top of the gaming tax rate list, it will likely result in an increase in capital investment in Illinois as well as more aggressive marketing by Illinois casinos. We can expect this activity to cut into gains made over the past few years by Missouri casinos on the eastern side of the state.
1Adjusted gross receipts are defined by Sec-tion 313.800, RSMo, as “the gross receipts from licensed gambling games and devices less the winnings paid to wagerers.” In other words, the amount the casino “wins” from patrons. It is often referred to as “casino win”. The tax on AGR is set forth in Section 313.822, RSMo.2Section 313.822, RSMo.3Section 313.820, RSMo.

66
Missouri’s stable tax environment continues to attract substantial investment dollars despite Missouri’s strict regulatory stance in other areas. Since the licensing of the first casinos in 1994, a total of $2,045,700,000 of capital investment has occurred. It is anticipated that an estimated $1.5 billion of additional capital investment in Missouri casinos will occur over the next several years.
Illinois adopted a sliding scale of tax rates in 2003. Illinois ranks toward the top of the gaming tax rate list with a sliding scale of tax rates topping out at approximately 50%. The gaming industry views this level of taxation as a disincentive to increased capital investment. In 2002, Indiana increased its effective tax rate by 5% by adopting a graduated tax rate and eliminating its boarding fee on customers staying over for more than one “excursion”. While the Commission argues against the graduated tax rate, the policy has not had a negative impact on Indiana gaming revenues because the legislature coupled regulatory reforms with the tax increase. Before 2002, Indiana imposed restricted boarding and mandatory cruising. In conjunction with the 2002 tax increase, Indiana rescinded the boarding and cruising requirements, thus allowing casino operators to effectively absorb the tax increase.
While the Iowa tax rate is lower than Missouri’s, it is comparable, and like Missouri, its tax structure has not changed since initial enactment. There is no evidence that the lower Iowa tax rate is having a negative impact on the competitiveness of Missouri casinos. Certainly, over the long term, the fact that Indian casinos in Kansas pay no tax will have an impact on western Missouri gaming operators. There is the potential for rapid expansion of Kansas’ Indian casinos. Finally, Missouri casinos have been profitable in spite of the high tax rate largely because of the Commission’s gradual approach to licensure.

77
SummaryThe Missouri tax rate remains among the highest in the gaming industry. However, its structure
has some inherent advantages over Illinois. The lower tax rate in Iowa does not appear to be affecting the competitiveness of the Missouri operators.

8888
Staff ReportENFORCEMENTClarence Greeno, Acting Director of Enforcement
Activity within the enforcement section continues at a rapid pace, challenging staff to effectively utilize resources. Each enforcement program – licensing, audit, training, electronic gaming devices, investigations, policy administration, charitable gaming, et.al. – is staffed by a diverse and dedicated team of managers and support personnel who are committed to ensuring gaming within the state is being conducted fairly and is regulated with honesty and integrity.
The Commission’s philosophy of Community Oriented Regulation and Enforcement (CORE) remains the centerpiece of the enforcement section’s efforts to fulfill the organization’s mission of serving the citizens of Missouri by ensuring the integrity of charitable and commercial gaming by optimizing its social and economic impact on the state. CORE recognizes that effective regulation is not the product of the Commission alone, but requires communication with and participation from the gaming industry and patrons as well. Each contributes to the success of gaming within the state and their contributions are vital to the Commission accomplishing its mission. Applying the concepts of CORE have allowed the promulgation of rules, procedures and controls that help the state maintain its role as an innovative leader in gaming regulation and allows casino properties to implement the latest technology and remain competitive in the gaming market. The role of the casino operator and that of the regulator are not mutually exclusive. An environment that promotes mutual respect for one another’s roles and responsibilities is healthy and beneficial, resulting in growth for the industry and increased revenues for all.
The spirit of cooperation in working with one another is evidenced by industry requesting Commission personnel to provide training to their employees, as well as our relying on industry to train Commission personnel. Increased incidents of minors attempting to obtain player’s cards and gain access to the casino floors and entertainment venues, prompted casinos to request assistance in training their personnel on techniques for identifying fraudulent identifications. During FY-2006, Commission personnel trained some 1350 casino employees during 72 training sessions at the casino properties in the state. Likewise, the Commission has called upon the gaming industry to train Commission personnel on specific table games, as well as on new gaming technology being introduced to the market place.
Recognition of Missouri’s leadership position in gaming regulation, as well as the expertise of its personnel, continues to be evidenced by invitations to speak at industry and regulatory meetings throughout the country. For the fourth straight year, Commission personnel were asked to make presentations at the Global Gaming Expo (G2E), an international trade exposition and training conference attended by more than 25,000 gaming manufacturers, operators, and regulators. Commission

��
personnel also made presentations at Gaming Laboratories International Regulators Roundtable, a meeting attended by some 225 regulators representing 50 jurisdictions from the United States, as well as Canada, Chile, Singapore, and Peru; the North American Gaming Regulators Association (NAGRA); International Game Technologies’ (IGT) Worldwide Compliance Directors Meeting; the Law Enforcement Intelligence Unit, an international organization of law enforcement gaming regulators; and the Internet Gaming Task Force.
The Commission’s Electronic Gaming Device (EGD) Specialist program, while just over one-year young, has been met with enthusiasm and favor by the gaming industry. These skilled and knowledgeable specialists are providing a valuable service to the casinos while at the same time performing a vital regulatory function. Ensuring the integrity of electronic gaming devices by verifying and sealing critical program storage media, certifying gaming devices, kiosks, and computerized game monitoring systems, and testing games and systems for proper communication, is but a part of their duties. Keeping current on advances in gaming devices, systems, and software technology; investigating game and system anomalies and malfunctions; and developing and maintaining web-based forms, certification and revocation documentation, reporting procedures, and verification protocols are important elements of the specialists’ daily functions. The EGD Specialists’ ability to capture data communications between gaming devices and systems when anomalies occur, thereby facilitating forensic evaluations by our independent testing laboratory and the device and system manufacturers, is a rarity among gaming regulators. Few, if any, other gaming regulators perform these data captures which allow more expedient resolution to game or system anomalies. Casino operators report that prior to the EGD Specialist program they would often enter a weekend with anywhere from 40 to 120 gaming devices out-of-service; while now the number of down games is often zero to five, translating into increased gaming revenue for the operator and the state.
Missouri’s role as a leader in gaming regulation was once again evidenced when the Commission was asked by a gaming device manufacturer to be one of the first gaming jurisdictions to offer Server-Based Game Download (SBGD) technology at a Missouri property. Again, using the CORE philosophy, the Commission accepted the challenge and has worked for more than a year with its independent testing laboratory, the gaming device manufacturer and the Missouri licensed casino property to bring this cutting-edge technology to the state. A SBGD system allows a back-of-house server to communicate with EGDs on the gaming floor, downloading game themes and game configurations to multiple EGDs in a matter of seconds, a process which requires a casino employee and a Commission agent 20 to 40 minutes per non server-based EGD to accomplish. The Commission’s obvious concern with this and any technology is ensuring it is secure and verifiable, cannot be manipulated, is fair to both the casino and the patron, and protects the integrity of gaming. In other words, it complies with Commission regulations. SBGD is the first inning of a nine inning game; it will revolutionize slot machine technology, forever changing the way casino floors will be managed. The implementation of SBGD at Ameristar Casino St. Charles in June 2006, in fact, made Missouri the first state regulatory jurisdiction in the nation to have server-based game download EGDs.
�0�0
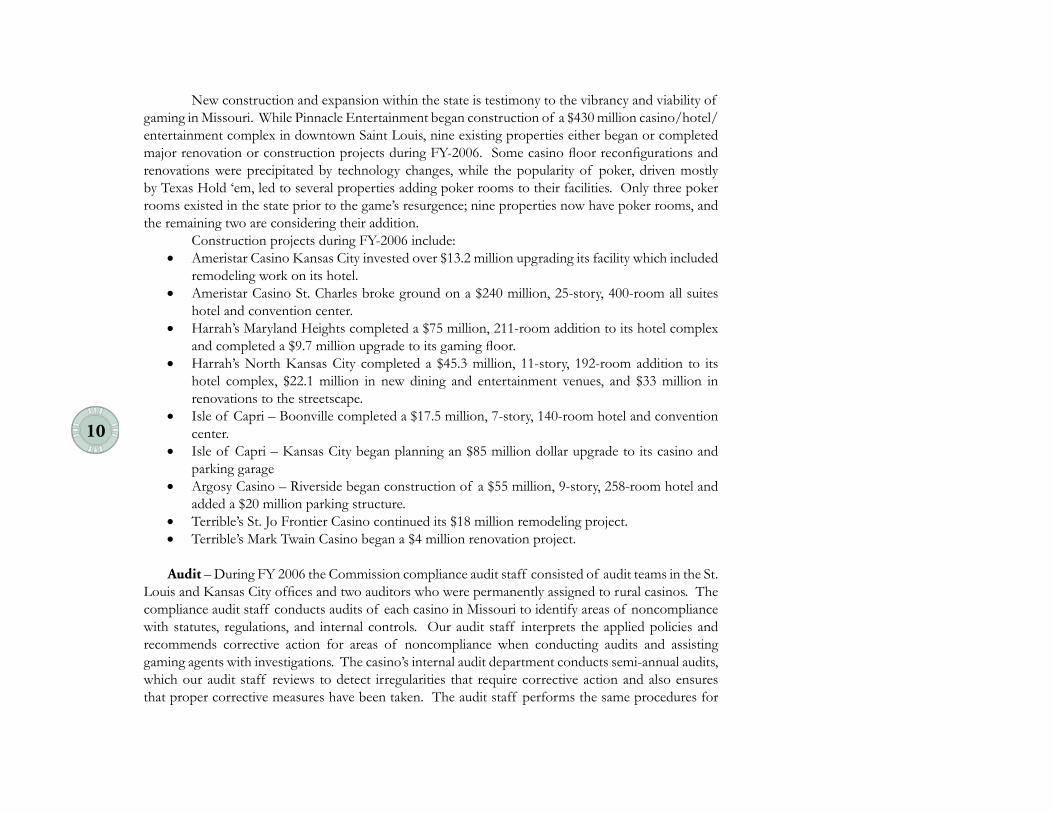
New construction and expansion within the state is testimony to the vibrancy and viability of gaming in Missouri. While Pinnacle Entertainment began construction of a $430 million casino/hotel/entertainment complex in downtown Saint Louis, nine existing properties either began or completed major renovation or construction projects during FY-2006. Some casino floor reconfigurations and renovations were precipitated by technology changes, while the popularity of poker, driven mostly by Texas Hold ‘em, led to several properties adding poker rooms to their facilities. Only three poker rooms existed in the state prior to the game’s resurgence; nine properties now have poker rooms, and the remaining two are considering their addition.
Construction projects during FY-2006 include:• Ameristar Casino Kansas City invested over $13.2 million upgrading its facility which included
remodeling work on its hotel. • Ameristar Casino St. Charles broke ground on a $240 million, 25-story, 400-room all suites
hotel and convention center.• Harrah’s Maryland Heights completed a $75 million, 211-room addition to its hotel complex
and completed a $9.7 million upgrade to its gaming floor.• Harrah’s North Kansas City completed a $45.3 million, 11-story, 192-room addition to its
hotel complex, $22.1 million in new dining and entertainment venues, and $33 million in renovations to the streetscape.
• Isle of Capri – Boonville completed a $17.5 million, 7-story, 140-room hotel and convention center.
• Isle of Capri – Kansas City began planning an $85 million dollar upgrade to its casino and parking garage
• Argosy Casino – Riverside began construction of a $55 million, 9-story, 258-room hotel and added a $20 million parking structure.
• Terrible’s St. Jo Frontier Casino continued its $18 million remodeling project.• Terrible’s Mark Twain Casino began a $4 million renovation project.
Audit – During FY 2006 the Commission compliance audit staff consisted of audit teams in the St. Louis and Kansas City offices and two auditors who were permanently assigned to rural casinos. The compliance audit staff conducts audits of each casino in Missouri to identify areas of noncompliance with statutes, regulations, and internal controls. Our audit staff interprets the applied policies and recommends corrective action for areas of noncompliance when conducting audits and assisting gaming agents with investigations. The casino’s internal audit department conducts semi-annual audits, which our audit staff reviews to detect irregularities that require corrective action and also ensures that proper corrective measures have been taken. The audit staff performs the same procedures for

����
external audit reports completed by various independent audit firms. During the year, our auditors attended internal and external audit cash counts and observed numerous coin and token relocations and destructions. Our audit staff actively contributes to the revisions of the MGC rules and regulations and participates in the review of the changes the casinos make to their own internal controls. Auditors comply with the Standards for the Professional Practice of Internal Auditing and Government Audit Standards. During FY 2006, the audit staff completed 32 audit reports reflecting the results of audits of various casino operations.
Licensing – The Missouri Gaming Commission is charged by statute to license excursion gambling boats, suppliers of gambling equipment and occupational licensees involved in an occupation within an excursion gambling boat operation. Licensing staff currently coordinate and implement the licensing and renewal of 11 Class A (riverboat) licensees, 19 supplier companies, 11 Class A liquor licenses and over 12,100 active occupational licensees.
FY2006 delivered a variety of licensing activity regarding Class A and supplier licensees. The following Class A licensees were approved for two-year licensure: IOC-Boonville, President Riverboat Casino – Missouri, Harrah’s North Kansas City, IOC-KC and Argosy Riverside Casino. HGI-St. Jo and HGI-Mark Twain were both renewed for one year. Argosy Riverside Casino was also granted a change in control and acquired by Penn National Gaming Corporation. St. Louis Riverboat Entertainment Inc., a subsidiary of Wimar Tahoe Corporation/ Columbia Sussex Corporation, withdrew their application and bid to purchase President Riverboat Casino – Missouri. Pinnacle Entertainment, Inc., won its bid to purchase President Riverboat Casino – Missouri.
Gaming Partners International SAS and United States Playing Card Company investigations were completed and both companies were issued suppliers’ licenses. Alliance Gaming Corporation/Bally Gaming Missouri, Inc. changed its name to Bally Technologies, Inc. and Mikohn Gaming Corporation became Progressive Gaming International Corporation. GTECH Corporation filed application to begin the process of becoming the parent company of Atronic Americas, LLC.
License 2001, a statewide licensing system, provides the Commission a vehicle to license and track all occupational licenses, as well as generate a monthly invoice for fees associated with applications, licenses issued, duplicate licenses and renewals for Key/Level I, Level II and service technician occupational licensees. Applications received in FY2006 for occupational licensure totaled almost 3300. Occupational gaming licenses issued statewide were approximately 3000. The remaining 300 or so applications were not processed because the applicant failed to appear for the license appointment, the applicant voluntarily withdrew their application or the applicant was unsuitable for licensure and their application was formally denied. Active licensees whose occupational licenses were officially revoked totaled 21. Total occupational license renewals statewide for FY2006 reached almost 8600. Projected increase in occupational licensees in the next several years could range from 1,000 to 3,000, depending on Pinnacle Entertainment, Inc.’s St. Louis City and County projects.
�2�2
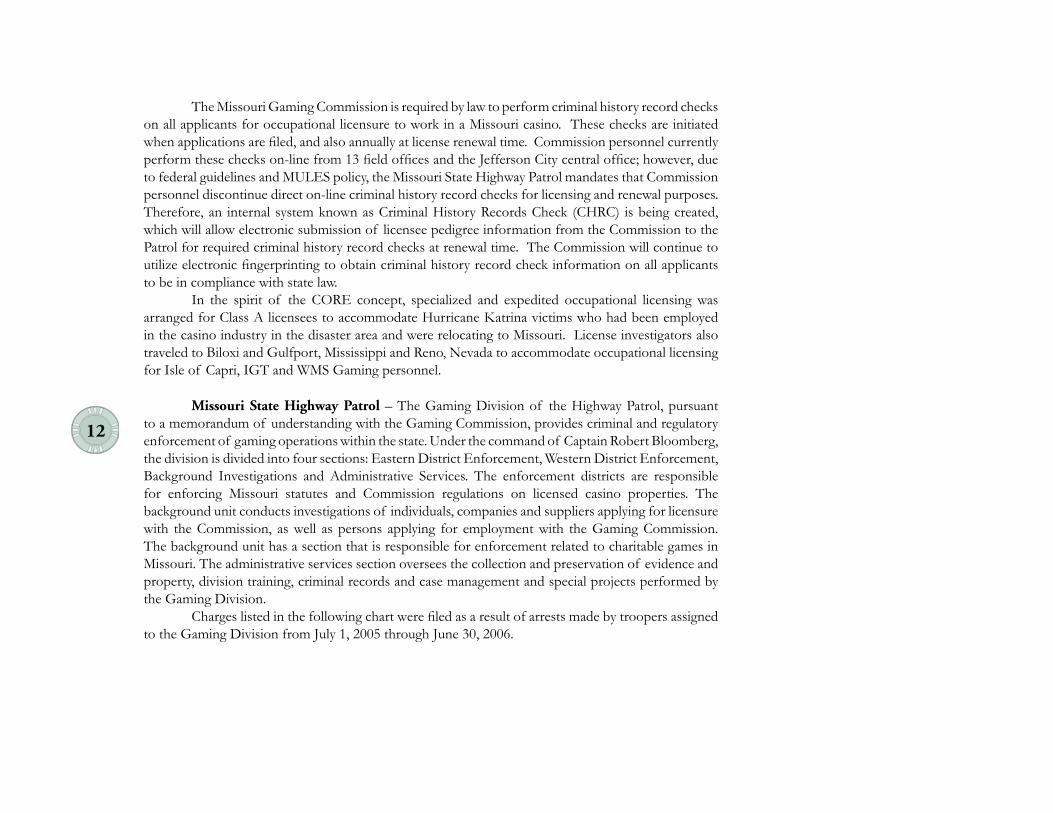
Missouri State Highway Patrol – The Gaming Division of the Highway Patrol, pursuant to a memorandum of understanding with the Gaming Commission, provides criminal and regulatory enforcement of gaming operations within the state. Under the command of Captain Robert Bloomberg, the division is divided into four sections: Eastern District Enforcement, Western District Enforcement, Background Investigations and Administrative Services. The enforcement districts are responsible for enforcing Missouri statutes and Commission regulations on licensed casino properties. The background unit conducts investigations of individuals, companies and suppliers applying for licensure with the Commission, as well as persons applying for employment with the Gaming Commission. The background unit has a section that is responsible for enforcement related to charitable games in Missouri. The administrative services section oversees the collection and preservation of evidence and property, division training, criminal records and case management and special projects performed by the Gaming Division.
Charges listed in the following chart were filed as a result of arrests made by troopers assigned to the Gaming Division from July 1, 2005 through June 30, 2006.
The Missouri Gaming Commission is required by law to perform criminal history record checks on all applicants for occupational licensure to work in a Missouri casino. These checks are initiated when applications are filed, and also annually at license renewal time. Commission personnel currently perform these checks on-line from 13 field offices and the Jefferson City central office; however, due to federal guidelines and MULES policy, the Missouri State Highway Patrol mandates that Commission personnel discontinue direct on-line criminal history record checks for licensing and renewal purposes. Therefore, an internal system known as Criminal History Records Check (CHRC) is being created, which will allow electronic submission of licensee pedigree information from the Commission to the Patrol for required criminal history record checks at renewal time. The Commission will continue to utilize electronic fingerprinting to obtain criminal history record check information on all applicants to be in compliance with state law.
In the spirit of the CORE concept, specialized and expedited occupational licensing was arranged for Class A licensees to accommodate Hurricane Katrina victims who had been employed in the casino industry in the disaster area and were relocating to Missouri. License investigators also traveled to Biloxi and Gulfport, Mississippi and Reno, Nevada to accommodate occupational licensing for Isle of Capri, IGT and WMS Gaming personnel.

�3�3
TYPE OF CHARGE NUMBER TYPE OF CHARGE NUMBER241elciheV rotoM05tluassA218ssecorP laiciduJ fo noitcurtsbO3yralgruB
12eciloP gnitcurtsbO7ytreporP degamaD1ecnabrutsiD ecaeP36sgurD suoregnaD1noitutitsorP8esneffO ylimaF2yrebboR12epacsE/thgilF6sesneffO xeS54yregroF2tluassA lauxeS65duarF
981gnilaetS403swaL gnilbmaG6ytreporP nelotS2ytefaS & htlaeH4snopaeW8swaL rouqiL
Miscellaneous Federal Charges 14 Total Charges * 1,767
*These totals reflect the number of charges filed by agents of the Commission. The number of individuals arrested will be loweras some individuals may have multiple charges filed as a result of an individual incident. These totals also include arrests madeattendant to outstanding warrants for criminal activity that did not occur on property of excursion gambling boats.
ADMINISTRATIONDeborah A. Ferguson, Deputy Director
The administration section of the Missouri Gaming Commission is responsible for managing all fiscal, personnel and record retention resources of the agency. In addition, the administration section provides support services to 119 Commission employees and, pursuant to a memorandum of understanding, to 110 Highway Patrol officers assigned to the Commission. This section oversees the operating and leasing budgets, revenue collection, accounts payable, accounts receivable, cost accounting, procurement, facilities management, support services, human resources, asset inventory and records management. The Administration Section has had another very successful year, and continues to strive in creating and developing more effective and efficient ways of providing quality service.
The Commission recently completed their review by the State Auditor’s Office for Fiscal Years 2003, 2004 and 2005. This report can be viewed at the auditor web site (auditor.mo.gov) and our report number is 2006-32.
This past year staff was again successful in convincing the legislature of the need to insure core funding and did not request additional funding other than Governor recommended pay plans and related fringe increases. In addition, staff was able to satisfy all expenditure needs within core funding.

����
Staff was tasked with important reviews of important internal policies and procedures. Moreover, we worked on revamping reimbursement of expenses and state vehicles, equipment, supplies and property to comply with the new Department of Administration guidelines for these functions.
Our human relations section was instrumental in providing our IT section with great feedback when testing our new personnel timesheet system. The HR section provided important feedback and updated personnel files for the “employee export” and “employee list”. This read only system is now a resource to all employees. Through its patience and hard work, the HR section was instrumental in the successful recruitment for our new Chief Financial Analyst, a critical position to the Commission.
This August, the Missouri Gaming Commission reached a new milestone in gaming and bingo proceeds as we reached the $2 billion total amount going to education and veterans. The following data shows the proceeds, including interest earned, from riverboat gaming and charitable bingo for education and veterans:
Riverboat Gaming Bingo
FISCAL YEAR 1995 THRU 06/30/1995 $56,616,282.04 $6,253,703.96
FISCAL YEAR 1996 THRU 06/30/1996 $99,730,320.67 $4,684,178.52
FISCAL YEAR 1997 THRU 06/30/1997 $118,419,389.02 $4,615,579.50
FISCAL YEAR 1998 THRU 06/30/1998 $144,490,378.94 $4,384,174.86
FISCAL YEAR 1999 THRU 06/30/1999 $161,287,348.65 $4,412,395.16
FISCAL YEAR 2000 THRU 06/30/2000 $178,884,081.17 $4,304,256.18
FISCAL YEAR 2001 THRU 06/30/2001 $188,341,342.95 $3,912,466.82
FISCAL YEAR 2002 THRU 06/30/2002 $217,678,332.97 $3,414,569.38
FISCAL YEAR 2003 THRU 06/30/2003 $234,505,836.07 $3,352,993.61
FISCAL YEAR 2004 THRU 06/30/2004 $251,773,517.72 $2,996,554.14
FISCAL YEAR 2005 THRU 06/30/2005 $270,790,172.85 $2,798,494.88
FISCAL YEAR 2006 THRU 06/30/2006 $287,443,131.47 $2,578,716.60
TOTAL $2,209,960,134.52 $47,708,083.61
Bingo86.577,372$6991/03/60 URHT 6991 RAEY LACSIF36.008,74$7991/03/60 URHT 7991 RAEY LACSIF
TOTAL $321,576.31
TOTAL OF ALL PROCEEDS $2,257,989,794.44
PROCEEDS TO VETERANS
PROCEEDS TO EDUCATION

����
The Missouri Gaming Commission follows Section 313.835, RSMo, for operating fund transfers. It states: “All revenue received by the Commission from license fees, penalties, administrative fees, reimbursement by any excursion gambling boat operators for services provided by the Commission and admission fees authorized pursuant to the provision of Section 313.800 to 313.850, except that portion of the admission fee, not to exceed one cent, that may be appropriated to the compulsive gamblers fund as provided in section 313.820, shall be deposited in the state treasury to the credit of the ‘Gaming Commission Fund’ which is hereby created for the sole purpose of funding the administrative costs of the Commission, subject to appropriation.”
The statute also provides that the remaining net proceeds in the Gaming Commission Fund for each fiscal year are distributed to various funds in amounts defined in the statute. Additionally, the first five hundred thousand dollars shall be appropriated on a per capita basis to cities and counties that match the state portion and have demonstrated a need for community assistance. As a result, the amounts below have been transferred since inception from the Gaming Commission Fund:
Fiscal Year of Transfer
VeteransCommission Capital Improvement Trust
FundMissouri National Guard Trust Fund
Mo College Guarantee Fund
Early Childhood Development,
Education and Care Fund
CompulsiveGamblers Fund Totals
FY 1994/1995 $8,408,536.13 $8,408,536.13FY 1996 $23,487,182.59 $23,487,182.59FY 1997 $30,388,830.54 $30,388,830.54FY 1998 $35,905,493.46 $35,905,493.46
15.367,737,04$15.367,732,03$00.000,005,4$00.000,000,3$00.000,000,3$9991 YF57.308,717,44$57.308,712,43$00.000,005,4$00.000,000,3$00.000,000,3$0002 YF
FY 2001 $3,000,000.00 $3,000,000.00 $4,500,000.00 $30,691,290.20 $46,612.00 $41,237,902.20FY 2002 $3,000,000.00 $3,000,000.00 $4,500,000.00 $31,266,433.92 $398,074.00 $42,164,507.92FY 2003 $3,000,000.00 $3,000,000.00 $4,500,000.00 $33,947,613.45 $489,850.00 $44,937,463.45FY 2004 $6,000,000.00 $4,000,000.00 $5,000,000.00 $30,320,589.96 $489,850.00 $45,810,439.96FY 2005 $6,000,000.00 $4,000,000.00 $5,000,000.00 $30,969,773.54 $489,850.00 $46,459,623.54FY 2006 $6,000,000.00 $4,000,000.00 $5,000,000.00 $31,449,559.64 $143,668.48 $46,593,228.12
Totals $131,190,042.72 $27,000,000.00 $37,500,000.00 $253,100,827.97 $2,057,904.48 $450,848,775.17
Missouri Gaming CommissionSummary of Fund Transfers from Gaming Commission Fund

�6�6
The Commission report reflects all transfers for a given fiscal year to include end of year transfers that occur in July for June activity. These figures will vary from those shown in the state accounting system (SAMII) which does not have a means to account for lapse period transfers.Effective August 28, 2003, the 92nd Missouri General Assembly, at its First Regular Session, passed House Bill 444 changing the distribution of net proceeds in the Gaming Commission Fund each year. Under the provisions of this bill, the total distribution for each fund will be as follows: $6 million to the Veterans’ Commission Capital Improvement Trust Fund; $5 million to the Missouri College Guarantee Fund; $4 million to the Missouri National Guard Trust Fund; and the remaining net proceeds to the Early Childhood Development, Education and Care Fund.
INFORMATION TECHNOLOGYRay Pope, Director
The Information Technology (I.T.) Section has three basic functions: the installation and support of the microcomputer infrastructure, the development and implementation of process support applications, and the training of all Commission employees in the efficient use of the computer systems available. During FY06, we have continued to make progress in the application development process. We have deployed seven new applications and enhancements to six existing applications. We currently have three in testing. All of this was accomplished while we integrated 50% new hires on the development staff.
The development team did some mentoring with the MSHP Forms Management section. Other agencies in the state are utilizing some of our processes that we demonstrated to them via the Missouri State Windows Developer’s User Group.
The website has been routinely utilized for publishing the Commission press releases, agendas and minutes of Commission meetings. We have a link that allows us to add these items to the state website at the same time. The site contains updated financial information for casinos and charitable games. It also reflects current job postings.
We have stabilized our network environment and improved production stability. We have been monitoring the network configuration capacity and it seems to be able to accommodate the Commission’s data collection and delivery needs. By upgrading our desktop computers, we have been able to reduce the maintenance costs to the Commission’s remote locations. We have established a new secure link to the updated REJIS site for investigative research.
As new applications are developed, they are sent for internal testing to check for core functionality, error registry and overall performance and convergence of design specifications and standards. In FY 2006, seven new applications and six legacy enhancements were tested.

�7�7
Due to an Office Suite upgrade, internal training was provided to 190 employees of the Commission within a two month time period. Testing was also conducted on all internal forms and Microsoft Access databases to ensure continuity of operations following the deployment of an Office upgrade. If the training had not been conducted internally, it would have resulted in an approximate cost of $23,750 for the classes alone.
LEGALMichael Bushmann, General Counsel
The legal section provides legal advice to the Commissioners, Executive Director and other Commission staff regarding riverboat and charitable gaming issues, including review of financial transactions, interpretation of laws and regulations and analysis of policy proposals. The section assists the Commission in its quest to ensure that riverboats, bingo organizations, suppliers and individual licensees abide by all laws and rules of the Commission. In particular, Commission lawyers are responsible for drafting proposed disciplines against licensees for violations of laws or rules and presenting those disciplines to the Commission. The legal staff also serves as a liaison with the Attorney General’s office regarding discipline appeals and related matters. In FY 2006, 27 disciplines were proposed against Class A excursion gambling boat licensees. Eight of those disciplines have appeals currently pending. The disciplines proposed fines ranging from $5,000 to $50,000 for violations such as slot machine violations, allowing minors to enter casinos, failure to properly secure gaming assets, improper check cashing procedures, and failure to report gaming violations. Level I licensees hold gaming licenses for key managerial positions within a riverboat gaming operation, such as the general manager, controller and department managers. In FY 2006, one Level I licensee received a license suspension, which is still pending. Level II licensees hold gaming licenses for occupational positions such as dealers, slot machine technicians and cocktail servers, to name a few. In FY 2006, disciplinary actions, such as suspension and revocation, were proposed against 439 Level II licensees. In the past year, the bingo section proposed discipline against four bingo organizations and fined two bingo manufacturers. In addition, the bingo section denied requests from two applicants for a bingo license based on the applicants’ failure to establish suitability for licensure.

�8�8
CORPORATE SECURITIES AND FINANCEMartha S. LeMond, Chief Financial AnalystJennifer Bruns, Senior Auditor, Tax
The primary functions of the corporate securities and finance section are tax collection and auditing, financial reporting and financial suitability analysis, and gaming market analysis. Key to the operations of this section is the daily collection of the gaming tax and admission fees assessed upon casino licensees by statute. The critical role of the tax auditors is to audit approximately 4,015 tax returns for accuracy and completeness. Each casino is audited on-site by the tax auditors at least once per year to determine the accuracy and timeliness of their tax remittals, and to reconcile supporting documentation to the tax returns. The Commission provides a monthly market statistics report on its website.1 The report provides data on adjusted gross receipts (gaming revenue), patron volume, admission counts and the amounts of the gaming tax and admission fees collected. The corporate securities and finance section is responsible for analysis of the gaming markets in Missouri for the purpose of providing senior staff with information they need to make decisions regarding rule changes and regulatory resolution, and on occasion provide data regarding expansion. The section is responsible for the examination and analysis of licensees’ parent company’s business operations, as well as the financial operations of individual casino properties. The continuous examination of financial data includes the issuance of debt or equity, acquisitions, mergers and other transactions. This analysis is done to determine whether the financial suitability of the gaming entity will be impaired due to the operations and business activities of the parent companies.
1www.mgc.dps.mo.gov/finan_map.html

����
EXECUTIVE DIRECTOR
GENERAL COUNSEL
CHIEF FINANCE ANALYST
FISCAL & ADMIN. MANAGER B-2
DEP. DIR. ADMIN.FISCAL & ADMIN.
MANAGER B-3
LEGAL COUNSEL
PUBLIC SAFETY PROG. SPEC.(DAP ADMIN.)
DESIGNATED PRINCIPAL ASSISTANT
SENIORAUDITOR
TAX
AUDITOR I/IITAX (3)
COMPUTER INFO. TECH. SPEC. I
(2)
COMPUTER INFO. TECH. I/II/III
(6)
Info. Support Coordinator
HUMAN RELATIONS OFFICER I
RECRUITMENT
FISCAL & ADMIN.
MANAGER (B-2)
ACCOUNTANT III
DES. PRINCIPAL ASSISTANT
(ACCTS. REC.)
EXECUTIVE I(Records
Administrator)
EXECUTIVE I(PURCHASING)
OFFICE SUPPORT ASSIST.
(KEYBOARD)
OFFICE SERVICES ASSISTANT
ACCOUNT CLERK II
ADMIN. OFFICE SUPPORT ASSIST.
(OFFICE MANAGER) (2)
Captain MSHPGaming Division
MSHP Background/Enf.
(109)
PUBLIC SAFETY MANAGER B-1
(training)
PUBLIC SAFETY MANAGER B-1
(licensing)Financial Auditor
(4)
SR. OFFICESUPPORTASSIST.
(KEYBOARD)
(13)
PUBLIC INFORMATION COORDINATOR
ACCOUNTANT II(licensing)
OFFICE SUPPORT ASSIST.
(KEYBOARD)
(4)
AUDITOR IIComplianceSupervisor
AUDITOR II(AIC)
INVESTIGATOR II(4)
PUBLIC SAFETY MANAGER B-1
(bingo)
ADMIN. OFFICE SUPP. ASSIST.
SR. AUDITOR
AUDITOR I/II(2)
PUBLIC SAFETY MANAGER B-2
(GEM)
PUBLIC SAFETY MANAGER B-2
(GEM)
PUBLIC SAFETY MANAGER B-2
(GEM)
ADMIN.ANALYST III
DES. PRINCIPAL ASSISTANT
PERSONNELOFFICER I
PAYROLL/ BENEFITS
COMPUTER INFO. TECH.
SUPERVISOR II
July 2006
FISCAL & ADMIN. MANAGER B-2
(audit)
SR. AUDITOR(EAST SUP.)
SR. AUDITOR (WEST SUP.)
AUDITOR II(AIC)
AUDITOR I(3)
AUDITOR II(AIC)
AUDITOR I(3)
AUDITOR I(4)
AUDITOR I(3)
COMMISSIONERS(5)
ACCOUNTANT I
PARALEGAL
SR. OFFICE SUPPORT ASSIST.
(KEYBOARD)
SR. OFFICE SUPPORT ASSIST.
(KEYBOARD)
OFFICESUPPORT ASSIST.
(KEYBOARD)
AUDITOR II(AIC)
SR. OFFICE SUPPORT ASSIST.
(KEYBOARD)
OFFICE SUPPORT ASSIST.
(KEYBOARD)
EGDCoordinator
(2)
EGDSpecialist
(8)
RESEARCH ANALYST II
ADMIN.ANALYST II
DEP. DIR. ENF.PUBLIC SAFETYMANAGER B-3

20202020
Gaming Market ReportIntroduction
Missouri statutes assign the Commission responsibility for determining the number, location and type of riverboat casinos.1 The statute also authorizes the Commission to issue licenses to applicants that best serve the interests of Missouri, and to report on the competitiveness of the gaming industry in Missouri.2 The Gaming Market Report is prepared to satisfy the foregoing requirements of the state statute.
Statewide Market
Statewide gaming revenue increased approximately $61 million to just over $1.6 billion in FY 2006, with a 4% increase over FY 2005. There was a slight decrease of 2% in statewide patron volume, but an increase of 6.2% in statewide win-per-patron (WPP). The following table offers a statewide statistical comparison of fiscal years 2005 and 2006.
1Section 313.812.1, RSMo.2Section 313.805(1) and (3) and Section 313.837, RSMo.
FY 2006 FY 2005 % Change
Gaming Revenue 1,570,296,000 000,852,905,1 $ %0.4 $Patrons 24,644,000 000,641,52 %0.2- Win Per Patron 63.72 20.06 $ %2.6 $

2�2�
$977 $1,049
$1,212 $1,305$1,405
$1,509$1,570
0
200
400
600
800
1000
1200
1400
1600
1800M
illi
on
s
FY 2000 FY 2001 FY 2002 FY 2003 FY 2004 FY 2005 FY 2006
Statewide Gaming Revenue
Based on current statewide trends that show patron volume decreasing and gaming revenue and WPP levels on the rise (see following graphs), the Commission expects moderate growth to continue into the coming fiscal year with new technologies and marketing trends benefiting casino revenues.
Gaming Revenue Trend(trailing twelve months)
$1.35
$1.40
$1.45
$1.50
$1.55
$1.60
Jun-04
Jul-04
Aug-04
Sep-04
Oct-04
Nov-04
Dec-04
Jan-05
Feb-05
Mar-05
Apr-05
May-05
Jun-05
Jul-05
Aug-05
Sep-05
Oct-05
Nov-05
Dec-05
Jan-06
Feb-06
Mar-06
Apr-06
May-06
Jun-06
Billi
ons

2222
25
23 23 24 25 25 25
0.0
5.0
10.0
15.0
20.0
25.0
30.0
35.0
Mill
ions
FY 2000 FY 2001 FY 2002 FY 2003 FY 2004 FY 2005 FY 2006
Statewide PatronsFive Year Trend
WPP Trend(trailing twelve months)
$55
$57
$59
$61
$63
$65
Jun-04
Jul-04
Aug-04
Sep-04
Oct-04
Nov-04
Dec-04
Jan-05
Feb-05
Mar-05
Apr-05
May-05
Jun-05
Jul-05
Aug-05
Sep-05
Oct-05
Nov-05
Dec-05
Jan-06
Feb-06
Mar-06
Apr-06
May-06
Jun-06
2323
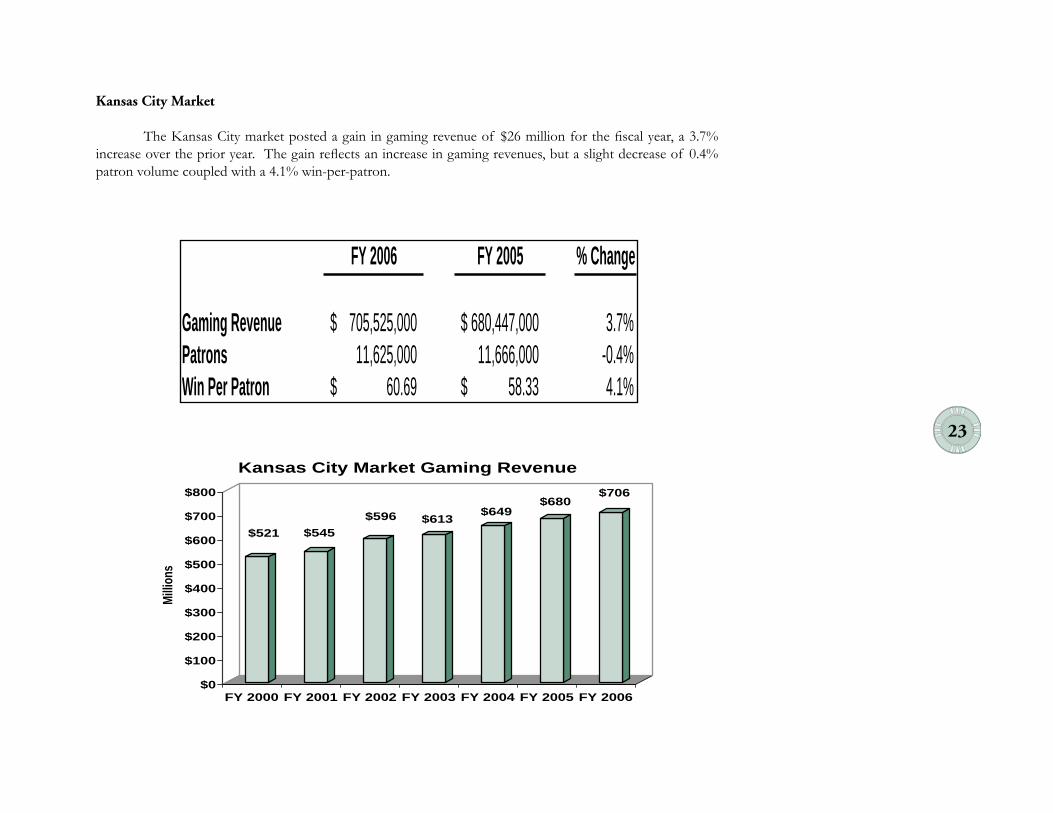
Kansas City Market
The Kansas City market posted a gain in gaming revenue of $26 million for the fiscal year, a 3.7% increase over the prior year. The gain reflects an increase in gaming revenues, but a slight decrease of 0.4% patron volume coupled with a 4.1% win-per-patron.
$521 $545
$596 $613$649
$680$706
$0
$100
$200
$300
$400
$500
$600
$700
$800
Mill
ions
FY 2000 FY 2001 FY 2002 FY 2003 FY 2004 FY 2005 FY 2006
Kansas City Market Gaming Revenue
FY 2006 FY 2005 % Change
Gaming Revenue 705,525,000$ 680,447,000 %7.3 $Patrons 11,625,000 11,666,000 -0.4%Win Per Patron 60.69$ 58.33$ 4.1%

2�2�
1312 11
11 11 12 12
0.0
5.0
10.0
15.0
20.0
25.0
30.0
Mill
ions
FY 2000 FY 2001 FY 2002 FY 2003 FY 2004 FY 2005 FY 2006
Kansas City Market PatronsFive Year Trend
St. Louis Market
The Missouri boats in the St. Louis market had another good year as gaming revenue increased 3.3% over the prior year to $692 million. The gain reflects primarily the increase in revenue despite a continuing decrease in patron volume on a high WPP that represented a 9.4% increase over win-per-patron for 2005. The St. Louis market will likely report steady growth in the coming year.
The Illinois boats in the St. Louis market posted gaming revenue of $290 million, a 5% increase on the prior year with only a 0.8% increase in patron volume.
FY 2006 FY 2005 % Change
Missouri BoatsGaming Revenue 691,831,000 000,889,966 $ %3.3 $
000,123,01snortaP 000,839,01 %6.5- Win Per Patron 67.03 52.16 $ $ 9.4%
Illinois BoatsGaming Revenue 289,768,000 000,290,672 $ %0.5 $
000,675,3snortaP 000,845,3 %8.0 Win Per Patron 81.03 28.77 $ $ 4.1%

2�2�
$411 $446$506 $553
$611$670 $692
0
100
200
300
400
500
600
700
800M
illio
ns
FY 2000 FY 2001 FY 2002 FY 2003 FY 2004 FY 2005 FY 2006
St. Louis Market Gaming RevenueMissouri Boats Only
11
10 10 10 11 11 10
0.0
5.0
10.0
15.0
20.0
25.0
30.0
Mill
ions
FY 2000 FY 2001 FY 2002 FY 2003 FY 2004 FY 2005 FY 2006
St. Louis Market PatronsMissouri Boats Only
Five Year Trend

2626
Other Markets
In the out-state markets, gaming revenue increased a strong 8.9% to $173 million with a 6.1% increase in patron volume and a 2.6% increase in win-per-patron. Technologies and marketing strategies have increased the revenues. The out-state markets will likely continue to post strong to moderate growth in the coming fiscal year as they continue to benefit from continuing use of new technology.
FY 2006 FY 2005 % Change
Gaming Revenue 172,940,000 000,228,851 $ %9.8 $Patrons 2,697,000 000,245,2 %1.6 Win Per Patron 64.12 84.26 $ $ 2.6%

2727
$45 $49
$110$139 $144
$159$173
$0
$50
$100
$150
$200
Mil
lio
ns
FY 2000 FY 2001 FY 2002 FY 2003 FY 2004 FY 2005 FY 2006
Other Market Gaming Revenue
11
2
32
33
-
0.5
1.0
1.5
2.0
2.5
3.0
Mill
ions
FY 2000 FY 2001 FY 2002 FY 2003 FY 2004 FY 2005 FY 2006
Other Market PatronsFive Year Trend

2828
St. Joseph
St. Jo FrontierCasino N. Kansas City
Harrah'sN. Kansas City
La Grange
Mark TwainCasino
Riverside
ArgosyCasino
Kansas City
Isle of CapriCasino
Boonville
Isle of CapriCasino
St. Charles
AmeristarCasino
St. Charles
Kansas City
AmeristarCasino
Kansas City
Maryland Heights
Harrah'sSt. Louis
St. Louis Downtown
President CasinoLaclede'sLanding
Caruthersville
CasinoAztar
Licensed CasinoLocations

2�2�
Charitable GamingCharitable gaming includes licensed bingo and associated games such as pull-tabs, merchandise coin
boards, and other “free” no charge promotional events. The operation of these games is restricted to qualified licensed, religious, charitable, fraternal, veteran, and service organizations. In addition, to qualify for the license, the organization must possess an Internal Revenue Service 501(c) (3), (4), (5), (7), (8), (10), (19), or 501 (d) exemption. Organizations must have been in continuing existence in this state for at least five years preceding making of application and have had at least twenty bona fide members during that period.
All proceeds derived from the conduct of bingo must be used for lawful, charitable, religious or philanthropic purposes of the organization, and no part of the net earnings may inure to the benefit of any individual member of the organization.
The chart below reflects the total number of licensees over the past three years.
The fees charged for the various licenses within the Charitable Games Division are as follows:
Regular Bingo License $50Special Bingo License $25Abbreviated Pull-Tab License $10
$5,000 - New$1,000 - Renewal$1,000 – New$ 500 – Renewal$150 – New per organization$100 – Renewal per organization
Supplier License
Manufacturer License
Hall Provider License -- The fee is based on the number of occasions conducted on the premises.

3030
The following chart represents the licensing fees collected for the past three fiscal years:
The current tax rate for bingo paper is 2/10ths of one cent per bingo face. The current tax rate for pull-tabs is 2% of the retail sales value of each pull-tab deal. The tax is remitted by the suppliers, and is due by the last day of the month following the month the product was sold. The supplier retains 2% of the total due for the cost of collection. The following chart represents the bingo tax collected over the past three fiscal years. All bingo tax is deposited into the Proceeds for Education Fund.
The Missouri Gaming Commission adopted one new bingo regulation and amended one bingo regulation in fiscal year 2006. Regulation 11 CSR 45-30.135 defines who is considered a bingo worker and clarifies certain duties which are not considered to be bingo workers. Regulation 11 CSR 45-30.355 was amended to remove the requirement that pull-tabs be sold in the immediate area where bingo is being conducted.

3�3�
The Charitable Games Division received 81 complaints, 69 of which were completed in the same year. The enforcement section conducted 28 inspections during fiscal year 2006. The audit staff assisted the enforcement section with 14 of these inspections. The audit section conducted 189 additional audits, including bingo product manufacturers, suppliers, and charity game operators. At the end of fiscal year 2004, the audit staff began setting appointments with the operators to meet with their representatives during the day to ensure the necessary records are available at the time of the audit. With continued refinement of this new audit approach, the audit staff was able to increase the number of organizations visited again this year. The new approach has been very well received by the bingo organizations because it allows the organization the opportunity to ensure that the appropriate representatives are present to ask any questions and receive assistance in areas of concern to them. Although certain circumstances still require unannounced audits and/or inspections to observe the actual conduct of the game, the new approach has been much more efficient and cost effective for the State of Missouri.
The Charitable Games Division implemented another new procedure within the last fiscal year, which appears to be very well received by newly licensed bingo organizations. The procedure calls for a member of the audit and administrative charitable games staff to visit new licensees within the first several months of their bingo operation. This process has allowed the staff to personally guide the organizations in the right direction, as well as enabled the licensees to immediately request assistance regarding any audit and/or administrative problems or concerns they may have already encountered. The volunteers appear to appreciate the personal contact and feel more relaxed in communicating with the staff when questions arise later. We have conducted 12 new licensee visits in fiscal year 2006.
Bingo statutes and regulations establish due dates for suppliers, hall providers and bingo operators to submit renewal applications and quarterly reports. Failure to meet the established due dates results in a penalty being assessed in the amount of $5 per day. Penalties are also assessed in some disciplinary cases. The penalty is collected by the Charitable Games Division and then forwarded to the County Treasurer in the county where the company or organization is located for deposit in the county school fund. During fiscal year 2006, the Charitable Games Division processed 138 penalties, which resulted in $11,422.50 additional funds for various schools throughout Missouri.
Officers and/or workers of charitable organizations participating in the management, conduct or operation of bingo, may only participate if they have never been convicted of a felony. The Commission performs a criminal background check on all names submitted to ensure that no felons are involved. During fiscal year 2006, approximately 24,029 record checks were performed and a total of 25 convicted felons were identified and excluded from participating in the management or operation of charitable games. Since the Gaming Commission took over the regulation of bingo in 1994, we have excluded 691 convicted felons from involvement in bingo.

32323232
Problem Gambling The Missouri Gaming Commission continues to reach out to the public to elevate general awareness of problem gambling and the resources available for those who are being negatively impacted by a gambling problem, or a loved one with a gambling problem. The Commission also continues to promote collaboration among groups and organizations to expand the recognition of problem gambling as a public health issue, and to enhance Missouri’s comprehensive approach to problem gambling outreach, prevention, and treatment. Public Health Model
The expansion of both legalized and illegal gambling opportunities challenges us to focus on the broad implications for both individual and community health. A public health model is well suited to address matters of healthy public policy, burden of illness, lifestyle behaviors and promotion of healthy decisions. Through seeking to understand the distribution and determinants of gambling problems in the general population and among subgroups, as well as the potential benefits, there is opportunity to develop effective strategies to protect vulnerable people, foster responsible choices with regard to gambling (for those who choose to participate in legal gambling activities), and improve the quality of community life. A multi-dimensional public health framework could stimulate a better understanding of gambling, help to illuminate the determinants of problem and pathological gambling, its potential consequences and the various opportunities for multi-level interventions.1 Like most public health issues, gambling involves a complex relationship among multiple determinants. When applied to gambling, the public health paradigm invites consideration of a broad array of prevention, harm minimization and treatment strategies targeting various elements of the model. Generally speaking, four steps are recommended:
1. Adopt strategic goals for gambling that provide a focus for public health action and accountability;
2. Endorse public health principles. The following are three primary principles: a. Ensure prevention is a community priority. b. Incorporate a multi-faceted mental health promotion approach. c. Foster personal and social responsibility for gambling policies and practices. 3. Adopt harm reduction strategies.
4. Allocate appropriate resources to identify and treat problem gamblers prior to their possible progression to pathological gambling.
The most cost effective way to assist potential problem gamblers and minimize the associated harms is to educate them about the risk factors so that those who are at risk either will choose to abstain from gambling or will make a concerted effort to follow the principles of gambling responsibly
1Shaffer, H.J., & Korn, D.A. (2002). Gambling and Related Mental Disorders: A Public Health Analysis. Annual Review of Public Health, vol. 23, p. 171-212.

3333
if they do choose to gamble, and they (or their family members) will at least recognize the symptoms of problem gambling early so that the individuals can work to avoid becoming engulfed by the condition.
Problem gambling is not an issue that can be attacked on any one front. It requires the attention, cooperation and resources of many public and private organizations. Only through a cooperative effort with other public agencies and providers of education and treatment services can this goal be efficiently and effectively achieved.
Missouri Alliance to Curb Problem Gambling – Missouri took its first steps toward a proactive public health model for problem gambling with the formation of the Missouri Alliance to Curb Problem Gambling (Alliance) in 1997. The Alliance, of which the Missouri Gaming Commission is an active member, brings together diverse groups who share a common interest of working on issues relating to problem gambling and consists of both governing and participating members.2 Working together allows the voting members to streamline the provision of problem gambling programs and services, prevent duplication of efforts, and to be fiscally efficient and maximize the benefit of each dollar available for problem gambling services. The Alliance is a pivotal component in Missouri’s innovative and comprehensive program to address the public health implications of gambling and problem gambling. Indeed, other states and countries have emulated various components of Missouri’s broad based approach to problem gambling prevention, outreach, harm minimization, and treatment, and have often expressed surprise at how much Missouri has accomplished with our limited budget.
Voluntary Exclusion Program – The Commission developed a unique voluntary exclusion program designed to provide problem gamblers with a means to acknowledge that they have a problem and to take personal responsibility for it. Although the Commission believes the voluntary exclusion program is helping many people who are suffering through a gambling problem, the Commission continues to review it and explore new ideas to get people the help they need.
This program was developed in 1996 in response to a request from a citizen who recognized the need for an external tool to self-exclude from all casinos in the state as a part of his recovery program. At that time, the consensus in the field among treatment professionals and researchers was that there is no cure for pathological gambling and, therefore, the program should be for life with no provision for removal. We have again received requests from residents who are seeking a problem gambling tool that fits their needs, and in response to these requests, as well as recent research, we have been investigating revising the program to offer a “menu” of self-exclusion options. While the research and treatment community still advocate that pathological gamblers are unable to resume gambling activity in a responsible manner, recent research also indicates that many individuals who experience problems from their gambling activity do not necessarily progress to the more extreme level of pathological gambler and may only experience episodic gambling problems during a traumatic life event, such as a divorce or loss of a loved one. These individuals could potentially benefit greatly from a tool that allows them to self-exclude statewide for a pre-set period of time.
2Governing members share the responsibility of administering the Alliance programs, and include: the Missouri Council on Problem Gambling Concerns, Inc., a non-profit advocacy group for problem gamblers; the Missouri Department of Mental Health; the Missouri Gaming Commission; the Missouri Lottery; the Port Authority of Kansas City; and the Missouri Gaming Association, a private trade organization that represents riverboat casino operators. Participating members are non-voting members who desire to participate in Alliance activities and share their unique expertise and viewpoints to assist in comprehensively addressing problem gambling issues in the state. Participating members could include local government entities that host licensed gambling activities, private social service organizations, mental health advocates, researchers, counselors and counseling agencies, education institutions, consumer credit counseling agencies, charitable gaming operators and chambers of commerce. For more information about the Alliance or becoming a participating member, please contact Melissa Stephens at 573-526-4080 or visit the Web site, www.888BetsOff.org.

3�3�
Furthermore, there are also a number of pathological gamblers who have expressed that they are not yet ready to commit to a lifetime self-exclusion, but are interested in some other period of self-exclusion. Anecdotal evidence has shown that many of these individuals exclude with individual Class A Licensees and later choose to place themselves on the List. Therefore, they too could benefit from the availability of increased time frame options for the self-exclusion period.
There were more than 10,300 individuals on the List at the close of the fiscal year. Approximately 160 inquiries seeking information regarding placement on the List, and approximately 135 applications were received each month. The quantity of applications for placement on the List of Disassociated Persons (also known as the Voluntary Exclusion Program) for FY 2006 was slightly lower than the quantity received in FY 2005, with approximately a 0.4 percent decrease.
Missouri Problem Gambling Awareness – The preliminary results from Missouri’s 2004 Behavior Risk Factor Surveillance System (BRFSS) indicated 31.7 percent of the surveyed Missouri adults acknowledged gambling in the prior 12 months. However, Missouri Class A licensees reported more than 40 percent of Missouri adults visited Missouri’s excursion gambling boats and the Missouri Lottery’s market research indicated more than 70 percent of Missouri adults reported purchasing a Lottery ticket during the same time period.
Thus, rather than indicating that less than 1/3 of Missouri adults have gambled in the past year, this result supports the anecdotal evidence from the Alliance’s outreach efforts that many Missourians do not identify many locally-available and/or socially-accepted gambling activities as “gambling” and supports the need for continued education and outreach efforts. This is not a phenomenon that is unique to Missouri, but rather appears to be a hurdle encountered throughout the nation.
This is a critical issue to be addressed. If individuals do not recognize that they are engaging in gambling activities, then it is unlikely that they would identify the negative consequences and/or warning signs as an indication of a gambling problem. In the absence of accurately identifying the problem, they are less likely to access the appropriate resources for help. Thus, the education and outreach conducted by Alliance members is critical to helping address this deficiency in public awareness.
Education and Outreach Responsible Gaming Education Month (RGEM) – The Missouri Alliance to Curb Problem Gambling again sponsored a Missouri Responsible Education Month in August 2005. Events for the awareness month included an educational exhibit at the 2005 Missouri Black Expo; an exhibit, one focus group and an educational track on underage addiction prevention and problem gambling issues at the National Youth Leadership Conference in St. Louis; an exhibit on illegal gambling devices and on therapeutic justice for gambling related crimes at the Fall training conference for the Missouri Prosecuting Attorneys; and hosting the Midwest Conference on Problem Gambling and Substance Abuse. Each casino also provided training by the director of the Missouri’s problem gambling help line

3�3�
for its employees on identifying problem or compulsive gamblers, as well as how to provide them with help and appropriate referrals. The Missouri Gaming Association also launched a new awareness campaign for patrons.
Missouri is the only state, to our knowledge, to set aside one month to highlight awareness activities promoting problem gambling outreach and education. In 1999, Missouri was also the first state in the country to set aside a week to promote responsible gaming and to educate its residents about the programs available to help problem gamblers. The response to the awareness week was so positive that awareness events gradually were held throughout the month. Thus, in 2003 the Alliance requested to expand from an awareness week to an awareness month. Responsible Gaming Education Week and RGEM have been extremely valuable tools to promote awareness of problem gambling as a public health issue.
Although the Alliance provides outreach, presentations, and exhibits throughout the year, the events provided within the context of a declared awareness month yield a much greater opportunity for media coverage, and, therefore, reach many more citizens. The Alliance has been able to note spikes in the utilization of various problem gambling programs and services following each of the past RGEWs and RGEMs. The Missouri Gaming Commission and other members of the Alliance have been diligently working on the events that will be the highlights of the 2006 awareness month. These events will include an educational exhibit at the Missouri Institute on Minority Aging; an exhibit and one focus group on underage addiction prevention and problem gambling issues at the NCADA National Youth Leadership Conference in St. Louis; a dual-topic educational exhibit on illegal gambling devices and on therapeutic justice for gambling related crimes at the Fall training conference for the Missouri Prosecuting Attorneys; and hosting the 2006 Midwest Conference on Problem Gambling and Substance Abuse. The Missouri Gaming Association is also providing special training on problem gambling issues for employees at each Class A licensee.
Midwest Conference on Problem Gambling and Substance Abuse – The Midwest Conference on Problem Gambling and Substance Abuse is the result of a collaborative effort with representatives from a variety of state agencies and organizations in Missouri, Iowa, Kansas, Nebraska, and Oklahoma (which recently joined the Midwest Conference Committee) to jointly coordinate this regional conference, which has been supported in part by funds from the Substance Abuse and Mental Health Services Administration (SAMHSA), U.S. Department of Health and Human Services.
The second annual conference, held August 24 - 26, 2005, was again well-received and contributed to expanding the awareness of problem gambling as a potential co-occurring disorder among mental health and substance abuse clients. Furthermore, as a result of collaborations at the conference, SAMHSA’s National Clearinghouse for Alcohol and Drug Information (NCADI) began offering its first resources specific to problem gambling, which were made available to clinicians, clinical administrators, and the general public, through its on-line catalog.
Missouri is proud to host the third annual Midwest Conference on Problem Gambling and Substance Abuse at the Hyatt Regency-Crown Center in Kansas City on August 16 - 18, 2006. Due to the continued success of the 2005 conference, SAMHSA chose to again provide some discretionary funding to assist in funding the

3636
2006 conference. The conference will formally open with a keynote address and a plenary session on integrating problem gambling and substance abuse in prevention and treatment on Wednesday evening. This keynote and plenary session are open to the public at no cost. A pre-conference workshop on ethics has been added to the conference this year, and keynote speakers include H. Westley Clark, director of the Center for Substance Abuse Treatment under SAMHSA; Loreen Rugle, coordinator of the Gambling Treatment Program at the Louis Stokes Department of Veterans Affairs Medical Center, Brecksville Division, as well as the clinical and research director for Trimeridian, Inc.; and Robert Ladouceur, professor of psychology at Universite Laval in Quebec City. Registrations are still arriving for the conference, but already include attendees from throughout the U.S., as well as Canada and Australia.3
The Conference Committee has already joined efforts with the National Council on Problem Gambling to plan their joint conference, which will be held in Kansas City during June 2007. The National Council on Problem Gambling voted to host their 2007 conference in Missouri as a result of the success of the first Midwest Conference that was held in August 2004. The Missouri Gaming Commission was integral in developing a further collaboration between the planning committee for the 2007 joint NCPG/Midwest Conference and the North American Gaming Regulators Association (NAGRA).
Underage Prevention Efforts – The Alliance members jointly sponsor two in-school programs on preventing problem gambling and other addictive behaviors. Due to the common risk factors and warning signs between many of the addictive and compulsive behaviors, the need for schools to streamline their efforts on addiction education, as well as the reluctance to address problem gambling as a potential issue, the Alliance has created two innovative programs for middle-school and junior high students that use an “umbrella approach” to addressing addiction and high-risk behaviors. Both programs include extra information on problem gambling issues to help address the disparity in information and resources available. “Addiction – the Game No One Wins” is an assembly program featuring a dramatic duo who provide education on problem gambling issues.
Speakers Bureau and Traveling Educational Exhibits – The Missouri Gaming Commission participated in more than 63 speaking engagements and exhibits during FY 2006. Through these efforts Commission staff provided gambling outreach services to more than 40,100 individuals.
Speakers are available to provide presentations to groups and organizations throughout the state on a variety of topics relating to problem gambling and the guidelines for gambling responsibly.4 All presentations are free of charge and include information about the resources available in Missouri for residents who have a gambling problem, or loved one with a gambling problem.
3Please visit the conference Web site at http://www.888BetsOff.org/links/midwest_conference.shtm for a full list of presenters, agenda items, sponsors and details on conference happenings.
4To request a presentation or exhibit for an event in your area, please contact Melissa Stephens at 573-526-4080.

3737
Appendix Contents
Fiscal Year2006
ReportAppendices
Missouri Gaming Commission Fund Balance Report – Fiscal Year 2006 ................ 38Fiscal Year 2006 Project Summary ...................................................................................... 39Admission Fee Summary ....................................................................................................... 40Gaming Tax Summary ............................................................................................................ 41Ameristar – Kansas City ........................................................................................................ 42Ameristar – St. Charles .......................................................................................................... 44Argosy Riverside Casino ........................................................................................................ 46Aztar Casino – Caruthersville .............................................................................................. 48Harrah’s Maryland Heights ................................................................................................... 50 Harrah’s North Kansas City .................................................................................................. 52Isle of Capri – Boonville ........................................................................................................ 54Isle of Capri – Kansas City ................................................................................................... 56Mark Twain Casino – LaGrange .......................................................................................... 58President Casino on the Admiral ........................................................................................ 60St. Jo Frontier Casino ............................................................................................................. 62Home Dock Communities’ Use of Gaming Funds ......................................................... 64City of Boonville ..................................................................................................................... 64City of Caruthersville ............................................................................................................. 65City of Kansas City ................................................................................................................. 66City of LaGrange ..................................................................................................................... 67City of Maryland Heights ..................................................................................................... 68City of North Kansas City .................................................................................................... 69City of Riverside ...................................................................................................................... 70City of St. Charles ................................................................................................................... 71City of St. Joseph ..................................................................................................................... 72County of Buchanan .............................................................................................................. 73City of St. Louis ....................................................................................................................... 74Missouri Gaming Commission Actions – FY 2006 ........................................................ 75Contacting MGC ..................................................................................................................... 76
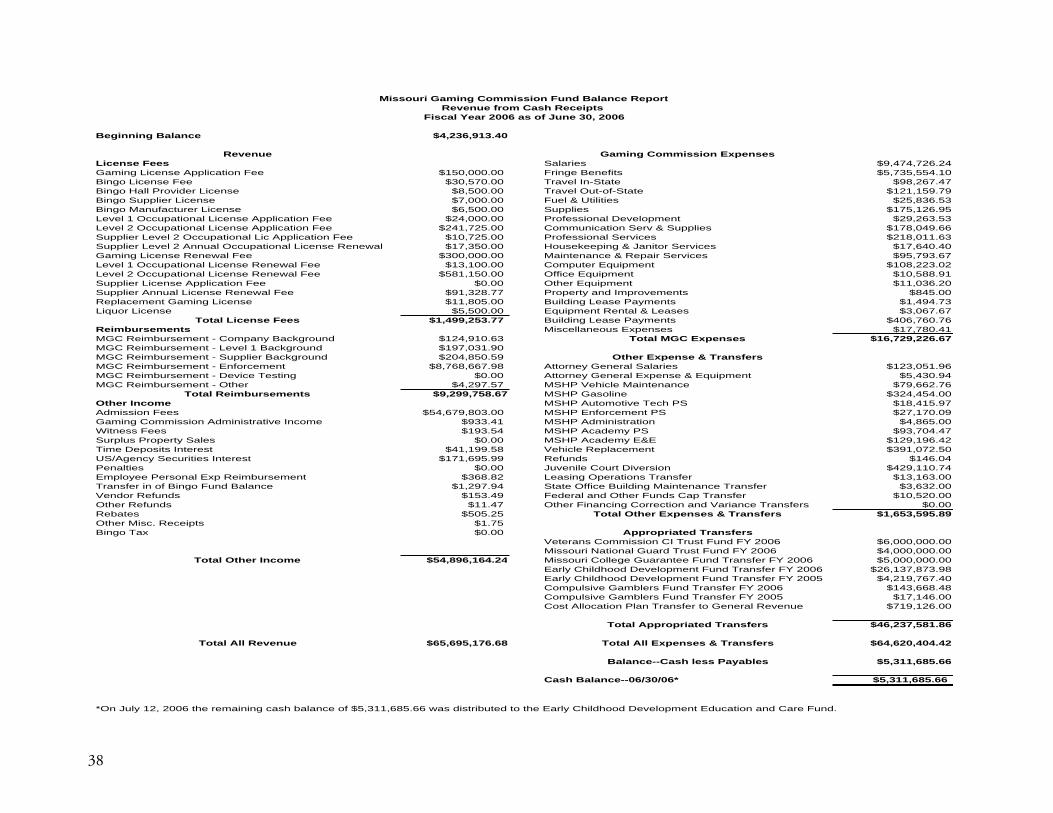
38
04.319,632,4$ecnalaB gninnigeB
sesnepxE noissimmoC gnimaGeuneveRLicense Fees 42.627,474,9$seiralaS
01.455,537,5$stifeneB egnirF00.000,051$eeF noitacilppA esneciL gnimaG74.762,89$etatS-nI levarT00.075,03$eeF esneciL ogniB97.951,121$etatS-fo-tuO levarT00.005,8$esneciL redivorP llaH ogniB35.638,52$seitilitU & leuF00.000,7$esneciL reilppuS ogniB59.621,571$seilppuS00.005,6$esneciL rerutcafunaM ogniB35.362,92$tnempoleveD lanoisseforP00.000,42$eeF noitacilppA esneciL lanoitapuccO 1 leveL66.940,871$seilppuS & vreS noitacinummoC00.527,142$eeF noitacilppA esneciL lanoitapuccO 2 leveL36.110,812$secivreS lanoisseforP00.527,01$eeF noitacilppA ciL lanoitapuccO 2 leveL reilppuS04.046,71$secivreS rotinaJ & gnipeekesuoH00.053,71$laweneR esneciL lanoitapuccO launnA 2 leveL reilppuS76.397,59$secivreS riapeR & ecnanetniaM00.000,003$eeF laweneR esneciL gnimaG20.322,801$tnempiuqE retupmoC00.001,31$eeF laweneR esneciL lanoitapuccO 1 leveL19.885,01$tnempiuqE eciffO00.051,185$eeF laweneR esneciL lanoitapuccO 2 leveL02.630,11$tnempiuqE rehtO00.0$eeF noitacilppA esneciL reilppuS00.548$stnemevorpmI dna ytreporP77.823,19$eeF laweneR esneciL launnA reilppuS37.494,1$stnemyaP esaeL gnidliuB00.508,11$esneciL gnimaG tnemecalpeR76.760,3$sesaeL & latneR tnempiuqE00.005,5$esneciL rouqiL
77.352,994,1$seeF esneciL latoT 67.067,604$stnemyaP esaeL gnidliuBReimbursements 14.087,71$sesnepxE suoenallecsiMMGC Reimbursement - Company Background $124,910.63 76.622,927,61$sesnepxE CGM latoTMGC Reimbursement - Level 1 Background $197,031.90MGC Reimbursement - Supplier Background $204,850.59 Other Expense & Transfers
69.150,321$seiralaS lareneG yenrottA89.766,867,8$tnemecrofnE - tnemesrubmieR CGM49.034,5$tnempiuqE & esnepxE lareneG yenrottA00.0$gnitseT eciveD - tnemesrubmieR CGM67.266,97$ecnanetniaM elciheV PHSM75.792,4$rehtO - tnemesrubmieR CGM
76.857,992,9$stnemesrubmieR latoT 00.454,423$enilosaG PHSMOther Income 79.514,81$SP hceT evitomotuA PHSM
90.071,72$SP tnemecrofnE PHSM00.308,976,45$seeF noissimdA00.568,4$noitartsinimdA PHSM14.339$emocnI evitartsinimdA noissimmoC gnimaG74.407,39$SP ymedacA PHSM45.391$seeF ssentiW24.691,921$E&E ymedacA PHSM00.0$selaS ytreporP sulpruS05.270,193$tnemecalpeR elciheV85.991,14$tseretnI stisopeD emiT40.641$sdnufeR99.596,171$tseretnI seitiruceS ycnegA/SU47.011,924$noisreviD truoC elinevuJ00.0$seitlaneP00.361,31$refsnarT snoitarepO gnisaeL28.863$tnemesrubmieR pxE lanosreP eeyolpmE00.236,3$refsnarT ecnanetniaM gnidliuB eciffO etatS49.792,1$ecnalaB dnuF ogniB fo ni refsnarT00.025,01$refsnarT paC sdnuF rehtO dna laredeF94.351$sdnufeR rodneV00.0$srefsnarT ecnairaV dna noitcerroC gnicnaniF rehtO74.11$sdnufeR rehtO
52.505$setabeR Total Other Expenses & Transfers $1,653,595.8957.1$stpieceR .csiM rehtO00.0$xaT ogniB Appropriated Transfers
Veterans Commission CI Trust Fund FY 2006 $6,000,000.00Missouri National Guard Trust Fund FY 2006 $4,000,000.00
2.461,698,45$emocnI rehtO latoT 4 Missouri College Guarantee Fund Transfer FY 2006 $5,000,000.00Early Childhood Development Fund Transfer FY 2006 $26,137,873.98Early Childhood Development Fund Transfer FY 2005 $4,219,767.40Compulsive Gamblers Fund Transfer FY 2006 $143,668.48Compulsive Gamblers Fund Transfer FY 2005 $17,146.00Cost Allocation Plan Transfer to General Revenue $719,126.00
Total Appropriated Transfers $46,237,581.86
24.404,026,46$srefsnarT & sesnepxE llA latoT86.671,596,56$euneveR llA latoT
Balance--Cash less Payables $5,311,685.66
66.586,113,5$*60/03/60--ecnalaB hsaC
*On July 12, 2006 the remaining cash balance of $5,311,685.66 was distributed to the Early Childhood Development Education and Care Fund.
Missouri Gaming Commission Fund Balance ReportRevenue from Cash Receipts
Fiscal Year 2006 as of June 30, 2006

39
Fiscal Year 2006 Project Summary
GNIMAGDETAMITSEECAPSTOLSELBATLATIPACGNIMAGDETSUJDANOISSIMDAGNINEPONOITACOL / ONISAC
DATE ADMISSIONS FEES (a) GROSS RECEIPTS TAX (b) INVESTMENT * EMPLOYEES GAMES MACHINES (SQ FT)
President / St. Louis 27-May-94 3,367,614 6,735,228 956,897,17 $ $ 14,359,732 000,000,47 $ 895 $ 28 816 53,800
Ameristar / St. Charles 27-May-94 9,966,008 19,932,016 901,484,903 $ 228,698,16 $ $ $431,000,000 1,853 98 3,237 130,000
Argosy / Riverside 22-Jun-94 4,788,685 9,577,370$ 151,424,672 439,482,03 $ $ 173,400,000 009 $ 47 1,768 62,000
St. Jo Frontier / St. Joseph 24-Jun-94 1,211,427 2,422,854 345,428,23 $ 909,465,6 $ $ 30,400,000 703 $ 11 591 18,000
Harrah's / North Kansas City 22-Sep-94 7,054,238 14,108,476 959,647,102 $ 293,943,04 $ $ 338,400,000 936,1 $ 62 1,851 63,300
Aztar / Caruthersville 27-Apr-95 940,682 1,881,364 480,054,82 $ 710,096,5 $ $ 62,600,000 382 $ 22 649 21,400
Isle of Capri / Kansas City 18-Oct-96 3,929,087 7,858,174 035,544,29 $ $ 18,489,106 000,004,96 $ 646 $ 37 1,504 45,300
Ameristar / Kansas City 16-Jan-97 8,941,225 17,882,450 172,809,952 $ 456,189,15 $ $ 359,000,000 808,1 $ 93 2,994 140,000
Harrah's / Maryland Heights 11-Mar-97 9,745,008 19,490,016 364,845,013 $ 396,901,26 $ $ 408,000,000 399,1 $ 94 2,833 120,000
Isle of Capri / Boonville 06-Dec-01 2,677,922 5,355,844 803,150,97 $ $ 15,810,262 000,000,38 $ 606 $ 34 899 28,000
Mark Twain / LaGrange 25-Jul-01 1,265,786 2,531,572 847,316,23 $ 057,225,6 $ $ 16,500,000 542 $ 14 591 18,000
286,788,35SLATOT DNARG 107,775,364 643,692,075,1 $ 962,950,413 $ $ 2,045,700,000 878,01 $ 540 17,733 699,800
* Figures reflect the current operating property amounts carried on the casino balance sheet at cost.(a) 50% of Admission Fees go to the State, with the remaining 50% to the Local Home Dock.(b) 90% of Gaming Taxes go to the State, with the remaining 10% to the Local Home Dock. The figures published in this report are subject to adjustment.

40
ADMISSION FEE SUMMARY
Fiscal Year Ended June 30, 2006
ETATSRATSIREMARATSIREMAIRPAC FO ELSIIRPAC FO ELSIS'HARRAHS'HARRAHMONTH ARGOSY AZTAR NKC MH KC BOONVILLE KC MARK TWAIN PRESIDENT SC ST. JO TOTAL
Jul-05 862,378 174,942 1,181,912 1,822,316 704,644 490,480 1,636,728 246,366 575,936 1,732,688 206,820 9,635,210Aug-05 782,324 152,714 1,123,662 1,565,804 630,196 437,788 1,483,528 228,852 541,598 1,673,146 202,854 8,822,466Sep-05 760,154 145,422 1,128,768 1,562,654 667,476 420,446 1,412,582 194,400 562,178 1,586,190 193,326 8,633,596Oct-05 754,758 148,376 1,229,944 1,639,520 696,774 420,786 1,490,032 198,898 541,526 1,594,782 193,006 8,908,402Nov-05 764,536 144,118 1,265,372 1,606,918 594,456 412,474 1,460,464 198,682 550,148 1,599,010 184,408 8,780,586Dec-05 789,760 152,220 1,288,644 1,638,718 616,570 423,574 1,512,434 194,024 570,864 1,720,046 183,002 9,089,856Jan-06 821,118 169,194 1,300,078 1,674,226 672,734 477,750 1,561,320 222,566 541,760 1,757,592 201,754 9,400,092Feb-06 771,340 164,034 1,230,920 1,619,018 663,644 447,114 1,516,642 209,256 578,716 1,786,842 210,076 9,197,602Mar-06 864,144 170,586 1,208,732 1,646,580 675,090 498,026 1,563,264 227,698 659,692 1,781,036 224,256 9,519,104Apr-06 801,220 141,100 1,053,688 1,544,010 633,296 435,892 1,429,060 200,730 556,898 1,598,736 208,316 8,602,946May-06 796,370 160,036 1,052,742 1,600,744 646,300 437,772 1,440,800 211,208 545,542 1,583,364 211,424 8,686,302Jun-06 809,268 158,622 1,044,014 1,569,508 656,994 453,742 1,375,596 198,892 510,370 1,518,584 203,612 8,499,202
TOTAL 9,577,370 1,881,364 14,108,476 19,490,016 7,858,174 5,355,844 17,882,450 2,531,572 6,735,228 19,932,016 2,422,854 107,775,364
Fiscal Year Ended June 30, 2005
ETATSRATSIREMARATSIREMAIRPAC FO ELSIIRPAC FO ELSIS'HARRAHS'HARRAHMONTH ARGOSY AZTAR NKC MH KC BOONVILLE KC MARK TWAIN PRESIDENT SC ST. JO TOTAL
Jul-04 839,970 137,912 1,078,816 1,741,954 833,266 522,698 1,690,134 187,434 672,826 1,887,106 154,892 9,747,008Aug-04 756,408 125,522 1,075,786 1,775,474 764,506 457,660 1,498,702 167,362 631,224 1,788,858 148,746 9,190,248Sep-04 730,064 138,082 1,028,762 1,743,492 753,426 458,236 1,396,006 163,096 626,118 1,777,364 142,362 8,957,008Oct-04 757,884 141,400 1,093,708 1,804,908 808,712 462,160 1,497,116 165,044 615,116 1,764,988 147,228 9,258,264Nov-04 693,930 128,374 977,952 1,703,312 722,298 410,236 1,394,152 157,986 567,686 1,730,766 135,062 8,621,754Dec-04 869,730 127,630 1,107,022 1,608,980 780,498 420,016 1,574,008 172,406 551,658 1,844,944 154,330 9,211,222Jan-05 884,412 152,898 996,124 1,543,400 714,326 430,812 1,487,762 163,658 571,138 1,785,828 146,154 8,876,512Feb-05 857,892 160,204 1,004,846 1,510,010 736,586 454,964 1,509,762 217,148 577,960 1,777,282 188,664 8,995,318Mar-05 870,454 153,752 1,087,396 1,599,318 782,540 476,004 1,549,692 214,058 619,350 1,827,786 185,918 9,366,268Apr-05 845,504 158,630 1,033,030 1,538,940 724,974 411,904 1,477,886 204,770 591,856 1,759,936 186,966 8,934,396May-05 842,514 158,196 991,184 1,582,448 704,928 422,298 1,481,028 201,318 550,110 1,694,288 200,460 8,828,772Jun-05 803,896 153,412 979,976 1,583,496 661,126 420,220 1,451,964 195,784 529,666 1,588,500 192,588 8,560,628
TOTAL 9,752,658 1,736,012 12,454,602 19,735,732 8,987,186 5,347,208 18,008,212 2,210,064 7,104,708 21,227,646 1,983,370 108,547,398

41
GAMING TAX SUMMARY
Fiscal Year Ended June 30, 2006
ETATSRATSIREMARATSIREMAIRPAC FO ELSIIRPAC FO ELSIS'HARRAHS'HARRAHMONTH ARGOSY AZTAR NKC MH KC BOONVILLE KC MARK TWAIN PRESIDENT SC ST. JO TOTAL
Jul-05 2,476,725 517,404 3,490,246 5,601,276 1,595,513 1,411,638 4,623,702 626,960 1,188,032 5,421,679 509,372 27,462,548Aug-05 2,308,676 430,045 3,215,263 4,732,267 1,452,740 1,200,410 4,171,463 554,226 1,127,264 5,006,711 472,518 24,671,583Sep-05 2,234,418 422,666 3,258,285 4,828,072 1,564,019 1,240,082 4,048,141 511,862 1,174,194 4,925,581 500,039 24,707,356Oct-05 2,345,643 440,013 3,416,880 5,121,631 1,604,292 1,263,547 4,321,189 526,241 1,143,770 5,036,901 528,723 25,748,829Nov-05 2,409,918 460,855 3,380,794 4,991,385 1,400,886 1,185,611 4,158,369 519,575 1,147,871 5,026,910 533,569 25,215,744Dec-05 2,474,889 437,894 3,550,596 5,046,703 1,451,204 1,224,232 4,358,707 511,755 1,191,422 5,278,035 524,652 26,050,088Jan-06 2,614,872 494,848 3,441,578 5,303,765 1,552,237 1,352,013 4,554,660 560,365 1,184,654 5,390,808 566,517 27,016,317Feb-06 2,478,558 512,941 3,477,697 5,078,281 1,618,582 1,425,435 4,409,757 547,145 1,306,985 5,329,736 560,721 26,745,839Mar-06 2,978,732 526,032 3,600,622 5,615,280 1,681,927 1,399,644 4,625,422 599,184 1,394,882 5,587,062 629,350 28,638,136Apr-06 2,676,341 456,457 3,159,582 5,262,616 1,529,824 1,302,206 4,315,322 535,714 1,227,158 5,096,470 580,903 26,142,593May-06 2,650,162 498,443 3,191,856 5,258,112 1,486,238 1,396,314 4,233,739 525,297 1,113,487 4,934,454 573,103 25,861,204Jun-06 2,636,000 492,420 3,165,993 5,270,305 1,551,645 1,409,131 4,161,184 504,424 1,160,013 4,862,475 585,442 25,799,033
TOTAL 30,284,934 5,690,017 40,349,392 62,109,693 18,489,106 15,810,262 51,981,654 6,522,750 14,359,732 61,896,822 6,564,909 314,059,269
Fiscal Year Ended June 30, 2005
ETATSRATSIREMARATSIREMAIRPAC FO ELSIIRPAC FO ELSIS'HARRAHS'HARRAHMONTH ARGOSY AZTAR NKC MH KC BOONVILLE KC MARK TWAIN PRESIDENT SC ST. JO TOTAL
Jul-04 2,545,895 382,204 3,256,665 5,076,120 1,810,319 1,415,803 4,394,424 471,012 1,285,161 5,234,891 412,920 26,285,414Aug-04 2,425,576 384,712 3,116,605 5,012,429 1,887,309 1,315,139 3,955,883 444,627 1,204,534 4,760,613 396,108 24,903,534Sep-04 2,283,882 417,369 3,167,456 4,939,158 1,655,430 1,263,958 3,767,220 419,241 1,174,036 4,640,057 382,984 24,110,789Oct-04 2,381,321 443,778 3,177,216 5,186,756 1,707,754 1,313,786 4,066,718 449,398 1,235,886 4,809,062 422,891 25,194,569Nov-04 2,192,976 396,179 2,934,717 4,925,218 1,577,877 1,188,471 3,864,554 438,116 1,140,278 4,702,849 387,848 23,749,082Dec-04 2,501,309 376,280 3,296,304 4,960,406 1,598,100 1,188,078 4,127,989 463,505 1,126,273 4,979,277 423,661 25,041,182Jan-05 2,558,002 482,690 2,914,643 5,045,356 1,607,051 1,216,557 4,072,653 428,615 1,158,266 4,975,138 388,252 24,847,224Feb-05 2,576,034 491,493 2,894,194 4,673,307 1,548,662 1,259,737 3,865,931 589,669 1,173,299 4,898,070 549,893 24,520,288Mar-05 2,826,489 462,900 3,253,402 5,296,310 1,871,202 1,383,035 4,386,989 580,627 1,306,622 5,326,885 511,543 27,206,002Apr-05 2,735,080 489,328 3,170,873 5,005,721 1,590,275 1,265,519 4,286,527 549,154 1,262,452 5,255,103 477,985 26,088,018May-05 2,536,049 476,149 2,902,647 5,121,051 1,741,599 1,293,831 4,216,655 525,602 1,145,376 5,103,144 509,155 25,571,257Jun-05 2,364,226 438,935 2,902,926 4,911,946 1,521,770 1,242,161 4,052,041 474,247 1,056,967 4,889,599 479,417 24,334,235
TOTAL 29,926,838 5,242,016 36,987,648 60,153,778 20,117,349 15,346,073 49,057,584 5,833,815 14,269,148 59,574,688 5,342,656 301,851,593

42
Ameristar - Kansas CityMonthly Gaming Revenue
$12.0
$14.0
$16.0
$18.0
$20.0
$22.0
$24.0
$26.0
Jul Aug Sep Oct Nov Dec Jan Feb Mar Apr May Jun
Mill
ions
FY 2006
FY 2005
Monthly Patrons
250
275
300
325
350
375
400
Jul Aug Sep Oct Nov Dec Jan Feb Mar Apr May Jun
Thou
sand
s
FY 2006
FY 2005
General Manager: David Albrecht3200 N Ameristar DriveKansas City, Missouri 64161(816) 414-7000
Date Licensed: December 19, 2000License Expiration Date: December 21, 2006Gaming Space: 140,000 Square FeetElectronic Gaming Devices: 2,994Table Games: 93Buffet, (6) Specialty Restaurants, Deli and Food CourtParking Garage200 Room Hotel18 Screen Movie Theatre, Concert HallTotal Employee Compensation: $56,745,445Real Estate/Personal Property Tax: $4,995,631State Sales Tax: $2,289,014Charitable Donations: $521,444Total Employment: 1,808Minority Employment: 633Female Employment: 865Minority Salaried Positions: 52Female Salaried Positions: 117

43
Fiscal year ended June 30, 2006
NIW YLIADNIW YLIADREP NIWTOLSTOLSELBATELBATLATOTMONTH AGR AGR WIN % AGR HOLD % PATRONS PATRON ADMISSIONS PER TABLE PER SLOT
Jul-05 $23,118,512 $2,669,924 22.45% $20,448,588 8.11% 377,841 $61.19 818,364 $832 $227Aug-05 $20,857,314 $2,455,687 22.81% $18,401,627 8.05% 343,518 $60.72 741,764 $765 $204Sep-05 $20,240,703 $2,285,478 22.37% $17,955,226 8.01% 326,540 $61.99 706,291 $712 $199Oct-05 $21,605,944 $2,648,025 24.78% $18,957,919 7.98% 344,286 $62.76 745,016 $825 $210Nov-05 $20,791,846 $2,458,573 23.55% $18,333,273 8.09% 332,117 $62.60 730,232 $828 $203Dec-05 $21,793,534 $2,699,166 23.55% $19,094,368 8.04% 340,403 $64.02 756,217 $909 $207Jan-06 $22,773,302 $2,793,905 24.61% $19,979,397 8.10% 353,093 $64.50 780,660 $941 $217Feb-06 $22,048,784 $2,378,010 22.35% $19,670,774 8.20% 339,752 $64.90 758,321 $801 $213Mar-06 $23,127,109 $2,573,458 21.84% $20,553,651 8.15% 353,761 $65.37 781,632 $866 $224Apr-06 $21,576,609 $2,448,341 23.55% $19,128,268 8.22% 323,244 $66.75 714,530 $824 $208May-06 $21,168,693 $2,325,971 21.72% $18,842,722 8.21% 330,554 $64.04 720,400 $783 $205Jun-06 $20,805,921 $2,472,230 25.25% $18,333,691 8.17% 317,196 $65.59 687,798 $886 $204
TOTALS $259,908,271 $30,208,766 23.21% $229,699,505 8.11% 4,082,305 $63.67 8,941,225 $831 $210
Fiscal year ended June 30, 2005
NIW YLIADNIW YLIADREP NIWTOLSTOLSELBATELBATLATOTMONTH AGR AGR WIN % AGR HOLD % PATRONS PATRON ADMISSIONS PER TABLE PER SLOT
Jul-04 $21,972,120 $2,949,303 21.89% $19,022,817 7.28% 389,990 $56.34 845,067 $919 $217Aug-04 $19,779,414 $2,710,166 23.20% $17,069,248 7.48% 350,058 $56.50 749,351 $844 $193Sep-04 $18,836,100 $2,575,870 23.68% $16,260,230 7.60% 321,643 $58.56 698,003 $802 $183Oct-04 $20,333,592 $2,676,067 23.02% $17,657,525 7.56% 342,011 $59.45 748,558 $834 $199Nov-04 $19,322,768 $2,840,290 25.32% $16,482,478 7.56% 315,183 $61.31 697,076 $885 $188Dec-04 $20,639,945 $2,972,226 23.42% $17,667,719 7.36% 352,603 $58.54 787,004 $926 $196Jan-05 $20,363,267 $2,676,943 23.46% $17,686,324 7.60% 329,435 $61.81 743,881 $834 $196Feb-05 $19,329,654 $2,572,075 23.08% $16,757,579 7.13% 339,467 $56.94 754,881 $801 $191Mar-05 $21,934,943 $2,711,370 23.34% $19,223,573 7.66% 351,982 $62.32 774,846 $845 $214Apr-05 $21,432,636 $2,481,032 22.80% $18,951,604 7.91% 333,963 $64.18 738,943 $773 $211May-05 $21,083,273 $2,451,939 22.75% $18,631,333 7.69% 344,331 $61.23 740,514 $764 $206Jun-05 $20,260,207 $2,182,673 20.80% $18,077,534 7.92% 336,859 $60.14 725,982 $680 $201
TOTALS $245,287,918 $31,799,952 23.06% $213,487,965 7.56% 4,107,525 $59.72 9,004,106 $826 $200

44
Ameristar - St. CharlesMonthly Gaming Revenue
$18.0
$20.0
$22.0
$24.0
$26.0
$28.0
$30.0
$32.0
Jul Aug Sep Oct Nov Dec Jan Feb Mar Apr May Jun
Mill
ions
FY 2006
FY 2005
Monthly Patrons
200
250
300
350
400
450
500
Jul Aug Sep Oct Nov Dec Jan Feb Mar Apr May Jun
Thou
sand
s
FY 2006
FY 2005
General Manager: Jim Franke1260 South Main StreetSt. Charles, Missouri 63301(636) 940-4300
Date Licensed: December 19, 2000License Expiration Date: December 20, 2006Gaming Space: 130,000 Square FeetElectronic Gaming Devices: 3,237Table Games: 98Buffet, (6) Specialty Restaurants and DeliParking GarageTotal Employee Compensation: $58,139,536Real Estate/Personal Property Tax: $4,372,301State Sales Tax: $1,775,077Charitable Donations: $492,134Total Employment: 1,853Minority Employment: 577Female Employment: 867Minority Salaried Positions: 38Female Salaried Positions: 100
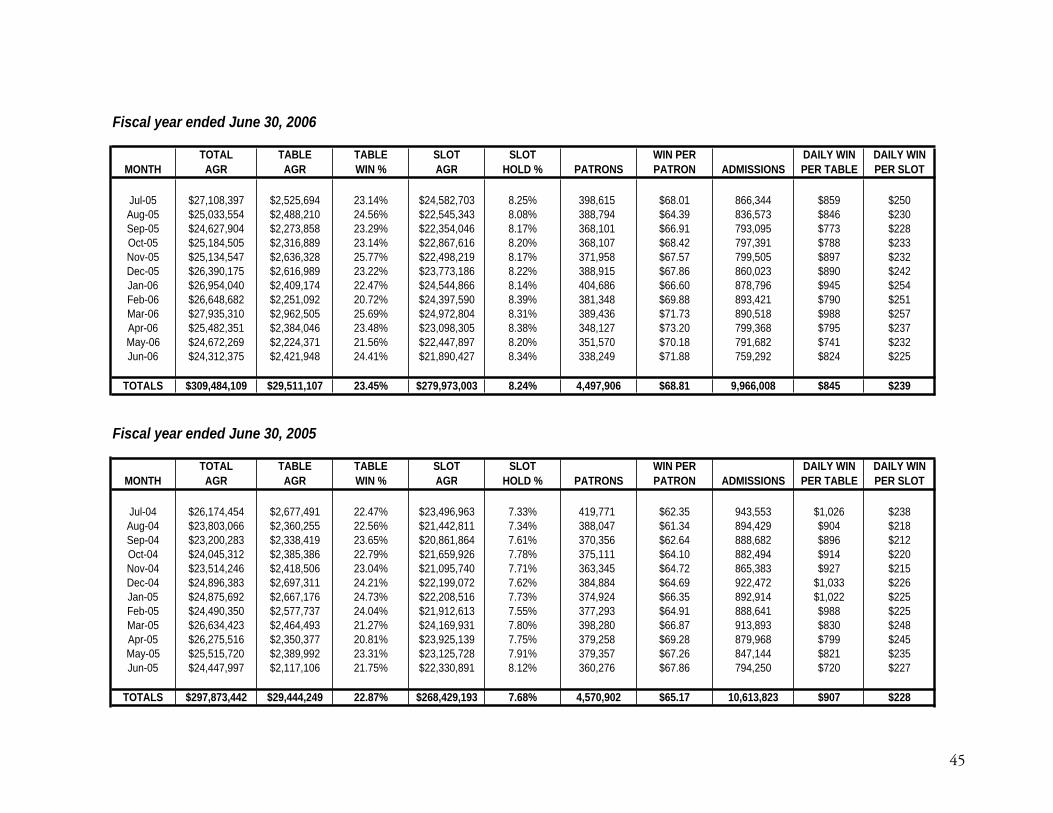
45
Fiscal year ended June 30, 2006
NIW YLIADNIW YLIADREP NIWTOLSTOLSELBATELBATLATOTMONTH AGR AGR WIN % AGR HOLD % PATRONS PATRON ADMISSIONS PER TABLE PER SLOT
Jul-05 $27,108,397 $2,525,694 23.14% $24,582,703 8.25% 398,615 $68.01 866,344 $859 $250Aug-05 $25,033,554 $2,488,210 24.56% $22,545,343 8.08% 388,794 $64.39 836,573 $846 $230Sep-05 $24,627,904 $2,273,858 23.29% $22,354,046 8.17% 368,101 $66.91 793,095 $773 $228Oct-05 $25,184,505 $2,316,889 23.14% $22,867,616 8.20% 368,107 $68.42 797,391 $788 $233Nov-05 $25,134,547 $2,636,328 25.77% $22,498,219 8.17% 371,958 $67.57 799,505 $897 $232Dec-05 $26,390,175 $2,616,989 23.22% $23,773,186 8.22% 388,915 $67.86 860,023 $890 $242Jan-06 $26,954,040 $2,409,174 22.47% $24,544,866 8.14% 404,686 $66.60 878,796 $945 $254Feb-06 $26,648,682 $2,251,092 20.72% $24,397,590 8.39% 381,348 $69.88 893,421 $790 $251Mar-06 $27,935,310 $2,962,505 25.69% $24,972,804 8.31% 389,436 $71.73 890,518 $988 $257Apr-06 $25,482,351 $2,384,046 23.48% $23,098,305 8.38% 348,127 $73.20 799,368 $795 $237May-06 $24,672,269 $2,224,371 21.56% $22,447,897 8.20% 351,570 $70.18 791,682 $741 $232Jun-06 $24,312,375 $2,421,948 24.41% $21,890,427 8.34% 338,249 $71.88 759,292 $824 $225
TOTALS $309,484,109 $29,511,107 23.45% $279,973,003 8.24% 4,497,906 $68.81 9,966,008 $845 $239
Fiscal year ended June 30, 2005
NIW YLIADNIW YLIADREP NIWTOLSTOLSELBATELBATLATOTMONTH AGR AGR WIN % AGR HOLD % PATRONS PATRON ADMISSIONS PER TABLE PER SLOT
Jul-04 $26,174,454 $2,677,491 22.47% $23,496,963 7.33% 419,771 $62.35 943,553 $1,026 $238Aug-04 $23,803,066 $2,360,255 22.56% $21,442,811 7.34% 388,047 $61.34 894,429 $904 $218Sep-04 $23,200,283 $2,338,419 23.65% $20,861,864 7.61% 370,356 $62.64 888,682 $896 $212Oct-04 $24,045,312 $2,385,386 22.79% $21,659,926 7.78% 375,111 $64.10 882,494 $914 $220Nov-04 $23,514,246 $2,418,506 23.04% $21,095,740 7.71% 363,345 $64.72 865,383 $927 $215Dec-04 $24,896,383 $2,697,311 24.21% $22,199,072 7.62% 384,884 $64.69 922,472 $1,033 $226Jan-05 $24,875,692 $2,667,176 24.73% $22,208,516 7.73% 374,924 $66.35 892,914 $1,022 $225Feb-05 $24,490,350 $2,577,737 24.04% $21,912,613 7.55% 377,293 $64.91 888,641 $988 $225Mar-05 $26,634,423 $2,464,493 21.27% $24,169,931 7.80% 398,280 $66.87 913,893 $830 $248Apr-05 $26,275,516 $2,350,377 20.81% $23,925,139 7.75% 379,258 $69.28 879,968 $799 $245May-05 $25,515,720 $2,389,992 23.31% $23,125,728 7.91% 379,357 $67.26 847,144 $821 $235Jun-05 $24,447,997 $2,117,106 21.75% $22,330,891 8.12% 360,276 $67.86 794,250 $720 $227
TOTALS $297,873,442 $29,444,249 22.87% $268,429,193 7.68% 4,570,902 $65.17 10,613,823 $907 $228
::

46
Argosy Riverside CasinoMonthly Gaming Revenue
$6.5
$7.5
$8.5
$9.5
$10.5
$11.5
$12.5
$13.5
$14.5
$15.5
Jul Aug Sep Oct Nov Dec Jan Feb Mar Apr May Jun
Mill
ions
FY 2006
FY 2005
Monthly Patrons
110
120
130
140
150
160
170
180
190
200
210
220
Jul Aug Sep Oct Nov Dec Jan Feb Mar Apr May Jun
Thou
sand
s
FY 2006
FY 2005
General Manager: Tom Burke777 NW Argosy ParkwayRiverside, Missouri 64150(816) 746-3100
Date Licensed: June 22, 1994License Expiration Date: June 21, 2008Gaming Space: 62,000 Square FeetElectronic Gaming Devices: 1,768Table Games: 47Buffet, (2) specialty restaurants, Deli and Coffee HouseMeeting Space: 11,000 Square FeetParking GarageTotal Employee Compensation: $29,329,836Real Estate/Personal Property Tax: $2,010,977State Sales Tax: $441,809City Lease Payments: $4,589,211Charitable Donations: $32,662Total Employment: 900Minority Employment: 322Female Employment: 461Minority Salaried Positions: 17Female Salaried Positions: 45

47
Fiscal year ended June 30, 2006
NIW YLIADNIW YLIADREP NIWTOLSTOLSELBATELBATLATOTMONTH AGR AGR WIN % AGR HOLD % PATRONS PATRON ADMISSIONS PER TABLE PER SLOT
Jul-05 $12,383,624 $1,482,824 22.37% $10,900,800 7.55% 189,917 $65.21 431,189 $1,236 $207Aug-05 $11,543,378 $1,445,269 23.69% $10,098,109 7.56% 171,812 $67.19 391,162 $1,204 $190Sep-05 $11,172,088 $1,224,491 21.33% $9,947,598 7.63% 166,935 $66.92 380,077 $1,020 $187Oct-05 $11,728,216 $1,428,849 23.72% $10,299,368 7.47% 172,624 $67.94 377,379 $1,191 $192Nov-05 $12,049,591 $1,355,232 22.52% $10,694,359 7.69% 175,399 $68.70 382,268 $1,129 $198Dec-05 $12,374,447 $1,586,938 26.03% $10,787,509 7.58% 178,818 $69.20 394,880 $1,322 $200Jan-06 $13,074,360 $1,492,549 25.05% $11,581,811 7.65% 185,655 $70.42 410,559 $1,244 $214Feb-06 $12,392,791 $1,234,875 22.15% $11,157,916 7.69% 174,917 $70.85 385,670 $1,029 $206Mar-06 $14,893,658 $1,544,678 25.51% $13,348,980 8.14% 195,770 $76.08 432,072 $1,287 $246Apr-06 $13,381,705 $1,318,339 24.00% $12,063,367 7.90% 184,584 $72.50 400,610 $1,099 $223May-06 $13,250,812 $1,472,817 27.47% $11,777,995 7.97% 184,633 $71.77 398,185 $1,116 $223Jun-06 $13,180,002 $1,412,813 26.43% $11,767,190 7.95% 188,415 $69.95 404,634 $1,002 $222
TOTALS $151,424,672 $16,999,671 24.15% $134,425,001 7.74% 2,169,479 $69.80 4,788,685 $1,157 $209
Fiscal year ended June 30, 2005
NIW YLIADNIW YLIADREP NIWTOLSTOLSELBATELBATLATOTMONTH AGR AGR WIN % AGR HOLD % PATRONS PATRON ADMISSIONS PER TABLE PER SLOT
Jul-04 $12,729,476 $1,724,267 22.72% $11,005,209 7.01% 196,867 $64.66 419,985 $1,249 $210Aug-04 $12,127,881 $1,555,083 22.80% $10,572,798 7.16% 178,312 $68.01 378,204 $1,127 $201Sep-04 $11,419,411 $1,411,574 21.31% $10,007,836 7.08% 174,884 $65.30 365,032 $1,023 $191Oct-04 $11,906,606 $1,439,282 21.11% $10,467,323 7.09% 180,300 $66.04 378,942 $1,043 $199Nov-04 $10,964,878 $1,459,888 22.49% $9,504,990 7.17% 164,602 $66.61 346,965 $1,106 $180Dec-04 $12,506,543 $1,657,247 23.01% $10,849,296 7.30% 180,754 $69.19 434,865 $1,255 $205Jan-05 $12,790,008 $1,580,323 22.63% $11,209,685 7.10% 197,408 $64.79 442,206 $1,317 $212Feb-05 $12,880,169 $1,397,834 20.45% $11,482,335 6.94% 203,009 $63.45 428,946 $1,165 $218Mar-05 $14,132,443 $1,675,810 22.78% $12,456,634 7.27% 207,692 $68.05 435,227 $1,397 $236Apr-05 $13,675,400 $1,620,814 23.55% $12,054,586 7.37% 200,624 $68.16 422,752 $1,351 $229May-05 $12,680,243 $1,582,726 23.89% $11,097,517 7.00% 199,374 $63.60 421,257 $1,319 $212Jun-05 $11,821,129 $1,533,060 23.63% $10,288,070 7.43% 182,574 $64.75 401,948 $1,278 $196
TOTALS $149,634,188 $18,637,908 22.53% $130,996,280 7.16% 2,266,400 $66.02 4,876,329 $1,219 $207

48
Aztar Casino - CaruthersvilleMonthly Gaming Revenue
$1.6
$1.8
$2.0
$2.2
$2.4
$2.6
$2.8
Jul Aug Sep Oct Nov Dec Jan Feb Mar Apr May Jun
Mill
ions
FY 2006
FY 2005
Monthly Patrons
26
28
30
32
34
36
38
40
Jul Aug Sep Oct Nov Dec Jan Feb Mar Apr May Jun
Thou
sand
s
FY 2006
FY 2005
Acting General Manager: Denny Callen777 E 3rd StreetCaruthersville, Missouri 63830(573) 333-1000
Date Licensed: April 27, 1995License Expiration Date: April 25, 2007Gaming Space: 21,400 Square FeetElectronic Gaming Devices: 649Table Games: 22(1) Specialty RestaurantRV Park (27-Space)Total Employee Compensation: $7,158,394Real Estate/Personal Property Tax: $355,886State Sales Tax: $47,730City Lease Payments: $100,000Charitable Donations: $42,561Total Employment: 283Minority Employment: 75Female Employment: 172Minority Salaried Positions: 8Female Salaried Positions: 18

49
Fiscal year ended June 30, 2006
NIW YLIADNIW YLIADREP NIWTOLSTOLSELBATELBATLATOTMONTH AGR AGR WIN % AGR HOLD % PATRONS PATRON ADMISSIONS PER TABLE PER SLOT
Jul-05 $2,587,019 $360,357 23.61% $2,226,662 10.82% 37,902 $68.26 87,471 $572 $107Aug-05 $2,150,226 $326,824 24.91% $1,823,403 10.36% 33,927 $63.38 76,357 $519 $90Sep-05 $2,113,330 $338,069 27.33% $1,775,261 10.28% 31,735 $66.59 72,711 $537 $85Oct-05 $2,200,065 $320,018 26.22% $1,880,047 10.36% 32,010 $68.73 74,188 $593 $90Nov-05 $2,304,277 $413,762 33.63% $1,890,516 10.82% 30,435 $75.71 72,059 $766 $91Dec-05 $2,189,468 $239,093 16.30% $1,950,376 10.57% 31,417 $69.69 76,110 $443 $93Jan-06 $2,474,238 $383,861 25.41% $2,090,377 10.36% 35,334 $70.02 84,597 $609 $100Feb-06 $2,564,704 $435,648 30.68% $2,129,056 10.54% 33,925 $75.60 82,017 $692 $109Mar-06 $2,630,161 $374,106 25.65% $2,256,056 10.69% 35,374 $74.35 85,293 $567 $116Apr-06 $2,282,284 $357,129 29.07% $1,925,156 10.88% 30,085 $75.86 70,550 $541 $99May-06 $2,492,213 $329,647 23.94% $2,162,566 10.58% 34,625 $71.98 80,018 $499 $111Jun-06 $2,462,099 $395,640 29.55% $2,066,459 10.25% 34,361 $71.65 79,311 $599 $106
TOTALS $28,450,084 $4,274,150 26.18% $24,175,935 10.54% 401,130 $70.92 940,682 $578 $100
Fiscal year ended June 30, 2005
NIW YLIADNIW YLIADREP NIWTOLSTOLSELBATELBATLATOTMONTH AGR AGR WIN % AGR HOLD % PATRONS PATRON ADMISSIONS PER TABLE PER SLOT
Jul-04 $1,911,021 $353,634 24.82% $1,557,387 10.41% 32,331 $59.11 68,956 $842 $74Aug-04 $1,923,558 $309,813 23.38% $1,613,745 11.28% 28,720 $66.98 62,761 $738 $77Sep-04 $2,086,843 $365,469 29.39% $1,721,374 11.28% 31,516 $66.22 69,041 $677 $82Oct-04 $2,218,889 $508,664 37.17% $1,710,225 10.98% 30,966 $71.66 70,700 $942 $81Nov-04 $1,980,893 $419,411 32.06% $1,561,482 10.84% 27,913 $70.97 64,187 $777 $74Dec-04 $1,881,400 $366,750 27.66% $1,514,650 10.46% 27,630 $68.09 63,815 $643 $72Jan-05 $2,413,452 $488,779 30.70% $1,924,673 10.45% 31,917 $75.62 76,449 $858 $93Feb-05 $2,457,463 $439,878 28.64% $2,017,585 10.33% 34,249 $71.75 80,102 $772 $97Mar-05 $2,314,501 $421,196 28.65% $1,893,305 10.33% 32,672 $70.84 76,876 $739 $90Apr-05 $2,446,640 $434,300 28.75% $2,012,340 10.53% 33,588 $72.84 79,315 $689 $98May-05 $2,380,745 $352,126 26.44% $2,028,620 10.93% 34,810 $68.39 79,098 $559 $96Jun-05 $2,194,674 $353,382 25.60% $1,841,292 10.45% 33,730 $65.07 76,706 $561 $88
TOTALS $26,210,079 $4,813,401 28.62% $21,396,678 10.67% 380,042 $68.97 868,006 $733 $85
::

50
Harrah’s Maryland HeightsMonthly Gaming Revenue
$18.0
$20.0
$22.0
$24.0
$26.0
$28.0
$30.0
$32.0
Jul Aug Sep Oct Nov Dec Jan Feb Mar Apr May Jun
Mill
ions
FY 2006
FY 2005
Monthly Patrons
200
250
300
350
400
450
500
550
Jul Aug Sep Oct Nov Dec Jan Feb Mar Apr May Jun
Thou
sand
s
FY 2006
FY 2005
General Manager: Arnold Block777 Casino Center DriveMaryland Heights, Missouri 63146(314) 770-8100
Date Licensed: March 11, 1997License Expiration Date: March 10, 2007Gaming Space: 120,000 Square Feet Electronic Gaming Devices: 2,833Table Games: 94Buffet, (3) Specialty Restaurants, Noodle Bar, Coffee House and Deli502 Room HotelMeeting SpaceParking GarageTotal Employee Compensation: $61,554,637Real Estate/Personal Property Tax: $7,704,673State Sales Tax: $1,818,165Charitable Donations: $80,912Total Employment: 1,993Minority Employment: 790Female Employment: 1,027Minority Salaried Positions: 42Female Salaried Positions: 120

51
Fiscal year ended June 30, 2006
NIW YLIADNIW YLIADREP NIWTOLSTOLSELBATELBATLATOTMONTH AGR AGR WIN % AGR HOLD % PATRONS PATRON ADMISSIONS PER TABLE PER SLOT
Jul-05 $28,006,378 $2,865,892 20.55% $25,140,486 8.12% 404,427 $69.25 911,158 $1,098 $296Aug-05 $23,661,336 $2,708,785 21.94% $20,952,551 7.95% 355,226 $66.61 782,902 $1,050 $244Sep-05 $24,140,359 $2,375,652 19.69% $21,764,707 8.15% 351,328 $68.71 781,327 $921 $255Oct-05 $25,608,156 $2,702,384 21.99% $22,905,772 8.11% 368,425 $69.51 819,760 $1,047 $267Nov-05 $24,956,927 $3,059,963 23.83% $21,896,964 8.09% 355,413 $70.22 803,459 $1,186 $255Dec-05 $25,233,513 $2,537,147 18.14% $22,696,366 8.31% 359,744 $70.14 819,359 $983 $263Jan-06 $26,518,827 $3,129,659 23.09% $23,389,168 8.36% 371,160 $71.45 837,113 $1,213 $273Feb-06 $25,391,403 $2,755,419 21.34% $22,635,984 8.30% 353,512 $71.83 809,509 $1,068 $277Mar-06 $28,076,398 $3,612,278 26.81% $24,464,120 8.39% 364,494 $77.03 823,290 $1,400 $300Apr-06 $26,313,081 $3,074,478 25.37% $23,238,603 8.45% 341,901 $76.96 772,005 $1,090 $276May-06 $26,290,560 $2,862,891 22.71% $23,427,669 8.40% 357,248 $73.59 800,372 $1,015 $282Jun-06 $26,351,525 $2,985,312 25.30% $23,366,213 8.43% 353,332 $74.58 784,754 $1,059 $275
TOTALS $310,548,463 $34,669,859 22.52% $275,878,604 8.26% 4,336,210 $71.62 9,745,008 $1,094 $272
Fiscal year ended June 30, 2005
NIW YLIADNIW YLIADREP NIWTOLSTOLSELBATELBATLATOTMONTH AGR AGR WIN % AGR HOLD % PATRONS PATRON ADMISSIONS PER TABLE PER SLOT
Jul-04 $25,380,602 $2,937,183 21.75% $22,443,419 7.81% 476,157 $53.30 870,977 $1,239 $279Aug-04 $25,062,143 $3,177,869 24.04% $21,884,274 7.64% 485,907 $51.58 887,737 $1,308 $271Sep-04 $24,695,790 $2,836,839 21.98% $21,858,952 7.99% 461,459 $53.52 871,746 $1,167 $271Oct-04 $25,933,781 $3,159,461 23.96% $22,774,320 8.05% 469,836 $55.20 902,454 $1,300 $282Nov-04 $24,626,092 $3,182,498 24.12% $21,443,595 7.90% 441,602 $55.77 851,656 $1,310 $267Dec-04 $24,802,031 $3,468,353 24.57% $21,333,678 7.79% 369,382 $67.14 804,490 $1,427 $256Jan-05 $25,226,780 $3,043,880 23.42% $22,182,900 8.36% 338,633 $74.50 771,700 $1,253 $268Feb-05 $23,366,537 $3,084,559 24.34% $20,281,978 7.65% 333,451 $70.07 755,005 $1,269 $271Mar-05 $26,481,552 $3,469,162 25.60% $23,012,389 8.17% 359,406 $73.68 799,659 $1,428 $318Apr-05 $25,028,603 $3,009,631 23.24% $22,018,973 8.08% 335,698 $74.56 769,470 $1,254 $296May-05 $25,605,254 $3,191,893 25.25% $22,413,361 8.22% 358,921 $71.34 791,224 $1,195 $283Jun-05 $24,559,728 $2,634,440 21.20% $21,925,287 8.23% 361,588 $67.92 791,748 $1,009 $258
TOTALS $300,768,893 $37,195,766 23.64% $263,573,126 7.99% 4,792,040 $62.76 9,867,866 $1,263 $277

52
Harrah’s North Kansas CityMonthly Gaming Revenue
$12.0
$14.0
$16.0
$18.0
$20.0
$22.0
$24.0
Jul Aug Sep Oct Nov Dec Jan Feb Mar Apr May Jun
Mill
ions
FY 2006
FY 2005
Monthly Patrons
200
220
240
260
280
300
320
Jul Aug Sep Oct Nov Dec Jan Feb Mar Apr May Jun
Thou
sand
s
FY 2006
FY 2005
General Manager: Thomas W. CookOne Riverboat DriveNorth Kansas City, Missouri 64116(816) 472-7777
Date Licensed: September 22, 1994License Expiration Date: May 14, 2008Gaming Space: 63,300 Square FeetElectronic Gaming Devices: 1,851Table Games: 62Buffet, (3) Specialty Restaurants200 Room HotelMeeting Space: 10,000 Square FeetParking GarageTotal Employee Compensation: $47,071,148Real Estate/Personal Property Tax: $3,230,763State Sales Tax: $1,842,242City Lease Payments: $4,002,569Charitable Donations: $160,847Total Employment: 1,639Minority Employment: 540Female Employment: 810Minority Salaried Positions: 39Female Salaried Positions: 101

53
Fiscal year ended June 30, 2006
NIW YLIADNIW YLIADREP NIWTOLSTOLSELBATELBATLATOTMONTH AGR AGR WIN % AGR HOLD % PATRONS PATRON ADMISSIONS PER TABLE PER SLOT
Jul-05 $17,451,228 $2,448,274 25.53% $15,002,954 7.47% 294,617 $59.23 590,956 $1,316 $291Aug-05 $16,076,317 $2,157,437 22.64% $13,918,881 7.34% 282,680 $56.87 561,831 $1,160 $265Sep-05 $16,291,423 $2,147,748 22.54% $14,143,675 7.66% 282,627 $57.64 564,384 $1,155 $265Oct-05 $17,084,400 $2,283,894 21.96% $14,800,506 7.53% 296,660 $57.59 614,972 $1,228 $276Nov-05 $16,903,969 $2,597,849 23.76% $14,306,121 7.81% 307,894 $54.90 632,686 $1,375 $261Dec-05 $17,752,981 $2,596,319 22.05% $15,156,662 7.82% 307,634 $57.71 644,322 $1,396 $274Jan-06 $17,207,890 $2,353,323 21.13% $14,854,567 7.85% 298,985 $57.55 650,039 $1,265 $269Feb-06 $17,388,486 $2,474,574 22.42% $14,913,912 8.07% 295,980 $58.75 615,460 $1,330 $269Mar-06 $18,003,110 $2,511,229 22.72% $15,491,881 8.12% 276,651 $65.08 604,366 $1,350 $279Apr-06 $15,797,908 $1,977,857 20.00% $13,820,051 7.95% 248,612 $63.54 526,844 $1,063 $249May-06 $15,959,280 $2,210,334 22.46% $13,748,946 7.85% 251,153 $63.54 526,371 $1,188 $248Jun-06 $15,829,966 $2,082,162 22.05% $13,747,804 7.97% 254,137 $62.29 522,007 $1,119 $248
TOTALS $201,746,959 $27,840,998 22.42% $173,905,961 7.78% 3,397,630 $59.38 7,054,238 $1,246 $266
Fiscal year ended June 30, 2005
NIW YLIADNIW YLIADREP NIWTOLSTOLSELBATELBATLATOTMONTH AGR AGR WIN % AGR HOLD % PATRONS PATRON ADMISSIONS PER TABLE PER SLOT
Jul-04 $16,283,324 $2,195,573 22.35% $14,087,751 7.52% 265,720 $61.28 539,408 $1,240 $282Aug-04 $15,583,025 $2,094,988 22.26% $13,488,037 7.34% 273,998 $56.87 537,893 $1,164 $270Sep-04 $15,837,278 $2,381,168 26.73% $13,456,109 7.57% 259,122 $61.12 514,381 $1,323 $268Oct-04 $15,886,082 $2,238,862 23.59% $13,647,220 7.35% 269,456 $58.96 546,854 $1,244 $279Nov-04 $14,673,583 $2,291,027 23.93% $12,382,557 7.63% 247,052 $59.39 488,976 $1,273 $261Dec-04 $16,481,519 $2,693,024 25.67% $13,788,495 7.51% 275,448 $59.84 553,511 $1,521 $255Jan-05 $14,573,217 $2,133,413 22.78% $12,439,804 7.42% 239,174 $60.93 498,062 $1,205 $242Feb-05 $14,470,969 $2,029,349 23.05% $12,441,621 7.30% 240,753 $60.11 502,423 $1,147 $241Mar-05 $16,267,009 $2,219,086 23.05% $14,047,923 7.64% 264,634 $61.47 543,698 $1,233 $277Apr-05 $15,854,366 $2,301,833 25.64% $13,552,533 7.32% 256,414 $61.83 516,515 $1,279 $275May-05 $14,513,234 $1,868,526 21.33% $12,644,708 7.63% 248,351 $58.44 495,592 $1,005 $245Jun-05 $14,514,632 $1,954,665 23.43% $12,559,967 7.76% 246,166 $58.96 489,988 $1,051 $246
TOTALS $184,938,238 $26,401,513 23.66% $158,536,725 7.50% 3,086,288 $59.92 6,227,301 $1,224 $262

54
Isle of Capri - BoonvilleMonthly Gaming Revenue
$4.0
$4.5
$5.0
$5.5
$6.0
$6.5
$7.0
$7.5
$8.0
Jul Aug Sep Oct Nov Dec Jan Feb Mar Apr May Jun
Mill
ions
FY 2006
FY 2005
Monthly Patrons
70
80
90
100
110
120
130
Jul Aug Sep Oct Nov Dec Jan Feb Mar Apr May Jun
Thou
sand
s
FY 2006
FY 2005
General Manager: Kim Hardy100 Isle of Capri BoulevardBoonville, Missouri 65233(660) 882-1200
Date Licensed: December 6, 2001License Expiration Date: December 5, 2007Gaming Space: 28,000 Square FeetElectronic Gaming Devices: 899Table Games: 34Buffet, (1) Specialty Restaurant and DeliTotal Employee Compensation: $16,893,946Real Estate/Personal Property Tax: $594,293State Sales Tax: $170,741Charitable Donations: $53,572Total Employment: 606Minority Employment: 63Female Employment: 323Minority Salaried Positions: 10Female Salaried Positions: 59

55
Fiscal year ended June 30, 2006
NIW YLIADNIW YLIADREP NIWTOLSTOLSELBATELBATLATOTMONTH AGR AGR WIN % AGR HOLD % PATRONS PATRON ADMISSIONS PER TABLE PER SLOT
Jul-05 $7,058,191 $809,845 27.89% $6,248,347 7.64% 107,530 $65.64 245,240 $818 $232Aug-05 $6,002,049 $672,888 25.55% $5,329,161 6.87% 95,537 $62.82 218,894 $680 $198Sep-05 $6,200,409 $733,352 30.08% $5,467,057 7.49% 89,735 $69.10 210,223 $741 $203Oct-05 $6,317,733 $624,523 25.83% $5,693,210 7.76% 90,789 $69.59 210,393 $631 $211Nov-05 $5,928,056 $626,777 25.15% $5,301,279 7.41% 86,338 $68.66 206,237 $633 $197Dec-05 $6,121,159 $646,317 24.34% $5,474,842 7.50% 86,837 $70.49 211,787 $634 $203Jan-06 $6,760,063 $744,594 26.07% $6,015,469 7.52% 96,982 $69.70 238,875 $730 $223Feb-06 $7,127,175 $824,612 29.44% $6,302,564 7.90% 95,026 $75.00 223,557 $808 $234Mar-06 $6,998,220 $745,286 25.71% $6,252,934 7.47% 98,827 $70.81 249,013 $731 $232Apr-06 $6,511,028 $690,854 27.13% $5,820,174 7.46% 88,038 $73.96 217,946 $677 $216May-06 $6,981,568 $773,441 28.70% $6,208,128 7.48% 95,421 $73.17 218,886 $758 $230Jun-06 $7,045,656 $710,928 27.92% $6,334,728 7.58% 98,008 $71.89 226,871 $697 $235
TOTALS $79,051,308 $8,603,415 26.98% $70,447,893 7.51% 1,129,068 $70.01 2,677,922 $711 $218
Fiscal year ended June 30, 2005
NIW YLIADNIW YLIADREP NIWTOLSTOLSELBATELBATLATOTMONTH AGR AGR WIN % AGR HOLD % PATRONS PATRON ADMISSIONS PER TABLE PER SLOT
Jul-04 $7,079,013 $674,757 21.97% $6,404,256 7.35% 113,948 $62.12 261,349 $833 $236Aug-04 $6,575,695 $570,188 20.62% $6,005,507 7.77% 100,399 $65.50 228,830 $704 $221Sep-04 $6,319,790 $649,581 24.59% $5,670,210 7.56% 99,367 $63.60 229,118 $802 $211Oct-04 $6,568,932 $732,543 26.03% $5,836,389 7.49% 99,788 $65.83 231,080 $904 $217Nov-04 $5,942,354 $576,200 20.83% $5,366,154 7.68% 88,178 $67.39 205,118 $711 $200Dec-04 $5,940,390 $670,142 24.26% $5,270,248 7.24% 89,884 $66.09 210,008 $827 $194Jan-05 $6,082,783 $627,085 21.24% $5,455,698 7.64% 88,919 $68.41 215,406 $774 $201Feb-05 $6,298,683 $634,266 21.29% $5,664,418 7.33% 97,317 $64.72 227,482 $783 $208Mar-05 $6,915,173 $712,877 23.06% $6,202,296 7.48% 103,823 $66.61 238,002 $880 $228Apr-05 $6,327,594 $728,426 25.42% $5,599,168 7.31% 92,114 $68.69 205,952 $736 $206May-05 $6,469,157 $598,064 22.28% $5,871,093 7.74% 95,870 $67.48 211,149 $604 $218Jun-05 $6,210,803 $635,523 24.83% $5,575,280 7.47% 93,757 $66.24 210,110 $642 $207
TOTALS $76,730,366 $7,809,650 23.00% $68,920,716 7.50% 1,163,364 $65.96 2,673,604 $767 $212

56
Isle of Capri - Kansas CityMonthly Gaming Revenue
$6.5
$7.0
$7.5
$8.0
$8.5
$9.0
$9.5
$10.0
Jul Aug Sep Oct Nov Dec Jan Feb Mar Apr May Jun
Mill
ions
FY 2006
FY 2005
Monthly Patrons
140
150
160
170
180
190
200
210
220
Jul Aug Sep Oct Nov Dec Jan Feb Mar Apr May Jun
Thou
sand
s
FY 2006
FY 2005
General Manager: Michael Tamburelli1800 E Front StreetKansas City, Missouri 64120(816) 855-7777
Date Licensed: June 6, 2000License Expiration Date: June 5, 2008Gaming Space: 45,300 Square FeetElectronic Gaming Devices: 1,504Table Games: 37Buffet, (1) Specialty Restaurant and DeliParking GarageTotal Employee Compensation: $20,865,273Real Estate/Personal Property Tax: $777,845State Sales Tax: $436,819City Lease Payments: $1,263,601Charitable Donations: $50,862Total Employment: 646Minority Employment: 321Female Employment: 326Minority Salaried Positions: 49Female Salaried Positions: 72

57
Fiscal year ended June 30, 2006
NIW YLIADNIW YLIADREP NIWTOLSTOLSELBATELBATLATOTMONTH AGR AGR WIN % AGR HOLD % PATRONS PATRON ADMISSIONS PER TABLE PER SLOT
Jul-05 $7,977,567 $648,816 19.51% $7,328,751 7.51% 174,800 $45.64 352,322 $585 $158Aug-05 $7,263,698 $703,922 22.69% $6,559,776 7.50% 159,544 $45.53 315,098 $652 $141Sep-05 $7,820,093 $756,374 23.96% $7,063,719 7.85% 164,845 $47.44 333,738 $700 $152Oct-05 $8,021,459 $898,909 27.15% $7,122,550 7.93% 172,211 $46.58 348,387 $832 $150Nov-05 $7,004,431 $737,710 23.29% $6,266,721 7.57% 150,688 $46.48 297,228 $683 $136Dec-05 $7,256,018 $695,225 22.29% $6,560,794 7.66% 154,081 $47.09 308,285 $682 $142Jan-06 $7,761,186 $297,811 9.15% $7,463,375 7.96% 170,230 $45.59 336,367 $292 $162Feb-06 $8,092,912 $797,307 24.22% $7,295,605 7.78% 165,482 $48.91 331,822 $699 $158Mar-06 $8,409,634 $873,901 26.18% $7,535,733 7.98% 169,248 $49.69 337,545 $767 $164Apr-06 $7,649,121 $663,127 22.06% $6,985,994 7.99% 160,928 $47.53 316,648 $614 $152May-06 $7,431,189 $628,250 21.64% $6,802,939 7.74% 165,874 $44.80 323,150 $582 $149Jun-06 $7,758,223 $678,592 23.00% $7,079,631 8.05% 167,579 $46.30 328,497 $611 $157
TOTALS $92,445,530 $8,379,942 22.10% $84,065,588 7.79% 1,975,510 $46.80 3,929,087 $642 $152
Fiscal year ended June 30, 2005
NIW YLIADNIW YLIADREP NIWTOLSTOLSELBATELBATLATOTMONTH AGR AGR WIN % AGR HOLD % PATRONS PATRON ADMISSIONS PER TABLE PER SLOT
Jul-04 $9,051,595 $1,232,787 28.59% $7,818,808 6.97% 209,721 $43.16 416,633 $1,326 $169Aug-04 $9,436,543 $955,831 24.89% $8,480,713 8.17% 196,170 $48.10 382,253 $1,028 $183Sep-04 $8,277,149 $811,597 21.48% $7,465,552 7.38% 191,691 $43.18 376,713 $873 $161Oct-04 $8,538,772 $998,670 24.84% $7,540,102 6.91% 200,568 $42.57 404,356 $1,040 $162Nov-04 $7,889,384 $842,452 22.42% $7,046,932 7.08% 176,789 $44.63 361,149 $878 $152Dec-04 $7,935,010 $961,028 23.38% $6,973,982 6.42% 187,054 $42.42 390,249 $866 $153Jan-05 $8,014,271 $877,196 23.73% $7,137,075 7.12% 167,599 $47.82 357,163 $790 $156Feb-05 $7,779,787 $878,126 22.97% $6,901,661 6.30% 173,411 $44.86 368,293 $770 $152Mar-05 $9,396,009 $1,088,265 25.58% $8,307,745 7.18% 187,241 $50.18 391,270 $955 $181Apr-05 $7,815,368 $967,098 25.78% $6,848,271 6.35% 175,463 $44.54 362,487 $848 $145May-05 $8,844,005 $749,885 21.51% $8,094,120 8.04% 173,898 $50.86 352,464 $625 $171Jun-05 $7,608,850 $768,492 23.62% $6,840,359 7.37% 166,054 $45.82 330,563 $674 $147
TOTALS $100,586,744 $11,131,425 24.15% $89,455,319 7.09% 2,205,659 $45.60 4,493,593 $889 $161
::

58
Mark Twain - LaGrangeMonthly Gaming Revenue
$2.0
$2.2
$2.4
$2.6
$2.8
$3.0
$3.2
Jul Aug Sep Oct Nov Dec Jan Feb Mar Apr May Jun
Mill
ions
FY 2006
FY 2005
Monthly Patrons
35
40
45
50
55
60
65
Jul Aug Sep Oct Nov Dec Jan Feb Mar Apr May Jun
Thou
sand
s
FY 2006
FY 2005
General Manager: Robert Thursby104 Pierce StreetLaGrange, Missouri 63448(573) 655-4770
Date Licensed: July 25, 2001License Expiration Date: January 31, 2007Gaming Space: 18,000 Square FeetElectronic Gaming Devices: 591Table Games: 14(1) Specialty RestaurantMeeting SpaceTotal Employee Compensation: $5,966,764Real Estate/Personal Property Tax: $238,933State Sales Tax: $185,060City Lease Payments: $200,000Charitable Donations: $13,593Total Employment: 245Minority Employment: 11Female Employment: 142Minority Salaried Positions: 1Female Salaried Positions: 17
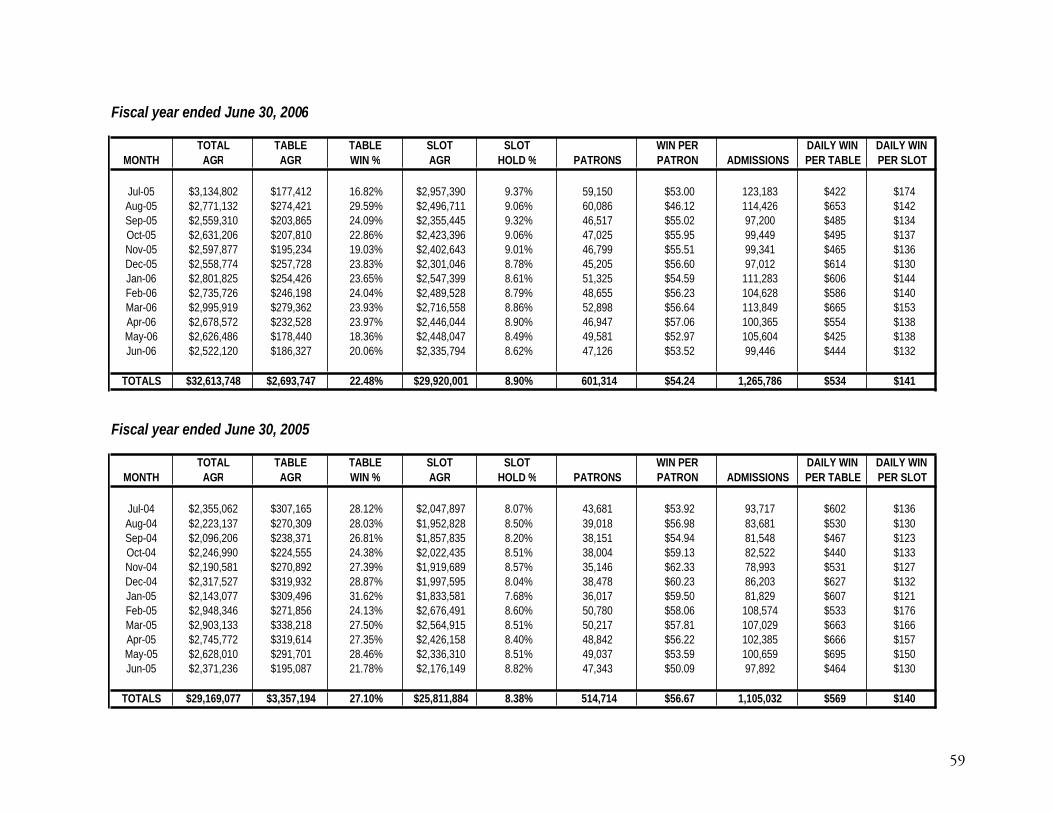
59
Fiscal year ended June 30, 2006
NIW YLIADNIW YLIADREP NIWTOLSTOLSELBATELBATLATOTMONTH AGR AGR WIN % AGR HOLD % PATRONS PATRON ADMISSIONS PER TABLE PER SLOT
Jul-05 $3,134,802 $177,412 16.82% $2,957,390 9.37% 59,150 $53.00 123,183 $422 $174Aug-05 $2,771,132 $274,421 29.59% $2,496,711 9.06% 60,086 $46.12 114,426 $653 $142Sep-05 $2,559,310 $203,865 24.09% $2,355,445 9.32% 46,517 $55.02 97,200 $485 $134Oct-05 $2,631,206 $207,810 22.86% $2,423,396 9.06% 47,025 $55.95 99,449 $495 $137Nov-05 $2,597,877 $195,234 19.03% $2,402,643 9.01% 46,799 $55.51 99,341 $465 $136Dec-05 $2,558,774 $257,728 23.83% $2,301,046 8.78% 45,205 $56.60 97,012 $614 $130Jan-06 $2,801,825 $254,426 23.65% $2,547,399 8.61% 51,325 $54.59 111,283 $606 $144Feb-06 $2,735,726 $246,198 24.04% $2,489,528 8.79% 48,655 $56.23 104,628 $586 $140Mar-06 $2,995,919 $279,362 23.93% $2,716,558 8.86% 52,898 $56.64 113,849 $665 $153Apr-06 $2,678,572 $232,528 23.97% $2,446,044 8.90% 46,947 $57.06 100,365 $554 $138May-06 $2,626,486 $178,440 18.36% $2,448,047 8.49% 49,581 $52.97 105,604 $425 $138Jun-06 $2,522,120 $186,327 20.06% $2,335,794 8.62% 47,126 $53.52 99,446 $444 $132
TOTALS $32,613,748 $2,693,747 22.48% $29,920,001 8.90% 601,314 $54.24 1,265,786 $534 $141
Fiscal year ended June 30, 2005
NIW YLIADNIW YLIADREP NIWTOLSTOLSELBATELBATLATOTMONTH AGR AGR WIN % AGR HOLD % PATRONS PATRON ADMISSIONS PER TABLE PER SLOT
Jul-04 $2,355,062 $307,165 28.12% $2,047,897 8.07% 43,681 $53.92 93,717 $602 $136Aug-04 $2,223,137 $270,309 28.03% $1,952,828 8.50% 39,018 $56.98 83,681 $530 $130Sep-04 $2,096,206 $238,371 26.81% $1,857,835 8.20% 38,151 $54.94 81,548 $467 $123Oct-04 $2,246,990 $224,555 24.38% $2,022,435 8.51% 38,004 $59.13 82,522 $440 $133Nov-04 $2,190,581 $270,892 27.39% $1,919,689 8.57% 35,146 $62.33 78,993 $531 $127Dec-04 $2,317,527 $319,932 28.87% $1,997,595 8.04% 38,478 $60.23 86,203 $627 $132Jan-05 $2,143,077 $309,496 31.62% $1,833,581 7.68% 36,017 $59.50 81,829 $607 $121Feb-05 $2,948,346 $271,856 24.13% $2,676,491 8.60% 50,780 $58.06 108,574 $533 $176Mar-05 $2,903,133 $338,218 27.50% $2,564,915 8.51% 50,217 $57.81 107,029 $663 $166Apr-05 $2,745,772 $319,614 27.35% $2,426,158 8.40% 48,842 $56.22 102,385 $666 $157May-05 $2,628,010 $291,701 28.46% $2,336,310 8.51% 49,037 $53.59 100,659 $695 $150Jun-05 $2,371,236 $195,087 21.78% $2,176,149 8.82% 47,343 $50.09 97,892 $464 $130
TOTALS $29,169,077 $3,357,194 27.10% $25,811,884 8.38% 514,714 $56.67 1,105,032 $569 $140

60
President Casino on the AdmiralMonthly Gaming Revenue
$4.5
$5.0
$5.5
$6.0
$6.5
$7.0
$7.5
$8.0
Jul Aug Sep Oct Nov Dec Jan Feb Mar Apr May Jun
Mill
ions
FY 2006
FY 2005
Monthly Patrons
100
110
120
130
140
150
160
Jul Aug Sep Oct Nov Dec Jan Feb Mar Apr May Jun
Thou
sand
s
FY 2006
FY 2005
General Manager: Chris Strobbe1000 N Leonor K. Sullivan BlvdSt. Louis, Missouri 63102(314) 622-3000
Date Licensed: May 27, 1994License Expiration Date: May 27, 2008Gaming Space: 53,800 Square FeetElectronic Gaming Devices: 816Table Games: 28BuffetTotal Employee Compensation: $18,828,065Real Estate/Personal Property Tax: $283,994State Sales Tax: $235,196City Lease Payments: $1,465,343Charitable Donations: $90,970Total Employment: 598Minority Employment: 368Female Employment: 300Minority Salaried Positions: 58Female Salaried Positions: 44

61
Fiscal year ended June 30, 2006
NIW YLIADNIW YLIADREP NIWTOLSTOLSELBATELBATLATOTMONTH AGR AGR WIN % AGR HOLD % PATRONS PATRON ADMISSIONS PER TABLE PER SLOT
Jul-05 $5,940,158 $849,131 27.35% $5,091,028 6.83% 129,254 $45.96 287,968 $690 $169Aug-05 $5,636,322 $752,733 25.46% $4,883,590 6.90% 121,699 $46.31 270,799 $738 $163Sep-05 $5,870,968 $716,141 24.16% $5,154,827 7.05% 124,262 $47.25 281,089 $723 $173Oct-05 $5,718,849 $732,346 25.25% $4,986,503 7.05% 120,100 $47.62 270,763 $740 $162Nov-05 $5,739,355 $683,100 25.66% $5,056,255 7.04% 123,486 $46.48 275,074 $690 $165Dec-05 $5,957,109 $754,716 26.28% $5,202,393 7.07% 125,989 $47.28 285,432 $867 $169Jan-06 $5,923,271 $479,322 18.61% $5,443,949 6.84% 113,102 $52.37 270,880 $551 $179Feb-06 $6,534,927 $796,421 27.02% $5,738,506 7.25% 123,972 $52.71 289,358 $915 $193Mar-06 $6,974,410 $805,116 25.61% $6,169,294 7.23% 145,992 $47.77 329,846 $994 $209Apr-06 $6,135,789 $733,631 25.34% $5,402,158 7.04% 121,955 $50.31 278,449 $873 $183May-06 $5,567,436 $441,805 17.19% $5,125,631 6.78% 121,113 $45.97 272,771 $526 $173Jun-06 $5,800,067 $604,527 22.24% $5,195,540 7.29% 116,047 $49.98 255,185 $720 $212
TOTALS $71,798,659 $8,348,987 24.33% $63,449,672 7.03% 1,486,971 $48.29 3,367,614 $752 $179
Fiscal year ended June 30, 2005
NIW YLIADNIW YLIADREP NIWTOLSTOLSELBATELBATLATOTMONTH AGR AGR WIN % AGR HOLD % PATRONS PATRON ADMISSIONS PER TABLE PER SLOT
Jul-04 $6,425,804 $770,192 21.86% $5,655,612 6.98% 155,664 $41.28 336,413 $676 $171Aug-04 $6,022,668 $852,137 25.43% $5,170,531 6.88% 143,992 $41.83 315,612 $747 $157Sep-04 $5,870,178 $721,034 21.37% $5,149,144 6.87% 141,886 $41.37 313,059 $632 $158Oct-04 $6,179,432 $968,622 26.62% $5,210,811 6.66% 136,303 $45.34 307,558 $897 $160Nov-04 $5,701,391 $777,711 25.54% $4,923,680 6.69% 124,801 $45.68 283,843 $665 $154Dec-04 $5,631,365 $833,503 29.37% $4,797,863 6.62% 118,712 $47.44 275,829 $712 $150Jan-05 $5,791,329 $810,988 28.12% $4,980,341 6.30% 117,754 $49.18 285,569 $693 $154Feb-05 $5,866,494 $859,390 26.30% $5,007,104 5.94% 124,901 $46.97 288,980 $735 $155Mar-05 $6,533,108 $920,527 25.14% $5,612,581 6.56% 132,391 $49.35 309,675 $787 $174Apr-05 $6,312,258 $966,717 24.29% $5,345,541 6.74% 132,477 $47.65 295,928 $826 $166May-05 $5,726,879 $711,538 23.63% $5,015,341 6.80% 124,881 $45.86 275,055 $608 $155Jun-05 $5,284,833 $563,396 19.09% $4,721,436 6.67% 120,989 $43.68 264,833 $537 $154
TOTALS $71,345,739 $9,755,755 24.68% $61,589,984 6.63% 1,574,751 $45.31 3,552,354 $710 $159
::

62
St. Jo Frontier CasinoMonthly Gaming Revenue
$1.8
$2.0
$2.2
$2.4
$2.6
$2.8
$3.0
$3.2
Jul Aug Sep Oct Nov Dec Jan Feb Mar Apr May Jun
Mill
ions
FY 2006
FY 2005
Monthly Patrons
30
35
40
45
50
55
60
Jul Aug Sep Oct Nov Dec Jan Feb Mar Apr May Jun
Thou
sand
s
FY 2006
FY 2005
General Manager: Craig Travers777 Winners CircleSt. Joseph, Missouri 64505(816) 279-5514
Date Licensed: June 24, 1994License Expiration Date: January 31, 2007Gaming Space: 18,000 Square FeetElectronic Gaming Devices: 591Table Games: 11Buffet and (1) Specialty RestaurantMeeting SpaceTotal Employee Compensation: $7,557,000Real Estate/Personal Property Tax: $237,950State Sales Tax: $128,350City/County Lease Payments: $758,000Charitable Donations: $33,700Total Employment: 307Minority Employment: 24Female Employment: 178Minority Salaried Positions: 3Female Salaried Positions: 21

63
Fiscal year ended June 30, 2006
NIW YLIADNIW YLIADREP NIWTOLSTOLSELBATELBATLATOTMONTH AGR AGR WIN % AGR HOLD % PATRONS PATRON ADMISSIONS PER TABLE PER SLOT
Jul-05 $2,546,862 $238,416 25.00% $2,308,446 7.09% 49,475 $51.48 103,410 $722 $131Aug-05 $2,362,588 $202,586 21.49% $2,160,002 6.74% 47,395 $49.85 101,427 $614 $123Sep-05 $2,500,194 $186,544 21.59% $2,313,650 7.29% 45,172 $55.35 96,663 $565 $123Oct-05 $2,643,613 $188,355 20.21% $2,455,258 8.13% 45,450 $58.17 96,503 $571 $140Nov-05 $2,667,844 $293,322 29.95% $2,374,522 8.33% 43,435 $61.42 92,204 $889 $135Dec-05 $2,623,262 $255,194 24.24% $2,368,068 8.47% 43,130 $60.82 91,501 $773 $135Jan-06 $2,832,584 $258,462 25.04% $2,574,123 8.37% 46,745 $60.60 100,877 $783 $147Feb-06 $2,803,603 $266,075 26.69% $2,537,529 7.65% 47,869 $58.57 105,038 $806 $146Mar-06 $3,146,752 $276,968 24.15% $2,869,785 7.93% 52,067 $60.44 112,128 $839 $165Apr-06 $2,904,516 $237,190 23.38% $2,667,326 7.99% 48,137 $60.34 104,158 $719 $154May-06 $2,865,514 $205,701 20.02% $2,659,813 8.02% 49,541 $57.84 105,712 $623 $153Jun-06 $2,927,210 $230,827 23.70% $2,696,384 8.20% 47,881 $61.14 101,806 $699 $152
TOTALS $32,824,543 $2,839,638 23.83% $29,984,905 7.84% 566,297 $57.96 1,211,427 $717 $142
Fiscal year ended June 30, 2005
NIW YLIADNIW YLIADREP NIWTOLSTOLSELBATELBATLATOTMONTH AGR AGR WIN % AGR HOLD % PATRONS PATRON ADMISSIONS PER TABLE PER SLOT
Jul-04 $2,064,599 $236,898 25.92% $1,827,702 7.75% 39,740 $51.95 77,446 $526 $122Aug-04 $1,980,542 $210,352 23.21% $1,770,190 7.92% 38,087 $52.00 74,373 $467 $119Sep-04 $1,914,918 $192,500 24.51% $1,722,418 7.77% 36,007 $53.18 71,181 $428 $118Oct-04 $2,114,455 $231,801 26.91% $1,882,655 7.89% 36,278 $58.28 73,614 $515 $129Nov-04 $1,939,241 $224,569 26.50% $1,714,672 7.99% 32,854 $59.03 67,531 $499 $117Dec-04 $2,118,307 $229,830 23.05% $1,888,477 7.62% 37,315 $56.77 77,165 $511 $129Jan-05 $1,941,261 $209,825 23.82% $1,731,436 7.66% 35,430 $54.79 73,077 $466 $118Feb-05 $2,749,464 $237,952 23.28% $2,511,512 8.66% 45,486 $60.45 94,332 $529 $171Mar-05 $2,557,714 $244,889 24.73% $2,312,825 7.60% 45,098 $56.71 92,959 $680 $173Apr-05 $2,389,925 $190,654 20.77% $2,199,271 7.32% 44,948 $53.17 93,483 $530 $133May-05 $2,545,773 $186,070 19.61% $2,359,703 7.50% 46,780 $54.42 100,230 $517 $132Jun-05 $2,397,083 $204,805 23.21% $2,192,279 6.98% 45,877 $52.25 96,294 $569 $123
TOTALS $26,713,282 $2,600,141 23.74% $24,113,141 7.70% 483,900 $55.20 991,685 $520 $132
::

64
6002 YFserutidnepxE6002 YFserutidnepxE
053,11lavomeR eerT 308,971renroC - teertS niaM $ $ 378,1ecnanetniaM repmeK 237,811noisrevnoC yromrA $ $ 760,08rehtO & margorP klawediS 867,74ngiseD eganiarD eladtuorT $ $ 857,6kroW dleifllaB s'noiL 624,52ngiseD teertS - evirD areiviR $ $ 838,8rewoM weN 096,4ngiseD - noisorE tnalP retaW $ $ 213,33sneriS gninraW 422,831tcejorP eganiarD teertS nagroM $ $ 597,21tnempiuqE & kcurT lortnoC laminA 598,73selciheV tnemtrapeD kraP $ $ 328,92tnempiuqE & elciheV eciloP 525,11tnemesaB llaH ytiC $ $ 577,9redaerpS tlaS 000,43tcejorP wodniW esuoH dleiF nosnhoJ $ $
Police Station Construction (Final Payment) 52,135 852,21yevruS esuoH dleiF nosnhoJ $ $ 047,7stseV eciloP 379,34)2( sraC eciloP $ $ 174,1xoB looT 000,2eeF noitacilppA tnarG $ $ 74xoB retnalP 045,3reliarT $ $ 228,12riapeR redarG rotoM 061,5kroW eganiarD $ $ 643,5draoberocS 468,2metsyS dnuoS llaH ytiC $ $ 609,4sngiS teertS 011,3margorP noitaerceR $ $ 687,464truoC lairtsudnI aciremA-diM 185,11tnempiuqE retupmoC $ $ 349,27reweS mrotS kraP nosnhoJ 022,1riapeR teertS $ $ 538,671,1tcejorP reviR-pmuP tnalP retaW $ Transfer to Sanitation Fund - Operations 50,000$ 012,92noitavoneR looP 000,521snoitarepO - dnuF retaW ot refsnarT $ $ 074,332dliubeR )kcirB( teertS ht4 $ Transfer to General Fund 982,24ngiseD )kcirB( teertS ht6 000,008tegduB reP $ $ 263,3gnithgiL - teertS nagroM 719,347,1llaC dnoB & seidemeR $ $
936,317,5serutidnepxE dnuF gnimaG $
SOURCE: City of Boonville
CITY OF BOONVILLE
HOME DOCK COMMUNITIES' USE of GAMING FUNDS

65
CITY OF CARUTHERSVILLE
EXPENDITURES 2004-2005
Actual2005-2006
Actual2006-2007Budgeted
EXPENDITURES 2004-2005
Actual2005-2006
Actual2006-2007Budgeted
Drainage 339,023$ Public Safety000,02teertS ht4 000,01gnidnuF FIC $ $ 000,002eganiarD weivkraP $ Additional Police Officers 50,703$ 57,321$ 62,945$
Fire Department Equipment 82,813$ Water/Wastewater Improvements Humane Shelter Building 80,511$
Water Tower Maintenance 56,204$ 246,42riapeR lleW retaW $ Other Infrastructure
568sklawediS $ 8,254$ 10,000$ Street Improvements 086,3stnemevorpmI tropriA $ 11,000$
Miscellaneous Street Improvements 14,604$ 19,300$ 30,000$ Downtown Redevelopment 1,679$
204,626SLATOT $ 113,197$ 343,945$
SOURCE: City of CaruthersvilleNOTE: Numbers were rounded off

66
Adopted FY 2005-06
Adopted FY 2006-07
Adopted FY 2005-06
Adopted FY 2006-07
metsyS thgilteertSecnanetniaM derrefeD/tnempiuqEInformation Technology Streetlight System Expansion 9,396,000$ 9,396,000$
Citywide Personal Computer Replacement Program 1,450,000$ 1,450,000 063,552esahcruP thgilteertS BUPOM $ $ 256,438$ 191,583edargpU SIG $ 385,191$
Public FacilitiesPolice Department Municipal Service Center Debt Retirement 1,400,981$ 1,395,758$
000,428snoitarepO teelF $ 824,000$ City Market Debt Retirement 1,395,755$ 1,398,793$ 000,522ecnanetniaM oidaR 000,001sdnuorG & sgnidliuB ooZ ytiC sasnaK $ $
000,005ecnanetniaM kraP $ 755,000$ Neighborhood and Community Services 000,003ecnanetniaM looP gnimmiwS $ 100,000$
000,072tnemecalpeR tnempiuqE $ 270,000 702,002ecnanetniaM niatnuoF ytiC $ $ Community Center Maintenance 1,000,000$
Parks and Recreation Department 000,001noitarotseR tnemunoM/niatnuoF %1 $ 000,482tnemecalpeR tnempiuqE $ 1,300,000$ Parks Roads and Parking Lots 100,000$ 100,429$
Park Facilities Improvements 1,000,000$ 700,000$ Department of Public Works 000,000,1gnimmirT eerT $ 500,000$
000,759tnemecalpeR tnempiuqE $ 1,300,000$ City Hall Life Safety Improvements 175,000$
Convention & Entertainment Center Facility 400,000$ Capital Improvements 000,001ecnailpmoC ADA $
Roadways and Street Markings City Hall Building Maintenance 1,207,749$ 508,96noitavreserP teertS $ Fuel Tank (LUST) Removal 90,000$ 000,001tnemecalpeR ngiS doohrobhgieN $ 100,000$
Total Gaming Funds Allocated 21,878,299$ 21,639,358$
SOURCE: City of Kansas City
CITY OF KANSAS CITY

67
2006-07Adopted Budget
Parks/Recreation000,02stnemevorpmI krapllaB $ 000,09gnithgiL euqitnA $
StreetsSidewalk Improvements 20,000$ Equipment 11,000$
001,63selciheV & yrenihcaM $
Water000,002lleW retaW weN $
New Water Lines 40,000$ Equipment 20,475$
WastewaterNew Sewer Treatment Plant 300,000$ New Sewer Lines 290,000$
Public Safety005,61tnempiuqE eriF $ 000,57kcurT eriF repmuP desU $ 051,7tnempiuqE eciloP $
TOTAL 1,126,225$
SOURCE: City of LaGrange
CITY OF LAGRANGE

68
CITY OF MARYLAND HEIGHTS
2006 General FundPolice Department Expanded Operations 1,300,000$ Finance Department Expanded Operations 120,000$
000,012troppuS metsyS SIG $ Government Center - Debt Service Fund (Revenue Bonds) 1,080,000$ 000,011snoitaleR cilbuP $ 000,08)secruoseR namuH( evitartsinimdA $ General Fund (Requirement for funding) 2,460,000$
Planning Department Expanded Operations 70,000$ 000,085stsoC gnitarepO deificepsnU $ Reserve Fund (Total of 5% of gambling taxes placed in Reserve Fund) 820,000$ 000,074,2sesnepxE gnitarepO latoT $ 000,028secivreS gniluaH hsarT laitnediseR $ General Fund (Equal to cost of basic residential trash collection) 830,000$ 000,092,3dnuF lareneG latoT $ 000,028dnuF evreseR 6002 $ Capital Improvement Fund (50% of gambling taxes less debt service) 7,100,000$
2006 Capital Improvement Projects000,000,2margorP tnemecalpeR balS teertS $ Regional Infrastructure Fund (Any remaining funds) 4,110,000$ 000,002)steertS tlahpsA( gnicafrusorciM $ 000,002daoR eeF eeF $ 000,004,61latoT $ 000,051daoR erihsgiarC $ 000,05stnemevorpmI daoR htrowegdE $ 000,004,61euneveR xaT gnimaG detamitsE 6002 $ 000,003yawsserpxE sthgieH dnalyraM $ 000,002,3egnahcretnI 072-I/ttesroD $ 000,025,1* sexat gnimag s'raey roirp fo esU $000,003eunevA gnidraH $ 000,080,1ecivreS tbeD noitatS eciloP/llaH ytiC $ 000,029,71sdnuF gnimaG fo secruoS latoT $000,005,2noitcurtsnoC noitatS eciloP/llaH ytiC $ 000,572daoR dnalkcaL $ 000,002daoR yevleKcM $ 000,061gninnalP aerA dneB drawoH $ 000,003enaL doowkraP $ 000,000,1ecalP notgninneB $ 000,075tnemeganaM tnemevorpmI latipaC $ 000,075stnemevorpmI daoR rehtO $ 000,523yawkraP nodleW $ 000,523evirD lairtsudnI eniltseW $ 000,501kcurT tfiL laireA $
Total Capital Improvement Expenditures 13,810,000$
Total Expenditures in 2006 of Gaming Funds 17,920,000$
SOURCE: City of Maryland Heights
* Amounts that had accumulated in the City's Capital Improvement Fund to finance projects in 2006.
In 2003 the City established the distribution of gaming taxes to funds based on the priorities established by the City Council. These priorities result in the allocation of 2006 gaming taxes as follows:

69
CITY OF NORTH KANSAS CITYFY 04-05 Update
FY 05-06 Budget
FY 04-05 Update
FY 05-06 Budget
Services Contributions/Partnerships000,5.R.P - margorP nezitiC roineS $ 5,000 000,52rewoT gniniarT $ $
Snake Saturday Parade/BBQ - P.R. 44,000$ 45,650 069,98reyoF dnalhtroN $ $ 000,7.R.P - dnalrednoW retniW $ 7,100 000,55lairomeM snareteV $ $ 000,4.R.P - tsefnuF remmuS $ 10,000 000,01tamzaH dnalhtroN $ $ 000,51.R.P - licnuoC ssenisuB $ 26,000$ Buildings/Improvements
Saturday in Square & Friday in Park - P.R. 14,000$ 14,000 000,52rewoT gniniarT tnemtrapeD eriF $ $ 005,6.R.P - egnellahC etaroproC 300,64noitavoneR ybboL dna rebmahC licnuoC $ $
Employee Wellness Program - P.R. 4,500$ 4,500 841,1yrtneG 1212 - evlaV kcehC $ $ 005,4.R.P - eettimmoC ytefaS $ 4,500$ Reroof City Building Leased by Sutherlands 219,822$ 000,55.R.P - baL cisneroF lanoigeR $ 55,000 000,6972# noitatS eriF etavoneR $ $ 509,65secivreS lanoisseforP $ 85,000 000,571# noitatS eriF etavoneR $ $ 000,07seicnegnitnoC $ 200,000 587,611# noitatS lacirtcelE $ $
Land Acquisition 1,748,588$ 2,300,000 005,062ngiseD ytilicaF eciloP $ $ Land Improvements 641,597,1noitcurtsnoC ytilicaF eciloP $ 6,120,000$
254,4stcejorP noitacifituaeB $ 125,000 986yawklaW etagrebiF - retaW $ $ 917,341liarT gniklaW kraP nekcaM evaP 914,23tnalP retaW fooreR $ $ 627,01stoL ytiC yalrevO tlahpsA 633,2eliT looP riapeR - retneC ytinummoC $ $
000,05erutcurtS & skceD erauqS nwoT $ Equipment/Furniture895,31stnemecnahnE niatnuoF sdooW 374,231tnempiuqE - noitartsinimdA $ $
Information Technology 745,442tnempiuqE - tnemtrapeD eriF $ 52,000$ 518,88eriF 729,131tnempiuqE - tnemtrapeD eciloP $ $ 150,000$ 351,95eciloP 647,18tnempiuqE - tnemecrofnE sedoC $ $ 25,000$ 895,922latnemtrapedretnI $ 178,700 005,21tnempiuqE - sdnuorG & sgnidliuB $ $ 546,11retneC ytinummoC 532,121tnempiuqE - retneC ytinummoC $ $
005,7noisiviD sedoC - skroW cilbuP 362,921tnempiuqE - retaW $ $ 978,1retaW 541,3erutinruF - noitartsinimdA $ $
Infrastructure 906,85erutinruF - skroW cilbuP $ 513,5tnemssessA ytilibarenluV 936,21erutinruF - retneC ytinummoC $ $
Asphalt Water Department Parking Lot 44,972$ Interfund Transfers Out694,17gnihsibrufeR retliF 000,005tnemwodnE yrarbiL ot refsnarT $ $ 500,000$ 280,61seguaG sretemidibruT retliF 000,000,2tnemwodnE retneC ytinummoC ot refsnarT $ $ 2,000,000$ 840,47gninileR reweS 000,4dnuF yrarbiL ot refsnarT $ $ 4,000$
Transfer to Communications Utility Fund 6,500,000$ 1,500,000$ Transfer to Health Insurance Reserve 55,000$ 68,000$
Total Expenditures 16,145,883$ 13,639,450$
SOURCE: City of North Kansas City

70
CITY OF RIVERSIDE
6002-5002 YF6002-5002 YF
stnemevorpmI kraPseititnE rehtO ot ecnatsissA000,52eraC htlaeH dnalhtroN 781,53liarT keerC eniL $ $ 000,01ymrA noitavlaS 435,59kraP renneR ta kraP etakS $ $ 000,5ssorC deR naciremA $ 000,23stnediseR rof secivreS tisnarT $ Comprehensive Plan 90,450$ 000,4ynohpmyS dnalhtroN $ 005,1loohcS hgiH htuoS lliH kraP $ Property Acquisitions/Right of Way 237,153$ 000,3secivreS roineS ettalP $ 000,52lavitseF llaF derosnopS ytiC $ Equipment Purchases816,4feileR anirtaK enacirruH $ Computer Equipment & Software 31,767$
999,5tnempiuqE eciffO $ Horizon Development Commitment 3 - 2006 Ford Police Interceptors 69,321$
900 Acre Commercial/Industrial Park 997,425 023,4tnempiuqE oidaR $ $ 699,2tnempiuqE mraeriF $
Major Thoroughfare/Infrastructure 662,21tnempiuqE ytefaS cilbuP $ 082,251daoR yawetaG $ Initial Payment for Mini Pumper 41,477$ 891,73eunevA weivffilC 388,42tnempiuqE eriF $ $ 028,480,4daoR noiviV/yawetaG 322,71godretaW nollaG 0002 $ $ 790,4tsaE daoR noiviV 335,21rotcapmoC hsarT $ $ 654,22tseW daoR noiviV 095,5tnempiuqE skroW cilbuP $ $ 000,2evirD hgiH 080,3tnempiuqE skraP $ $ 941,99egdirB & daoR ettalP tseW $ 715,86xottaM $ Community Services104,52camirreM $ City Wide Trash Collection Service 49,685$
City Wide Clean Up Campaign 13,799$
427,653,6LATOT $
SOURCE: City of Riverside

71
CITY OF ST. CHARLES6002 YC5002 YC4002 YC6002 YC5002 YC4002 YCstcejorP retawmrotS
Debt Service - Stormwater Bonds 845,000$ 845,000$ 845,000 000,05epacsteertS evitaroceD $ $
Miscellaneous Stormwater Projects 200,000$ 275,000$ 275,000 000,02ecnanetniaM egdirB $ $
Cole Creek Creekbank Stabilization 445,000$ 405,000$ 700,000$ Fire - Personnel Costs 1,930,000$ 2,084,337$ 2,203,510$
000,561noitazilibatS knaB keerC .csiM $ 267,000$ 197,000$ Facilities Maintenance
000,53nalP noitneverP doolF sliarT kaO $ 200,000 000,001seliT gnilieC llaH ytiC ecalpeR $ )000,001( $ $
000,95magorP SEDPN $ (220,436)$ 50,000$ Equipment Replacement 35,000 )352,5( $ $
000,33gninaelC knaB keerC $ (38,000)$ Replace Garage Gate System 60,000$
000,001eganiarD ronaM revonaH 000,04ecivreS lacirtcelE edargpU $ )880,21( $ $
000,051tnemecalpeR epiP egdiR sretnuH 000,52sisylanA CAVH $ $
)000,011(gnippaM SIG 000,03ADA sriapeR rotavelE $ $
000,064egdiR lraeP $ 71,000 000,05stnemevorpmI retneC roineS $ $ Street Projects - Debt Service - Streets 166,000$ 1,097,000$ 1,058,000 000,54repeewS egaraG ecalpeR $ $
000,52ecnanetniaM yellA 000,03noitavoneR adnutoR llaH ytiC $ $ (7,659)$
000,02margorP rettuG & bruC 000,08noitavoneR edanoloC $ $
000,522ecnanetniaM klawediS $ 250,000 000,03niaM .S 101@ .lpeR CAVH $ $
000,07toL gnikraP yalrevO 000,04llaH ytiC-aremaC ytiruceS $ $
000,051,1noisnetxE teertS ht5 $ 184,219 000,52ledomeR moortseR llaH ytiC $ $
000,572stnemevorpmI noitcesretnI $ Police Department
000,003,1)ffulbreviR ot 07-I( teertS ht5 $ Personnel Costs 2,745,000$ 2,964,587$ 3,134,089$
000,021stcejorP noitazilangiS ciffarT 000,597ORS/eraD-stsoC lennosreP $ $ 859,175$ 908,299$
000,616,1noitcurtsnoceR teertS mlE 000,655metsyS oidaR-ecivreS tbeD $ $
Comprehensive Citywide Traffic Study 200,000$ Parks - Frenchtown Greenway 250,000$
000,04teertS niaM .S $ 300,000$ 255,000$ Webster Park Development 150,000$ 300,000$ 250,000$
000,002ycnegnitnoC teertS 005,8 $ 060,371noitisiuqcA dnaL $ $
000,03gnimlaC ciffarT $ (9,600)$ 5,000 000,05.ddA kraP lliH xoF-ecivreS tbeD $ $ 102,000$
000,51snoisnetxE klawediS $ 230,000$ 30,000 000,521kraP goD $ $
000,03snoitisiuqcA ytreporP .csiM $ 30,000$ 30,000$ Economic Development/Redev.
000,002niaM N sklawediS nwotnwoD 005,734dnuF tnempoleveD cimonocE $ $ (92,000)$ 375,000$
000,003.rpmI .farT .dR ocixeM & sgnirpS evaC 000,586tcejorP retneC noitnevnoC $ $
000,053.vorpmI .tnI teertS dr3 & hesmuceT 000,003tcejorP anerA $ $ 300,000$ 300,000$
000,04loohcS notneB ecneF evitaroceD 000,5stnemevorpmI rehtO/etisbeW $ $ (5,000)$
000,05dnoceS htroN .csiM - sehcneB 000,007tcejorP retneC ytinummoC $ $ 500,000$
000,001noitcennoC daoR nikskcuB 000,001stcejorP trA cibuP $ $ 50,000$
000,06trevluC xoB tS ht5 htuoS $ Water - Debt Service/Bonds 400,000$
000,05stnemecnahnE dR nwotrehcsoB $ Water Pollution Control-Bonds 300,000$ 000,532stcejorP noitazilangiS ciffarT $ Other - New Street Div. Facility 150,000$ 000,051nrobraehS/riaNcM/kraP notgnitnuH-sklawediS $ Foundry Art Center 200,000$ 200,000$ 190,000$
000,02sniatnuoF gniknirD 000,052tropriA lapicinuM $ $ (250,000)$
000,05punaelC tnorfreviR 050,898stsoC lennosreP $ $ 972,972$ 1,028,602$ 000,531langiS tropriA/relleuM 000,05sevreseR )fo esu( ot snoitiddA $ $ 484,500$ 50,000$
000,002yawhgihsgniK & kralC - qcA dnaL $ Frenchtown Facade Program 75,000$ 25,000$
000,561gnikraP teertS niaM htuoS 000,001rehtO- tnemevorpmI edaçaF $ $ 100,000$
000,051lotipaC ts1 & yalC tseW $ Lewis & Clark 2004 Event 200,000$
000,001)koorbrehS ot ykceB( sdnuorgriaF htuoS $ Arts & Culture Activities 200,000$ 200,000$ 272,000$
000,011nosreffeJ & ht5 $ Riverfront Plan/Infra. Improv. 20,000$ 20,000$ 20,000$
000,001etsorD/ensehcuD 000,001.vorpmI latipaC nwothcnerF $ $ 100,000$
000,04gninediW teertS mlE 000,001.vorpmI latipaC N 073 ywH $ $
000,05stnemecnahnE egnahcretnI $ Log Cabin Rescue 50,000$
000,001noitisiuqcA WOR daoR nnamlhE 000,05muesuM nwothcnerF $ $
000,52sngiS potS evitaroceD 000,05noitacifituaeB $ $
000,52sngiS doohrobhgieN 000,05margorP noisrevnoC latneR $ $
000,08esooG dliW & CC-langiS nairtsedeP loohcS $ Street Lighting 10,000$ 055,274,61SLATOT $ 16,302,814$ 15,750,000$
SOURCE: City of St. Charles

72
FY05 FY06 FY05 FY06
Festival/Celebrations 44,820$ 53,500$ Other000,52NAK-OM $ 25,000$
Public Safety Community Strategic Plan 12,000$ 12,000$ 834,41sneriS--eriF $ 11,573 000,42puorG nosugreF $ $ 24,000$
017,13reliarT ytefaS eriF--eriF $ Utility Acquisition 46,052$ 279,448$ Catholic Charities 13,000$ 13,000$
Downtown Clean up Program 9,700$ 9,700$ Air National Guard 15,000$ Downtown Partnership Contract 20,000$
Infrastructure 000,32tnemssessA latnemnorivnE $ 152,53tnemecalpeR klawediS yranoitercsiD 986,221stcejorP tnempoleveD $ $ 000,3riapeR niatnuoF--ecalP retsinimtseW 000,52etutitsnI ecneicS efiL lairtsudnI $ $ 25,000$
067,01liarT tnorfreviR 000,03sevitaitinI licnuoC $ $ 005,5kraP tnorfreviR 513,1daehworrA ta yaD eoJ .tS $ $
Smith Park Stairway Replacement 11,038$ 573,5tnatlusnoC dleifsnworB nwotnwoD $ 81,988$ 152,01tnemecalpeR klawediS kraP retneC civiC 000,2kraP llehctiM $ $
000,05tcejorP evreserP yrotsiH gniviL $ 25,351 005,9tsiybboL evitalsigeL $ $ 9,900$ Phil Welsh Renovations 105,516$
Projects for a Better Neighborhood--CAP 125,244$ 156,424$
Legal Claims 106,000$ 77,303$
Professional Services 2,000$
Chamber of Commerce - Marketing Campaign 150,000$ 185,000$
Vehicles/Minor Equipment/Other Items 182,697$ 398,128serutidnepxE latoT $ 1,439,150$
SOURCE: City of St. Joseph
CITY OF ST. JOSEPH

73
2004 Actual Expenditures
2005 Actual Expenditures
2006 Budget2004 Actual Expenditures
2005 Actual Expenditures
2006 Budget
Juvenile Office Registration - Elections
006,3tnempiuqE elinevuJ 000,02sesnepxE noitcelE $ $
truoC tiucriCerafleW dna htlaeH
000,51draoB erafleW laicoS $ Circuit Court Equipment 10,118$ 8,816$ 28,400$
Health Department 141,038$ 124,938$ 127,500$
000,52latipsoH ycreM $ Data Processing
Comm. Telecom. Ser. 7,167$ 7,527$ 7,200$
Public Services Computer Equip./Service 207,894$ 368,403$ 520,000$
009,29licnuoC noisnetxE $
Soil & Water Conservation 10,000$ 10,000$ 10,000$
General Accounts
Community Support 208,059$ 153,466$ 137,000$
New Radio System 53,177$ 53,177$
Public Defender Lease 35,739$ 33,946$ 35,000$
000,03sesnepxE maeT tamzaH $
General Expenses 161,566$ 212,123$ 136,617$
056,451egatsoP $ 177,600$ 190,000$
Professional Services 242,039$ 140,091$ 161,500$
000,8slacisyhP tnemecalP-erP $
Radio Antenna Contract 12,000$ 10,475$ 15,000$
744,342,1SLATOT $ 1,300,562$ 1,562,717$
SOURCE: Buchanan CountyNOTE: Numbers were rounded off
COUNTY OF BUCHANAN

74
CITY OF ST. LOUIS
Three Primary Sources:2% AGR Tax:
Admission Fee:
Port Authority Lease (2%of AGR):
FY03 FY04 FY05 FY06 FY07b
Public Safety000,05 gnithgiL teertS tnorfreviR $ 000,006 ytirohtuA troP ot tnemyaP $ 600,000$ 575,000$ 300,000$ 200,000$ 000,056slortaP eciloP $ 650,000$ 650,000$ 950,000$ 1,350,000$ 372,04seilppuS tinU eniraM tnemtrapeD eriF $ 9,977$ 2,509$ 31,159$ 25,000$
Compulsive Gamblers' Fund 50,000$ Subtotal 1,340,273$ 1,259,977$ 1,227,509$ 1,281,159$ 1,625,000$
Capital Improvements000,544,5noitubirtnoC dnuF latipaC $ 3,900,000$ 3,600,000$ 3,700,000$ 2,700,000$
Subtotal 5,445,000$ 3,900,000$ 3,600,000$ 3,700,000$ 2,700,000$ Economic Development
000,004,1tnempoleveD cimonocE CDLS $ 1,500,000$ 1,500,000$ 1,500,000$ 1,500,000$ Subtotal 1,400,000$ 1,500,000$ 1,500,000$ 1,500,000$ 1,500,000$
Total 8,185,273$ 6,659,977$ 6,327,509$ 6,481,159$ 5,825,000$
SOURCE: City of St. Louis
Allocated to support police patrols, fire marine unit supplies and conduct public safety related capital improvements on the riverfront.
Allocated to the City's Capital Fund. These funds are budgeted each year for items such as arterial street paving, bridge repair, rolling stock replacement, public building improvements, etc.
In addition to gaming taxes, this revenue is in the form of a lease payment paid to the Port Authority. These funds are generally appropriated for furthering housing and economic development efforts of the St. Louis Development Corporation (SLDC).

75
# of Occurrences A rettaM tcejbuSepyT noitcdetpodA setuniM gniteeM noissimmoCsetuniM fo lavorppA01
senif - onisaCnoitcA yranilpicsiD62onisaC - enif dednemAnoitcA yranilpicsiD1
laudividnInoitcA yranilpicsiD114 Hearing Officer Recommendation Individual's license denied8 Hearing Officer Recommendation Individual's license revoked10 Hearing Officer Recommendation Individual's license suspended1 Hearing Officer Recommendation Case dismissed2 Hearing Officer Recommendation No Action1 Hearing Officer Recommendation Amended fine - Casino1 Hearing Officer Recommendation Organization's license revoked - Bingo
rerutcafunam ogniBdeweneR esneciL9sonisaCdeweneR esneciL7sreilppuSdeweneR esneciL41
reilppus ogniBdeweneR esneciL51 Suppliers License Issued Bingo4 Suppliers License Issued Casino1 Manufacturer License Issued Bingo40 Occupational License Issued Individual1 Key Person License Issued Casino3 Rules & Regulations - Casino Final Order of Rulemaking6 Rules & Regulations - Casino Proposed Amendment2 Rules & Regulations - Casino Proposed Rule8 Rules & Regulations - Bingo Final Order of Rulemaking7 Rules & Regulations - Bingo Proposed Amendment
CGMsnoitalugeR & seluR2 ogniBtnemeltteS3onisaCtnemeltteS5
laudividnItnemeltteS2sretneserp suoiraVsnoitatneserP04
.oC draC gniyalP setatS detinU ;.oC gnimaG iruossiMlortnoC ni egnahC22 Delegating Authority to Chairman MGC1 Temporary Extension of Class A License Casino1 Gaming License Ratification Casino
Summary of Missouri Gaming Commission (MGC) Actions During FY 2006

76
Contacting the Missouri Gaming Commission
The Missouri Gaming Commission offices are located in Jefferson City, Kansas City and St. Louis. The offices are open Monday through Friday except on state holidays.
Jefferson City: Missouri Gaming Commission Headquarters3417 Knipp Drive(Mailing Address: PO Box 1847) Jefferson City MO 65102 Telephone: (573) 526-4080 Fax: (573) 526-1999
Kansas City: Missouri Gaming Commission Kansas City Office6300 Enterprise Road, Suite 125 Kansas City MO 64120 Telephone: (816) 482-5700 Fax: (816) 482-5704
St. Louis: Missouri Gaming Commission St. Louis Office11775 Borman Drive, Suite 104 St. Louis MO 63146 Telephone: (314) 340-4400 Fax: (314) 340-4404
Web site address: http://www.mgc.dps.mo.gov

