noise and blasting assessment appendix 12
TRANSCRIPT


REPORT NO. 03222 VERSION E
ANVIL HILL PROJECT NOISE & VIBRATION ASSESSMENT


ANVIL HILL PROJECT NOISE & VIBRATION ASSESSMENT
REPORT NO. 03222 VERSION E
AUGUST 2006
PREPARED FOR
UMWELT (AUSTRALIA) PTY LIMITED PO BOX 838
TORONTO NSW 2283


Report No. 03222 Version E
TABLE OF CONTENTS
Page
1 INTRODUCTION 1
2 PROJECT DESCRIPTION AND CONTEXT 2 2.1 The Anvil Hill Project 2 2.2 The Surrounding Area 2 2.3 Types of Noise & Vibration Impacts 3 2.4 Noise Controls 3 2.4.1 Restriction of Night Time Operations 3 2.4.2 Control of noise from Infrastructure 3 2.4.3 Control of Noise from Rail Spur 4 2.4.4 Real-time Noise Monitoring 4 2.4.5 Other Noise Control Measures 4
3 NOISE LEVEL CRITERIA 6 3.1 Operational Noise Criteria 6 3.1.1 Intrusiveness Criterion 6 3.1.2 Amenity Criterion 6 3.1.3 Operational Noise Levels at Places of Worship 7 3.1.4 Summary of Operational Noise Criteria 7 3.1.5 Exceedance of Criteria 8 3.2 Construction Noise Criteria 8 3.3 Road Traffic Noise Criteria 8 3.4 Blasting Assessment Criteria 9 3.4.1 Annoyance & Discomfort 9 3.4.2 Structural Damage 9 3.4.3 Mount Piper 500kV Power Transmission Line 10 3.4.4 Rock Shelters 10 3.5 Low Frequency Noise Criteria 10 3.6 Rail Noise Criteria 11
4 EXISTING NOISE ENVIRONMENT 12 4.1 Unattended Noise Measurements 12 4.2 Attended Noise Measurements 14
5 METEOROLOGICAL FACTORS 17 5.1 Measured Meteorological Data 17

6 OPERATIONAL NOISE IMPACTS 18 6.1 Noise Modelling Methodology 18 6.2 Noise Modelling Procedures 19 6.2.1 Construction Operations 19 6.2.2 Operational Noise Source Levels 21 6.2.3 Operational Methodology & Fleet Numbers 22 6.2.4 Modelling Assumptions 23 6.2.5 Calculation Details 24 6.2.6 Predicted Noise Levels at Residences 25 6.2.7 Predicted Noise Levels at Places of Worship 27 6.3 Potential for Sleep Disturbance 27 6.4 Cumulative Noise Impacts 28 6.5 Low Frequency Noise Impacts 28
7 OFF-SITE TRANSPORTATION NOISE IMPACTS 29 7.1 Road Traffic Noise Impacts 29 7.1.1 Existing Traffic Flows 30 7.1.2 Operational Traffic Noise Impacts 32 7.1.3 Prediction of Traffic Noise Levels on Wybong Road / Bengalla Link Road 34 7.1.4 Construction Traffic Impacts 35 7.1.5 Maximum Noise Levels during Vehicle Passbys 36 7.2 Cumulative Traffic Noise Impacts 37 7.3 Predicted Cumulative Noise Levels 40 7.4 Summary of Operational Traffic Noise Impacts 41 7.5 Rail Noise Impacts – Muswellbrook to Ulan line 41 7.5.1 Predicted Increase in Rail Noise Levels 42
8 BLASTING IMPACTS 46 8.1 Prediction of Noise and Vibration Levels 46 8.2 Conceptual Blast Designs 47 8.3 Predicted Residential Overpressure and Vibration Levels 49 8.4 Predicted Vibration Levels at TransGrid Pylons 50 8.5 Predicted Vibration Levels at Rock Shelters 50 8.6 Predicted Vibration Levels at Heritage Structures 51 8.7 Summary of Vibration Impacts from Blasting 51
9 CONCLUSION 54 APPENDIX A – Glossary of Terms APPENDIX B – Calculation of Temperature Inversion Strengths Methodology APPENDIX C – Calculated 10th Percentile Operational Noise Levels

Report No 03222 Version E Page 1
1 INTRODUCTION
Centennial Hunter Pty Limited (Centennial) proposes to establish an open cut coal mine and ancillary facilities including a Coal Preparation Plant (CPP) and rail loop in the Wybong area, 20km west of Muswellbrook and approximately 10km north of the township of Denman. The proposal, known as the Anvil Hill Project, is based on a large, undeveloped coal reserve of approximately 150 million tonnes (Mt) that is suitable for production of thermal coal for both domestic and export markets.
The proposal includes open cut coal mining over a 21 year period using a “truck and shovel” method. Up to four separate pits are proposed for the extraction of coal, however at any time there would only be one pit where coal is mined. An excavator would load coal onto trucks for transportation to a preparation plant. Coal would then be transported by conveyer to a rail loading facility, where it would be loaded onto trains for transport to domestic and export markets. Overburden would also be moved using a “truck and shovel” method and transported around various parts of the site. It is proposed that overburden be moved from any three of the four pits simultaneously. The landform would be progressively rehabilitated.
This report addresses potential noise and vibration impacts associated with all aspects of the proposal, including construction of the infrastructure, access road and rail loop; mining and rehabilitation activities; blasting; and transportation activities.
Noise from mining and transport activities onsite has been assessed in accordance with the NSW Department of Environment & Conservation’s (DEC) NSW Industrial Noise Policy (INP). In addition, the DEC’s Environmental Criteria for Road Traffic Noise (ECRTN) has been employed in the assessment of road traffic noise impacts.

Report No 03222 Version E Page 2
2 PROJECT DESCRIPTION AND CONTEXT
2.1 The Anvil Hill Project
The Anvil Hill Project comprises the design, construction and operation of:
• An open cut coal mine; • Coal handling and crushing facilities, a preparation plant (washery) and stockpile areas; • Water management, supply and distribution infrastructure; • Handling and placement of overburden (rock); • Mine access road including a new intersection on Wybong Road, internal access roads and
haul roads; • Infrastructure including offices, staff amenities, workshop, conveyors, and ancillary services;
and • A rail spur, rail loop and rail loading infrastructure for the transport of all product coal.
The proposal covers a 21 year project life. Detailed mine and project planning has been undertaken to develop a conceptual mine plan, with indicative stages modelled at years 2, 5, 10, 15 and 20 as well as the construction phase.
2.2 The Surrounding Area
The Anvil Hill Project is located in the Upper Hunter Valley, on the margin of the valley floor. The proposed disturbance boundary covers an area of approximately 2238 hectares.
The project area has been extensively used for agriculture since the 1800s and is dominated by rolling grazing land with remnant and regrowth woodland. The locality immediately surrounding the project area consists of mostly smaller rural holdings, dominated by rural residential land use, but also includes more intensive agricultural land uses such as vineyards, irrigation for lucerne and dairies.
The topography of the proposed disturbance area varies from lower slopes towards the Hunter River, through undulating and hilly lands to rocky outcrops. A notable topographical feature within this area is Anvil Hill itself which rises approximately 70m above the surrounding area at its highest point. It is located at the centre of the proposed mining area and consists of two hills connected by a saddle. Anvil Hill is not proposed to be mined. The lower sections of the proposed disturbance area are currently used for pastoral grazing, and a 500kV TransGrid power line crosses the site in a southeast / northwest direction.
The area surrounding the proposed disturbance area is dominated by a row of hills to the west and south. The hills to the west are not named, although they are known locally as “Wallaby Rocks”. Wallaby Rocks rise to a height of 264m AHD, being approximately 100m above the surrounding area and contain a visually dominant escarpment along the western side. The rocky area to the south known as Limb of Addy Hill rises to a height of 302m AHD, which is also approximately 100m above the surrounding area.
There are several other mine sites within 20km of the Anvil Hill Project including Mount Arthur North, Bengalla, Drayton and the approved Mount Pleasant mine. As such, to protect residential amenity, assessment of noise impacts from the Anvil Hill Project needs to consider not only impacts from the project itself, but also the potential for cumulative impacts with other existing and approved operations.

Report No 03222 Version E Page 3
2.3 Types of Noise & Vibration Impacts
A number of activities associated with the proposal have potential to cause noise impacts at nearby residential receivers. These are of typical nature to similar operations in the area.
Operational noise levels would be dominated by the transportation of overburden and coal around the site. The majority of noise would result from the movement of haul trucks and, to a lesser extent, the operation of dozers on overburden emplacements. Adverse meteorological conditions would increase noise levels at receivers from equipment, particularly at night time, as temperature inversions are a common feature in the local area at night. Noise levels would often be higher in the surrounding area at night time than during the daytime as a result. Much of the other operational equipment is contained within pits, and this plant would not contribute as much to the overall noise environment, however it would still be perceivable at times.
Another noise source would be vehicles travelling to and from the proposed mine when shifts are changing. These impacts would generally last for an hour at a time and would be of the same character as existing road traffic.
Typically, noise from infrastructure and rail loading and movement would be audible at residences close to these facilities but barely audible or inaudible at most residences surrounding the proposal.
Finally, noise from construction of the proposal would be audible during the 12 months that it would take to build the facilities. These noise levels would vary week to week depending on what activities were taking place. However, as a worst case the noise levels at residences during construction would be less than during normal operations.
2.4 Noise Controls
Several types of noise control measures are proposed as outlined below. Information on how these controls have been incorporated into the noise modelling procedures is discussed further in Section 6.2.4.
2.4.1 Restriction of Night Time Operations
Given that the greatest noise impacts are predicted to occur during the night time period, it is appropriate to consider methods of controlling operations at night, where feasible. Noise impacts are dominated by noise from the operation of haul trucks around the site, and hence maximum benefit would be obtained by restricting their operation. Therefore, at night trucks would be restricted to operate below the maximum elevation of the overburden emplacement areas. This is considered both practical and economically viable and was found to have a more significant impact than construction of bunding on top of overburden emplacement areas (see below). Further, dozers involved in the distribution of overburden would also be restricted to the same working elevation.
2.4.2 Control of noise from Infrastructure
• All infrastructure and coal handling plant would be located in topographically shielded positions on the site, which are specifically located to reduce noise impacts to adjacent residences.
• The coal preparation plant, rejects bin and crushing stations including the roof / ceiling, would be enclosed with cladding.
• All conveyors used in the plant would incorporate shielding close to the belt on the side closest to residential receivers.

Report No 03222 Version E Page 4
2.4.3 Control of Noise from Rail Spur
The location of the rail loop requires part of the track to be positioned in a substantial degree of cutting as a result of the natural topography at the northern end of the loop. This in itself provides surrounding residences with a high degree of shielding from rail noise. As the track progresses south and out of the loop it is proposed to construct a barrier (fence) to a height of 4 metres above the track on the eastern side. This barrier will continue to where the spur joins the main Muswellbrook to Ulan line. A second barrier is proposed to be constructed on the opposite side of the track, from the intersection with the main line to where the track turns to the north, to provide shielding to those properties to the south of the rail spur.
2.4.4 Real-time Noise Monitoring
It is proposed to monitor operational noise levels from the Anvil Hill Project with a real-time monitoring system. The commitment to use such a system goes beyond normal DEC monitoring requirements and has proved effective to assist in noise management at several other sites in NSW.
This real time system would not be utilised as a substitution for compliance monitoring which generally involves attended noise monitoring at various residential locations around the proposal.
2.4.5 Other Noise Control Measures
Several other noise control measures have been considered in the preparation of this assessment, but are not considered to be appropriate for the proposal. They include the following.
Restriction of operations under adverse meteorological conditions
Consideration was given to restricting or stopping operations at night under adverse meteorological conditions. Potential noise impacts are greatest under strong temperature inversions. However, investigation of the occurrence of temperature inversions at Anvil Hill showed a very high frequency of such strong temperature inversions. Figure 2-1 shows the occurrence as a percentage of the night time period for each season. It is noted that inversion strengths of 4°/100m are prevalent, with occurrences of between 42.8% of the time during summer nights and up to 84.8% of the time during winter nights. The proponent has advised that not operating for this amount of time would not be financially viable for the proposal.

Report No 03222 Version E Page 5
Figure 2-1 Temperature Inversion probabilities at Anvil Hill
Use of Trolley Assist System
Trolley assist systems allow haul trucks to use power from fixed overhead wiring, with the diesel engine operating at idle speed only. However such systems are only viable where there is a major haul route through the site. There is no scope for such a system for the Anvil Hill Project.
Use of Bunding on overburden emplacement areas
Bunding at the top of the overburden emplacement areas was modelled under night time conditions. While the bunding would greatly reduce the noise levels at residences due to dozers operating at the top of the emplacements, there was negligible reduction in the noise level from haul trucks, and therefore the overall noise levels at residences were only marginally affected. It was found to be more effective to put controls on the operating elevations of haul trucks and dozers as discussed in Section 2.4.1 above.
0%
10%
20%
30%
40%
50%
60%
70%
80%
90%
100%
0 2 4 6
Inversion Strength, deg C per 100m
Perc
enta
ge o
f Nig
ht-T
ime
Perio
dSpring Summer
Autumn Winter

Report No 03222 Version E Page 6
3 NOISE LEVEL CRITERIA
This section discusses the various noise and vibration criteria and guidelines set out by the NSW Government with regard to different types of activity from the proposal that have potential to impact on the surrounding area.
3.1 Operational Noise Criteria
The NSW Industrial Noise Policy (INP) sets out two forms of noise criterion. In assessing noise levels at residences, the criteria should be assessed at the most-affected point on or within the residential property boundary or, if this is more than 30m from the residence, at the most-affected point within 30m of the residence. The two criteria are described below.
3.1.1 Intrusiveness Criterion
The intrusiveness criterion specifies that the LAeq noise level from the proposed source should not exceed the RBL by more than 5dBA. The RBL is defined as the overall single-figure background level representing each measurement period (day, evening and night) over the whole monitoring period. The RBL is the level used for assessment purposes. Where the RBL is found to be less than 30dBA, it is to be set to 30dBA.
In the present case, the application of modifying factors may be relevant for certain specific noise sources, notably an adjustment for tonality and an adjustment for impulsiveness. These sources are assessed separately below in terms of their potential to cause sleep disturbance. However, the overall noise at any residence due to all mining activities would be dominated by continuous or quasi-continuous sources such as haul trucks, and would be unlikely to attract such adjustments. Hence, the criterion noise level is set equal to the RBL + 5dBA, for the relevant time period.
This criterion should be assessed under specific meteorological conditions, which are detailed in the INP. Definition of appropriate meteorological conditions is discussed in detail in Chapter 5.
3.1.2 Amenity Criterion
The second type of criterion is an amenity criterion, and is intended to ensure that the total LAeq noise level from all industrial sources does not exceed specified levels. For rural residences, the relevant recommended “acceptable” levels are:
• Daytime (7.00am-6.00pm) 50dBA LAeq • Evening (6.00pm-10.00pm) 45dBA LAeq • Night Time (10.00pm-7.00am) 40dBA LAeq
Report No 03222 Version E Page 7
(These time periods are as defined above for calculation of the RBL, with the exception that for the purpose of the amenity criterion only, the “night” period extends to 8.00am, rather than 7.00am, on Sundays and public holidays.)
The amenity criterion represents the cumulative impact of all existing and potential industrial noise sources affecting a location, and the appropriate criterion for a new source depends on the existing and future noise levels from other existing or approved industrial sources. The Policy specifies explicitly how the above values should be reduced if the existing noise level from other industrial sources is known. Surveys have not identified any existing industrial noise at potentially affected residences, and hence the values above represent the amenity criterion for noise from the project. There are no approved industrial developments that influence the criteria for this project.
3.1.3 Operational Noise Levels at Places of Worship
Two churches have been identified near the proposal, namely a Catholic Church on Wybong Road and an Anglican Church on Castlerock Road. There are no specific criteria in the NSW Industrial Noise Policy (INP) for places of worship, however in respect of such premises, Australian Standard 2107:2000 Acoustics – Recommended Design Sound Levels and Reverberation Times for Building Interiors recommends a maximum internal level of LAeq 35dBA for places of worship without speech amplification systems. Internal noise levels are generally 10dBA below external noise levels with windows open to a normal extent. The above Australian Standard would therefore imply a recommended external noise level of LAeq 45dBA at the churches.
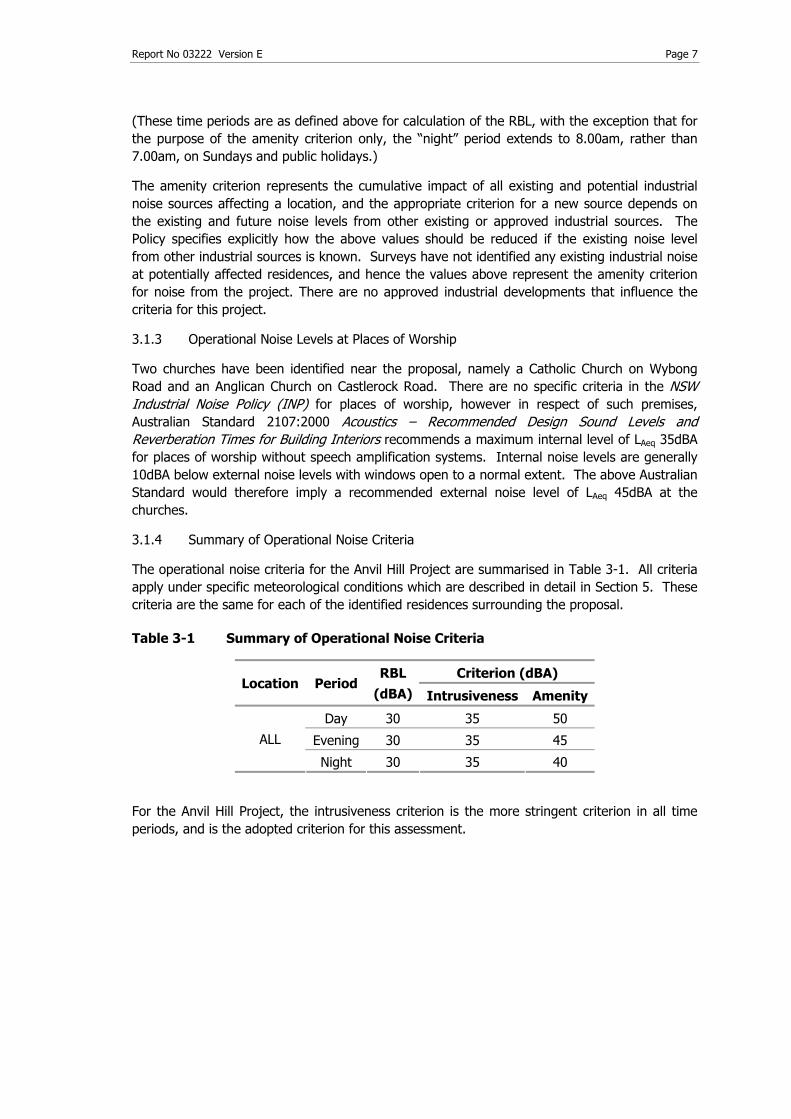
3.1.4 Summary of Operational Noise Criteria
The operational noise criteria for the Anvil Hill Project are summarised in Table 3-1. All criteria apply under specific meteorological conditions which are described in detail in Section 5. These criteria are the same for each of the identified residences surrounding the proposal.
Table 3-1 Summary of Operational Noise Criteria
Criterion (dBA) Location Period
RBL (dBA) Intrusiveness Amenity
Day 30 35 50
Evening 30 35 45 ALL
Night 30 35 40
For the Anvil Hill Project, the intrusiveness criterion is the more stringent criterion in all time periods, and is the adopted criterion for this assessment.

Report No 03222 Version E Page 8
3.1.5 Exceedance of Criteria
In cases where the criteria set out in Section 3.1.4 are exceeded, the INP sets out a range of responses, including:
• Application of “feasible and reasonable” mitigation measures to reduce noise levels; • Negotiation with relevant government bodies and/or the affected community to determine
reasonable levels based on the extent of any residual impacts and other factors such as social and economic benefits derived from the noise source; and
• In extreme cases, acquisition of affected properties. Recent Department of Planning (DOP) approach for major projects would suggest acquisition of properties where the operational noise level, under meteorological conditions as defined in Section 5, exceeds the RBL by more than 10dBA.
In particular, the Policy indicates:
The industrial noise source criteria … are best regarded as planning tools. They are not mandatory, and an application for a noise-producing development is not determined purely on the basis of compliance or otherwise with the noise criteria. Numerous other factors need to be taken into account in the determination. These factors include economic consequences, other environmental effects and the social worth of the development. The criteria help to determine consent/licence conditions because they provide information on the likely effect of any environmental noise associated with the development.
3.2 Construction Noise Criteria
There are no criteria within either document for construction activities that are expected to last for longer than 26 weeks, as is the case with the Anvil Hill Project, where the period of construction works is expected to last for up to 12 months. It is therefore considered reasonable to assess long-term construction activities as being a phase of the general operations for the project. As such it is proposed that the criteria for operational noise outlined in Section 3.1 should also be used to assess construction noise. This methodology has proved acceptable to the DEC on similar projects.
3.3 Road Traffic Noise Criteria
Criteria for assessment of noise from traffic on public roads are set out in the Environmental Criteria for Road Traffic Noise (ECRTN). The relevant criteria are set out in Table 3-2. In terms of the ECRTN road classifications, Denman Road would be considered a “collector” road and both Wybong and the Bengalla Link roads considered “local” roads.

Report No 03222 Version E Page 9
Table 3-2 Criteria for Traffic Noise – Residences
Noise Level Criterion
Type of Development Daytime (7.00am-10.00pm)
Night Time (10.00pm-7.00am)
Where Criteria are already Exceeded
Land use developments
with potential to create
additional traffic on
collector roads
LAeq,5hr
60dBA
LAeq,1hr
55dBA
Land use developments
with potential to create
additional traffic on local
roads
LAeq,5hr
55dBA
LAeq,1hr
50dBA
In all cases, the redevelopment should be
designed so as not to increase existing noise
levels by more than 2dB.
Where feasible & reasonable, noise levels from
existing roads should be reduced to meet the
noise criteria. In many instances this may be
achievable only through long-term strategies…
3.4 Blasting Assessment Criteria
3.4.1 Annoyance & Discomfort
For assessment of annoyance due to blasting, the DEC (and most similar authorities in Australia) adopt guidelines produced by the Australian and New Zealand Environment and Conservation Council (ANZECC). The fundamental criteria are that at any residence or other sensitive location:
• The maximum overpressure due to blasting should not exceed 115dB for more than 5% of blasts in any year, and should not exceed 120dB for any blast; and
• The maximum peak particle ground velocity should not exceed 5mm/sec for more than 5% of blasts in any year, and should not exceed 10mm/sec for any blast.
3.4.2 Structural Damage
At sufficiently high levels, blast overpressure may in itself cause structural damage to some building elements such as windows. However, this occurs at peak overpressure levels of about 133dB and above, well in excess of criteria for annoyance.
For assessment of damage due to ground vibration, Australian Standard AS2187.2-1993 Explosives – Storage, Transport and Use contains an appendix specifying recommended levels for peak particle vibration velocity to protect typical buildings from damage. These are:
• “Structures that may be particularly susceptible to ground vibration” – 5mm/sec • “Houses and low-rise residential buildings; commercial buildings not included below” –
10mm/sec • “Commercial and industrial buildings or structures of reinforced concrete or steel
construction” – 25mm/sec

Report No 03222 Version E Page 10
The Standard notes that there may be special cases including high-rise buildings, reservoirs and buildings housing sensitive equipment where alternative criteria may be appropriate. No such structure has been identified in the vicinity of the Anvil Hill Project.
A number of heritage sites have been identified surrounding the proposal. These sites have been inspected by a historic architect and one assessed as being susceptible to damage from vibration from blasting. At this site the 5mm/sec criterion has been adopted. Other heritage sites that are not particularly susceptible to damage from vibration adopt the 10mm/sec building damage criterion.
3.4.3 Mount Piper 500kV Power Transmission Line
A 500kV power transmission line runs through the project area and has been subject of discussions between the proponent and Transgrid. The following comments have been offered by Transgrid in relation to blasting near the transmission line.
• Vibration effects at the transmission line structures should be limited to levels of 50mm/sec. Predictions of the effects of blasting on the structures should be provided prior to works commencing. Monitoring of vibration levels at the line structures should be carried out throughout the blasting and the results made available to Transgrid on a regular basis. Where predicted and/or actual levels exceed 50mm/sec, blasting shall not proceed until the effects are assessed by Transgrid and the necessary action taken to protect the transmission line.
• Flyrock from blasting operations could damage the transmission line, in particular the conductors, insulators and structures.
3.4.4 Rock Shelters
A number of rock shelters and rock formations are located within the Project Area. While historically and culturally significant, it is unlikely that these structures are particularly susceptible to ground vibration and as such the 5mm/sec criterion is not considered appropriate in this case. RCA Australia has surveyed these structures, and advised appropriate levels to protect their structural integrity, and this report is included as another Appendix to the EA.
3.5 Low Frequency Noise Criteria
No criteria exist in NSW with regard to exposure to low frequency noise at residences. This topic has, however, been highlighted by a few local landholders as being of concern. A recent technical paper produced by the University of Salford, UK, proposes a criterion to assist in determining whether a low frequency disturbance exists.
A measurement of LAeq, L10 and L90 is taken in third octave bands between 10Hz and 160Hz. If the LAeq taken over a time when the noise is said to be present exceeds the reference curve in Table 3-3, it may indicate a source of low frequency noise that could cause disturbance. The character of the sound should be checked if possible by playing back an audio recording at an amplified level.
Table 3-3 Proposed Reference Curve
Hz 10 12.5 16 20 25 31.5 40 50 63 80 100 125 160
dB, Leq 92 87 83 74 64 56 49 43 42 40 38 36 34

Report No 03222 Version E Page 11
If the noise occurs only during the day then a 5dB relaxation may be applied to all third octave bands. If the noise is steady then a 5dB relaxation may be applied to all third octave bands. A noise is considered steady if either of the conditions below is met:
• L10 – L90 <5dB • The rate of change of sound pressure level (fast time weighting) is less than 10dB per
second.
The above parameters are evaluated in the third octave band which exceeds the reference curve by the greatest margin.
3.6 Rail Noise Criteria
Australian Rail Track Corporation (ARTC) operates the Gulgong - Sandy Hollow, Merriwa and Main Northern railways. Noise emissions from railways operated by the ARTC are regulated via ARTC’s EPL 3142. The EPL Section L6 does not nominate specific environmental noise limits but notes that:
“It is an objective of this licence to progressively reduce noise levels of railway operations to appropriate goals through the implementation of Pollution Reduction Programs (PRPs).”
At present the Gulgong - Sandy Hollow and Main Northern railways are not subject to a PRP (Pollution Reduction Program). However, EPL 3142 provides that “In developing the PRPs, the licensee must work towards the goals of 65 dBA LAeq, (daytime), 60 dBA LAeq, (night time) and 85 dBA (24hr) max pass-by noise, at one metre from the facade of affected residential properties”. Based on the above guideline noise assessment goals, the following noise criteria have been adopted for the Anvil Hill Project: • LAeq,9hr = 60dBA • LAeq,15hr = 65dBA • LAmax = 85dBA
Report No 03222 Version E Page 12
4 EXISTING NOISE ENVIRONMENT
The existing ambient noise environment around the proposal has been monitored on several occasions, both by means of unattended noise logging, and by attended measurements.
4.1 Unattended Noise Measurements
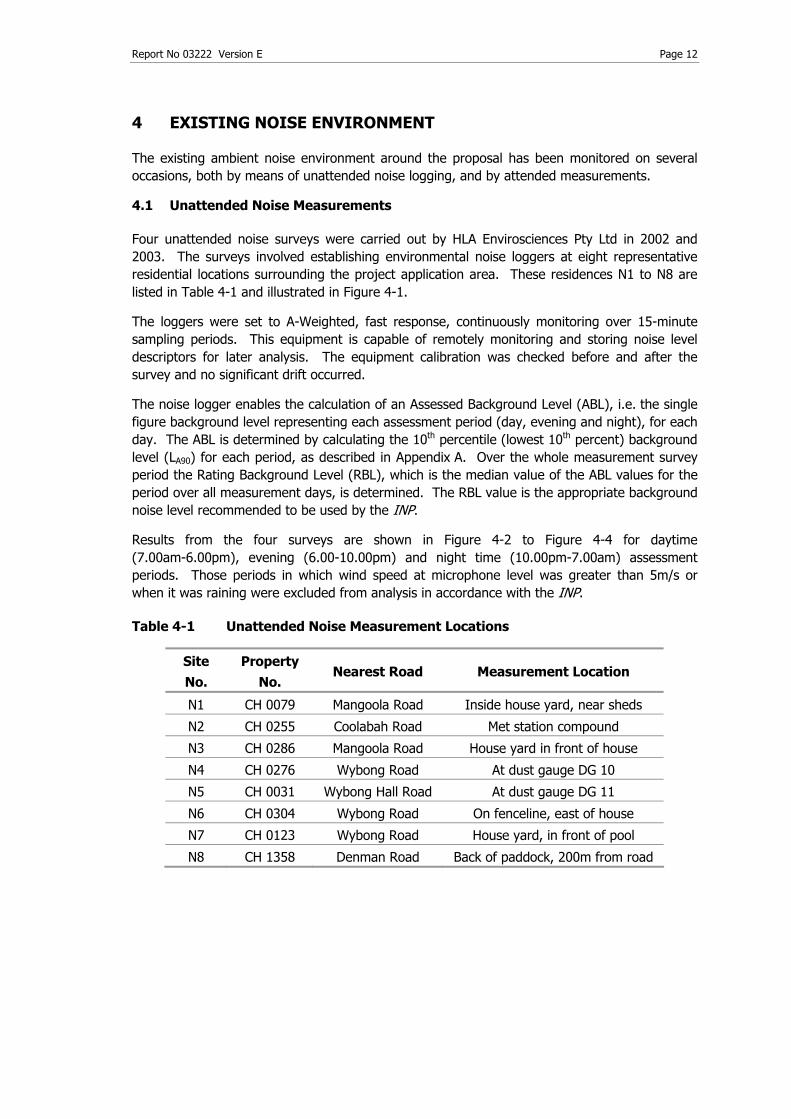
Four unattended noise surveys were carried out by HLA Envirosciences Pty Ltd in 2002 and 2003. The surveys involved establishing environmental noise loggers at eight representative residential locations surrounding the project application area. These residences N1 to N8 are listed in Table 4-1 and illustrated in Figure 4-1.
The loggers were set to A-Weighted, fast response, continuously monitoring over 15-minute sampling periods. This equipment is capable of remotely monitoring and storing noise level descriptors for later analysis. The equipment calibration was checked before and after the survey and no significant drift occurred.
The noise logger enables the calculation of an Assessed Background Level (ABL), i.e. the single figure background level representing each assessment period (day, evening and night), for each day. The ABL is determined by calculating the 10th percentile (lowest 10th percent) background level (LA90) for each period, as described in Appendix A. Over the whole measurement survey period the Rating Background Level (RBL), which is the median value of the ABL values for the period over all measurement days, is determined. The RBL value is the appropriate background noise level recommended to be used by the INP.
Results from the four surveys are shown in Figure 4-2 to Figure 4-4 for daytime (7.00am-6.00pm), evening (6.00-10.00pm) and night time (10.00pm-7.00am) assessment periods. Those periods in which wind speed at microphone level was greater than 5m/s or when it was raining were excluded from analysis in accordance with the INP.
Table 4-1 Unattended Noise Measurement Locations
Site No.
Property No.
Nearest Road Measurement Location
N1 CH 0079 Mangoola Road Inside house yard, near sheds
N2 CH 0255 Coolabah Road Met station compound
N3 CH 0286 Mangoola Road House yard in front of house
N4 CH 0276 Wybong Road At dust gauge DG 10
N5 CH 0031 Wybong Hall Road At dust gauge DG 11
N6 CH 0304 Wybong Road On fenceline, east of house
N7 CH 0123 Wybong Road House yard, in front of pool
N8 CH 1358 Denman Road Back of paddock, 200m from road


Report No 03222 Version E Page 13
Figure 4-2 Measured Daytime Background Noise Levels
Daytime Background Noise Levels
20.0
25.0
30.0
35.0
40.0
45.0
50.0
Mar
-02
Jul-0
2O
ct-0
2Ja
n-03
Mar
-02
Jul-0
2O
ct-0
2Ja
n-03
Mar
-02
Jul-0
2O
ct-0
2Ja
n-03
Mar
-02
Jul-0
2O
ct-0
2Ja
n-03
Mar
-02
Jul-0
2O
ct-0
2Ja
n-03
Mar
-02
Jul-0
2O
ct-0
2Ja
n-03
Mar
-02
Jul-0
2O
ct-0
2Ja
n-03
Mar
-02
Jul-0
2O
ct-0
2Ja
n-03
RBL,
dB
A
Figure 4-3 Measured Evening Background Noise Levels
Evening Background Noise Levels
20.0
25.0
30.0
35.0
40.0
45.0
50.0
Mar
-02
Jul-0
2O
ct-0
2Ja
n-03
Mar
-02
Jul-0
2O
ct-0
2Ja
n-03
Mar
-02
Jul-0
2O
ct-0
2Ja
n-03
Mar
-02
Jul-0
2O
ct-0
2Ja
n-03
Mar
-02
Jul-0
2O
ct-0
2Ja
n-03
Mar
-02
Jul-0
2O
ct-0
2Ja
n-03
Mar
-02
Jul-0
2O
ct-0
2Ja
n-03
Mar
-02
Jul-0
2O
ct-0
2Ja
n-03
RBL,
dBA
N1 N2 N3 N4 N5 N6 N7 N8
N1 N2 N3 N4 N5 N6 N7 N8

Report No 03222 Version E Page 14
Figure 4-4 Measured Night Time Background Noise Levels
Night-Time Background Noise Levels
20.0
25.0
30.0
35.0
40.0
45.0
50.0
Mar
-02
Jul-0
2O
ct-0
2Ja
n-03
Mar
-02
Jul-0
2O
ct-0
2Ja
n-03
Mar
-02
Jul-0
2O
ct-0
2Ja
n-03
Mar
-02
Jul-0
2O
ct-0
2Ja
n-03
Mar
-02
Jul-0
2O
ct-0
2Ja
n-03
Mar
-02
Jul-0
2O
ct-0
2Ja
n-03
Mar
-02
Jul-0
2O
ct-0
2Ja
n-03
Mar
-02
Jul-0
2O
ct-0
2Ja
n-03
RB
L, d
BA
Although some sites have missing data due to logger failure, it is clear that the RBL background levels are generally below 30dBA for day, evening and night. There are some locations which show dramatic increases in RBL noise levels in the summer and autumn months, but this is most likely due to localised insect noise.
4.2 Attended Noise Measurements
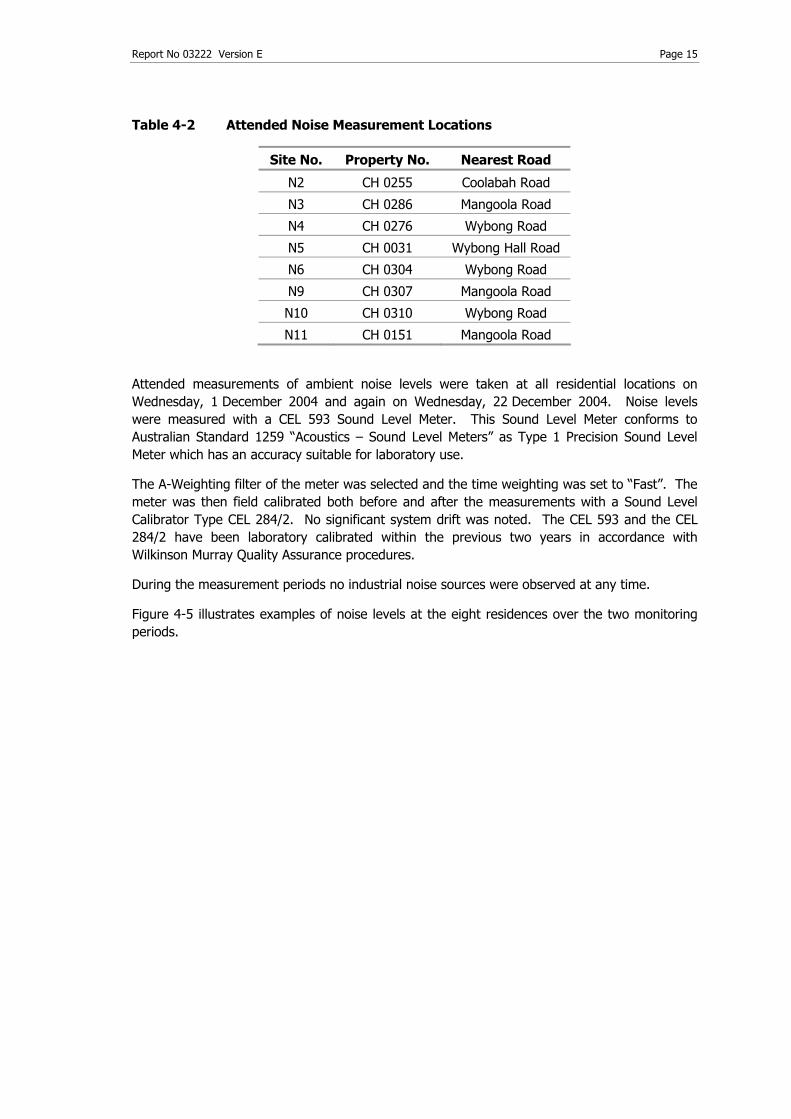
Further attended noise measurements were conducted by Wilkinson Murray in December 2004. The purpose of these measurements was to establish whether there was any existing industrial noise in the area. Eight residences were chosen for short-term attended noise monitoring. Five of these residences were the same as those at which unattended monitoring was carried out. A full list of monitoring locations is shown in Table 4-2 and their locations illustrated in Figure 4-1. Monitoring was carried out at the roadside boundary of all residences.
N1 N2 N3 N4 N5 N6 N7 N8
Report No 03222 Version E Page 15
Table 4-2 Attended Noise Measurement Locations
Site No. Property No. Nearest Road
N2 CH 0255 Coolabah Road
N3 CH 0286 Mangoola Road
N4 CH 0276 Wybong Road
N5 CH 0031 Wybong Hall Road
N6 CH 0304 Wybong Road
N9 CH 0307 Mangoola Road
N10 CH 0310 Wybong Road
N11 CH 0151 Mangoola Road
Attended measurements of ambient noise levels were taken at all residential locations on Wednesday, 1 December 2004 and again on Wednesday, 22 December 2004. Noise levels were measured with a CEL 593 Sound Level Meter. This Sound Level Meter conforms to Australian Standard 1259 “Acoustics – Sound Level Meters” as Type 1 Precision Sound Level Meter which has an accuracy suitable for laboratory use.
The A-Weighting filter of the meter was selected and the time weighting was set to “Fast”. The meter was then field calibrated both before and after the measurements with a Sound Level Calibrator Type CEL 284/2. No significant system drift was noted. The CEL 593 and the CEL 284/2 have been laboratory calibrated within the previous two years in accordance with Wilkinson Murray Quality Assurance procedures.
During the measurement periods no industrial noise sources were observed at any time.
Figure 4-5 illustrates examples of noise levels at the eight residences over the two monitoring periods.

Report No 03222 Version E Page 16
Figure 4-5 Examples of Maximum Noise Levels during monitoring surveys
20 30 40 50 60 70 80
Maximum Sound Level, dBA
Passing cars
Aircraft
Birds
Crickets
Frogs
Dogs
Distant cars
Insects
Wind

Report No 03222 Version E Page 17
5 METEOROLOGICAL FACTORS
Noise levels experienced by a receiver at relatively large distances from a source can vary considerably under different meteorological conditions, particularly at night. Prevailing wind and air temperature gradients will change over the course of the night time period, and hence noise levels at receivers will change, even when the noise source level is constant.
The INP identifies the Hunter Valley as a region where occurrence of temperature inversions is frequent and as such the effect of metrological conditions must be addressed in the prediction of noise levels from the proposal.
The INP generally directs the use of a single set of adverse meteorological data to use in the assessment of noise impacts; however Wilkinson Murray has adopted a more rigorous approach in past assessments where noise levels at residences are calculated under a varied set of existing meteorological conditions. Measured statistical occurrences of these conditions over a period of one year are then applied to the results, and a 10th percentile exceedance level calculated, which is then compared with relevant criteria. This approach is generally more conservative than one using a single set of meteorological data as it accounts for the directional distribution of prevailing winds for each residence surrounding the proposal.
This alternative assessment procedure involves significantly greater computational complexity than the use of a single set of meteorological conditions, but provides a much more direct and comprehensible description of noise impacts at a receiver. This approach of using the 10th percentile calculated noise level as a measure of noise impacts on residences has been considered acceptable by the DEC for previous similar assessments. Due to the relatively large number of residences in the area surrounding the Anvil Hill Project, this alternative procedure is considered appropriate and has been adopted.
5.1 Measured Meteorological Data
Three sets of meteorological data were available for this assessment:
• A weather station at Coolabah Road just within the southern project application boundary has recorded conditions from 2002-2005. This station provided data on wind speed and wind direction.
• A weather station at Wybong Road, a few hundred metres north of the northern project application boundary, has recorded conditions from 2002-2005. This station provided data on wind speed and wind direction, and also data on standard deviation of wind direction (sigma-theta).
Given that the above stations do not have the capacity to measure temperature gradients, a methodology needs to be formulated to calculate temperature inversion strengths at the project site. A third data set was therefore incorporated in this analysis - data from a mast in the Bengalla mining lease area. This monitoring station provides direct, high-quality measurements of temperature gradient. The full methodology of calculation of temperature inversion strengths for the proposal can be found in Appendix B.

Report No 03222 Version E Page 18
6 OPERATIONAL NOISE IMPACTS
This section outlines potential noise impacts at residences as a result of general operations at the proposal. This includes noise from mobile plant such as haul trucks, drills and dozers, and also potential impacts from infrastructure plant associated with the preparation of coal. Assessment of potential impacts from the proposed rail loadout facility and the impacts associated with the movement of trains on the proposed rail loop are also addressed in this section.
6.1 Noise Modelling Methodology
Operational noise levels at residences are calculated using the ENM prediction model. This model has been endorsed by the DEC for environmental noise assessment. The ENM model takes account of noise attenuation due to geometric spreading, atmospheric absorption, shielding and the effect of acoustically soft ground. It can also be used to predict noise levels under various meteorological conditions, defined by a combination of temperature gradient, wind speed and wind direction.
Calculations were undertaken for six progressive operational scenarios, namely a construction scenario and years 2, 5, 10, 15 and 20 of the proposal. For each year a representative “worst-case” scenario was modelled. Where plant could be operating in more than one position around the proposal, noise levels were calculated at various positions relative to the surrounding residences, and the highest noise level used as the worst-case.
Because different operating procedures are proposed for daytime (7.00am-10.00pm) and night-time (10.00pm-7.00am), two scenarios (day and night time) were modelled for each of the operating years.
Calculations were performed under a variety of meteorological conditions using the methodology outlined in Section 5. Noise levels were calculated under a total of 41 conditions for the 10 operational scenarios (day and night) at a total of 282 residences up to 8km surrounding the proposal. A summary of the inputs used in noise modelling is shown in Table 6-1. The following sections outline the calculation of noise levels in more detail.
Table 6-1 Noise Modelling Inputs
Modelling Inputs
Residential receivers From surveys undertaken locally and aerial photography.
Topography
Disturbed contours for operational years in accordance with the Conceptual
Mine Plan & local topography at residences provided by the NSW Lands
Department & Aerial Digital Terrain
DTM model from photogrammetry undertaken by Geospectrum.
Noise Source Levels From measurements of similar plant at other sites.
Meteorological data From measurements at Wybong Road and Bengalla weather stations (see
Section 5)

Report No 03222 Version E Page 19
6.2 Noise Modelling Procedures
6.2.1 Construction Operations
Construction of the project infrastructure is proposed for a period of in the order of one year. Noise impacts have been modelled on construction hours of generally 7.00am-7.00pm seven days per week. Construction activities include:
• Box cut and haul roads; • Coal preparation plant, ROM pad, washery, crushers, conveyers and rail loadout bin and site
roads; • Facilities including office buildings; • Tailings dam; • A new access road from Wybong Road to the facilities; and • A rail loop and spur running from the rail loadout bin to the main Muswellbrook to Ulan line.
Sound Power Levels have been modelled for items of plant typically utilised in construction of a mine site and are shown in Table 6-2. Plant locations are shown in Figure 6-1.


Report No 03222 Version E Page 20
Table 6-2 Modelled Equipment Sound Power Levels
FigureRef.
Equipment No. Operating
Simultaneously
Sound Power Level
LAeq (dBA)
Box Cut, ROM pad & Tailings dam construction
1 Front end loader 1 110
2a, 2b Dump Truck 2 114
3a, 3b Dump Truck 2 114
4 Diesel drill 1 114
5 Dozer 1 118
6 Dozer 1 118
7 Grader 1 109
8 Watercart 1 114
9 Plate Compactor 1 115
CPP & Mine Facilities Construction
10 Crane 1 100
11 Mobile Crane 1 105
Coal Handling Infrastructure construction
12 Crane 1 100
13 Mobile Crane 1 105
Rail Spur and loop construction
14 Crane 1 100
15 Mobile Crane 1 105
16a,
16b Delivery Truck 2 111
17 Dozer 1 110
18 Excavator 1 110
19 Plate Compactor 1 115
20 Tamper 1 118
21 Regulator 1 110
Mine Access Road Construction
22 Dozer 1 110
23 Grader 1 109
24a,
24b Trucks 2 108
25 Water cart (small) 1 110
26 Compactor (vibrating) 1 114
27 Asphalt Spreader 1 98
28 Rubber tyred roller 1 101 Note: The above plant and associated sound power levels are indicative of typical construction operations

Report No 03222 Version E Page 21
Given the length of the construction period, it is appropriate to assess potential impacts under daytime meteorological conditions using the ENM noise model. Plant locations were selected as “worst-case”, positioned at points where they have the greatest potential for noise impacts for nearby residences. In particular the track laying equipment for the rail loop (tamper and regulator) was positioned at the point where it is on an embankment rather than at the loop where the track is in considerable depth of cutting which would shield noise from track laying operations. The equipment involved in the construction of the mine access road was similarly modelled in the worst-case location, at the intersection with Wybong Road.
6.2.2 Operational Noise Source Levels
Noise sources associated with plant and infrastructure operating around the proposal, and their typical LAeq noise levels, are shown in Table 6-3. These levels are based on measurements conducted at a number of similar operations. In regard to haul trucks, noise levels can vary considerably depending on the manufacturer and the degree of retrofitted noise attenuation measures. Typical trucks range from 111-117dBA in practice, with some older-style vehicles measured at up to 121dBA. As the manufacturer of trucks at the proposal is not yet known, a figure of 114dBA has been adopted in the noise modelling. This figure is considered to be reliably achievable either with new trucks, or in some cases older trucks with some degree of noise attenuation.
Table 6-3 Modelled Equipment Sound Power Levels
Equipment
Assumed LAeq Sound
Power Level (dBA)
Comments
Haul Truck 114
Drill 114
Excavator 118
Dozer 118
Water cart 114
Grader 109
Lighting Rig 107 Night time only
Rehabilitation (various
plant) 119 Day time only
Conveyers 79 per metre shielded near belt
Conveyer Drive 97
Coal Prep Plant 110 acoustic building design
Crushers 110 enclosed
Rail Loadout Bin 116
Class 81 Locomotives 80 per metre Based on 2 locos at
10kph
Wagons 75 per metre Based on 1280m 10kph
train

Report No 03222 Version E Page 22
6.2.3 Operational Methodology & Fleet Numbers
Scenarios were modelled to represent years 2, 5, 10, 15 and 20, for both daytime (7.00am-6.00pm) and night time (10.00pm-7.00am) operations. Proposed evening (6.00pm-10.00pm) and daytime operations are equivalent in terms of plant locations and numbers.

Report No 03222 Version E Page 23
Table 6-4 outlines the maximum numbers of plant that have been modelled for each of the years advised by the proponent. The table separates the various components of operation, namely:
• Coal Activities – up to four separate pits are proposed for the extraction of coal, namely the Main Pit, Southern Pit, Tailings Pit and Northern Pit. The modelling assumes that at any time there would only be one pit where coal is mined. In order to calculate worst-case noise levels, noise levels from extraction and haulage of coal for each pit are calculated, and the worst-case pit assigned to each residence assessed.
• Overburden Activities – the maximum number of trucks allows for operation of a maximum of three pits simultaneously. Noise levels were again calculated separately for each of the four pits above, and the three highest noise levels combined for each residence as a worst case.
• Blast push activities – modelling assumes a maximum of two dozers are available, and that these would not generally operate in the same pit together, with the exception of year 20. Again, noise levels were calculated for operation of one dozer in each pit, and the worst two combined for each residence. In year 2, however, only one dozer would be available. No blast push dozers operate in the Tailings Pit at any stage of the proposal.
• Rehabilitation Activities – one team of a dozer and several smaller items of plant will operate at various locations around the proposal. Noise levels were calculated for each location and the worst case level assigned to each residence.
• Infrastructure – this component of the overall noise environment would remain constant throughout the life of the proposal. It is composed of noise from all plant involved in the preparation of coal and subsequent movement to the rail loader.
• Rail Noise – the rail loop has the capacity for two trains moving simultaneously which in turn allows for three possible operational scenarios: o One train arriving at coal loading bin as another departs o One train arriving at coal loading bin whilst another is being loaded o One train departing coal loading bin whilst another is being loaded.
Again each scenario is modelled and the worst case noise level assigned to respective receivers. The above components are then added to produce a final worst-case noise level for each residence. This figure is inherently conservative as it is unlikely that the items of plant above would all be in the worst-case position at the same time.

Report No 03222 Version E Page 24
Table 6-4 Modelled Fleet Numbers by Year
Equipment Year
2 Year
5 Year 10
Year 15
Year 20
Coal
Diesel Drill 1 1 1 1 1
Excavator 1 1 1 1 1
Dozer 1 1 1 1 1
Haul Trucks 3 4 4 4 4
Overburden
Diesel Drill 1 1 1 1 1
Excavator 2 3 3 3 2
Dozer 3 4 4 4 4
Haul Trucks 4 9 10 10 6
Blast Push
Dozer 1 2 2 2 2
Rehabilitation
Dozer 0 1 1 1 1
Front end
Loader 0 1 1 1 1
Dump Truck 0 2 2 2 1
Shared Plant
Grader 1 2 2 2 2
Watercart 2 4 4 4 4
6.2.4 Modelling Assumptions
The following assumptions concerning plant operation have been made in modelling the proposal.
Noise Emission from Mobile Plant
Specific manufacturers of the various components of mobile plant are not known at this stage, however the proponent has committed to use of low-noise haul trucks with an energy average sound power level not greater than 114dBA, unless it can be demonstrated that noise levels can be achieved at nearest private residences with use of other noise control mechanisms that may become available in the future.

Report No 03222 Version E Page 25
In addition to the procedures outlined in Section 6.2.3, the following assumptions are made for the six operational scenarios:
• Construction Phase – construction of infrastructure including preparation plant, rail loop, access roads and tailings dam. Work is confined to daylight hours only.
• Year 2 – mining will have started at each of the four pits; however fleet numbers dictate that only one pit will be removing overburden at any one time with only one blast push dozer in operation; working in the same pit as the overburden fleet as a worst case. A maximum of three trucks have been modelled hauling coal. No rehabilitation work has started at this stage of the project.
• Year 5 – fleet numbers allow for overburden to be mined from three pits simultaneously with three trucks on each overburden route, with two blast push dozers in operation in separate pits. Rehabilitation work has begun during the day.
• Year 10 – operational fleet is now at full scale. An extra haul truck is available for overburden and will be involved in haulage from the main pit. A second overburden dozer will also be available in the main pit.
• Year 15 – fleet numbers are the same as for Year 10; however work has now finished in the Northern Pit.
• Year 20 – only the main pit is now active, with all remaining fleet working forward on that location.
During the operational scenarios, and with the exception of rehabilitation activities, there is no difference between numbers of plant operating during the day and the night; rather the modelled operating locations are different. For daytime and evening operations, haul trucks would move overburden from pits to the tops of overburden dumps, with a dozer operating at the top of each dump. At night the haul trucks and dozers would be restricted to operating below the maximum elevation of the overburden emplacement areas.
6.2.5 Calculation Details
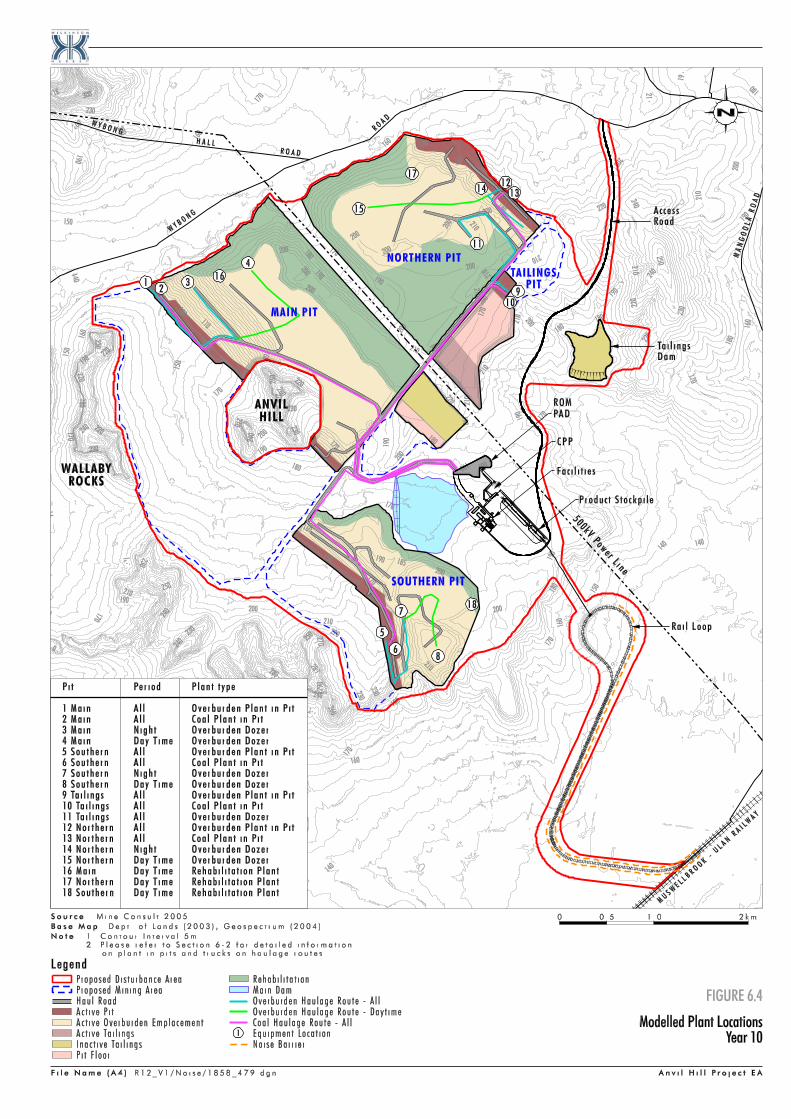
Plant that operates in the same vicinity for long periods, such as dozers and excavators, and all infrastructure items were modelled as point sources. Items involved in transport of materials such as haul trucks, watercarts, graders, trains and conveyers were modelled with source points at 40-50m intervals along the routes. The effective sound power level for each source point was assigned based on the number of items of plant using the route and the number of source points. The contributions of graders and watercarts were spread evenly over all coal and overburden routes for all scenarios. The locations of all items of plant over the six operational scenarios are shown in Figures 6-1 to 6-6. These figures indicate possible positions of all plant, although only a proportion would be operating at the same time, as shown in Table 6-4.
Noise levels were calculated using the ENM model for each of the scenarios under a total of 41 meteorological conditions. A statistical data set representing the proportional occurrence of these conditions at the Wybong Road weather station over a year was then applied to the calculated noise levels. The noise level exceeded for 10% during each of the day, evening and night time periods was then calculated.
For night time operations, 10th percentile exceedance noise levels were calculated using statistical meteorological data for the winter period only, as conditions are more adverse than other seasons, with the greatest occurrence of strong temperature inversions. Data from all seasons was used to calculate 10th percentile exceedance levels during the daytime and evening periods. The particular season that generated the highest noise level at each of the respective residences was then used as a worst-case for each residence.


Report No 03222 Version E Page 26
It should be noted that the calculations described above rely on predictions produced by the ENM model. This model is based on simple assumed vertical profiles of temperature and wind speed, and does not accurately model more complex situations. In particular, there are times when a combination of non-linear vertical temperature and wind speed profiles can result in “focussing” of noise in a small area. In these events, increases in noise level of 10-20dBA can occur over periods of minutes to hours. The frequency of these events, and the level of noise enhancement occurring, cannot be accurately predicted using ENM or any other known model. However, recent validation of measured noise levels from similar nearby operations has shown good correlation with predicted noise levels as a 10th percentile exceedance level.
6.2.6 Predicted Noise Levels at Residences
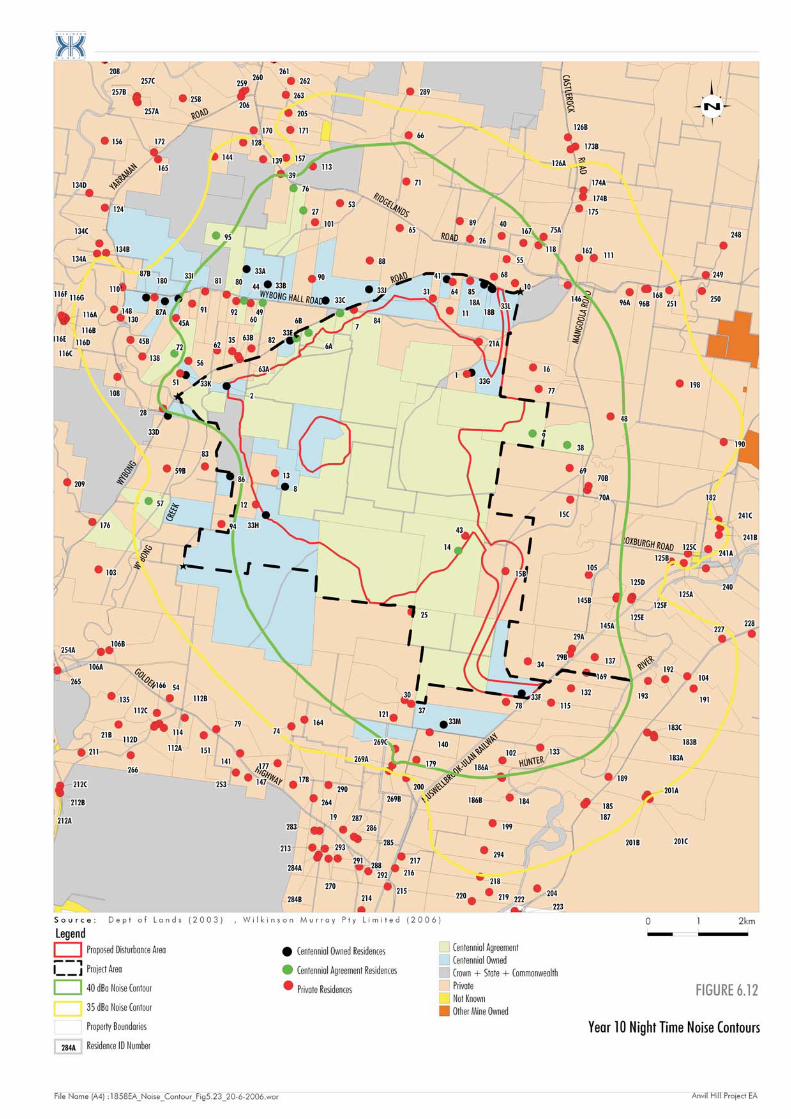
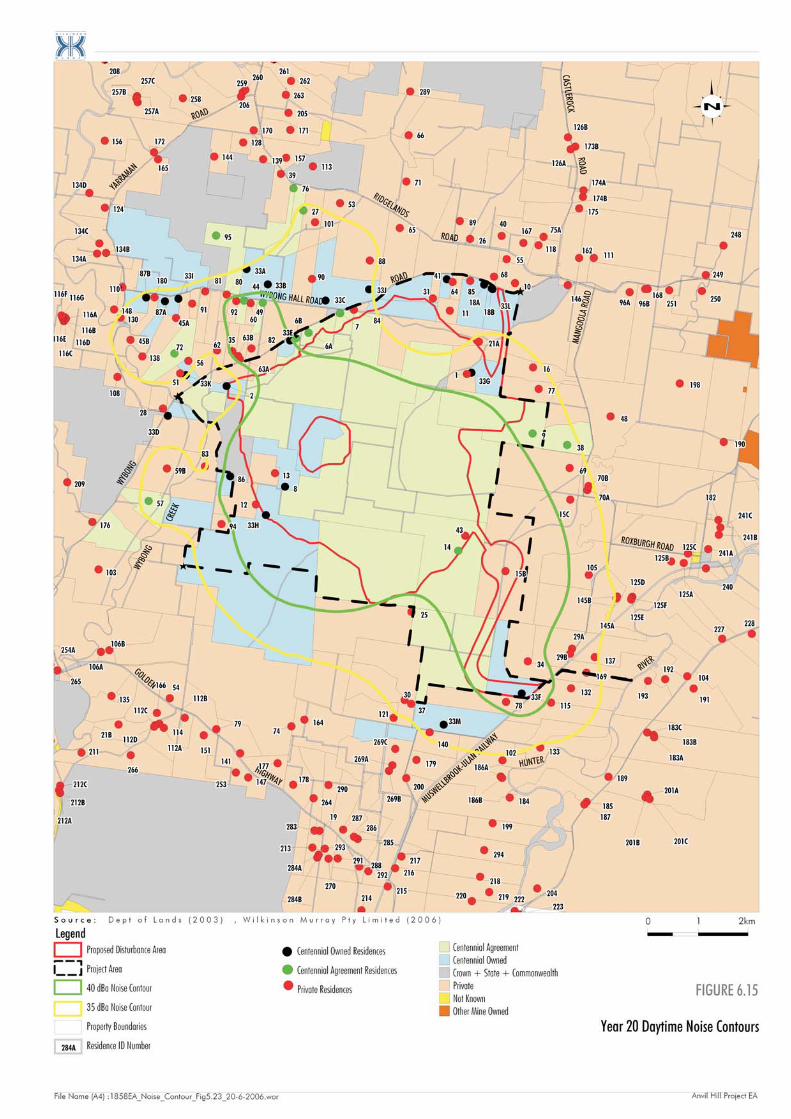
Worst-case 10th percentile noise levels for each of the identified 282 residences surrounding the proposal were calculated for proposed typical day, evening and night time operations for years 2, 5, 10, 15 and 20. These results are summarised in Table 6-5. Detailed results for each residence are shown in Appendix C, where calculated noise levels have been rounded to the nearest whole number. Noise contours have also been provided for all operational scenarios. Contours indicating 35dBA and 40dBA noise levels corresponding with the derived operational noise criteria are shown in Figures 6-7 to 6-16.


Report No 03222 Version E Page 27
Table 6-5 Summary of Operational Noise Impacts
No. of Private Residences with Predicted Noise Levels
Exceeding Criteria
Operational Year
> 40dBA 35-40dBA
Construction Phase
Daytime 21 26
Year 2
Daytime 26 46
Evening 27 41
Night 47 61
Year 5
Daytime 32 55
Evening 32 54
Night 59 55
Year 10
Daytime 53 55
Evening 53 55
Night 69 59
Year 15
Daytime 25 52
Evening 24 52
Night 46 44
Year 20
Daytime 12 38
Evening 12 37
Night 27 33
Table 6-6 summarises impacts at private residences of the operational life of the proposal, showing numbers of residences predicted to have operational noise levels exceeding the criteria at any stage.
Table 6-6 Summary of Operational Noise Impacts over all years
No. of Private Residences with Predicted Noise Levels
Exceeding Criteria
> 40dBA 35-40 dBA
All Years
71 71
Report No 03222 Version E Page 28
6.2.7 Predicted Noise Levels at Places of Worship
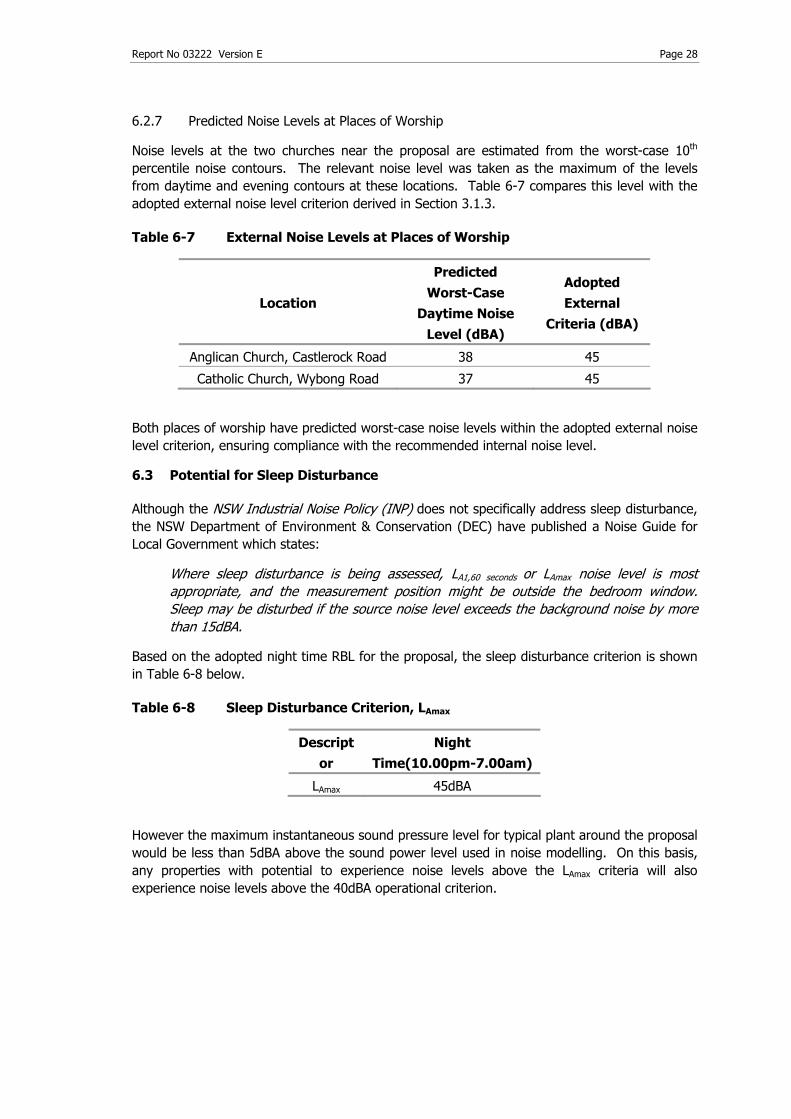
Noise levels at the two churches near the proposal are estimated from the worst-case 10th percentile noise contours. The relevant noise level was taken as the maximum of the levels from daytime and evening contours at these locations. Table 6-7 compares this level with the adopted external noise level criterion derived in Section 3.1.3.
Table 6-7 External Noise Levels at Places of Worship
Location
Predicted Worst-Case
Daytime Noise Level (dBA)
Adopted External
Criteria (dBA)
Anglican Church, Castlerock Road 38 45
Catholic Church, Wybong Road 37 45
Both places of worship have predicted worst-case noise levels within the adopted external noise level criterion, ensuring compliance with the recommended internal noise level.
6.3 Potential for Sleep Disturbance
Although the NSW Industrial Noise Policy (INP) does not specifically address sleep disturbance, the NSW Department of Environment & Conservation (DEC) have published a Noise Guide for Local Government which states:
Where sleep disturbance is being assessed, LA1,60 seconds or LAmax noise level is most
appropriate, and the measurement position might be outside the bedroom window. Sleep may be disturbed if the source noise level exceeds the background noise by more than 15dBA.
Based on the adopted night time RBL for the proposal, the sleep disturbance criterion is shown in Table 6-8 below.
Table 6-8 Sleep Disturbance Criterion, LAmax
Descriptor
Night Time(10.00pm-7.00am)
LAmax 45dBA
However the maximum instantaneous sound pressure level for typical plant around the proposal would be less than 5dBA above the sound power level used in noise modelling. On this basis, any properties with potential to experience noise levels above the LAmax criteria will also experience noise levels above the 40dBA operational criterion.

Report No 03222 Version E Page 29
6.4 Cumulative Noise Impacts
No existing industrial noise sources were identified at residences during attended measurements near the proposed disturbance boundary. However, it is possible that some of the residences considered in this study may be affected by noise from other mining operations, particularly those residences on the eastern boundary of the area considered. Given the distance to nearest mining operations (approximately 12km to the east), any residences affected by noise from other mines can be expected to have LAeq noise levels from Anvil Hill which are significantly below the relevant amenity criterion of 40dBA. In this case, exceedance of the amenity criterion would require that noise from these other mines was the dominant noise source, and probably that noise from the other mines would exceed their own relevant noise criteria.
In most cases, no direct information is available on predicted noise levels from other mines at residences potentially affected by noise from Anvil Hill. However, one receiver point to the extreme east of the proposal was found to also be included in the Mount Arthur North (MAN) Environmental Impact Statement. This residence, 273B, is referred to in the MAN EIS as “Denman Road West”. The maximum calculated night time noise level at this residence due to the proposal is 30dBA, whereas the MAN EIS indicates a maximum level of approximately 36dBA. These noise levels are unlikely to occur simultaneously, but if they do the total noise level at this residence would be approximately 37dBA, which remains within the relevant amenity criterion.
The same residence is potentially affected by noise from other mines, notably Bengalla and Mount Pleasant. However, as noted in the MAN EIS, with these sources included the total noise level is unlikely to exceed 40dBA LAeq. In any case, the Anvil Hill project, at 30dBA, would make a negligible contribution to the total industrial noise level at this location.
Although information on noise levels from other mines is not available for other residences, the same assessment would apply to residences close to residence 273B. At other residences closer to the Anvil Hill Project, where calculated noise levels from Anvil Hill approach the amenity criterion of 40dBA LAeq, approximate calculations indicate that noise from the other mines would make a negligible contribution to the total noise level, and the assessment can consider Anvil Hill alone, as above.
6.5 Low Frequency Noise Impacts
Potential sources of low frequency noise are unknown at this stage and experience suggests that such impacts have only occasionally been noted at similar operations. These impacts may be as a result of low frequency noise and or vibration from processing equipment. It is not possible to predict such impacts at the planning stage, however if such noise is found to occur at levels similar to those referred to in Section 3.5, the Environmental Management Plan for the proposal will specify methods of investigation to allow appropriate treatment methods to be devised. This may include specific structural monitoring and treatment.

Report No 03222 Version E Page 30
7 OFF-SITE TRANSPORTATION NOISE IMPACTS
This section addresses potential noise impacts from vehicles using the local road and rail networks. Traffic noise impacts include car and truck movements to and from the proposal. Rail noise impacts are from train movements associated with the transportation of coal on the Muswellbrook to Ulan line. Rail noise impacts from trains on the proposed Anvil Hill rail spur are considered part of the overall operational noise impact and are assessed in Section 6 of this report.
7.1 Road Traffic Noise Impacts
The Anvil Hill Project has potential to generate additional traffic on public roads as a result of staff arrivals and departures, and also from heavy vehicle deliveries of supplies. Potential noise impacts at residences from two scenarios have been addressed in this assessment:
• Impacts during the infrastructure construction period; and • Impacts during the peak operational period of the proposal.
The approved Bengalla Link Road will extend the existing Bengalla Link Road to Wybong Road west of the Roxburgh Road intersection. A mine access road is also proposed approximately 7km west of the new Bengalla Link Road. Traffic entering and leaving the mine via the access road will be directed to use Wybong Road and the Bengalla Link Road to join Denman Road, from where traffic can access the major road network. A traffic report by TPK & Associates Pty Ltd has indicated that at the Bengalla Link Road and Denman Road intersection, less than 10% of traffic generated by the proposal would turn towards Denman, the vast majority continuing toward Muswellbrook.
Two 12 hours shifts are proposed from 7.30am-7.30pm and vice versa. It is likely that traffic noise levels in one hour could be impacted by both vehicles arriving on site and also by vehicles departing from the previous shift. The number of workers required will vary over the life of the proposal and as such employee traffic numbers have been based on the peak operational year.
A mine at Mount Pleasant was approved in 1999 and traffic from that mine is proposed to share some of the road network with traffic generated by the Anvil Hill proposal. The Environmental Impact Statement for Mount Pleasant did not specify shift start and finish times, rather nominating a window between 6.00-8.00am or 6.00-8.00pm for the two shifts. It is possible that shifts at Mount Pleasant would coincide with those proposed for the Anvil Hill Project, and consequently traffic from the two operations would share the road network at the same time. As a result the following analysis examines potential road traffic noise impacts for the Anvil Hill Project and also potential cumulative noise impact from both operations having the same shift cycles.
Given the proposed 7.30am start time, it is likely that cars arriving for that shift would be on the local road network between 7.00-7.30am. Similarly cars going home from the night shift would be on local roads between 7.30-8.00pm. The following analysis assesses road traffic noise impacts against the ECRTN criteria derived in Section 4.

Report No 03222 Version E Page 31
7.1.1 Existing Traffic Flows
Existing traffic movements on the local road network have been taken from counts provided in a transport study undertaken by TPK & Associates Pty Ltd. Table 7-1 outlines the measured traffic flows on Wybong Road from Wednesday, 7 December 2005 to Tuesday, 13 December 2005. The total traffic volume for each hour is provided as a seven day average. The counter did not distinguish between light and heavy vehicles. A second survey was conducted at the intersection of Wybong Road and Kayuga Road on Wednesday, 8 February 2006 between 6.45-9.30am and again between 2.45-5.30pm, where vehicles were classified into light and heavy vehicles. TPK & Associates has advised that the proportion of heavy vehicles on Wybong Road to be used in assessment of traffic noise levels is 10%.
Table 7-1 Existing Traffic Volumes on Wybong Road, Vehicles Per Hour
7 day Average Start Time North-Bound
South-Bound
midnight 0.1 0.4
1.00am 0.7 0.1
2.00am 0.3 0.0
3.00am 0.1 0.4
4.00am 1.0 0.9
5.00am 5.9 2.1
6.00am 6.6 3.4
7.00am 9.4 8.1
8.00am 16.9 8.6
9.00am 14.1 7.3
10.00am 12.0 9.3
11.00am q 10.0
12.00pm 9.4 10.3
1.00pm 10.0 10.1
2.00pm 8.0 15.7
3.00pm 8.4 12.4
4.00pm 8.4 12.3
5.00pm 9.0 11.1
6.00pm 8.4 10.9
7.00pm 5.0 7.7
8.00pm 2.3 3.9
9.00pm 1.9 2.1
10.00pm 1.0 2.0
11.00pm 0.6 0.7

Report No 03222 Version E Page 32
No weekly traffic count data is available for existing traffic on Denman Road; however counts of existing am and pm peak intersection traffic have been undertaken at the junction of Denman Road and Bengalla Road. These counts are shown in Table 7-2 and Table 7-3.
Table 7-2 Existing Traffic Volumes on Denman Road AM Peak
Time ALL Light
Vehicles Heavy
Vehicles
6.45am 121 109 12
7.00am 83 79 4
7.15am 62 47 15
7.30am 73 60 13
7.45am 71 51 20
8.00am 74 65 9
8.15am 72 56 16
8.30am 58 45 13
8.45am 65 56 9
9.00am 61 52 9
9.15am 65 53 12
9.30am 64 57 7
Table 7-3 Existing Traffic Volumes on Denman Road PM Peak
Time ALL Light
Vehicles Heavy
Vehicles
2.45pm 50 45 5
3.00pm 60 52 8
3.15pm 62 57 5
3.30pm 80 70 10
3.45pm 77 61 16
4.00pm 84 66 18
4.15pm 93 84 9
4.30pm 83 73 10
4.45pm 74 66 8
5.00pm 63 60 3
5.15pm 78 72 6
5.30pm 83 79 4
Report No 03222 Version E Page 33
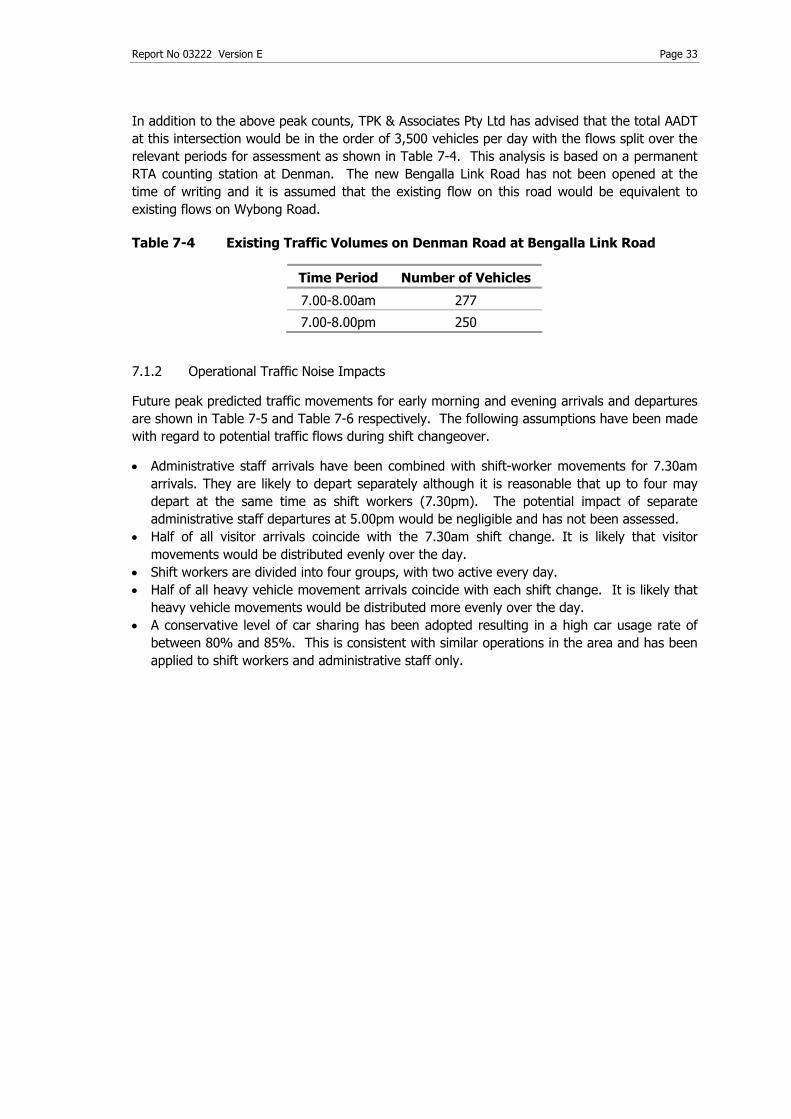
In addition to the above peak counts, TPK & Associates Pty Ltd has advised that the total AADT at this intersection would be in the order of 3,500 vehicles per day with the flows split over the relevant periods for assessment as shown in Table 7-4. This analysis is based on a permanent RTA counting station at Denman. The new Bengalla Link Road has not been opened at the time of writing and it is assumed that the existing flow on this road would be equivalent to existing flows on Wybong Road.
Table 7-4 Existing Traffic Volumes on Denman Road at Bengalla Link Road
Time Period Number of Vehicles
7.00-8.00am 277
7.00-8.00pm 250
7.1.2 Operational Traffic Noise Impacts
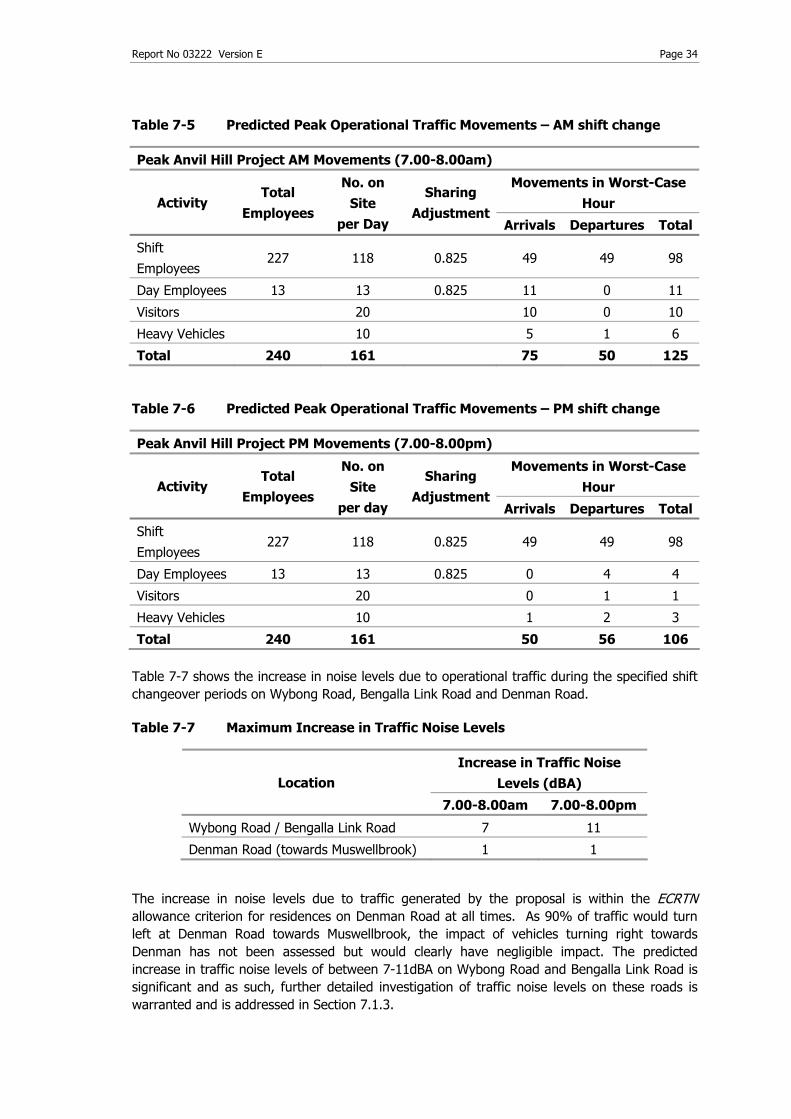
Future peak predicted traffic movements for early morning and evening arrivals and departures are shown in Table 7-5 and Table 7-6 respectively. The following assumptions have been made with regard to potential traffic flows during shift changeover.
• Administrative staff arrivals have been combined with shift-worker movements for 7.30am arrivals. They are likely to depart separately although it is reasonable that up to four may depart at the same time as shift workers (7.30pm). The potential impact of separate administrative staff departures at 5.00pm would be negligible and has not been assessed.
• Half of all visitor arrivals coincide with the 7.30am shift change. It is likely that visitor movements would be distributed evenly over the day.
• Shift workers are divided into four groups, with two active every day. • Half of all heavy vehicle movement arrivals coincide with each shift change. It is likely that
heavy vehicle movements would be distributed more evenly over the day. • A conservative level of car sharing has been adopted resulting in a high car usage rate of
between 80% and 85%. This is consistent with similar operations in the area and has been applied to shift workers and administrative staff only.
Report No 03222 Version E Page 34
Table 7-5 Predicted Peak Operational Traffic Movements – AM shift change
Peak Anvil Hill Project AM Movements (7.00-8.00am)
Movements in Worst-Case Hour Activity
Total Employees
No. on Site
per Day
Sharing Adjustment
Arrivals Departures Total
Shift
Employees 227 118 0.825 49 49 98
Day Employees 13 13 0.825 11 0 11
Visitors 20 10 0 10
Heavy Vehicles 10 5 1 6
Total 240 161 75 50 125
Table 7-6 Predicted Peak Operational Traffic Movements – PM shift change
Peak Anvil Hill Project PM Movements (7.00-8.00pm)
Movements in Worst-Case Hour Activity
Total Employees
No. on Site
per day
Sharing Adjustment
Arrivals Departures Total
Shift
Employees 227 118 0.825 49 49 98
Day Employees 13 13 0.825 0 4 4
Visitors 20 0 1 1
Heavy Vehicles 10 1 2 3
Total 240 161 50 56 106 Table 7-7 shows the increase in noise levels due to operational traffic during the specified shift changeover periods on Wybong Road, Bengalla Link Road and Denman Road.
Table 7-7 Maximum Increase in Traffic Noise Levels
Increase in Traffic Noise Levels (dBA) Location
7.00-8.00am 7.00-8.00pm
Wybong Road / Bengalla Link Road 7 11
Denman Road (towards Muswellbrook) 1 1
The increase in noise levels due to traffic generated by the proposal is within the ECRTN allowance criterion for residences on Denman Road at all times. As 90% of traffic would turn left at Denman Road towards Muswellbrook, the impact of vehicles turning right towards Denman has not been assessed but would clearly have negligible impact. The predicted increase in traffic noise levels of between 7-11dBA on Wybong Road and Bengalla Link Road is significant and as such, further detailed investigation of traffic noise levels on these roads is warranted and is addressed in Section 7.1.3.

Report No 03222 Version E Page 35
7.1.3 Prediction of Traffic Noise Levels on Wybong Road / Bengalla Link Road
Noise levels from both the existing and proposed traffic were calculated at individual residences using procedures based on the CoRTN (Calculation of Road Traffic Noise UK DoE Traffic Noise Prediction Method 1988) prediction algorithms. The standard prediction procedures were modified in the following ways.
• LAeq values were calculated from the LA10 values predicted by the CoRTN algorithms using the well-validated approximation LAeq,1hr = LA10,1hr – 3.
• Noise source heights were set at 0.5m for cars and heavy vehicle tyres, 1.5m for heavy vehicle engines and 3.6m for heavy vehicle exhausts, representing typical values for Australian vehicles. Noise from a heavy vehicle exhaust was assessed as 8dBA lower than the noise from the engine.
The models were implemented using ROADent software, based on road points at 10m intervals along Wybong Road and Bengalla Link Road. Where there are no barriers present, ground was taken to be 50% soft. This has previously been found to give a good correlation with measured noise levels in similar situations. With barriers, hard ground is assumed, as required under the CoRTN procedures.
The existing road surface is modelled as chipseal with a CoRTN correction of 2.5dBA, with speeds of both light and heavy vehicles modelled at 100 kph which is consistent with the existing speed limit in the area. Speed limits on Bengalla Link Road are not yet known and traffic is modelled at the likely limit of 80kph.
Table 7-8 and Table 7-9 show the predicted existing and future noise levels for houses within 250m of either road between the proposed mine access road and the intersection with Denman Road. These residences are shown in Figure 7-1. The calculated noise levels are then compared with the appropriate ECRTN criteria.
Table 7-8 Calculated Traffic Noise Levels – 7.00-8.00am
LAeq, 1hr Noise Level (dBA) Residence
Nearest Road
Distance from
Road (m) Existing Future Criterion
10 Wybong 175 45.5 52 55 146 Wybong 100 48.5 55 55 168 Wybong 80 49.5 56.5 55 246 Wybong 75 49.5 56 55 249 Wybong 80 49.5 55.5 55 250 Wybong 250 44 50.5 55 251 Wybong 120 46.5 53 55 96A Wybong 200 46.5 53 55 96B Wybong 90 49.5 56 55 203F Bengalla Link 65 48 54.5 55 203G Bengalla Link 50 50 56.5 55 203H Bengalla Link 120 44.5 51.5 55 203I Bengalla Link 220 42.5 49 55 203K Bengalla Link 210 42 49 55


Report No 03222 Version E Page 36
The calculated noise levels show marginal exceedances of the ECRTN criterion at four residences on Wybong Road of between 0.5-1.5dBA for the period 7.00-8.00am. One residence on Bengalla Link Road has an exceedance of 1.5dBA.
Table 7-9 Calculated Traffic Noise Levels – 7.00-8.00pm
LAeq, 1hr Noise Level (dBA) Residence
Nearest Road
Distance from
Road (m) Existing Future Criterion
10 Wybong 175 39.5 50.5 55 146 Wybong 100 42.5 53.5 55 168 Wybong 80 44 54.5 55 246 Wybong 75 43.5 54 55 249 Wybong 80 43 54 55 250 Wybong 250 38 49 55 251 Wybong 120 40.5 51.5 55 96A Wybong 200 40 51 55 96B Wybong 90 43.5 54 55 203F Bengalla Link 65 42.5 53.5 55 203G Bengalla Link 50 44.5 55 55 203H Bengalla Link 120 39 50 55 203I Bengalla Link 220 37 48 55 203K Bengalla Link 210 36.5 47.5 55
During the period 7.00-8.00pm all residences have calculated noise levels that meet the ECRTN criterion. The early morning period of 7.00-8.00am is the only time where there are predicted exceedances of the ECRTN criteria. In terms of impacts at residences, there would be a noticeable change in the acoustic environment for that hour and monitoring of traffic noise levels at these residences should be conducted to ensure compliance with the appropriate criteria.
If measured noise levels are found to exceed ECRTN criteria, then appropriate noise mitigation measures would be offered to residents. Potential noise mitigation measures include the provision of air conditioning or mechanical ventilation to allow windows to be kept closed.
7.1.4 Construction Traffic Impacts
Whilst there are no specific criteria that govern noise levels associated with traffic involved in short term activities such as the construction of the project infrastructure and facilities, guidance must be taken from the ECRTN criteria for operational traffic noise.
Initial estimates of the labour force required in construction activities indicate a total workforce of 500 contractors over the course of the one year construction period. The expected peak total traffic numbers during the construction period are shown in Table 7-10.

Report No 03222 Version E Page 37
Table 7-10 Predicted Daily Peak Construction Traffic Movements
Activity Peak No. on Site per Day
No. of Movements Worst-Case Hour
Contractors 200 165
Visitors 20 20
Heavy
Vehicles 12 6
Total 232 191
Heavy vehicle arrivals and departures are likely to be distributed evenly throughout the day; however as a worst case it is assumed that 50% of all movements could happen in the same hour as the arrival and / or departure of contractors and visitors. In addition, a conservative level of car sharing has been adopted resulting in a high car usage rate of between 80% and 85%.
Based on overall traffic volumes, the highest traffic noise levels at residences during the construction period would be expected to be 2-3dBA higher than the highest hourly daytime operational traffic noise levels, as shown in Table 7-10. They would therefore exceed the daytime criterion for operational traffic noise by a maximum of 4.5dBA. However construction traffic is likely to be at a peak for only 2-3 months during the 12 month construction period and any impacts at residences can be considered short-term. Under these circumstances these noise impacts are considered acceptable.
7.1.5 Maximum Noise Levels during Vehicle Passbys
Noise levels from individual vehicle passbys during the night time period have the potential to cause sleep disturbance. Given that shifts start at 7.30am, traffic would not generally be passing residences during the period that is defined as night in the ECRTN. However there would be a possibility of infrequent out-of-hours deliveries occurring during the night time period and it is appropriate to assess possible impacts at residences on Wybong Road and Bengalla Link Road.
Procedures based on the FHWA (US Federal Highways Administration) traffic noise model methodology were used to calculate maximum noise levels at the closest identified residences from a typical heavy vehicle passby.
Calculated maximum noise levels are shown in Table 7-11. The maximum internal noise level within a bedroom, with windows open to provide adequate ventilation, is approximately 10dBA below the external noise level.
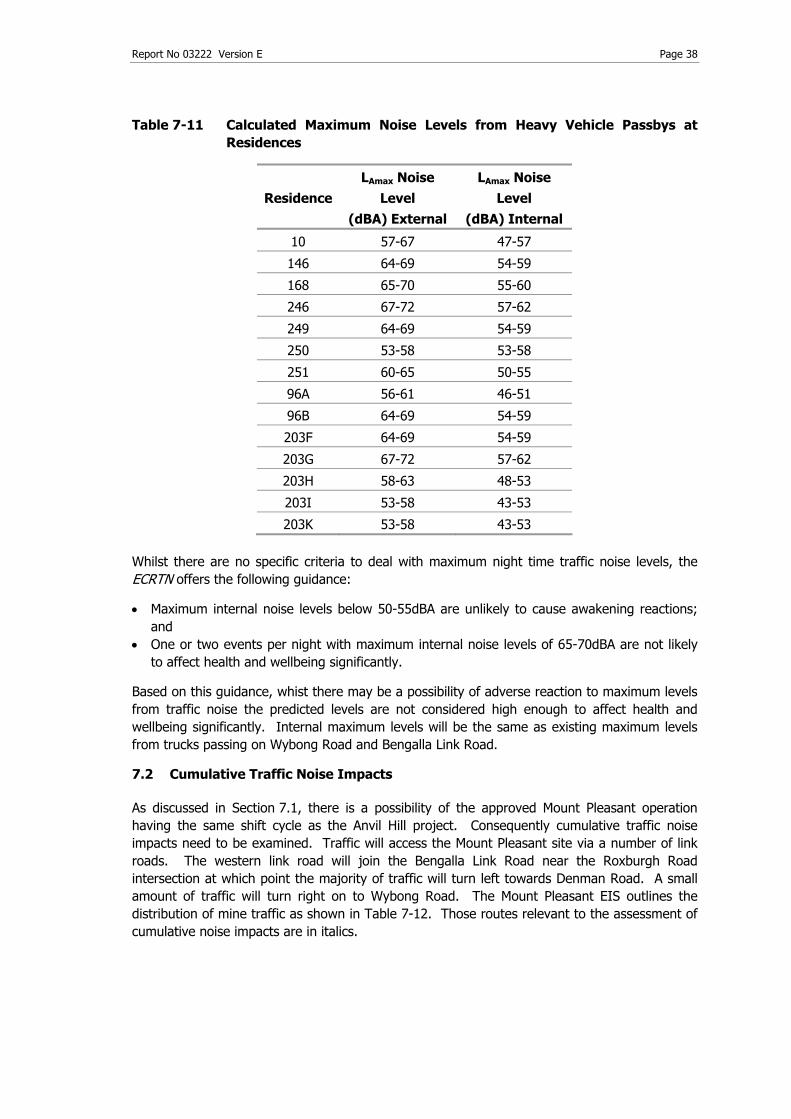
Report No 03222 Version E Page 38
Table 7-11 Calculated Maximum Noise Levels from Heavy Vehicle Passbys at Residences
ResidenceLAmax Noise
Level (dBA) External
LAmax Noise Level
(dBA) Internal
10 57-67 47-57
146 64-69 54-59
168 65-70 55-60
246 67-72 57-62
249 64-69 54-59
250 53-58 53-58
251 60-65 50-55
96A 56-61 46-51
96B 64-69 54-59
203F 64-69 54-59
203G 67-72 57-62
203H 58-63 48-53
203I 53-58 43-53
203K 53-58 43-53 Whilst there are no specific criteria to deal with maximum night time traffic noise levels, the ECRTN offers the following guidance:
• Maximum internal noise levels below 50-55dBA are unlikely to cause awakening reactions; and
• One or two events per night with maximum internal noise levels of 65-70dBA are not likely to affect health and wellbeing significantly.
Based on this guidance, whist there may be a possibility of adverse reaction to maximum levels from traffic noise the predicted levels are not considered high enough to affect health and wellbeing significantly. Internal maximum levels will be the same as existing maximum levels from trucks passing on Wybong Road and Bengalla Link Road.
7.2 Cumulative Traffic Noise Impacts
As discussed in Section 7.1, there is a possibility of the approved Mount Pleasant operation having the same shift cycle as the Anvil Hill project. Consequently cumulative traffic noise impacts need to be examined. Traffic will access the Mount Pleasant site via a number of link roads. The western link road will join the Bengalla Link Road near the Roxburgh Road intersection at which point the majority of traffic will turn left towards Denman Road. A small amount of traffic will turn right on to Wybong Road. The Mount Pleasant EIS outlines the distribution of mine traffic as shown in Table 7-12. Those routes relevant to the assessment of cumulative noise impacts are in italics.
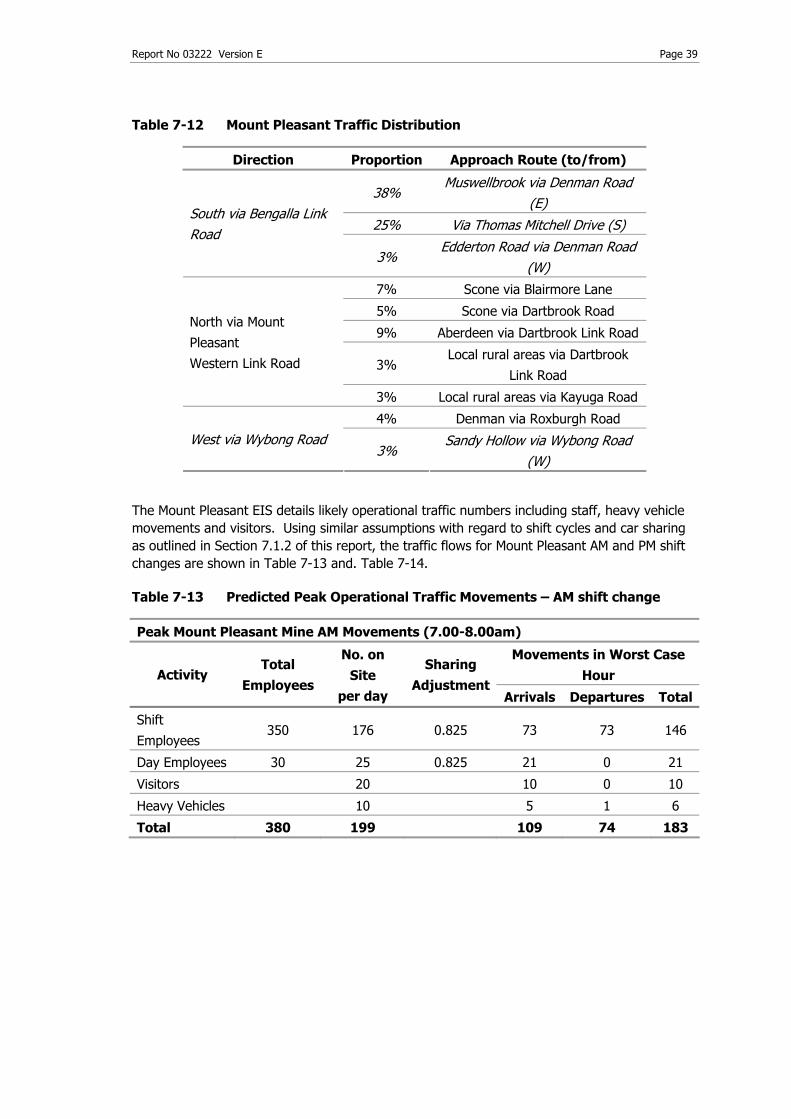
Report No 03222 Version E Page 39
Table 7-12 Mount Pleasant Traffic Distribution
Direction Proportion Approach Route (to/from)
38% Muswellbrook via Denman Road
(E) 25% Via Thomas Mitchell Drive (S)
South via Bengalla Link Road
3% Edderton Road via Denman Road
(W) 7% Scone via Blairmore Lane
5% Scone via Dartbrook Road
9% Aberdeen via Dartbrook Link Road
3% Local rural areas via Dartbrook
Link Road
North via Mount
Pleasant
Western Link Road
3% Local rural areas via Kayuga Road
4% Denman via Roxburgh Road
West via Wybong Road 3%
Sandy Hollow via Wybong Road (W)
The Mount Pleasant EIS details likely operational traffic numbers including staff, heavy vehicle movements and visitors. Using similar assumptions with regard to shift cycles and car sharing as outlined in Section 7.1.2 of this report, the traffic flows for Mount Pleasant AM and PM shift changes are shown in Table 7-13 and. Table 7-14.
Table 7-13 Predicted Peak Operational Traffic Movements – AM shift change
Peak Mount Pleasant Mine AM Movements (7.00-8.00am) Movements in Worst Case
Hour Activity Total
Employees
No. on Site
per day
Sharing Adjustment
Arrivals Departures Total
Shift
Employees 350 176 0.825 73 73 146
Day Employees 30 25 0.825 21 0 21
Visitors 20 10 0 10
Heavy Vehicles 10 5 1 6
Total 380 199 109 74 183

Report No 03222 Version E Page 40
Table 7-14 Predicted Peak Operational Traffic Movements – PM shift change
Peak Mount Pleasant Mine PM Movements (7.00-8.00pm) Movements in Worst Case
Hour Activity Total
Employees
No. on Site
per day
Sharing Adjustment
Arrivals Departures Total
Shift
Employees 350 176 0.825 73 73 146
Day Employees 30 25 0.825 0 8 8
Visitors 20 0 1 1
Heavy Vehicles 10 1 2 3
Total 380 199 74 84 158
The Mount Pleasant Mine proposal was approved in December 1999 and it has been assumed to start operations before the Anvil Hill Project. Operational traffic from Mount Pleasant would therefore be regarded as existing traffic. Using the traffic count data from Section 7.1.1 and the predicted peak hour traffic flows for the Anvil Hill Project, the cumulative noise impact of both mines operating with the same shift cycle can be addressed. Table 7-15 shows the increase in noise levels due to operational traffic during the specified shift changeover periods on Wybong Road, Bengalla Link Road and Denman Road.
Table 7-15 Maximum Increase in Traffic Noise Levels
Increase in Traffic Noise Levels (dBA) Location
7.00-8.00am 7.00-8.00pm
Wybong Road / Bengalla Link
Road 6.5 9.5
Bengalla Link Road 2 2.5
Denman Road (towards
Muswellbrook) 0.5 1
The above cumulative increases in traffic noise levels are lower than those increases calculated in Section 7.1.3. This is as a result of the Mount Pleasant operational traffic being considered as part of the existing traffic flow. The impacts of additional traffic from the Anvil Hill Proposal would therefore show a lower net increase in noise levels when considered in isolation; however the overall noise level at residences would be higher due to all combined traffic.
The predicted increase in traffic noise levels of between 6.5-9.5dBA on Wybong Road and 2-2.5dBA on Bengalla Link Road is significant and as such, further detailed investigation of cumulative traffic noise levels on these roads is warranted and is addressed in Section 7.3.
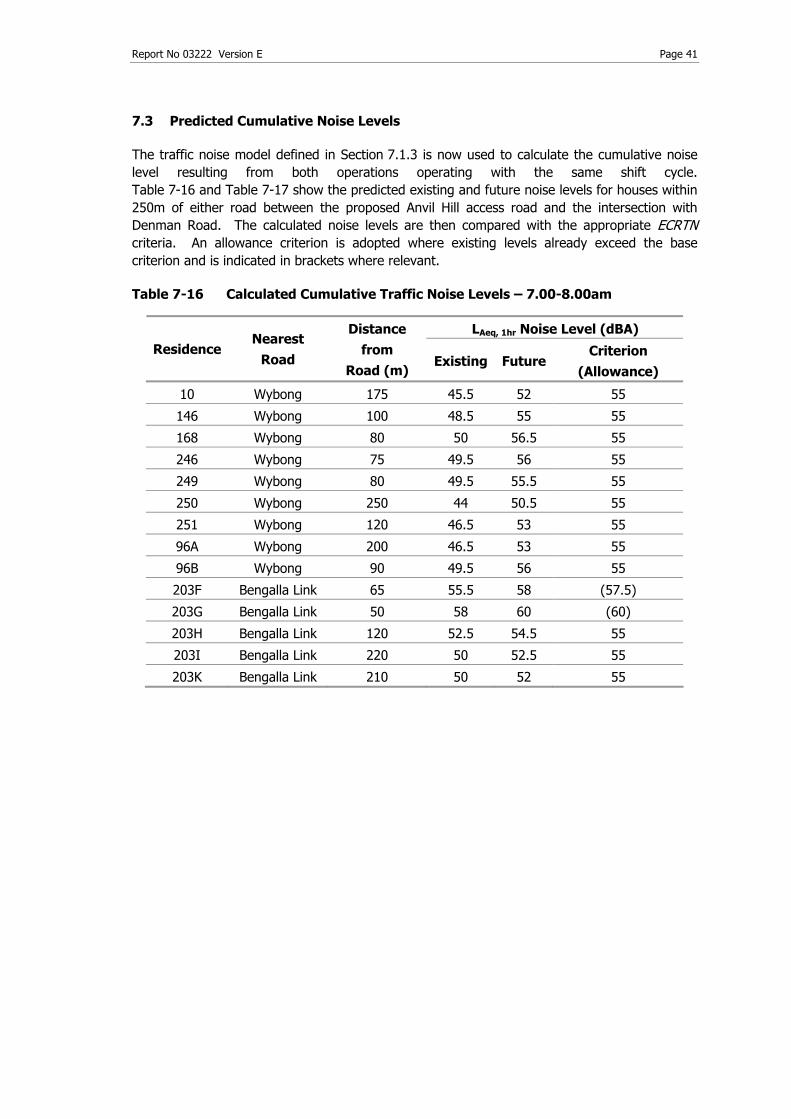
Report No 03222 Version E Page 41
7.3 Predicted Cumulative Noise Levels
The traffic noise model defined in Section 7.1.3 is now used to calculate the cumulative noise level resulting from both operations operating with the same shift cycle. Table 7-16 and Table 7-17 show the predicted existing and future noise levels for houses within 250m of either road between the proposed Anvil Hill access road and the intersection with Denman Road. The calculated noise levels are then compared with the appropriate ECRTN criteria. An allowance criterion is adopted where existing levels already exceed the base criterion and is indicated in brackets where relevant.
Table 7-16 Calculated Cumulative Traffic Noise Levels – 7.00-8.00am
LAeq, 1hr Noise Level (dBA) Residence
Nearest Road
Distance from
Road (m) Existing Future
Criterion (Allowance)
10 Wybong 175 45.5 52 55
146 Wybong 100 48.5 55 55
168 Wybong 80 50 56.5 55
246 Wybong 75 49.5 56 55
249 Wybong 80 49.5 55.5 55
250 Wybong 250 44 50.5 55
251 Wybong 120 46.5 53 55
96A Wybong 200 46.5 53 55
96B Wybong 90 49.5 56 55
203F Bengalla Link 65 55.5 58 (57.5)
203G Bengalla Link 50 58 60 (60)
203H Bengalla Link 120 52.5 54.5 55
203I Bengalla Link 220 50 52.5 55
203K Bengalla Link 210 50 52 55

Report No 03222 Version E Page 42
Table 7-17 Calculated Cumulative Traffic Noise Levels – 7.00-8.00pm
LAeq, 1hr Noise Level (dBA) Residence
Nearest Road
Distance from
Road (m) Existing Future Criterion
10 Wybong 175 41 51.5 55
146 Wybong 100 44 53.5 55
168 Wybong 80 45.5 54.5 55
246 Wybong 75 45 54.5 55
249 Wybong 80 45 54 55
250 Wybong 250 39.5 49 55
251 Wybong 120 42 51.5 55
96A Wybong 200 41.5 51 55
96B Wybong 90 45 54 55
203F Bengalla Link 65 54 56.5 (56)
203G Bengalla Link 50 56.5 58.5 (58.5)
203H Bengalla Link 120 51 53 55
203I Bengalla Link 220 48.5 51 55
203K Bengalla Link 210 48.5 51 55
Future traffic noise levels on Wybong Road are generally the same as those calculated in Section 7.1.3. Noise levels on Bengalla Link Road increase by up to 3.5dBA from those levels calculated in Section 7.1.3, however higher existing noise levels mean that some residences have an ECRTN allowance criteria.
7.4 Summary of Operational Traffic Noise Impacts
Calculated noise levels from operational traffic associated with the Anvil Hill Project generally meet or marginally exceed the ECRTN noise level criterion for daytime when considered in isolation, and also when cumulative impacts from the Mount Pleasant Mine are considered. The maximum predicted exceedance of any criterion under either scenario is 1.5dBA.
7.5 Rail Noise Impacts – Muswellbrook to Ulan line
The proposed development has the potential to generate additional rail movements on the Muswellbrook to Ulan line. This line is currently used for transportation of coal and other resources from the following industrial facilities:
• Cobar Mine • Ulan Mine • Bengalla Mine

Report No 03222 Version E Page 43
In addition, the following developments have been approved and are assumed to be operational at the same time as the Anvil Hill Project:
• Wilpinjong Coal Project • Mount Pleasant Coal Mine
7.5.1 Predicted Increase in Rail Noise Levels
With regard to LAmax levels at residences; there will be no change in levels as freight trains already run on the Muswellbrook to Ulan line.
In order to assess increases in noise levels at residences, it is necessary to consider three distinct sections of the line:
• Anvil Hill Project rail spur to Mount Pleasant rail spur; • Mount Pleasant rail spur to Bengalla rail spur; and • Bengalla rail spur to Muswellbrook
Figure 7.2 shows the orientation of the various operations under consideration.
Figure 7-2 Rail Network under Assessment
Table 7-18 displays the average existing and approved rail movements from trains on the line from Ulan to the Mount Pleasant rail spur with parameters used in calculations. Where there are different train lengths for different operations the arithmetic mean length has been calculated. Predicted movements for facilities that are not included in this document have been sourced from the appropriate environmental documentation. The proposed rail movements from the Anvil Hill Project are shown, with the associated cumulative future average movements from all operations. It is conservatively assumed that maximum daily existing movements from the proposal are equal to the average daily value.
Wilpinjong Ulan Cobar Ore Freight
Anvil Hill Project Mt Pleasant Bengalla
Muswellbrook

Report No 03222 Version E Page 44
Table 7-18 Freight Train Movements and Configurations
Number of Movements
Operation Status Daytime
(7am-10pm) Night time
(10pm-7am)
Length (m)
Audible Wheel
Defects
Speed
(Kph)
Cobar Ore Freight Existing 3 # 1 # 634 Medium 60
Ulan Coal Existing 8 # 4 # 1319 Medium 60
Wilpinjong Coal Project Consented 6 # 2 # 1500 Medium 60
Mt Pleasant Mine Consented 4 @ 2 @ 1500 Medium 60
Bengalla Mine Existing 4 ^ 2 ^ 1500 Medium 60
Anvil Hill Project (Peak) Proposed 6 4 1500 Medium 60
Cumulative Movements 31 15
Notes: # Source from Richard Heggie & Associates 2005, Wilpinjong Coal Project Construction, Operation and Transportation Noise & Source from Richard Heggie & Associates 2005, Wilpinjong Coal Project Construction, Operation and Transportation Noise Impact and Blasting Assessment @ Source from ERM Mitchell McCotter 1997, Mt Pleasant Mine Environmental Impact Statement Volume 1 ^ Source from Envirosciences 1993, Bengalla Coal Mine Environmental Impact Statement Volume 1
Using the above data on freight movements, it is possible to calculate the distance from residences at which ARTC criteria are exceeded using predicted energy average LAeq and SEL noise levels from the Railcorp NSW standard rail noise database for both locomotives and freight wagons. The database levels are adjusted for speed, number of locomotives, length of trains and audible wheel defects, with no allowance for shielding. A façade correction of 2dBA is also applied.
Distances at which the ARTC criteria are exceeded for both existing and proposed peak movements for appropriate sections of track are illustrated in Table 7-19 to Table 7-21, rounded to the nearest 5m. In addition the number of private residences where the criteria would be exceeded, both for existing and proposed operations is shown.

Report No 03222 Version E Page 45
Table 7-19 Exceedances of ARTC Criteria: Anvil Hill Project to Mount Pleasant
Existing Freight Movements
Proposed Freight Movements
Period Criterion
(dBA) Distance from Track
(m)
Number of residences criterion exceeded
Distance from Track
(m)
Additional residences criterion exceeded
LAeq, Daytime (7am -10pm)
65 35 0 40 N/A
LAeq, Night time (10pm-7am)
60 50 1 70 1
LAmax, Passby Noise (24Hrs)
85 45 1 45 N/A
Table 7-20 Exceedances of ARTC Criteria: Mount Pleasant to Bengalla
Existing Freight Movements
Proposed Freight Movements
Period Criterion
(dBA) Distance from Track
(m)
Number of residences criterion exceeded
Distance from Track
(m)
Additional residences criterion exceeded
Daytime (7am -10pm) 65 40 0 45 N/A
Night time (10pm-7am) 60 60 0 80 0
Maximum Passby Noise (24Hrs)
85 45 0 45 N/A

Report No 03222 Version E Page 46
Table 7-21 Exceedances of ARTC Criteria: Bengalla to Muswellbrook
Existing Freight Movements
Proposed Freight Movements
Period Criterion
(dBA) Distance from Track
(m)
Number of residences criterion exceeded
Distance from Track
(m)
Additional residences criterion exceeded
Daytime (7am -10pm) 65 45 2 50 N/A
Night time (10pm-7am) 60 70 3 85 1
Maximum Passby Noise (24Hrs)
85 35 2 35 N/A
The maximum increase in distance from the track to meet the ARTC criteria as a result of proposed Anvil Hill freight movements on any part of the Muswellbrook to Ulan line is 5m for daytime peak operations and 20m for peak operations at night. For each section of track under consideration, the noise footprint for daytime LAeq,15 hr and maximum passby noise for proposed operations are wholly contained within the existing night time noise footprint. As such the only relevant time period for assessment of future additional exceedances is the night time period. The proposed night time freight movements result in an additional two residences having noise levels that exceed the criteria.

Report No 03222 Version E Page 47
8 BLASTING IMPACTS
8.1 Prediction of Noise and Vibration Levels
Airblast overpressure and ground vibration levels from blasting are related to the “scaled distance” from the blast, which is defined as
Scaled distance = D/W(1/3) for airblast overpressure, and Scaled distance = D/W(1/2) for ground vibration,
where D is the distance from the blast in metres and W is the maximum instantaneous charge of explosive, in kg Ammonium Nitrate Fuel Oil (ANFO) equivalent.
Standard predictive curves relating scaled distance to overpressure and ground vibration levels have been derived from measurements conducted at numerous sites. However, it is recognised that the exact relationship varies from site to site, and hence it is generally preferable to use data gathered close to the proposed blasting site in making predictions.
For this assessment, blast measurements performed at the Bayswater No. 3 Mine between 1996 and 1999 were used in predictions. Ground vibration data for 193 blasts, and overpressure data for 171 blasts, were available for analysis. Figure 8-1 shows the best-fit line and 95% confidence limit derived from the measured vibration levels. The figure also indicates the predicted vibration level using the method outlined in Australian Standard 2187.2-1993: “Explosives – Storage, Transport and Use” for both normal and hard rock.
Figure 8-2 shows measured airblast overpressure values. As for most blast measurement data, overpressure levels show much higher variability than vibration levels.
Figure 8-1 Measured Peak Particle Ground Velocity & Scaled Distance

Report No 03222 Version E Page 48
Figure 8-2 Measured Blast Overpressure & Scaled Distance
8.2 Conceptual Blast Designs
A range of standard blast designs is proposed for the Anvil Hill Project, depending on whether coal or overburden is being blasted.

Report No 03222 Version E Page 49
Table 8-1 shows the standard conceptual blast designs over the modelled stages of the project life, listing various blasting parameters including the Maximum Instantaneous Charge (MIC).

Report No 03222 Version E Page 50
Table 8-1 Conceptual Blast Designs
Operational Year
Y2 Y5 Y10 Y15 Y20
Coal Bench Height
(m) 8 8 8 8 8
Burden (m) 6.5 6.5 6.5 6.5 6.5
Spacing (m) 6 6 6 6 6
MIC (kg) 67 67 67 67 67
Blasts per Year 58 190 153 126 71
Overburden Bench Height
(m) 35 35 35 35 35
Burden (m) 7.5 7.5 7.5 7.5 7.5
Spacing (m) 9 9 9 9 9
MIC (kg) 1,585 1,937 2,524 3,111 3,698
Blasts per Year 15 37 46 40 37
8.3 Predicted Residential Overpressure and Vibration Levels
The distance from blasts at which vibration and overpressure levels meet the ANZECC guidelines can be calculated using:
• The proposed pit locations; • The blasting parameters from Section 8.2; and • Predictive equations.
With regard to annoyance and human discomfort, initial investigations of overpressure levels using the 95th percentile level indicated a significant number of exceedances of the annoyance criterion, and as such control measures need to be implemented. Necessary best-practice measures will include:
• Strict control of stemming for blast holes; • Ensuring adequate timing sequences for all blasts; and • Restriction of blasting under adverse weather conditions.
Development of these procedures will require ongoing refinement of blast design in conjunction with monitoring. With such measures in place it is considered that overpressure and vibration levels equivalent to the best-fit lines in Figure 8-1 and Figure 8-2 are appropriate to use for this assessment. The contours representing the annoyance criteria for overpressure and vibration levels are calculated using the blast parameters outlined in Table 8-1. For vibration it is reasonable to assume that if 95% of all blasts are within 5mm/sec, then 100% of blasts will be within 10mm/sec. The contour for compliance with the annoyance criterion is therefore equivalent to the contour for compliance with the building damage criterion.

Report No 03222 Version E Page 51
Blast overpressure and vibration contours were calculated on the above basis for each of the five operational scenarios over the life of the proposal. Finally worst-case contours for vibration and overpressure are generated using the predicted results for each year. These contours are displayed in Figure 8-3. For this project, the vibration criterion is predicted to be exceeded to a greater degree than the overpressure criterion, due to the size of the Maximum Instantaneous Charges proposed for the Anvil Hill Project. The number of private residences which are predicted to have vibration levels in exceedance of the criteria is shown in Table 8-2 below.
Table 8-2 Number of Residences where Blast Criteria are exceeded
Criterion Number of Residences that Exceed
Criterion
Vibration 23
Overpressure 21
The contour in Figure 8-3 is wholly contained within the worst-case operational noise and air-quality affectation contours for the proposal and further discussion of blasting impacts at residential receivers is therefore not warranted.
8.4 Predicted Vibration Levels at TransGrid Pylons
The pylon structures supporting the TransGrid 500kV power transmission line are shown in Figure 8-4. The maximum vibration levels at each pylon for each operational year are calculated using the procedure outlined in Section 8.3.
The calculation is repeated for each of the modelled scenarios. Table 8-3 shows the predicted blast PPVs for each pylon expressed in terms of the best-fit equation derived from Figure 8-1. These predicted vibration levels are then compared with the agreed maximum level derived in Section 3.4.3 of 50mm/sec. Those predicted PPVs that exceed the maximum are shaded.
Several of the pylons have predicted blast vibration levels significantly exceeding the proposed maximum level. Some of the calculated levels are high enough to cause serious damage to the pylons under the blasting conditions currently proposed, and hence restrictions will be required concerning the location and/or size of blast conducted near the pylons.
8.5 Predicted Vibration Levels at Rock Shelters
A number of rock shelters and rock formations are located within the Project Area. The location of the rock shelters is shown in Figure 8-4. A geotechnical expert has surveyed the sites and produced an estimated significant damage threshold for each structure. Significant damage is defined as detachment of existing joint blocks and/or roof partings. This analysis is based on a mean blast vibration frequency of 10Hz.
Vibration levels from blasting have been calculated at the shelters as described above. Table 8-3 shows the predicted maximum blast PPVs for each structure expressed in terms of the best-fit equation derived from Figure 8-1.
Predicted vibration levels are generally within the damage threshold for each structure. However in the later stages of the operational cycle exceedances of the damage thresholds are noted, particularly for The Book and Anvil Rock.


Report No 03222 Version E Page 52
8.6 Predicted Vibration Levels at Heritage Structures
Several items of historical importance have been identified in the area surrounding the proposal. These items are not considered to be particularly susceptible to damage from vibration and a significant damage threshold has been adopted from a geotechnical analysis. One other heritage site, Castle Hill, has been identified as having susceptibility to vibration damage and the 5mm/sec peak particle velocity criterion has been adopted at this location.
Vibration levels from blasting have been calculated at these sites as before. Table 8-4 shows the predicted maximum blast PPVs for each structure expressed in terms of the best-fit equation derived from Figure 8-1.
Table 8-4 indicates that Castle Hill is predicted to have vibration levels from blasting that exceed the adopted criteria.
8.7 Summary of Vibration Impacts from Blasting
While there are no predicted exceedances of blast criteria at residential locations that are not already impacted by significant noise or dust impacts, one historical site, and several rock shelter sites and TransGrid pylon structures are predicted to have vibration levels in exceedance of their various criteria with the blasting parameters proposed.
The proponent has committed to design and undertake blasts to ensure the relevant vibration and blast overpressure criteria are met at the 500 kV power transmission line, Anvil Rock and rock shelters on Wallaby Rocks, Limb of Addy Hill and Western Rocks that are considered to be of highest Aboriginal cultural value. Remaining heritage structures that are predicted to exceed the vibration criteria will be inspected and recorded by appropriate experts prior to blasting. This will include assessing the structural status and identifying appropriate ameliorative measures, where relevant. Techniques to minimise blast impacts will be employed as necessary to ensure compliance with relevant criteria. This may include blast initiation using electronic detonation techniques, limiting blast MIC, consideration of wind speed and direction prior to blasting, use of adequate stemming, implementing a delay detonation system, and careful drilling and hole loading to ensure that the required blast design is implemented.

Report No 03222 Version E Page 53
Table 8-3 Predicted Vibration Levels at Rock Shelters and Formations
Year 2 Year 5 Year 10 Year 15 Year 20 ID No on
Figure 8.4
Label Criterion
PPV, mm/sec
Min distance
(m) Max PPV (mm/sec)
Min distance
(m) Max PPV (mm/sec)
Min distance
(m) Max PPV (mm/sec)
Min distance
(m) Max PPV (mm/sec)
Min distance
(m) Max PPV (mm/sec)
9 AC42 220 2512 1.1 1974 1.7 1120 5.9 391 45.0 247 117.4 10 BFC12 270 1957 1.8 1416 3.1 569 19.4 60 1204.8 387 53.4 11 CG01 220 995 5.7 521 18.0 194 128.4 353 53.8 1034 9.5 12 CG08 270 907 6.8 404 28.1 195 126.3 583 22.4 860 13.2 13 CG09 220 919 6.6 409 27.5 184 140.0 557 24.3 833 14.0 14 CG10 220 926 6.5 417 26.6 193 128.9 555 24.4 838 13.8 15 WC05 270 2693 1.0 2155 1.5 1300 4.6 573 23.0 376 56.1 16 WC25 220 2420 1.2 1990 1.7 1628 3.1 1296 5.5 555 28.4 17 WC26 270 2420 1.2 1990 1.7 1628 3.1 1296 5.5 555 28.4 18 WC33 270 3785 0.6 3346 0.7 2992 1.1 2663 1.6 1754 3.8 19 WC43 220 2480 1.2 1938 1.8 1093 6.2 462 33.6 436 43.3 20 WC45 220 2588 1.1 2043 1.6 1200 5.3 496 29.7 422 45.9 21 AC38 220 1315 3.5 997 5.8 629 16.3 201 144.3 129 364.4 22 WC46 220 2601 1.1 2056 1.6 1212 5.2 504 28.9 420 46.1 23 WC47 220 2109 1.5 1573 2.6 718 12.9 118 367.1 436 43.2 24 WC27 220 2060 1.6 1625 2.5 1268 4.8 957 9.4 212 152.3
6 Anvil Rock 90 1404 3.1 1054 5.2 653 15.3 188 162.1 306 80.3
8 The Book 100 1444 3.0 1104 4.8 626 16.5 204 140.6 348 64.3

Report No 03222 Version E Page 54
Table 8-4 Predicted Vibration Levels at Heritage Sites
Year 2 Year 5 Year 10 Year 15 Year 20 ID No on
Figure 8.4 Label Criterion
PPV, mm/sec
Min distance
(m) Max PPV (mm/sec)
Min distance
(m) Max PPV (mm/sec)
Min distance
(m) Max PPV (mm/sec)
Min distance
(m) Max PPV (mm/sec)
Min distance
(m) Max PPV (mm/sec)
1 Catholic Church 10 3967 0.5 3438 0.7 2570 1.4 1927 2.8 1882 3.3 2 Castle Hill 5 3321 0.7 2782 1.0 1928 2.3 1207 6.3 828 14.1 3 Yarrawongaö Dairy 10 3288 0.7 3257 0.7 3100 1.0 3800 0.8 3393 1.2 4 Yarrawongaö Feed Shed 10 3322 0.7 3304 0.7 3154 1.0 3836 0.8 3435 1.2 5 Charcoal retorts 10 862 7.4 511 18.6 412 34.2 664 17.8 1525 4.8
7 Hopkins Property (incl
Catholic Church, Collareen)
10 3920 0.5 3376 0.7 2534 1.4 1818 3.1 1560 4.6

Report No 03222 Version E Page 55
9 CONCLUSION
Noise and vibration impacts from the proposed Anvil Hill Project have been assessed in accordance with appropriate environmental standards, notably the NSW Department of Environment and Conservation’s Industrial Noise Policy (INP). Impacts at relevant sensitive receivers such as residential dwellings, heritage structures and items of special cultural significance have been quantified and where possible, measures have been proposed that would reduce these impacts. The major conclusions of this assessment are as follows.
• The existing noise environment around the proposal is typical of a quiet rural area, with little exposure from existing traffic noise and no exposure from any existing industrial noise.
• In keeping with its setting in the Hunter Valley, the Project and its surroundings are often affected by strong night time temperature inversion conditions, which tend to elevate night time noise levels at receivers. The area around the proposal has a high frequency of strong night time temperature inversions, which elevate night time operational noise levels. The assessment of the effect of meteorological conditions on noise levels as used in this report is effectively more conservative than the methodology outlined in the INP. Thus the calculated noise levels are higher than would have been predicted using standard INP conditions.
• Feasible noise control measures have been considered for the Anvil Hill Project and a number are included in the proposal, where viable. However, a substantial number of residential dwellings are still predicted to have 10th percentile noise levels that exceed the typical acquisition criterion of 40dBA. Real time noise monitoring would be undertaken at representative locations to manage potential noise impacts for residences that are predicted to have 10th percentile noise levels above 35dBA.
• Noise levels at residences during the construction of infrastructure and rail facilities would be lower than those levels predicted for operational noise, and as such no additional impacts are expected.
• Vibration and overpressure levels are predicted to exceed the appropriate building damage and annoyance criteria for some private residences. However, these residences are already impacted by significant noise or dust impacts. Some exceedances have been noted at TranGrid pylon structures and at some culturally significant rock shelters and heritage structures at some stages over the project life. Techniques to ensure compliance with appropriate criteria will be implemented at those sites.
• Road traffic noise from off site vehicles will generally be within the ECRTN criteria. The maximum exceedance of the criterion is predicted to be 1.5dBA.
• As a result of the Project, the distance from the Muswellbrook to Ulan rail line at which the ARTC criteria is met has increased by a maximum of 5m for peak daytime freight movements and 20m for peak night time freight movements. These distances correspond to an extra 2 residences that exceed the relevant ARTC criteria.

Report No 03222 Version E Page 56
Note All materials specified by Wilkinson Murray Pty Limited have been selected solely on the basis of acoustic performance. Any other properties of these materials, such as fire rating, chemical properties etc. should be checked with the suppliers or other specialised bodies for fitness for a given purpose.
Quality Assurance We are committed to and have implemented AS/NZS ISO 9001:2000 “Quality Management Systems – Requirements”. This management system has been externally certified and Licence No. QEC 13457 has been issued.
AAAC This firm is a member firm of the Association of Australian Acoustical Consultants and the work here reported has been carried out in accordance with the terms of that membership.
Version Status Date Prepared by Checked by A DRAFT 2 May 2006 Tim Dean Rob Bullen B DRAFT 2 June 2006 Tim Dean Rob Bullen C DRAFT 5 June 2006 Tim Dean Rob Bullen D DRAFT 9 August 2006 Tim Dean Rob Bullen E FINAL 10 August 2006 Tim Dean Rob Bullen

APPENDIX A GLOSSARY OF TERMS

Report No. 03222 Version E Appendix A-1
GLOSSARY
Most environments are affected by environmental noise which continuously varies, largely as a result of road traffic. To describe the overall noise environment, a number of noise descriptors have been developed and these involve statistical and other analysis of the varying noise over sampling periods, typically taken as 15 minutes. These descriptors, which are demonstrated in the graph overleaf, are here defined.
Maximum Noise Level (LAmax) – The maximum noise level over a sample period is the maximum level, measured on fast response, during the sample period.
LA1 – The LA1 level is the noise level which is exceeded for 1% of the sample period. During the sample period, the noise level is below the LA1 level for 99% of the time.
LA10 – The LA10 level is the noise level which is exceeded for 10% of the sample period. During the sample period, the noise level is below the LA10 level for 90% of the time. The LA10 is a common noise descriptor for environmental noise and road traffic noise.
LAeq – The equivalent continuous sound level (LAeq) is the energy average of the varying noise over the sample period and is equivalent to the level of a constant noise which contains the same energy as the varying noise environment. This measure is also a common measure of environmental noise and road traffic noise.
LA50 – The LA50 level is the noise level which is exceeded for 50% of the sample period. During the sample period, the noise level is below the LA50 level for 50% of the time.
LA90 – The LA90 level is the noise level which is exceeded for 90% of the sample period. During the sample period, the noise level is below the LA90 level for 10% of the time. This measure is commonly referred to as the background noise level.
ABL – The Assessment Background Level is the single figure background level representing each assessment period (daytime, evening and night time) for each day. It is determined by calculating the 10th percentile (lowest 10th percent) background level (LA90) for each period.
RBL – The Rating Background Level for each period is the median value of the ABL values for the period over all of the days measured. There is therefore an RBL value for each period – daytime, evening and night time.

Report No. 03222 Version E Appendix A-2
20
25
30
35
40
45
50
55
60
0:00 3:00 6:00 9:00 12:00 15:00
Monitoring or Survey Period (5 sec samples)
Soun
d Pr
essu
re L
evel
(dB
A) LAmax
LA1
LA10
LAeq
LA50
LA90

APPENDIX B CALCULATION OF TEMPERATURE
INVERSION STRENGTHS METHODOLOGY

Report No 03222 Version E Appendix B-1
A temperature inversion is said to occur when temperature increases with height above the ground. Inversions are typically found during the night and early morning periods, and are most common in winter. Under these conditions, noise which would otherwise propagate away from the ground can be refracted downwards, increasing the noise level as heard on the ground. This effect can dramatically reduce the effectiveness of barriers and shielding in controlling noise.
Temperature gradients may be determined either by direct measurement or by other indirect methods. The INP outlines several alternative methods of calculating temperature gradients where direct measured data is not available. These indirect methods allow the susceptibility of an area to inversions to be determined through the use of the relationship developed by the US Atomic Energy Commission between atmospheric stability categories and inversions. The relationship shown in Table 1 outlines the range of temperature gradients that can be expected within each stability category. Hence, if a stability category is known, then the range of possible temperature gradients may be inferred.
Table 1 Range of Temperature Gradients °C per 100m, By Stability Category (from US Atomic Energy Commission)
Stability Class Range of Vertical Temperature
Gradients (DT/DZ)
A Temperature Gradient <-1.9
B -1.9 < D Temperature Gradient < - 1.7
C -1.7 < Temperature Gradient < - 1.5
D -1.5 < Temperature Gradient < - 0.5
E -0.5 < Temperature Gradient < 1.5
F 1.5 < Temperature Gradient < 4.0
G 4.0 < Temperature Gradient
One of the methods outlined in the INP for calculating stability category, and hence temperature inversion, in non-arid areas is the use of sigma-theta data. This measure of the standard deviation of the horizontal wind direction fluctuations can be related to atmospheric stability categories as shown in Table 2.
Table 2 Wind Fluctuation Criteria for Estimating Stability Categories
Stability Class Range of Sigma-Theta Values (σA)
A σA >= 22.5°
B 17.5° <= σA < 22.5°
C 12.5° <= σA < 17.5°
D 7.5° <= σA < 12.5°
E 3.8° <= σA < 7.5°
F 2.1° <= σA < 3.8°
G σA < 2.1°

Report No 03222 Version E Appendix B-2
Using Tables 1 and 2, and sigma-theta data from the Wybong Road weather station, it is possible to estimate the prevalence of temperature inversions of various strengths in the project area. However, utilizing data from the Bengalla mast allows a more accurate assessment by deriving a relationship between sigma theta and temperature inversion strength at the proposal.
It is possible to derive a relationship between stability category (based on sigma-theta levels), and temperature inversion strength at different wind speeds using the data from the Bengalla mast measured during winter 1999. This relationship is illustrated in Table 3. The derived relationship between stability class and inversion strength at Bengalla is considered to be more appropriate than the US Atomic Energy Commission relationship from Table 1 as it uses localised data and includes inversion strengths at different wind speeds.
Table 3 Mean Measured Temperature Inversion Strengths at Bengalla under different Stability Categories during Winter Nights 1999, °C Per 100m
Stabililty Class Wind Speed, m/sec A B C D E F G
0 4 4 4 4 4 6 6
1 4 4 4 4 6 6 4
2 4 4 4 4 4 6 4
3 4 2 4 2 2 4 6
4 2 2 2 0 2 4 4
5 2 2 0 0 2 4 4
6 0 2 2 0 2 4 0
7 0 0 0 0 0 2 0
8 0 2 0 0 0 0 0
9 0 0 0 0 0 0 0
10 0 0 0 0 0 0 0
11 0 0 0 0 0 0 0
12 0 0 0 2 0 0 0
Table 3, in conjunction with wind speed and sigma-theta data from the Wybong Road weather station, was used to calculate the prevalence and strength of temperature inversions in the project area. This approach uses measured inversion strengths at Bengalla to estimate inversion strengths for the same wind speed and sigma-theta values in the project area. This is a more conservative approach than using Table 1 for this purpose, as the overall estimated prevalence and strength of inversions is higher than would have been derived from Table 1.

APPENDIX C CALCULATED 10TH PERCENTILE
OPERATIONAL NOISE LEVELS

Report No. 03222 Version E Appendix C-1
Const Y2 Y5 Y10 Y15 Y20
Residence Day Night Day Eve Night Day Eve Night Day Eve Night Day Eve Night Day Eve
Worst-Case All
Operational
Years
1 45 48 42 42 50 45 45 61 56 56 45 42 41 41 39 36 61
10 54 40 36 35 41 39 38 47 44 43 36 33 31 35 33 31 47
11 45 43 36 35 43 39 38 50 47 47 34 30 29 31 26 25 50
12 33 40 38 38 43 42 41 43 42 42 47 46 46 55 55 55 55
13 30 40 38 38 44 43 43 47 44 44 52 49 49 61 62 61 62
16 42 42 39 39 45 42 41 51 45 45 42 39 38 39 36 36 51
26 40 41 37 35 42 40 38 45 43 43 36 35 34 34 33 32 45
28 31 37 35 35 38 39 39 41 40 40 36 43 43 33 34 34 43
29A 40 46 41 41 45 40 40 45 40 41 44 39 39 43 38 38 46
30 38 44 39 39 45 39 40 46 41 41 46 42 42 41 36 37 46
31 43 41 37 36 44 39 39 49 49 49 30 28 27 28 25 23 49
34 48 48 44 44 48 43 43 48 43 43 47 41 41 45 41 41 48
35 38 43 42 42 45 46 46 49 49 49 45 51 51 41 42 42 51
37 39 46 42 43 45 40 40 47 42 42 46 42 42 41 36 37 47
39 32 40 37 38 41 40 40 41 41 41 37 37 37 36 34 34 41
40 43 40 37 35 41 38 38 44 42 42 36 35 34 33 32 31 44
43 44 58 53 52 55 51 51 54 53 53 54 44 44 52 50 50 58
48 33 38 34 33 39 36 35 41 37 37 37 30 29 36 32 32 41
51 34 40 38 38 41 41 41 43 42 42 41 44 44 35 36 37 44
53 34 40 38 39 41 41 41 45 45 45 38 38 38 35 35 34 45
54 24 31 30 29 34 32 32 32 33 32 33 33 33 31 28 28 34
55 49 40 36 35 41 39 37 46 43 42 36 35 33 34 32 32 46

Report No. 03222 Version E Appendix C-2
Const Y2 Y5 Y10 Y15 Y20
Residence Day Night Day Eve Night Day Eve Night Day Eve Night Day Eve Night Day Eve
Worst-Case All
Operational
Years
56 35 40 39 39 41 42 42 44 43 43 42 48 48 36 36 37 48
60 40 44 43 43 47 47 47 47 47 48 44 46 46 41 41 41 48
62 37 42 41 41 43 44 44 47 46 46 44 48 49 35 36 36 49
64 45 42 38 37 44 40 37 47 47 46 35 31 30 33 29 25 47
65 35 41 38 38 43 40 40 48 47 47 38 37 36 35 34 34 48
66 31 35 33 33 36 35 35 40 40 40 33 34 33 29 29 28 40
68 53 40 37 36 42 39 38 48 45 44 37 33 31 34 33 31 48
69 39 44 40 40 45 41 41 44 40 40 41 37 36 41 37 36 45
71 34 39 35 34 40 38 37 44 42 42 36 35 35 34 33 33 44
74 27 36 34 34 38 35 35 37 36 36 36 36 36 37 30 31 38
77 42 42 39 38 45 41 41 50 45 45 43 39 39 39 37 36 50
78 42 47 43 44 47 43 43 47 43 43 46 41 41 45 41 42 47
79 23 33 31 31 35 33 33 32 33 33 34 34 34 34 29 30 35
80 37 42 41 41 45 45 45 46 46 46 43 45 45 41 40 40 46
81 35 39 38 38 41 41 41 44 43 43 41 43 44 38 38 39 44
82 41 45 44 44 47 48 48 53 52 53 47 51 52 43 43 44 53
83 18 34 33 33 34 33 33 32 32 32 32 34 34 34 35 35 35
84 44 52 47 45 52 51 51 50 52 52 39 39 36 38 38 34 52
85 45 40 35 34 43 40 36 48 45 43 36 31 30 32 27 25 48
88 38 49 44 44 47 45 45 51 51 51 40 39 39 37 36 36 51
89 40 40 36 36 41 40 39 44 43 42 36 36 35 33 33 32 44
90 42 48 47 47 49 48 48 48 48 48 42 42 42 38 37 37 49

Report No. 03222 Version E Appendix C-3
Const Y2 Y5 Y10 Y15 Y20
Residence Day Night Day Eve Night Day Eve Night Day Eve Night Day Eve Night Day Eve
Worst-Case All
Operational
Years
91 34 38 37 37 40 40 40 42 42 42 42 43 44 36 37 38 44
92 39 43 42 42 46 46 46 47 46 46 44 46 46 41 41 41 47
94 29 38 36 36 38 38 38 39 38 38 42 39 39 37 37 37 42
101 36 44 42 42 45 44 44 45 45 45 40 39 39 37 36 36 45
102 33 42 37 37 42 38 38 42 39 39 42 38 38 39 35 35 42
103 26 32 31 31 34 34 34 34 34 34 35 35 35 31 32 32 35
104 30 38 35 35 38 35 35 38 36 36 37 34 34 35 33 33 38
105 37 46 42 41 45 41 41 45 41 41 44 37 37 43 38 38 46
108 30 36 36 36 37 38 38 38 38 38 37 40 40 32 35 35 40
110 29 34 33 33 36 36 36 36 38 38 35 37 37 33 35 35 38
111 32 33 31 31 35 34 32 39 35 34 32 29 27 29 26 24 39
112A 25 31 29 29 33 32 32 31 32 32 32 33 33 31 29 29 33
113 33 38 36 37 39 39 39 42 42 42 34 36 36 31 33 33 42
114 24 31 30 30 34 32 32 32 33 33 33 34 34 32 29 29 34
115 38 46 42 42 46 41 42 46 42 42 46 38 38 45 40 40 46
118 40 36 34 33 38 37 36 43 41 40 35 34 33 33 32 31 43
269A 32 41 35 36 40 36 37 41 36 36 41 37 37 37 33 34 41
121 36 43 37 38 43 38 39 44 38 39 45 40 40 40 35 36 45
124 20 19 21 21 25 27 28 26 32 32 30 31 32 21 21 22 32
128 26 31 30 30 34 34 34 36 37 37 28 28 29 30 25 26 37
130 30 34 33 33 36 37 37 37 38 38 37 39 39 33 36 36 39
132 38 46 41 41 46 41 41 46 41 41 45 38 38 44 39 39 46
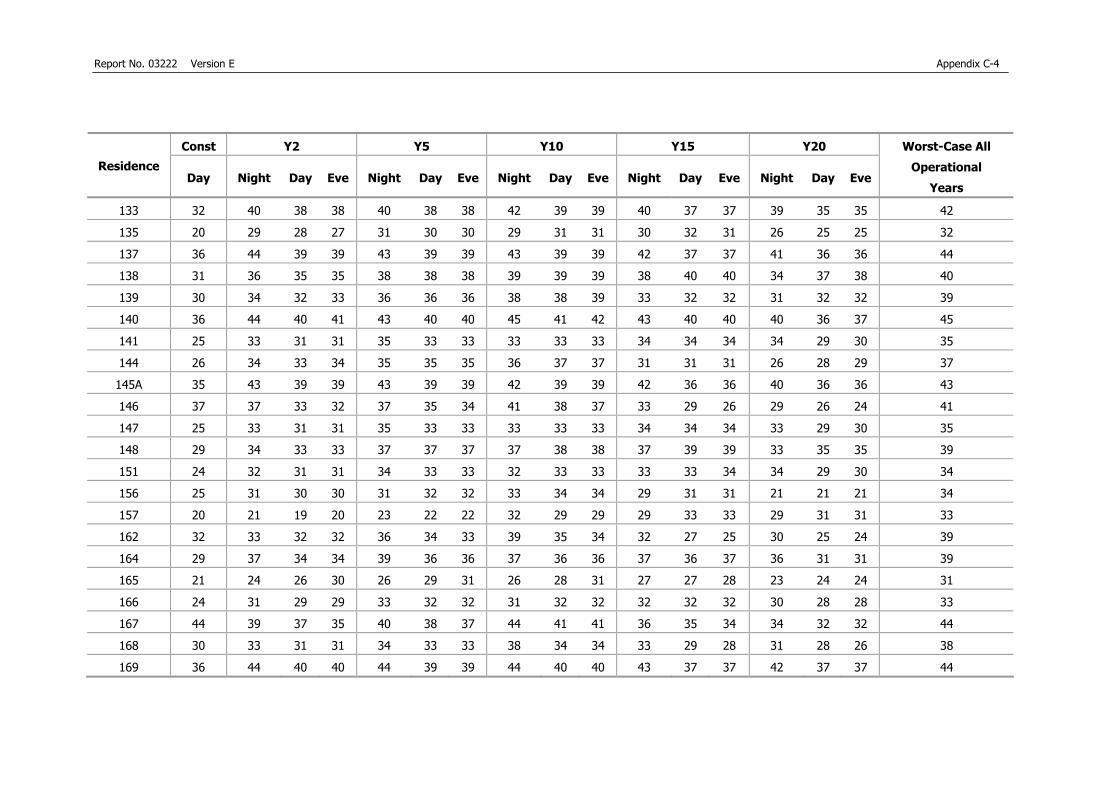
Report No. 03222 Version E Appendix C-4
Const Y2 Y5 Y10 Y15 Y20
Residence Day Night Day Eve Night Day Eve Night Day Eve Night Day Eve Night Day Eve
Worst-Case All
Operational
Years
133 32 40 38 38 40 38 38 42 39 39 40 37 37 39 35 35 42
135 20 29 28 27 31 30 30 29 31 31 30 32 31 26 25 25 32
137 36 44 39 39 43 39 39 43 39 39 42 37 37 41 36 36 44
138 31 36 35 35 38 38 38 39 39 39 38 40 40 34 37 38 40
139 30 34 32 33 36 36 36 38 38 39 33 32 32 31 32 32 39
140 36 44 40 41 43 40 40 45 41 42 43 40 40 40 36 37 45
141 25 33 31 31 35 33 33 33 33 33 34 34 34 34 29 30 35
144 26 34 33 34 35 35 35 36 37 37 31 31 31 26 28 29 37
145A 35 43 39 39 43 39 39 42 39 39 42 36 36 40 36 36 43
146 37 37 33 32 37 35 34 41 38 37 33 29 26 29 26 24 41
147 25 33 31 31 35 33 33 33 33 33 34 34 34 33 29 30 35
148 29 34 33 33 37 37 37 37 38 38 37 39 39 33 35 35 39
151 24 32 31 31 34 33 33 32 33 33 33 33 34 34 29 30 34
156 25 31 30 30 31 32 32 33 34 34 29 31 31 21 21 21 34
157 20 21 19 20 23 22 22 32 29 29 29 33 33 29 31 31 33
162 32 33 32 32 36 34 33 39 35 34 32 27 25 30 25 24 39
164 29 37 34 34 39 36 36 37 36 36 37 36 37 36 31 31 39
165 21 24 26 30 26 29 31 26 28 31 27 27 28 23 24 24 31
166 24 31 29 29 33 32 32 31 32 32 32 32 32 30 28 28 33
167 44 39 37 35 40 38 37 44 41 41 36 35 34 34 32 32 44
168 30 33 31 31 34 33 33 38 34 34 33 29 28 31 28 26 38
169 36 44 40 40 44 39 39 44 40 40 43 37 37 42 37 37 44
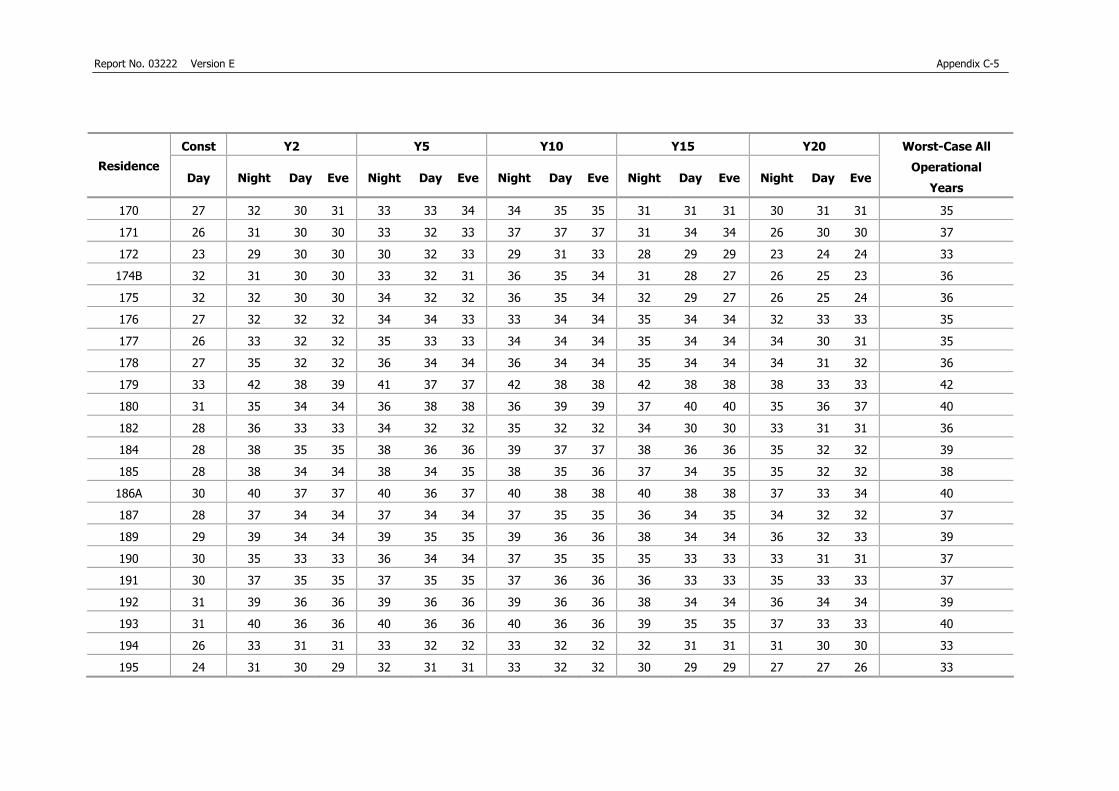
Report No. 03222 Version E Appendix C-5
Const Y2 Y5 Y10 Y15 Y20
Residence Day Night Day Eve Night Day Eve Night Day Eve Night Day Eve Night Day Eve
Worst-Case All
Operational
Years
170 27 32 30 31 33 33 34 34 35 35 31 31 31 30 31 31 35
171 26 31 30 30 33 32 33 37 37 37 31 34 34 26 30 30 37
172 23 29 30 30 30 32 33 29 31 33 28 29 29 23 24 24 33
174B 32 31 30 30 33 32 31 36 35 34 31 28 27 26 25 23 36
175 32 32 30 30 34 32 32 36 35 34 32 29 27 26 25 24 36
176 27 32 32 32 34 34 33 33 34 34 35 34 34 32 33 33 35
177 26 33 32 32 35 33 33 34 34 34 35 34 34 34 30 31 35
178 27 35 32 32 36 34 34 36 34 34 35 34 34 34 31 32 36
179 33 42 38 39 41 37 37 42 38 38 42 38 38 38 33 33 42
180 31 35 34 34 36 38 38 36 39 39 37 40 40 35 36 37 40
182 28 36 33 33 34 32 32 35 32 32 34 30 30 33 31 31 36
184 28 38 35 35 38 36 36 39 37 37 38 36 36 35 32 32 39
185 28 38 34 34 38 34 35 38 35 36 37 34 35 35 32 32 38
186A 30 40 37 37 40 36 37 40 38 38 40 38 38 37 33 34 40
187 28 37 34 34 37 34 34 37 35 35 36 34 35 34 32 32 37
189 29 39 34 34 39 35 35 39 36 36 38 34 34 36 32 33 39
190 30 35 33 33 36 34 34 37 35 35 35 33 33 33 31 31 37
191 30 37 35 35 37 35 35 37 36 36 36 33 33 35 33 33 37
192 31 39 36 36 39 36 36 39 36 36 38 34 34 36 34 34 39
193 31 40 36 36 40 36 36 40 36 36 39 35 35 37 33 33 40
194 26 33 31 31 33 32 32 33 32 32 32 31 31 31 30 30 33
195 24 31 30 29 32 31 31 33 32 32 30 29 29 27 27 26 33

Report No. 03222 Version E Appendix C-6
Const Y2 Y5 Y10 Y15 Y20
Residence Day Night Day Eve Night Day Eve Night Day Eve Night Day Eve Night Day Eve
Worst-Case All
Operational
Years
198 29 35 32 32 35 32 31 37 34 34 34 31 31 32 30 29 37
199 25 36 33 33 37 35 35 38 37 37 37 35 35 34 31 32 38
200 29 36 32 32 35 31 31 34 33 33 35 36 36 31 28 28 36
201A 27 36 33 33 35 33 33 36 34 34 35 33 33 33 31 31 36
202 27 29 28 28 31 30 30 32 31 31 30 29 29 29 28 28 32
203A 27 29 28 28 30 30 29 32 31 31 30 29 29 28 28 27 32
205 27 31 30 30 34 33 34 36 37 37 31 33 33 29 30 30 37
206 24 29 28 29 31 31 31 30 32 32 30 32 32 29 30 30 32
207 25 29 28 28 32 32 32 33 33 33 28 29 29 28 28 29 33
208 23 28 28 28 30 30 30 31 32 32 27 29 29 24 25 26 32
209 14 27 27 27 27 27 27 24 27 27 24 25 25 22 23 23 27
210 5 16 16 15 17 16 16 17 17 17 16 14 14 16 16 16 17
211 20 27 26 26 27 27 27 29 29 29 29 28 28 26 25 25 29
212A 16 23 22 22 23 24 24 25 24 24 26 25 25 25 22 22 26
213 24 31 28 28 33 30 31 32 30 31 31 31 31 29 27 27 33
214 20 30 28 28 30 27 28 31 28 29 29 30 31 26 22 22 31
215 21 33 30 30 33 30 30 32 30 30 30 31 31 26 23 24 33
216 21 34 32 32 34 32 32 32 30 31 31 31 32 28 25 25 34
217 22 35 33 33 35 32 33 35 32 33 32 32 32 30 25 25 35
218 24 35 33 33 35 33 33 35 35 35 34 33 33 32 29 29 35
219 23 33 30 30 34 32 33 35 34 34 33 32 32 31 28 28 35
220 22 33 31 32 34 32 32 34 33 34 33 32 32 30 28 28 34

Report No. 03222 Version E Appendix C-7
Const Y2 Y5 Y10 Y15 Y20
Residence Day Night Day Eve Night Day Eve Night Day Eve Night Day Eve Night Day Eve
Worst-Case All
Operational
Years
204 25 34 31 32 34 32 32 35 33 33 33 33 33 31 29 29 35
222 22 33 31 31 33 32 32 34 33 33 33 32 32 30 28 28 34
223 23 32 30 30 33 32 32 34 33 33 32 32 32 30 28 28 34
227 26 36 33 33 36 34 34 36 34 34 34 32 32 33 30 30 36
228 25 34 32 32 34 32 32 35 33 33 34 32 32 31 30 30 35
230 23 33 31 31 33 31 31 33 32 32 32 30 30 31 29 29 33
231 23 33 31 31 33 31 31 33 32 32 32 30 30 30 29 29 33
232A 22 32 30 30 32 30 30 32 32 32 31 30 30 29 28 28 32
232B 22 32 30 30 32 30 30 32 32 32 31 30 30 29 27 27 32
233 22 31 30 30 32 30 30 32 32 31 31 30 29 29 27 27 32
232C 22 31 29 29 32 30 30 32 32 32 31 29 29 29 27 27 32
235A 22 31 29 29 31 29 29 32 31 31 31 29 29 28 26 26 32
236A 21 31 29 29 31 28 28 32 31 31 30 29 29 28 26 26 32
237 25 33 31 31 33 29 29 34 33 33 32 31 30 30 28 28 34
238 24 33 29 29 33 30 30 34 32 32 31 30 30 29 27 27 34
229B 24 32 29 29 32 29 29 34 32 32 30 29 29 29 27 27 34
240 28 36 32 32 35 31 31 34 31 31 34 32 32 32 27 27 36
242 21 31 29 29 30 28 28 29 29 29 28 22 22 29 25 25 31
243 28 32 31 30 33 32 32 34 33 32 32 31 31 31 30 29 34
244 21 29 28 27 28 27 27 28 28 28 27 23 23 26 25 24 29
246 26 29 28 28 30 29 29 32 31 31 29 28 28 27 27 26 32
247 24 26 25 25 27 27 26 30 29 28 27 27 26 26 25 25 30
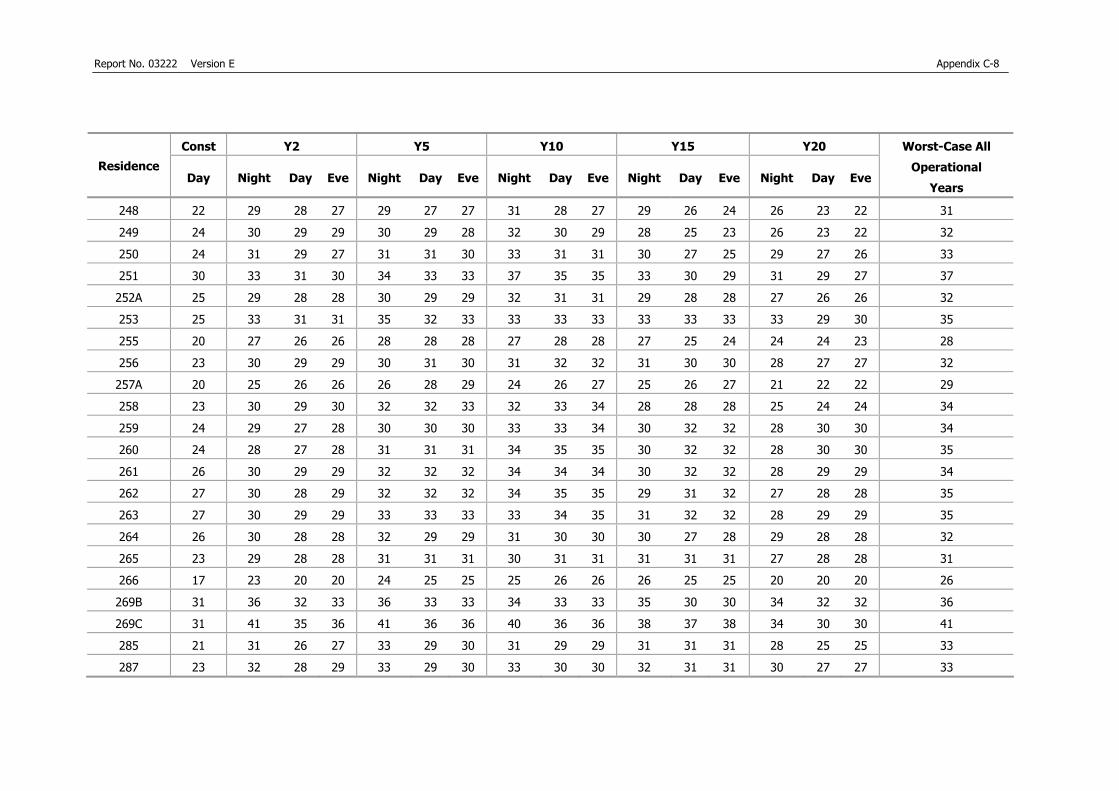
Report No. 03222 Version E Appendix C-8
Const Y2 Y5 Y10 Y15 Y20
Residence Day Night Day Eve Night Day Eve Night Day Eve Night Day Eve Night Day Eve
Worst-Case All
Operational
Years
248 22 29 28 27 29 27 27 31 28 27 29 26 24 26 23 22 31
249 24 30 29 29 30 29 28 32 30 29 28 25 23 26 23 22 32
250 24 31 29 27 31 31 30 33 31 31 30 27 25 29 27 26 33
251 30 33 31 30 34 33 33 37 35 35 33 30 29 31 29 27 37
252A 25 29 28 28 30 29 29 32 31 31 29 28 28 27 26 26 32
253 25 33 31 31 35 32 33 33 33 33 33 33 33 33 29 30 35
255 20 27 26 26 28 28 28 27 28 28 27 25 24 24 24 23 28
256 23 30 29 29 30 31 30 31 32 32 31 30 30 28 27 27 32
257A 20 25 26 26 26 28 29 24 26 27 25 26 27 21 22 22 29
258 23 30 29 30 32 32 33 32 33 34 28 28 28 25 24 24 34
259 24 29 27 28 30 30 30 33 33 34 30 32 32 28 30 30 34
260 24 28 27 28 31 31 31 34 35 35 30 32 32 28 30 30 35
261 26 30 29 29 32 32 32 34 34 34 30 32 32 28 29 29 34
262 27 30 28 29 32 32 32 34 35 35 29 31 32 27 28 28 35
263 27 30 29 29 33 33 33 33 34 35 31 32 32 28 29 29 35
264 26 30 28 28 32 29 29 31 30 30 30 27 28 29 28 28 32
265 23 29 28 28 31 31 31 30 31 31 31 31 31 27 28 28 31
266 17 23 20 20 24 25 25 25 26 26 26 25 25 20 20 20 26
269B 31 36 32 33 36 33 33 34 33 33 35 30 30 34 32 32 36
269C 31 41 35 36 41 36 36 40 36 36 38 37 38 34 30 30 41
285 21 31 26 27 33 29 30 31 29 29 31 31 31 28 25 25 33
287 23 32 28 29 33 29 30 33 30 30 32 31 31 30 27 27 33

Report No. 03222 Version E Appendix C-9
Const Y2 Y5 Y10 Y15 Y20
Residence Day Night Day Eve Night Day Eve Night Day Eve Night Day Eve Night Day Eve
Worst-Case All
Operational
Years
286 22 31 27 27 33 29 30 31 29 30 31 30 31 28 25 25 33
288 20 30 27 27 32 28 28 29 28 28 30 31 31 26 23 23 32
289 28 30 29 29 33 33 33 32 34 34 29 31 31 26 28 28 34
290 22 29 26 25 31 26 26 32 27 26 29 21 22 29 26 25 32
291 25 32 29 29 33 30 30 32 30 30 31 31 31 29 26 27 33
292 22 31 27 28 32 28 28 29 28 29 29 31 31 26 22 23 32
293 25 31 28 28 33 30 31 32 30 31 31 31 31 29 27 28 33
294 25 36 34 34 36 34 34 36 35 35 35 34 34 32 30 30 36
106A 24 31 29 29 32 32 32 32 32 32 33 33 33 29 28 28 33
106B 24 31 29 29 32 32 32 32 32 32 33 33 33 29 29 28 33
116A 27 33 33 33 34 35 35 35 36 36 34 36 36 31 34 34 36
116B 27 33 33 33 34 35 35 35 36 36 34 36 36 30 34 34 36
125A 29 38 35 35 38 35 35 38 36 35 36 33 33 34 32 31 38
125B 27 37 33 32 34 29 29 35 30 30 35 29 29 33 27 27 37
125C 29 38 34 34 36 33 33 37 35 34 35 33 33 34 31 31 38
126A 21 28 23 21 30 30 26 32 32 29 24 23 21 20 18 17 32
126B 21 27 23 23 28 27 25 32 29 28 24 21 21 20 19 18 32
134A 28 32 32 32 35 35 35 35 36 36 36 36 36 32 33 34 36
134B 28 33 32 32 35 36 36 35 36 36 34 36 36 32 34 34 36
134D 23 27 29 30 30 32 32 30 34 34 29 32 32 24 24 25 34
134C 22 25 25 25 26 29 29 30 32 32 31 31 32 23 23 23 32
15B 44 56 51 51 54 49 49 53 49 49 53 39 39 52 49 48 56
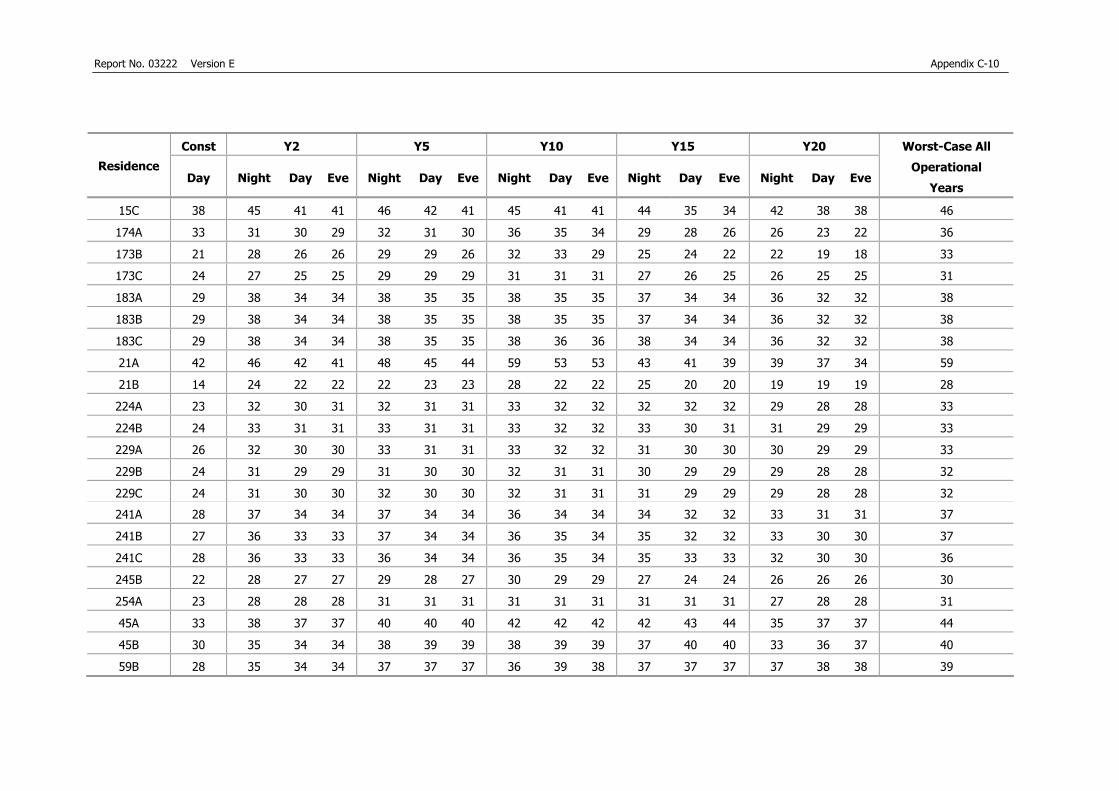
Report No. 03222 Version E Appendix C-10
Const Y2 Y5 Y10 Y15 Y20
Residence Day Night Day Eve Night Day Eve Night Day Eve Night Day Eve Night Day Eve
Worst-Case All
Operational
Years
15C 38 45 41 41 46 42 41 45 41 41 44 35 34 42 38 38 46
174A 33 31 30 29 32 31 30 36 35 34 29 28 26 26 23 22 36
173B 21 28 26 26 29 29 26 32 33 29 25 24 22 22 19 18 33
173C 24 27 25 25 29 29 29 31 31 31 27 26 25 26 25 25 31
183A 29 38 34 34 38 35 35 38 35 35 37 34 34 36 32 32 38
183B 29 38 34 34 38 35 35 38 35 35 37 34 34 36 32 32 38
183C 29 38 34 34 38 35 35 38 36 36 38 34 34 36 32 32 38
21A 42 46 42 41 48 45 44 59 53 53 43 41 39 39 37 34 59
21B 14 24 22 22 22 23 23 28 22 22 25 20 20 19 19 19 28
224A 23 32 30 31 32 31 31 33 32 32 32 32 32 29 28 28 33
224B 24 33 31 31 33 31 31 33 32 32 33 30 31 31 29 29 33
229A 26 32 30 30 33 31 31 33 32 32 31 30 30 30 29 29 33
229B 24 31 29 29 31 30 30 32 31 31 30 29 29 29 28 28 32
229C 24 31 30 30 32 30 30 32 31 31 31 29 29 29 28 28 32
241A 28 37 34 34 37 34 34 36 34 34 34 32 32 33 31 31 37
241B 27 36 33 33 37 34 34 36 35 34 35 32 32 33 30 30 37
241C 28 36 33 33 36 34 34 36 35 34 35 33 33 32 30 30 36
245B 22 28 27 27 29 28 27 30 29 29 27 24 24 26 26 26 30
254A 23 28 28 28 31 31 31 31 31 31 31 31 31 27 28 28 31
45A 33 38 37 37 40 40 40 42 42 42 42 43 44 35 37 37 44
45B 30 35 34 34 38 39 39 38 39 39 37 40 40 33 36 37 40
59B 28 35 34 34 37 37 37 36 39 38 37 37 37 37 38 38 39

Report No. 03222 Version E Appendix C-11
Const Y2 Y5 Y10 Y15 Y20
Residence Day Night Day Eve Night Day Eve Night Day Eve Night Day Eve Night Day Eve
Worst-Case All
Operational
Years
63A 40 43 43 43 45 47 47 51 50 50 46 53 54 41 42 42 54
63B 40 43 43 43 45 46 46 50 50 50 47 53 53 41 42 42 53
70A 35 44 40 40 45 40 40 44 40 39 43 35 35 40 36 36 45
70B 35 44 40 39 44 40 40 44 39 39 43 35 35 41 36 36 44
75A 28 34 29 29 31 30 28 38 34 32 26 22 22 24 22 22 38
19 23 31 28 28 33 29 30 32 30 31 32 31 31 29 27 27 33
25 41 46 41 41 51 45 45 54 48 48 57 54 54 45 38 38 57
270 25 32 28 29 33 30 31 32 30 30 31 31 31 29 27 28 33
275 21 30 28 28 30 28 28 31 30 30 29 28 28 27 26 26 31
283 24 31 28 28 33 29 30 32 30 31 31 31 31 29 27 27 33
295 21 30 27 27 29 28 27 29 28 28 28 23 23 27 25 25 30
112B 24 31 29 29 33 32 32 31 32 32 32 33 33 31 28 28 33
112C 24 31 29 29 33 32 32 31 32 32 31 33 33 30 28 28 33
112D 23 31 29 29 33 32 32 31 32 32 31 32 32 30 28 28 33
116C 27 33 33 33 34 35 35 35 36 36 34 36 36 31 34 34 36
116D 27 33 33 33 35 35 35 35 36 36 34 36 36 30 34 34 36
116E 27 33 33 33 35 35 35 35 36 36 34 36 36 31 34 34 36
116F 27 33 33 33 35 35 35 35 36 36 34 36 36 31 34 34 36
116G 27 33 33 33 34 35 35 35 36 36 34 36 36 31 34 34 36
125E 32 40 36 36 36 32 32 36 33 32 35 27 27 35 30 30 40
145B 35 43 39 39 43 39 39 42 39 39 42 36 36 40 36 36 43
186B 29 40 37 37 40 36 36 40 38 38 40 38 38 36 33 33 40

Report No. 03222 Version E Appendix C-12
Const Y2 Y5 Y10 Y15 Y20
Residence Day Night Day Eve Night Day Eve Night Day Eve Night Day Eve Night Day Eve
Worst-Case All
Operational
Years
188A 20 27 26 26 27 24 24 28 27 27 25 23 23 25 20 20 28
188B 22 29 27 27 30 29 29 30 29 29 28 28 28 27 27 27 30
201B 27 36 33 33 36 34 34 36 34 34 35 33 33 33 31 31 36
203B 22 30 28 28 30 29 29 32 30 30 27 26 25 25 23 23 32
203C 18 24 23 22 24 25 24 23 25 24 21 19 18 21 20 19 25
203D 22 30 29 28 29 28 27 30 29 29 29 26 26 28 26 26 30
203E 20 28 27 27 28 26 26 28 27 27 28 24 24 26 26 25 28
212B 13 21 18 18 19 21 20 21 21 21 21 18 18 17 17 16 21
212C 19 25 24 24 27 26 26 28 27 27 28 27 27 26 24 24 28
235B 21 31 29 29 31 29 29 32 31 31 30 29 29 28 26 26 32
235C 21 31 29 29 31 29 29 32 31 31 30 29 28 28 26 26 32
236B 21 31 29 29 31 29 29 32 31 31 30 29 29 28 26 26 32
236C 21 30 29 28 30 28 28 31 31 31 29 28 28 27 26 26 31
252B 24 27 26 26 28 28 28 30 30 29 28 27 27 26 25 25 30
273A 21 29 28 28 29 28 28 30 30 29 29 28 28 26 25 25 30
273B 21 29 28 28 29 28 28 30 29 29 29 28 28 27 25 25 30
273C 21 29 28 28 30 28 28 31 30 30 29 28 27 26 25 25 31
281A 19 24 23 23 25 25 24 25 25 25 25 24 24 22 22 22 25
281B 19 23 22 22 25 23 24 26 25 25 23 15 15 22 21 21 26
284A 25 31 28 29 33 30 31 32 30 30 31 31 31 29 27 28 33
284B 24 29 28 28 30 28 29 31 29 29 29 26 27 28 27 27 31
29B 40 45 41 41 45 40 40 45 41 41 44 39 39 42 38 38 45
96A 30 33 31 30 34 33 31 38 34 33 32 28 27 31 28 26 38

Report No. 03222 Version E Appendix C-13
Const Y2 Y5 Y10 Y15 Y20
Residence Day Night Day Eve Night Day Eve Night Day Eve Night Day Eve Night Day Eve
Worst-Case All
Operational
Years
96B 30 33 32 31 34 33 32 38 34 34 33 29 28 31 28 26 38
