noise genetics: inferring protein function by correlating ... · pdf filenoise genetics:...
TRANSCRIPT

Noise Genetics: Inferring Protein Function by CorrelatingPhenotype with Protein Levels and Localization inIndividual Human CellsShlomit Farkash-Amar1, Anat Zimmer1, Eran Eden1, Ariel Cohen1, Naama Geva-Zatorsky1, Lydia Cohen1,
Ron Milo2, Alex Sigal1, Tamar Danon1, Uri Alon1*
1 Department of Molecular Cell Biology, Weizmann Institute of Science, Rehovot, Israel, 2 Department of Plant Sciences, Weizmann Institute of Science, Rehovot, Israel
Abstract
To understand gene function, genetic analysis uses large perturbations such as gene deletion, knockdown or over-expression. Large perturbations have drawbacks: they move the cell far from its normal working point, and can thus bemasked by off-target effects or compensation by other genes. Here, we offer a complementary approach, called noisegenetics. We use natural cell-cell variations in protein level and localization, and correlate them to the natural variations ofthe phenotype of the same cells. Observing these variations is made possible by recent advances in dynamic proteomicsthat allow measuring proteins over time in individual living cells. Using motility of human cancer cells as a model system,and time-lapse microscopy on 566 fluorescently tagged proteins, we found 74 candidate motility genes whose level orlocalization strongly correlate with motility in individual cells. We recovered 30 known motility genes, and validated severalnovel ones by mild knockdown experiments. Noise genetics can complement standard genetics for a variety of phenotypes.
Citation: Farkash-Amar S, Zimmer A, Eden E, Cohen A, Geva-Zatorsky N, et al. (2014) Noise Genetics: Inferring Protein Function by Correlating Phenotype withProtein Levels and Localization in Individual Human Cells. PLoS Genet 10(3): e1004176. doi:10.1371/journal.pgen.1004176
Editor: Justin C. Fay, Washington University School of Medicine, United States of America
Received August 7, 2013; Accepted December 30, 2013; Published March 6, 2014
Copyright: � 2014 Farkash-Amar et al. This is an open-access article distributed under the terms of the Creative Commons Attribution License, which permitsunrestricted use, distribution, and reproduction in any medium, provided the original author and source are credited.
Funding: The research leading to these results has received funding from the European Research Council under the European Union’s Seventh FrameworkProgramme (FP7/2007-2013)/ERC Grant agreement nu 249919; the European Union’s Seventh Framework Programme (FP7/2007-2013) under grant agreementnu258068; EU-FP7-Systems Microscopy NoE; and the Human Frontiers Science Program. UA is the incumbent of the Abisch-Frenkel Professorial Chair. The fundershad no role in study design, data collection and analysis, decision to publish, or preparation of the manuscript.
Competing Interests: The authors have declared that no competing interests exist.
* E-mail: [email protected]
Introduction
To understand which proteins contribute to a biological
phenomenon, current approaches use perturbations such as gene
knockdown, over-expression or knockout. These approaches
have provided the basis for much of what we know about cell
biology. However, such perturbations also have drawbacks.
Perturbations currently used are usually large - a protein
expression is either markedly reduced or increased, and the
measurement is therefore far from the cells normal working
condition. This can lead to artificial off-target effects or to
masking of the perturbation by changes in the cell that
compensate for the loss of a protein. It is thus possible that
some of the information about protein function has remained
hidden due to these features of current methods.
To offer a complementary way to understand protein function,
we present an approach called noise genetics. Noise genetics uses
the natural cell-cell variation in protein levels and localization [1–
8] as a source of mild perturbations to reveal protein function.
Since natural fluctuations are mild, the risk of compensation is
reduced. The idea is to correlate the protein levels and
localization in individual cells to the phenotype in the same
cells. Notably, cell-cell variation in protein level changes slowly
over time: cells keep their individual levels for about a cell
generation [7]. Thus, the noise we use is a type of cell
individuality (Figure S1). Cells have individual character in many
of their phenotypes as well, that also last for about a cell
generation [9,10].
Previous studies used noise for understanding regulatory
interactions between a few proteins in bacteria [1,11], whereas
here we screen hundreds of proteins. As a model system, we use
the motility phenotype of human cancer cells. Motility of cancer
cells is of general interest both as a well-studied biological
phenotype [12], and as a feature of normal physiology and cancer
metastasis [13]. Wide scale genetic screens, including siRNA
knockdowns, have revealed numerous genes involved in motility
[14–16]. Moreover, natural phenotypic variability and fluores-
cent microscopy were used to study the shape of motile cells [10]
and the cytoskeleton dynamics [17].We use a library of human
cancer cell clones each with a different protein fluorescently
tagged at its endogenous chromosomal locus [18,19] to follow the
natural variability of proteins, and the natural variability of
motility in the same cell. Proteins whose level or localization
correlate with motility are identified as candidate motility
proteins.
We find that about 15% of the 566 highly expressed proteins
that we tested exhibit a significantly high correlation between their
protein features and motility in individual cells. This correlation
can suggest that the protein has a role in cell motility. About half of
these candidate proteins were previously known to be involved in
cell motility. We validated a sample of these candidates using mild
siRNA knockdown.
PLOS Genetics | www.plosgenetics.org 1 March 2014 | Volume 10 | Issue 3 | e1004176

Results
Level and localization of 566 unique proteins wereanalyzed in time-lapse movies
To study natural variability between individual cells, we used
the LARC library of human clones with tagged proteins [18–20].
The library is made of clones of a parental human lung cancer cell
line, H1299. In each clone, a full-length protein is fluorescently
tagged with YFP as an internal exon (Figure 1A). The protein is
tagged at its endogenous chromosomal locus, preserving the
natural promoter and regulatory sequences (Figure 1B). Previous
studies suggest that most (70–80%) of the tagged proteins preserve
their wild-type dynamics and localization [18,20].
The parental clone also expresses proteins tagged with red
florescence using mCherry. This red fluorescence is used for image
analysis of time lapse movies (Figure 1C), allowing automated
segmentation and tracking of the nucleus and cytoplasm in all
clones (Figure 1D). The tagged proteins are XRCC5 and DAP1,
both not known to be involved in motility.
A previous study employed this library to follow 1260 clones
with different tagged proteins as they responded to an anti-cancer
drug using time-lapse movies [18]. Here, we re-analyzed these
movies, that also included the 24 h period before drug addition,
together with movies from a recent study on protein half-lives
using the same library and microscopy system (Eden et al, 2011)
and chose 704 unique proteins with high quality movies for further
analysis (movies chosen had 4 fields of view totaling at least 20 cells
at each time-point). Of these, we chose only known proteins (as
opposed to ESTs) with subcellular localization matching the
literature. This results in a final set of 566 different proteins. These
proteins have diverse cellular localizations and functions (Supple-
mentary File S1).
Correlation between protein and motility features wastested for each cell
We tracked the protein level and localization in each cell, and
also the motility of the same cells. Protein level is given by the
summed YFP fluorescence of all pixels in the cell. Most proteins in
our dataset did not show large translocation events between cell
compartments such as nucleus and cytoplasm. To parameterize
protein localization, we therefore characterized the spatial
distribution inside the cell, using two well-known measures from
image analysis: contrast (the existence of sharp changes in
intensity) and texture (also called texture correlation, the linear
dependency of grey levels on those of neighboring pixels) [21–23].
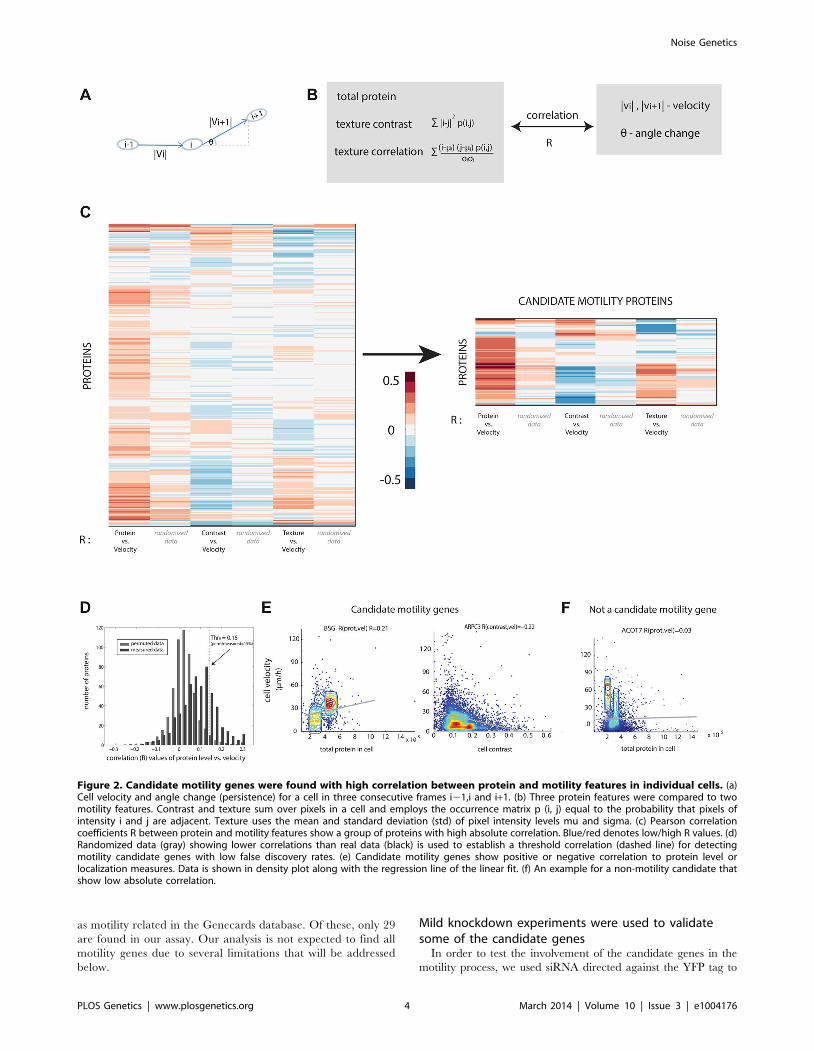
Cell motility was quantified in terms of speed and angle change
of the motion (Figure 2A). Cell velocity was measured as the
change in cell center of mass between frames (20 min). The angle
change of cell movement in frame i was calculated based on the
deviation of the cell in frame i+1 from its movement between
frame i-1 and frame i. Persistent motion results in low values of
angle change (Figure 2B). We found that angle change was
negatively correlated with cell velocity (Figure S2).
If a protein is involved in motility, we expect a significant
positive or negative correlation between at least one of the protein
parameters and one of the motility parameters. For example, if
cells that express protein X at high levels move faster, whereas cells
that express it at lower levels move slower, we predict that protein
X is a candidate motility gene (Figure 1E). A similar conclusion is
reached if contrast or texture correlate with motility. For example,
if cells that show a homogenous spatial distribution of protein Y
move slower than cells that express protein Y in more punctuate
manner (high contrast of fluorescence across the cell), one may
predict that Y is a candidate motility gene. The contrast and
texture differences we observe between cells are subtle, not gross
changes such as transitions between organelles. Images of cells are
provided in S3–S5.
We compared the three protein properties (protein level,
contrast and texture) to the two motility parameters (speed, angle
change) in each cell and each time-point using Spearman and
Pearson correlations (Figure 2C, Figure S6). The observed
correlation values are centered at around zero and range from
20.4 to 0.4.
In order to test the significance of the calculated correlation
values, we compared them to correlations in randomized data. To
make a stringent comparison, we note that data from different
time-points of the same cell are not independent. Furthermore,
cells from the same field of view are potentially more dependent
than cells in other fields of view, due to possible systematic effects
in the experiment. We thus constructed the randomized dataset by
associating the motility parameters for cell i at all time points with
the protein properties from a different cell j at the same time points
in the same field of view, with i and j randomly chosen. This
provides a randomized control of the same size as the original
data.
The permuted datasets showed correlations between protein
and motility parameters mainly (90%) in the range 20.1 to 0.1
(gray bars in Figure 2D). Comparing the randomized distribution
to the measured data (black bars in Figure 2D) shows proteins with
correlations higher or lower than expected by chance. In this
study, we define a candidate motility gene if its absolute
correlation coefficient |R| exceeds 0.15 in both Pearson and
Spearman correlations. Based on the comparison to randomized
data, the rate of false positives is expected to be 15% for
comparisons of protein level to cell velocity (Figure S7), 23% for
contrast versus velocity, 30% for texture versus velocity. To test
this, we conducted a new set of time-lapse microscopy experiments
on a random sample of 19 candidate motility proteins, and found
that 16/19 showed the same above-threshold correlations as in the
original movie dataset, consistent with a false-detection rate of
about 15% (see Supplementary File S3).
Similar false discovery rates were obtained for the comparison
between angle change and the protein properties (Figure S7).
Several examples of proteins with positive and negative high
correlations are shown (Figure 2E) along with examples of proteins
Author Summary
Inferring the function of proteins and the role they play incellular processes is essential for our understanding of cellbiology, genetics and biology in general. Standard geneticapproaches use large perturbations to cells such as geneknockout, knockdown or over expression of genes. Suchmethods are powerful, but have the drawback of takingthe cell far from its normal working point. Here, we providea new and much milder approach, which uses the naturalcell-cell variation in protein level and expression pattern asa source of mild perturbation. We monitor individual livecancer cells under the microscope and correlate theirprotein levels and localization with phenotype in the samecells. We use the motility of human cancer cells as a modelsystem that is highly important for understanding metas-tasis in cancer. We find that our approach uncovers mostof the known motility proteins, as well as new ones whichwe validate using knockdown experiments. Our novelapproach is widely applicable to any phenotype that canbe visualized in individual cells, and for any organism forwhich one can measure proteins in individual cells.
Noise Genetics
PLOS Genetics | www.plosgenetics.org 2 March 2014 | Volume 10 | Issue 3 | e1004176

that did not show a significant correlation between the protein
level and the motility in individual cells (Figure 2F).
Many of the motility candidate genes are known to playa role in motility
We found 74 candidate motility genes (Supplementary File S1,
S2). Of these, 31 (41%) correlate by protein level. The rest of the
proteins correlate with motility by contrast (25%) or texture (23%),
and 15% of the candidate proteins correlate by more than one
measure.
The candidate genes are highly enriched in genes previously
known to play a role in motility: 41% (30/74) were previously
characterized as motility genes (hypergeometric p = 0.0009)
according to the Genecards database (see Methods). Among the
candidate genes are actin regulators in the ARP complex
(ARPC3 [24]), two actin related proteins (ACTR2 and AC-
TR1A), RAC1 [25] that is essential for cell migration and
WASF2 [26] that is part of the WAVE complex that regulates
lamellipodia formation [12]. (Other examples are described in
Figure 3A). Some of the candidate genes have no known role in
motility (Figure 3B).
The subcellular localization of the candidate genes is enriched
in the cytoskeleton (hypergeometric p-value = 0.0008), the plasma
membrane (p = 0.02) as well as the ER/golgi (p = 0.06)
(Figure 3D).
In an attempt to estimate the false-negative rate of this assay,
we considered the 13 genes out of the 566 in this study that were
listed as motility genes in a recent review of motility (Ridley,
2011). Among these 13 relatively well-characterized genes, 7
genes were not identified as candidate motility genes in this
study (Figure 3C). This suggests a false-negative rate on the
order of 50%. However, some of these false negative genes
showed a relatively high correlation in one of the examined
comparisons and would be scored positive in a less stringent
threshold choice. A more extensive false-negative test compared
the present assay to all 110 genes in our set of 566 that are listed
Figure 1. Overview of the noise genetics approach. (a) We used a library of endogenously tagged proteins in human H1299 cells. Briefly, aretrovirus introduced YFP as an artificial exon into the introns of genes. Fluorescent clones were selected and sequenced. The clones express fulllength protein under endogenous control, with an internal YFP tag. (b) We selected 566 unique proteins with high quality movies and correctlocalization, and performed, or used existing, 24 h time-lapse movies(c) under controlled conditions. (d) Automated image analysis enabled by amCherry tag in the parental clone enabled automatic tracking of protein level and localization as well as motility of each individual cell over time. (e)To find candidate motility genes, we sought proteins with high absolute correlation between protein level or localization (contrast, texture) andmotility parameters (velocity, persistence). We tested a sample of the candidate motility genes by siRNA knockdown.doi:10.1371/journal.pgen.1004176.g001
Noise Genetics
PLOS Genetics | www.plosgenetics.org 3 March 2014 | Volume 10 | Issue 3 | e1004176
as motility related in the Genecards database. Of these, only 29
are found in our assay. Our analysis is not expected to find all
motility genes due to several limitations that will be addressed
below.
Mild knockdown experiments were used to validatesome of the candidate genes
In order to test the involvement of the candidate genes in the
motility process, we used siRNA directed against the YFP tag to
Figure 2. Candidate motility genes were found with high correlation between protein and motility features in individual cells. (a)Cell velocity and angle change (persistence) for a cell in three consecutive frames i21,i and i+1. (b) Three protein features were compared to twomotility features. Contrast and texture sum over pixels in a cell and employs the occurrence matrix p (i, j) equal to the probability that pixels ofintensity i and j are adjacent. Texture uses the mean and standard deviation (std) of pixel intensity levels mu and sigma. (c) Pearson correlationcoefficients R between protein and motility features show a group of proteins with high absolute correlation. Blue/red denotes low/high R values. (d)Randomized data (gray) showing lower correlations than real data (black) is used to establish a threshold correlation (dashed line) for detectingmotility candidate genes with low false discovery rates. (e) Candidate motility genes show positive or negative correlation to protein level orlocalization measures. Data is shown in density plot along with the regression line of the linear fit. (f) An example for a non-motility candidate thatshow low absolute correlation.
Noise Genetics
PLOS Genetics | www.plosgenetics.org 4 March 2014 | Volume 10 | Issue 3 | e1004176

Noise Genetics
PLOS Genetics | www.plosgenetics.org 5 March 2014 | Volume 10 | Issue 3 | e1004176

lower the expression level of the tagged proteins. Since we
introduced YFP as an exon to all clones, the anti-YFP siRNA can
be used to knockdown expression in any clone from the library.
The knockdown is mild (at most half-knockdown) because only
one allele is tagged with YFP. Thus, a 50% reduction in YFP
corresponds to a 25% reduction in total protein due to the
expression from the untagged allele. We chose 11 candidate genes
that had positive correlation between protein level and motility or
a significant correlation between a protein feature and motility. Of
these candidate genes, 4 are previously known motility genes and 7
are novel, randomly chosen from the candidate list. We also tested
4 control genes that did not correlate with motility. We took time-
lapse movies for 48 hours starting 24 hours after the siRNA
infection (Figure 4A).
We used the YFP fluorescence to observe the extent of
knockdown (Figure 4B). The mCherry labeling of the cells was
not influenced by the siRNA (Figure S8). 10 out of the 11
candidate motility gene clones showed significantly lowered
velocity (reduction of 15–35%), whereas 3 of the control genes
(GAPDH and TOP1 and one gene of unknown function) showed
no measurable reduction in velocity (Figure 4C).
One control gene – the ribosomal gene RPS3, not known to
affect motility, showed a motility defect upon mild knockdown. It
was not picked up as a candidate motility gene in the noise
genetics assay based on cell-cell variations. This may point to a
difference between knockdown that affects only a single gene in a
module such a ribosome, and noise genetics, where fluctuations in
all genes in a module (e.g. all ribosomal genes) are expected to be
correlated [7,8].
In total, candidate motility genes, both previously known and
novel were validated by mild knockdown at a level of about 90%.
We further tested proteins with a negative correlation between
their protein level and motility and the results are summarized in
the supplementary information (see Supplementary File S4).
Discussion
In this study, we presented ‘noise genetics’ - an approach to
assign function to proteins that uses the natural noise in protein
level and localization and correlates it to the variation in
phenotype of the same individual cells. We demonstrated this
using the motility phenotype of cancer cells. Noise genetics
recovers 30 of the known motility genes in our clone library and
also 43 novel motility candidates, of which 10 were validated by
siRNA knockdown (Figure 4).
Noise genetics can complement standard genetic perturbations.
Among its advantages are the non-invasive and mild nature of the
natural variations used, which keep the cell near its normal
working point. Proteins whose knockdown is lethal are hard to
evaluate using standard genetics, but can potentially be picked up
by the assay. Similarly, proteins whose knockdown effects are
masked by compensation from other proteins in the same module
may be picked up by noise genetics, because one expects the entire
module to show correlated noise [7,8]. Noise genetics compares
individual cells from the same field of view, and therefore contains
a type of internal control for systematic errors. In standard
perturbation assays, one needs to compare perturbed cell
populations to a separate experiment with unperturbed cell
populations in order to control for experimental systematic errors.
Among the limitations of noise genetics as implemented here are
the need for a fluorescent cell library or other means of observing
cell-cell variation in both protein and phenotype. Such libraries
exist, for example, in S. cerevisae [27], E. coli [28,29], C. elegans [30]
and Zebrafish [31]. If the phenotype of interest can be observed in
fixed cells, individual cell imaging of proteins [32] or mRNA [33–
35] might be used for noise genetics. Such an approach has been
used with pre-selected genes, for example, to explore the effect of
protein variability on stem-cell differentiation [36], sporulation
timing in Bacillus subtilis [37] and meiosis timing in Saccharo-
myces cerevisiae [38]. We currently tested only linear correlation;
more elaborate time-series analysis methods or non-linear
correlation analysis may be able to improve the resolution of this
approach [39].
The cells in this study are diploid (or multiploid), but only one
copy of each gene was labeled with YFP. Therefore, the
fluorescence measurement does not necessarily reflect the total
protein level or distribution. Previous work with the present cell
system showed that there is high correlation in the expression of
two alleles of the same ribosomal gene [7]. Future work is needed
to test the present approach with all alleles tagged.
Noise genetics can miss proteins whose effect on phenotype is
small in the working point of the cell. Such proteins can be picked
up by standard genetics which makes large perturbations.
Similarly, if natural variations in proteins or phenotypes are very
small, noise genetics may not be applicable. Importantly, noise
genetics on its own can only detect correlations, and additional
experiments such as the mild knockdown performed here, are
needed to gain evidence for causality.
Noise genetics uses natural cell-cell variation in proteins to
discover links with phenotypes. Additional phenotypes that can be
readily studied include cell size and shape, and any other
phenotype measurable by time-lapse microscopy.
Methods
Time-lapse microscopy moviesMovies from previous studies [18,20] were used for this analysis,
as well as new movies on 19 clones. In the previous studies, 4
movies (fields of view) were taken for each of the 1,000 clones
totaling about 4,000 movies. In each movie, 10–20 cells were
tracked over 24 hours at least, every 20 minutes. Some of these
clones were filmed more than once and some clones represent the
same protein. For the present analysis, we combined all data for
the same protein from all relevant movies. Each time point
included transmitted light image (phase contrast) and two
fluorescent channels (red and yellow). Of the original movie sets,
we chose 566 unique protein clones as described in the text. The
566 known proteins that were used in our analysis tend to have
high expression levels (so that they are picked up in the LARC
library construction which used FACS to select for fluorescent
clones).
Image analysis of time-lapse moviesWe used the image analysis software described in [18] with
minor modifications. The main steps in this software include
background correction (flat field and background subtraction),
segmentation, cell tracking, and automated identification of cell
Figure 3. Candidate motility genes recover many of the known motility proteins in the screen. (a) Examples of known motility genesfound in the present assay, with their correlation coefficient. (b) New candidate motility genes found in the assay. (c) Known motility genes includedin the screen but not found in the assay. Note that three of the genes have marginal R values. (d) Sub-cellular localization of candidate motility genesis enriched for cytoskeleton, Golgi/ER and plasma membrane, similar to all known motility genes (gene-cards).doi:10.1371/journal.pgen.1004176.g003
Noise Genetics
PLOS Genetics | www.plosgenetics.org 6 March 2014 | Volume 10 | Issue 3 | e1004176

Figure 4. Novel motility genes are validated by mild knockdown experiments. (a) We used anti-YFP siRNA to produce knockdown of thetagged gene in each clone, and tested protein level and motility in 48 time-lapse movies. (b) Examples of known and novel candidate motility genesafter knockdown, as well as control genes, that are not known to be involved in the motility process. On the left, the effect of the knockdown on theexpression of the protein is shown. In all knockdown experiments, protein fluorescence level was reduced at least by half. On the right, the effect ofthe knockdown of the gene on cell speed is shown. In the examples shown, candidate motility genes showed a reduction in velocity after knockdowncompared to mock treatment, whereas control genes showed no significant reduction in motility. (c) Velocity reduction in knockdown experimentscompared to mock treatment shows that 10/11 candidate genes showed a motility defect upon knockdown (blue bars), in contrast to control genesnot known to be involved in motility, for which 3 out of 4 showed no significant defect (red bars). Stars denote known motility genes also found inour assay. Error bars stands for standard deviations (SD).doi:10.1371/journal.pgen.1004176.g004
Noise Genetics
PLOS Genetics | www.plosgenetics.org 7 March 2014 | Volume 10 | Issue 3 | e1004176

phenotypes (mitosis and cell death). Cell and nuclei segmentation
was based on the red fluorescent images of the two red tagged
proteins found in all clones, localized to the cytoplasm (DAP1) and
nucleus (XRCC5), with intensity which is very uniform across cells
and clones. Segmentation used global image threshold and seeded
watershed segmentation. The cell-tracking procedure maps each
cell to the appropriate cells in the preceding and following frames
as described [40]. Texture parameters (contrast and correlation) of
the proteins were measured for each cell in each time point based
on the YFP image of the tagged protein as described below.
In our previous studies with the same movies, we also analyzed
the protein concentration by taking the average or median
fluorescent intensity inside the cell, as opposed to the total
intensity. We find this measure to be more sensitive to image
outlier pixels - even when using the median pixel intensity [23]; we
therefore use total fluorescent intensity in the present study.
Texture and contrast calculationTo calculate texture and contrast, we first evaluated a gray-level
(fluorescence intensity) co-occurrence matrix (GLCM) from each
fluorescent image of the cells [41]. Each element (i, j) in GCLM
specifies the number of times that the pixel with gray-level i
occurred horizontally adjacent to a pixel with gray-level j.
From the matrix one can compute the various texture features.
For example, contrast isP
i,j i{jj j2p(i,j) giving a value of 0 for a
constant intensity image and high values when adjacent pixels
have different intensity. Our second measure, ‘texture’ or
‘correlation texture’ isP
i,j(i{mi)(j{mj)p(i,j)
sisj. The correlation texture
measures the linear dependency of grey levels on those of
neighboring pixels. The two measures are weakly anti-correlated
(Fig. 2C). We verified that the texture and contrast values that
were calculated after removing the background and after rescaling
to 64 gray levels have a low sensitivity to rotations (Figure S5).
Correlation analysisFor each protein, we collected all cells in all fields of view at all
time frames. For each cell, 3 protein parameters (total protein,
contrast and texture) and 2 motion parameters (velocity and angle
change) (See Figure 2A) were calculated. Then, 6 correlation
values (between all pairs) were calculated using Pearson and
Spearman correlation. No binning was used to compute these
correlations. The correlation values are summarized in Supple-
mentary File S1. We tested other texture features as well
(homogeneity and energy), but these did do not add known genes
to the list of candidates (data not shown). Next, we collected only
cells that were tracked from the beginning of the movie until its
end and repeated the same calculation.
In order to establish a threshold that minimizes the false positive
rate, we generated permuted datasets. In each permuted dataset,
for each of the protein parameter and for each of the motion
parameter, the protein values from one cell time trace were
correlated to the motion values in another cell time trace in the
same field of view. We repeated this permutation 10 times for each
of the 6 comparisons (and both for Pearson and Spearman
calculations) and generated 6 correlation distributions, for all
proteins. These correlation values are summarized in the
Supplementary File S3. We chose to use both Spearman and
Pearson correlations since using only Spearman correlation results
in marginally higher false positives (Data not shown). A correlation
value of R = 0.15 (or similar) was chosen in order to minimized
false positives, while maximizing potential true candidates (See
Figure S7). We further tested for all the proteins with significant
correlation values in which the correlation still holds even when
calculating it only in one field of view (FOV) for most of its FOVs.
The final candidate list includes only proteins that passed this test.
The shape of the cell is known to affect its motility [10]; in order
to estimate this effect in our dataset, we calculated the correlations
between the aspect ratio (major axis/minor axis) of each cell and
the cell velocity and found no significant correlation in the
examined clones (Figure S9).
Validation analysisWe conducted new experiments by performing time-lapse
movies for 19 of the candidate clones. Of the 19, 13 proteins were
chosen randomly out of the list of novel candidate proteins, and
the other were candidates that were also known motility genes. 16
out of the 19 showed a correlation that is similar to the previous
calculated correlation. (Results are shown in Supplementary File
S3).
Function analysisSeveral databases were used to annotate whether genes are
known to be involved in motility (Supplementary File S2). We used
GeneCards (http://www.genecards.org/) to download all genes
with the keywords ‘‘motility’’ or ‘‘migration’’. We further
considered genes that were identified as part of the ‘‘adhesome’’
(http://www.adhesome.org/). Finally, well-studied characterized
genes listed in the Review by [12] were also considered as motility
genes.
Subcellular localization assignment and enrichment testWe used subcellular localization according to GeneCards
(http://www.genecards.org/) and other databases as provided in
the LARC database (http://www.weizmann.ac.il/mcb/UriAlon/
DynamProt/). All clones used here have localization in the
experiment that agrees with the previously known localization.
When more than one localization was assigned to a protein, the
first localization in the list was used for the category assignment.
The subcellular information and categories are list in the
‘‘Candidate_genes.xls’’ file. Hypergeometric p-value [42] was
used to calculate the enrichment of specific subcellular localization
categories in the candidate genes group over all the 566 genes used
in this analysis.
Mild knockdown experimentsTo knockdown the expression of the tagged protein in clones
from our library, we used siRNA against GFP (QIAGEN,
1022064) transfection using lipofectamin (Invitrogen) as described
in their protocol. As a control siRNA, we used the non-targeting
siRNA (Dharmacon, D-001810-10-05). No significant difference
between siRNA used from QIAGEN or Dharmacon was detected
in our system (Figure S10).
Briefly, 26104 cells were grown on 12-well glass bottom
MatTek plates. The next day, siRNA transfection was performed.
We used 24 pmol of si-RNA for each well and 0.8 ul lipofectamin
and incubated it for 6 hours, then we replaced with fresh media
and let cells grow overnight. The next day, we took a time-lapse
movie of the plate for 48 hours. We took fields of view from each
well. We used the same exposure time for the well with the non-
targeting siRNA (where no decrease in expression is expected) and
the well with the si-GFP (which showed a decrease in the YFP
fluorescent and not in the mCherry fluorescent).
Supporting Information
Figure S1 Cell individuality. (A) Protein level dynamics in
individual cells (NOL7 and ARPC3 clones) are shown. Note that if
Noise Genetics
PLOS Genetics | www.plosgenetics.org 8 March 2014 | Volume 10 | Issue 3 | e1004176

a cell has higher than average or lower than average level of a
protein, it remains so for about a cell generation or more. (B)
Contrast level of individual cells are shown in the ARPC3 clone.
Again, though contrast level varies along time, cells have
correlation times of about a cell cycle. (C) Autocorrelation
function for 2 single cell trajectories of the NOL7 protein to
illustrate cell individuality.
(PDF)
Figure S2 Correlation between velocity and angle change. The
velocity and angle change is shown for thousands of cells. Note
that a general anti-correlation is evident.
(PDF)
Figure S3 Images of individual cells. Images of individual cells
from different clones are shown along with their contrast value (on
the left) and their velocity (mM/20 minutes). The white point
represents the location of the cell in the previous frame, the light
blue point represents the cell location in the current frame and the
blue point represents the location in the next frame.
(PDF)
Figure S4 Different individual cells of the ARPC3 clone in one field
of view. Four different cells from the ARPC3 clone are shown along
with information about their contrast values and their different
trajectory along 13 consecutive frames (frames taken every 20 minutes).
(PDF)
Figure S5 Texture features calculations of images. (A) Cell
images from the ARPC3 clone are shown along with their contrast
and texture correlation values, calculated without rotation and
after averaging the contrast and texture correlation values (after 4
rotations). The contrast is plotted against the velocity for the
ARPC3 clone when calculating the contrast without rotation (C)
and after averaging the contrast values after 4 rotations (D) A high
correlation (R = 0.99) is evident between the contrast values
without rotation and the average contrast values after rotation. (E)
A high correlation (R = 0.97) is evident between the texture
correlation values without rotation and the average texture
correlation values after rotation. Similar results were obtained
for the different clones.
(PDF)
Figure S6 Correlation coefficients R between protein and
motility features. Similar to Figure C2, a correlation coefficients
matrix between the 3 protein parameters and the two motility
features is shown. On the right, a group of proteins with high
absolute correlation is shown. Blue/red denotes low/high R
values.
(PDF)
Figure S7 Comparisons between the real and permuted
correlation values. The correlation values calculated from the real
dataset are in dark grey, while the correlation values calculated
from 10 permuted datasets are in light grey. This analysis helped
us to choose a threshold that would minimize the number of hits in
the permuted dataset compared to the number of hits in the real
dataset. The chosen threshold for each comparison is written on
the right of the plot.
(PDF)
Figure S8 Knockdown experiments specifically decrease the
expression of the YFP tagged protein and not the mCherry tagged
protein. A typical field of view of the ARPC3 clone is shown after
si-GFP experiment and after the control experiment (with non-
targeting si). The parental clone has 2 proteins tagged with
mCherry to help with the segmentation of the nucleus and the
cytoplasm. No decrease in mCherry expression is evident.
However, the ARPC3 is tagged with YFP and a significant
reduction is shown in the YFP expression. On the bottom, a
quantification of 4 different FOVs of the ARPC3 clone
demonstrates similar results. Similar results were obtained for all
the examined clones.
(PDF)
Figure S9 Aspect ratio does not correlate with velocity in our
system. The aspect ratio of single cells, a measure that describes
cell shape, was plotted against the velocity of cells in the same
clones as in figure 2F, E. No significant correlation is evident for
any of these clones.
(PDF)
Figure S10 Control knockdown experiments. GAPDH clone
was used as a negative control since it is not a candidate motility
gene. siRNA against GAPDH (Dharmacon) was used, as well as
siRNA against GFP (QIAGEN) that should target any gene in our
library that is tagged with YFP and also non-targeting siRNA
(Dharmacon) that is not targeted against any specific gene and is
widely used as a negative control. As expected, no significant
change in the velocity was observed between these 3 conditions.
Therefore, in all our following experiment, we used the siGFP that
is expected to lower the expression of the target gene and the non-
targeting siRNA that serves as a negative control for the siRNA
experiment.
(PDF)
Figure S11 Negative correlation between protein and motility.
Knockdown experiments were carried out for 4 genes that showed
a negative correlation between protein level and motility. Analysis
was done as described in Figure 4C. Velocity reduction in
knockdown experiments compared to mock treatment shows that
4/4 candidate genes showed a motility defect upon knockdown
(blue bars), in contrast to control genes not known to be involved
in motility, for which 3 out of 4 showed no significant defect (red
bars). Stars denote known motility genes also found in our assay.
Error bars stands for standard deviations (SD).
(PDF)
File S1 Correlation values. Pearson and Spearman correlations
values are shown for all the genes in our dataset for all six
comparisons.
(XLSX)
File S2 Candidate motility genes. 74 candidate motility genes
are shown along with their correlation values (both Spearman and
Pearson), correlation values after binning, gene description,
subcellular localization, etc.
(XLSX)
File S3 Tacked cells and permuted values. Pearson and
Spearman correlations values are shown for all the genes in our
dataset only for cells that were tracked along all frames for all six
comparisons. Correlation values after the permutation are also
shown. The results of the validation analysis of the 19 genes are
shown as well.
(XLSX)
File S4 Negative correlation between protein and motility. A
short discussion on genes in our analysis that presented a negative
correlation with motility.
(DOCX)
Acknowledgments
We thank all members of our lab and Eytan Domany, Zvi Kam, Benny
Geiger, Steve Altschuler for discussions.
Noise Genetics
PLOS Genetics | www.plosgenetics.org 9 March 2014 | Volume 10 | Issue 3 | e1004176

Author Contributions
Conceived and designed the experiments: SFA UA. Performed the
experiments: SFA TD. Analyzed the data: SFA. Contributed reagents/
materials/analysis tools: AZ TD NGZ AS RM LC AC EE. Wrote the
paper: SFA UA.
References
1. Eldar A, Elowitz MB (2010) Functional roles for noise in genetic circuits. Nature
467: 167–173.2. Lestas I, Vinnicombe G, Paulsson J (2010) Fundamental limits on the
suppression of molecular fluctuations. Nature 467: 174–178.3. Raser JM, O’Shea EK (2005) Noise in Gene Expression: Origins, Consequences,
and Control. Science 309: 2010–2013.
4. Zeng L, Skinner SO, Zong C, Sippy J, Feiss M, et al. (2010) Decision making at asubcellular level determines the outcome of bacteriophage infection. Cell 141: 682–691.
5. Raj A, Rifkin SA, Andersen E, Oudenaarden A van (2010) Variability in geneexpression underlies incomplete penetrance. Nature 463: 913–918.
6. Blake WJ, KAErn M, Cantor CR, Collins JJ (2003) Noise in eukaryotic gene
expression. Nature 422: 633–637.7. Sigal A, Milo R, Cohen A, Geva-Zatorsky N, Klein Y, et al. (2006) Variability
and memory of protein levels in human cells. Nature 444: 643–646.8. Stewart-Ornstein J, Weissman JS, El-Samad H (2012) Cellular noise regulons
underlie fluctuations in Saccharomyces cerevisiae. Mol Cell 45: 483–493..9. Spudich JL, Koshland DE Jr (1976) Non-genetic individuality: chance in the
single cell. Nature 262: 467–471.
10. Keren K, Pincus Z, Allen GM, Barnhart EL, Marriott G, et al. (2008)Mechanism of shape determination in motile cells. Nature 453: 475–480.
11. Dunlop MJ, Cox RS 3rd, Levine JH, Murray RM, Elowitz MB (2008)Regulatory activity revealed by dynamic correlations in gene expression noise.
Nat Genet 40: 1493–1498.
12. Ridley AJ (2011) Life at the leading edge. Cell 145: 1012–1022.13. Weinberg RA (2007) The biology of cancer. New York: Garland Science.
14. Winograd-Katz SE, Itzkovitz S, Kam Z, Geiger B (2009) Multiparametricanalysis of focal adhesion formation by RNAi-mediated gene knockdown. J Cell
Biol 186: 423–436.
15. Simpson KJ, Selfors LM, Bui J, Reynolds A, Leake D, et al. (2008) Identificationof genes that regulate epithelial cell migration using an siRNA screening
approach. Nat Cell Biol 10: 1027–1038.16. Neumann B, Walter T, Heriche J-K, Bulkescher J, Erfle H, et al. (2010)
Phenotypic profiling of the human genome by time-lapse microscopy reveals celldivision genes. Nature 464: 721–727..
17. Danuser G, Waterman-Storer CM (2006) Quantitative fluorescent speckle
microscopy of cytoskeleton dynamics. Annu Rev Biophys Biomol Struct 35: 361–387.18. Cohen AA, Geva-Zatorsky N, Eden E, Frenkel-Morgenstern M, Issaeva I, et al.
(2008) Dynamic proteomics of individual cancer cells in response to a drug.Science 322: 1511–1516.
19. Sigal A, Danon T, Cohen A, Milo R, Geva-Zatorsky N, et al. (2007) Generation
of a fluorescently labeled endogenous protein library in living human cells. NatProtoc 2: 1515–1527.
20. Eden E, Geva-Zatorsky N, Issaeva I, Cohen A, Dekel E, et al. (2011) Proteomehalf-life dynamics in living human cells. Science 331: 764–768.
21. Chebira A, Barbotin Y, Jackson C, Merryman T, Srinivasa G, et al. (2007) Amultiresolution approach to automated classification of protein subcellular
location images. BMC Bioinformatics 8: 210.
22. Boland MV, Murphy RF (2001) A neural network classifier capable ofrecognizing the patterns of all major subcellular structures in fluorescence
microscope images of HeLa cells. Bioinformatics 17: 1213–1223.23. Farkash-Amar S, Eden E, Cohen A, Geva-Zatorsky N, Cohen L, et al. (2012)
Dynamic Proteomics of Human Protein Level and Localization across the Cell
Cycle. PLoS ONE 7: e48722.
24. Welch MD, DePace AH, Verma S, Iwamatsu A, Mitchison TJ (1997) The
human Arp2/3 complex is composed of evolutionarily conserved subunits and islocalized to cellular regions of dynamic actin filament assembly. J Cell Biol 138:
375–384.
25. Han G, Fan B, Zhang Y, Zhou X, Wang Y, et al. (2008) Positive regulation of
migration and invasion by vasodilator-stimulated phosphoprotein via Rac1
pathway in human breast cancer cells. Oncol Rep 20: 929–939.
26. Suetsugu S, Miki H, Takenawa T (1999) Identification of two human WAVE/
SCAR homologues as general actin regulatory molecules which associate with
the Arp2/3 complex. Biochem Biophys Res Commun 260: 296–302.
27. Newman JRS, Ghaemmaghami S, Ihmels J, Breslow DK, Noble M, et al. (2006)
Single-cell proteomic analysis of S. cerevisiae reveals the architecture of
biological noise. Nature 441: 840–846.
28. Taniguchi Y, Choi PJ, Li G-W, Chen H, Babu M, et al. (2010) Quantifying E.
coli proteome and transcriptome with single-molecule sensitivity in single cells.
Science 329: 533–538.
29. Zaslaver A, Bren A, Ronen M, Itzkovitz S, Kikoin I, et al. (2006) A
comprehensive library of fluorescent transcriptional reporters for Escherichiacoli. Nat Methods 3: 623–628.
30. Sarov M, Murray JI, Schanze K, Pozniakovski A, Niu W, et al. (2012) A
genome-scale resource for in vivo tag-based protein function exploration in C.
elegans. Cell 150: 855–866.
31. Trinh LA, Hochgreb T, Graham M, Wu D, Ruf-Zamojski F, et al. (2011) A
versatile gene trap to visualize and interrogate the function of the vertebrate
proteome. Genes Dev 25: 2306–2320.
32. Chan EM, Ratanasirintrawoot S, Park I-H, Manos PD, Loh Y-H, et al. (2009)
Live cell imaging distinguishes bona fide human iPS cells from partially
reprogrammed cells. Nature Biotechnology 27: 1033–1037.
33. Trcek T, Chao JA, Larson DR, Park HY, Zenklusen D, et al. (2012) Single-
mRNA counting using fluorescent in situ hybridization in budding yeast. Nat
Protoc 7: 408–419.
34. Shav-Tal Y, Darzacq X, Shenoy SM, Fusco D, Janicki SM, et al. (2004)
Dynamics of single mRNPs in nuclei of living cells. Science 304: 1797–1800.
35. Itzkovitz S, Lyubimova A, Blat IC, Maynard M, van Es J, et al. (2012) Single-
molecule transcript counting of stem-cell markers in the mouse intestine. Nat
Cell Biol 14: 106–114.
36. Chang HH, Hemberg M, Barahona M, Ingber DE, Huang S (2008)
Transcriptome-wide noise controls lineage choice in mammalian progenitorcells. Nature 453: 544–547.
37. Eldar A, Chary VK, Xenopoulos P, Fontes ME, Loson OC, et al. (2009) Partial
penetrance facilitates developmental evolution in bacteria. Nature 460: 510–514.
38. Nachman I, Regev A, Ramanathan S (2007) Dissecting timing variability inyeast meiosis. Cell 131: 544–556.
39. Montana G, Berk M, Ebbels T (2011) Modelling short time series in
metabolomics: a functional data analysis approach. Adv Exp Med Biol 696:
307–315. doi:10.1007/978-1419-7046-6_31.
40. Geva-Zatorsky N, Issaeva I, Mayo A, Cohen A, Dekel E, et al. (2012) Using
bleach-chase to measure protein half-lives in living cells. Nat Protoc 7: 801–811.
41. Haralick RM (1979) Statistical and structural approaches to texture. Proceedings
of the IEEE67: 786–804.
42. Rivals I, Personnaz L, Taing L, Potier M-C (2007) Enrichment or depletion of aGO category within a class of genes: which test? Bioinformatics 23: 401–407.
Noise Genetics
PLOS Genetics | www.plosgenetics.org 10 March 2014 | Volume 10 | Issue 3 | e1004176