noise induced hearing loss and other hearing … · ing) as described by brand and hohmann (2002)...
TRANSCRIPT

Int Arch Occup Environ Health (2009) 82:153–164
DOI 10.1007/s00420-008-0317-1ORIGINAL ARTICLE
Noise induced hearing loss and other hearing complaints among musicians of symphony orchestras
E. J. M. Jansen · H. W. Helleman · W. A. Dreschler · J. A. P. M. de Laat
Received: 14 September 2007 / Accepted: 12 March 2008 / Published online: 11 April 2008© The Author(s) 2008
AbstractObjectives An investigation of the hearing status of musi-cians of professional symphony orchestras. Main questionsare: (1) Should musicians be treated as a special group withregard to hearing, noise, and noise related hearing problems(2) Do patterns of hearing damage diVer for diVerent instru-ment types (3) Do OAE have an added value in the diagno-sis of noise induced hearing loss (NIHL) in musicians.Methods 241 professional musicians, aged between 23–64participated. A brief medical history and the subjectivejudgment of their hearing and hearing problems wereassessed. Musicians were subjected to an extensive audio-logical test battery, which contained testing of audiometricthresholds, loudness perception, diplacusis, tinnitus, speechperception in noise, and otoacoustic emissions.Results Most musicians could be categorized as normalhearing, but their audiograms show notches at 6 kHz, a fre-quency that is associated with NIHL. Musicians often com-plained about tinnitus and hyperacusis, while diplacusiswas generally not reported as a problem. Tinnitus was mostoften localized utmost left and this could not be related tothe instrument. It was usually perceived in high frequencyareas, associated with NIHL. In general, musicians scoredvery well on the speech-in-noise test. The results of theloudness perception test were within normal limits. Otoa-coustic emissions were more intense with better pure-tonethresholds, but due to large individual diVerences it can stillnot be used as an objective test for early detection of NIHL.
Conclusions Musicians show more noise induced hearingloss than could be expected on the basis of age and gender.Other indicators, such as complaints and prevalence of tin-nitus, complaints about hyperacusis and prevalence of dip-lacusis suggest that musicians’ ears are at risk. Continuingeducation about the risks of intensive sound exposure tomusicians, with the emphasis on the possible developmentof tinnitus and hyperacusis and the need for good hearingprotection is warranted.
Keywords Noise induced hearing loss (NIHL) · Musicians · Tinnitus · Diplacusis · Hyperacusis · Otoacoustic emissions
Introduction
Noise induced hearing loss (NIHL) is caused by repeatedexposure to loud sounds over an extended period of time,exposure to very loud impulse sound(s), or a combinationof both. Individuals of all ages, including children, adoles-cents, young adults, and older people, can develop NIHL,while exposed to intense sounds in the workplace, in recre-ational settings, or at home. Among the working populationwho could be aVected by NIHL, members of professionalsymphony orchestras are a speciWc group for two reasons:they are fully dependent on their hearing for their profes-sion, and they are frequently exposed to loud music.Besides, they have a complicated relation to preventivemeasures, such as wearing ear muVs or using protectivescreens, as they may be accompanied by the loss of subtleeVects that are necessary to play music and interact withfellow musicians.
In a 1-year noise survey during rehearsals and perfor-mances of the Dutch Ballet Orchestra, Boasson (2002)
E. J. M. Jansen (&) · H. W. Helleman · W. A. Dreschler · J. A. P. M. de LaatENT-Audiology, Academic Medical Center Amsterdam, Meibergdreef 9, Amsterdam 1105 AZ, Netherlandse-mail: [email protected]
123

154 Int Arch Occup Environ Health (2009) 82:153–164
found integrated average sound pressure levels that exceedthe European guidelines for exposure to sound in a profes-sional environment (a maximum exposure of 80 dB (A) for8 h per day). Boasson also identiWed four factors that playan important role in the sound pressure levels in orchestrapits: the physical conditions of the orchestra pit, the orches-tra arrangement, the repertoire, and the playing time. Formany professional orchestras, the acoustical circumstancesduring practicing or performing are far from optimal withrespect to avoiding, or at least minimizing the risks forhearing damage.
NIHL is usually diagnosed by means of the pure-toneaudiogram (PTA), the gold standard for identifying hearingthreshold levels of individuals, enabling determination ofthe degree, type, and conWguration of a hearing loss. Typi-cal patterns in the hearing thresholds (i.e. a noise notch at 3,4, and/or 6 kHz combined with relatively normal thresholdsat 8 kHz) provide a strong indication for NIHL. Kähäriet al. (2001a, b) showed that the degree of hearing impair-ment as expressed in the PTA in musicians is smaller thancould be expected on the basis of their daily exposure. Anextensive review of literature and data of the VancouverSymphony orchestra concluded that at least some noise-induced hearing impairment among musicians can beshown from the PTA (Eaton and Gillis 2002). Yet otherstudies report musicians’ hearing threshold levels that donot signiWcantly diVer from those of non-exposed popula-tions (e.g. Obeling and Poulsen 1999; Johnson et al. 1985).
The discrepancy between the high number of musiciansthat report problems with their hearing and their relativelygood pure-tone thresholds could partly be explained byselection bias by withdrawal: musicians with hearing prob-lems could have some reservation to participate in suchstudies. On the other hand, the assessment of musicians’hearing by means of the PTA could lead to very diVerentresults than that of, for instance, workers in the buildingindustry. With their well-trained ears and developed sensi-tivity to sound and music in general (Seither-Preisler et al.2007), musicians could simply be better in detecting puretones than other populations.
The measurement of otoacoustic emissions (OAEs) hasbeen proposed to be a more objective and more sensitive testfor assessing the eVects of noise exposure than the PTA.OAEs are sounds produced by the healthy ear, by the outerhair cells (OHCs) in the cochlea. The absence of OAEs isassociated with poorly functioning outer hair cells resultingin reduced selectivity and a decreased sensitivity (e.g. Avanand BonWls 1993; Gorga et al. 2005; Martin et al. 1990).Lapsley-Miller et al. (2004) found decreased average OAEamplitudes after 6 months of noise exposure, while the aver-age audiometric thresholds did not (yet) change. She foundno signiWcant correlations between changes in audiometricthresholds and changes in OAEs, which is suggestive for the
hypothesis that OAEs indicate noise-induced changes in theinner ear, still undetected by pure-tone audiometry. WhenconWrmed by further experimental evidence, the measure-ment of OAEs could be an attractive method to assess NIHLin musicians in an early stage.
Diagnosis of NIHL has often been limited to the measure-ment of hearing thresholds, while musicians speciWcallyreport other sound related hearing problems. Tinnitus (i.e.the perception of noise in the ears or head when no externalsound is present), hyperacusis (i.e. an increased sensitivity toloud sounds), distortion (i.e. pure tones are not perceived aspure), and binaural diplacusis (i.e. the pitch of a single toneis perceived diVerently by the two ears) are among the mostoften mentioned complaints. Kähäri et al. (2001a, b) alreadysuggested that the way these hearing disorders aVect musi-cians should be investigated further. As these complaintsinXuence a musician’s ability to work to full capacity, theyshould be acknowledged as an important part of a musi-cians’ audiological status and prevention program.
Research questions
The Wrst question is whether musicians of symphonyorchestras should be treated as a special group with regardto hearing, noise, and noise related hearing problems, andwhether the instrument type is responsible for diVerent pat-terns of hearing damage.
Second, the pure-tone audiogram reXects only oneaspect of the hearing status of this particular group. Thecurrent study aims to obtain reliable, objective data onother expressions of noise related hearing problems: hyper-acusis, diplacusis, tinnitus, and decreased performance onspeech-in-noise tasks.
The third important issue is the added value of OAEmeasurements, which are suggested to be more sensitive,more speciWc, and even more predictive in measuringNIHL. Therefore, we like to assess the relations betweenmeasurements of hearing acuity (i.e. PTA, OAE) and self-reports on noise-induced hearing problems.
Methods
Participants
A total number of 245 musicians (490 ears) of Wve sym-phony orchestras participated in this study on a voluntarybasis. Four of them were excluded from the analysisbecause the severe hearing losses reported in these earscould be attributed to aetiologies other than NIHL. One wasremoved because of retrocochlear pathology, one due toMenière’s disease and two because of asymmetry, notrelated to noise exposure.
123

Int Arch Occup Environ Health (2009) 82:153–164 155
In total 241 musicians (482 ears) were included in theanalyses, 113 females and 128 males between 23 and64 years of age. In 12 participants not all the tests were per-formed due to lack of time or because of technical problemsin the equipment. The instruments played by the musicianswere classiWed into six groups: high strings (HS): violinand viola; low strings (LS): cello and double bass; woodwind (WW): oboe, clarinet, bassoon, Xute; brass wind(BW): trumpet, trombone, horn; percussion (PC) and other(OT): harp, piano, conductor. The distributions of gender,age and instruments are shown in Table 1.
For most participants (i.e. 211, 87%) it was more than8 h ago since they were exposed to music. Some were morerecently exposed to noise (7 less than 1 h; 8 between 1 and2 h; 11 between 2 and 4 h; 4 between 4 and 8 h). Motorcy-cle drivers were requested to wear hearing protection dur-ing driving and be present at the lab at least half an hourbefore the tests would start. We decided to include all theseparticipants into the analysis.
Audiological tests
Participants were subjected to an extended audiological testbattery containing tests on audiometric thresholds, loudnessperception, diplacusis, tinnitus, speech perception in noise,and otoacoustic emissions. The tests were performed at theENT-/audiological department of the Academic MedicalCentre. Before testing the otoacoustic emissions, the partici-pant had otoscopic inspection in order to check for cerumen.If present, the cerumen was removed by an ENT-doctor.
Audiometric thresholds (PTA)
Pure-tone air-conduction thresholds at 0.25, 0.5, 1, 2, 3, 4,6, and 8 kHz were measured using an Interacoustics AC40audiometer with TDH39 headphones. The audiometer wascalibrated according to ISO 389 (1991). Pure-tone measure-ments were all performed in a sound–isolated booth. Bone-conduction thresholds were measured at 0.5, 1 and 2 kHzwhen air-conduction thresholds exceeded 20 dB. All audio-
metric thresholds were assessed with adequate masking andwere expressed in dB HL, according to standards of diag-nostic audiometry.
Loudness perception
We used an adaptive procedure for categorical loudnessscaling ACALOS (Adaptive, Categorical Loudness Scal-ing) as described by Brand and Hohmann (2002) for threediVerent stimuli: octave-band noises with 0.75 and 3 kHz asthe centre frequency, and a wide band noise with a speech-shaped spectrum. Each stimulus was presented for1,000 ms in a free-Weld condition. The participant wasseated at 1 m from the speaker producing the noise. Forsafety purposes, the maximum output was limited to105 dB (SPL), according to the JBL control1X speciWca-tions. Based on the participant’s judgment of the loudnessof the test sound for various intensities, an individual loud-ness curve was Wtted. Thus, the dynamic range and theincrease of loudness within this dynamic range can beassessed in a single measurement.
Diplacusis
An adaptive procedure was used to compare the pitch oftonal signals presented alternating to the right and left earby headphones on three diVerent frequencies: 1, 2 and4 kHz. First, participants had to match the loudness of thetone in the left ear to the tone in the right ear, presented at60 dB HL. Then, the musician was asked to match the pitchof the tone in the left ear to that of the right ear. Adjustmenton the basis of the participants’ feedback on both loudnessand pitch was done by the test leader, changing the presen-tation level or the frequency of the tone presented to the leftear in steps of 1 dB or 1 Hz, respectively.
Tinnitus
When participants suVered from tinnitus at the time of test-ing, a tinnitus matching procedure was conducted. First, thetinnitus was localized (i.e. utmost left, left, middle, right orutmost right). In case of clear lateralization, the matchingsound was presented to the contralateral ear. When it waslocalized in the middle, the matching sound was presentedto the audiometrically better ear. Then the test leader triedto match the nature of the tinnitus: its character (i.e. puretone, noise, warble, etc.), pitch, and loudness according tothe participant’s feedback.
Speech reception in noise (SRT)
For speech-in-noise testing, we applied a stand-alone ver-sion of the telephone test (Smits et al. 2004), installed on a
Table 1 Distribution of gender and age per instrument category
Instrument category
Average age (SD)
Gender Total
Female Male
HS 44 (10.6) 64 36 100 (41%)
LS 48.3 (9.4) 16 25 41 (17%)
WW 42.7 (10.6) 25 25 50 (21%)
BW 43.5 (9.9) 6 29 35 (15%)
PC 43.5 (8.9) 0 13 13 (5%)
OT 41 (9.9) 1 1 2 (0.08%)
Total 44.4 (10.2) 112 (47%) 129 (53%) 241
123

156 Int Arch Occup Environ Health (2009) 82:153–164
laptop computer. The SRT test uses an adaptive procedure,a simple one-up one-down procedure with a step size of2 dB. Participants responded to each set of three spokendigits (triplets) using the laptop digit-keys. The responsewas judged to be correct when all three digits were correct.For each SRT measurement a series of 23 triplets is chosenrandomly out of 80 triplets: the SRT was then calculated byaveraging the signal-to-noise ratios of the last 20 presenta-tion levels (i.e. the last presentation level is based on thelast response).
Otoacoustic emissions (OAEs)
Both transient evoked otoacoustic emissions (TEOAE) anddistortion product otoacoustic emissions (DPOAE) weremeasured on both ears of each musician using OtodynamicsILO 292 equipment. Each test day the probe was calibratedbefore OAE-measurement.
TEOAE’s were evoked using a 80 dBpeSPL click stimu-lus. They were measured in the non-linear mode andWltered in half-octave frequency bands at 1, 1.5, 2, 3 and4 kHz.
DPOAE were evoked using pairs of tones f1 and f2 withparticular intensity and frequency relations (f1:f2 ratio). Theevoked response from these stimuli occurs at a third fre-quency, the distortion product frequency fdp, which is cal-culated as fdp = 2 £ f1¡f2. The DPOAEs levels of theprimary tones, L1 and L2, were 75 and 70 dB SPL, respec-tively. The frequency ratio of f2/f1 was 1.22. DPOAEs weremeasured at the frequency 2f1¡f2 for 27 f2 frequenciesranging from 815 to 8,000 Hz (i.e. 8 points per octave). Theemission level was established on the basis of three presen-tations. In case of high noise Xoors, the measurement wasrepeated manually at particular frequencies, usually below2 kHz.
Questionnaire
All participants completed a self-report questionnaire thatconsisted of the relevant questions related to ear and hear-ing problems in the medical history, questions about behav-iour towards loud music and noise, questions aboutpersonal hearing complaints, the use of hearing protection,and subjective judgments of own hearing capacity.
Statistical analyses
All statistical analyses were performed using SPSS 12.01.Part of the data has been obtained per ear (i.e. pure-tone
thresholds, OAE-responses). In that case, some detailedanalyses were performed per ear. However, the majority ofresults were considered per participant. When these data
were compared to data obtained per ear, average scoresover the ears were used.
Audiogram data usually have a skewed (i.e. positivelyslanting) distribution as hearing thresholds increase ratherthan decrease. We assumed that our tested sample was largeenough to approach a normal distribution, so we could useparametric tests for the audiometric data (Dawson-Saun-ders and Trapp 1994).
Data which were obtained per ear (i.e. audiometric-, andOAE-data) on various frequencies were tested using a gen-eral linear model (GLM) Repeated measures ANOVA.DiVerences on separate audiometric frequencies weretested with a MANOVA over ears.
Data that were obtained on individuals (i.e. data onloudness perception, and speech-reception thresholds innoise), or in combination with the audiometric data wereanalysed using paired sample t tests, and bivariate correla-tions.
The signiWcance level used for all the tests and the corre-lations was p = 0.05 or smaller.
Data on frequencies (e.g. diplacusis, tinnitus, self-reportdata, etc.) were analysed using non-parametric tests(Kruskall–Wallis, Chi-square) with a similar signiWcancelevel (p < 0.05).
The focus is on the following results:
• The status of the hearing of musicians as compared to ageneral population.
• The speciWc subjective complaints of musicians in rela-tion to objectively measurable facts.
• The diVerences between musicians in the previouslydeWned instrument categories.
Whenever possible, we compared our data to that of knownpopulation numbers. In analyses over instrument catego-ries, percussion (PC) and other (OT) were not included asthe number of musicians in these categories did not exceed20. Where relevant, the results of the percussionists will bediscussed qualitatively.
Results
EVects in the pure-tone audiogram
A vast majority of the musicians (92%) reported healthyears. Forty-one (17%) indicated to have suVered from earinfections in childhood. Sixty-Wve (27%) ever visited anENT-doctor for complaints about their hearing. Eighty-nine(37%) indicated hearing problems in the family, mostlyrelated to presbyacusis. No association with ear infectionsin early childhood and the presence of hearing problems inthe family could be found in the data set.
123

Int Arch Occup Environ Health (2009) 82:153–164 157
NIHL is generally associated with a notch-shaped high-frequency sensorineural loss that is worst at 4 kHz, but thenotch often occurs at 3 or 6 kHz as well (e.g. Coles et al.2000). There have been several attempts to identify audio-metric notches according to objective criteria (Coles et al.2000; Rabinowitz et al. 2006; Niskar et al. 2001). In thesestudies, audiograms are usually divided in normal hearing,age related hearing loss, and noise induced hearing loss.Applying these criteria, most of the audiograms of ourmusicians would be identiWed as normal hearing, a few asNIHL and some as age related hearing loss. As we wouldlike to get more insight in the development of the musi-cians’ hearing (i.e. the noise notches) over time (in view ofa follow-up study) and the possibility to relate the audio-grams to otoacoustic emissions, we aimed at a moredetailed diVerentiation in noise notches. Therefore, we useda rather strict criterion for “normal hearing”, and more spe-ciWc criteria for the degree of the noise notch. The followingaudiogram categorization was applied to the audiometricthresholds per ear:
• Normal hearing (N): hearing threshold levels better thanor equal to 15dB HL at all measured frequencies (i.e. 0.5,1, 2, 3, 4, 6, 8 kHz).
• Notch moderate (NM): maximum threshold level of 3, 4,and 6 kHz between 15 and 20 dB poorer than the pure-tone average of thresholds at 0.5, 1 and 2 kHz and atleast 10 dB poorer than the threshold level at 8 kHz. Thisis similar to Niskar et al. (2001) criterion of a noise notchin adolescents.
• Notch profound (NP): similar to NM, but maximumthreshold level of 3, 4, 6 kHz at least 25 dB poorer thanthe pure-tone average of thresholds at 0.5, 1 and 2 kHz.
• Sloping loss (SL): maximum threshold level of 3, 4,6 kHz at least 5 dB poorer than the pure-tone average ofthresholds at 0.5, 1 and 2 kHz and threshold level at8 kHz at least 5 dB poorer than the maximum thresholdlevel at 3, 4, and 6 kHz.
• Flat loss (FL): audiograms which do not fall into theabove mentioned categories, with no hearing thresholdsexceeding 30dB at all measured frequencies.
• Rest (R): all audiograms that do not match the character-istics of the above described categories.
The corresponding average audiograms are shown in Fig. 1.The average audiogram in the group “Rest” turned out tohave a steeply sloping curve. Most ears fell in the “Normalhearing” category (230 ears, 48%). The other ears wereapproximately equally divided over the other categories(NM = 53 ears, 11%, NP = 41 ears, 9%, SL = 64 ears, 13%,FL = 57 ears, 12%, R = 35 ears, 7%). If present, notcheswere mostly found at 6 kHz.
In the “Normal hearing” category the average age of theears was lowest (39.7 years), while it was highest in the
“Sloping loss” category (52.2 years). For the category“Notch profound” (48.8 years) it was higher than for thecategory “Notch moderate” (45.1 years). A direct compari-son of the distribution of audiometric categories acrossinstruments groups could only be done with some caution,as there were large variations in the number of musicians inthe instrument subgroups. However, when considering onlythe large groups, HS, LS, WW and BW, 40–52% of each ofthese groups fell into the audiogram category “NormalHearing”. The percentages did not diVer signiWcantly(�2(3) = 2, p = 0.57). Hearing loss with sloping curves (SL)was found less among the brass wind players (2 ears, 3%)than in the other groups (HS = 28 ears, 14%, LS = 16 ears,20%, and WW = 13 ears, 13%, �2(3) = 11.9, p = 0.007).
In the other audiogram categories (NM, NP, and FL) nosigniWcant diVerences were found across large instrumentgroups (tested with �2, p > 0.05)
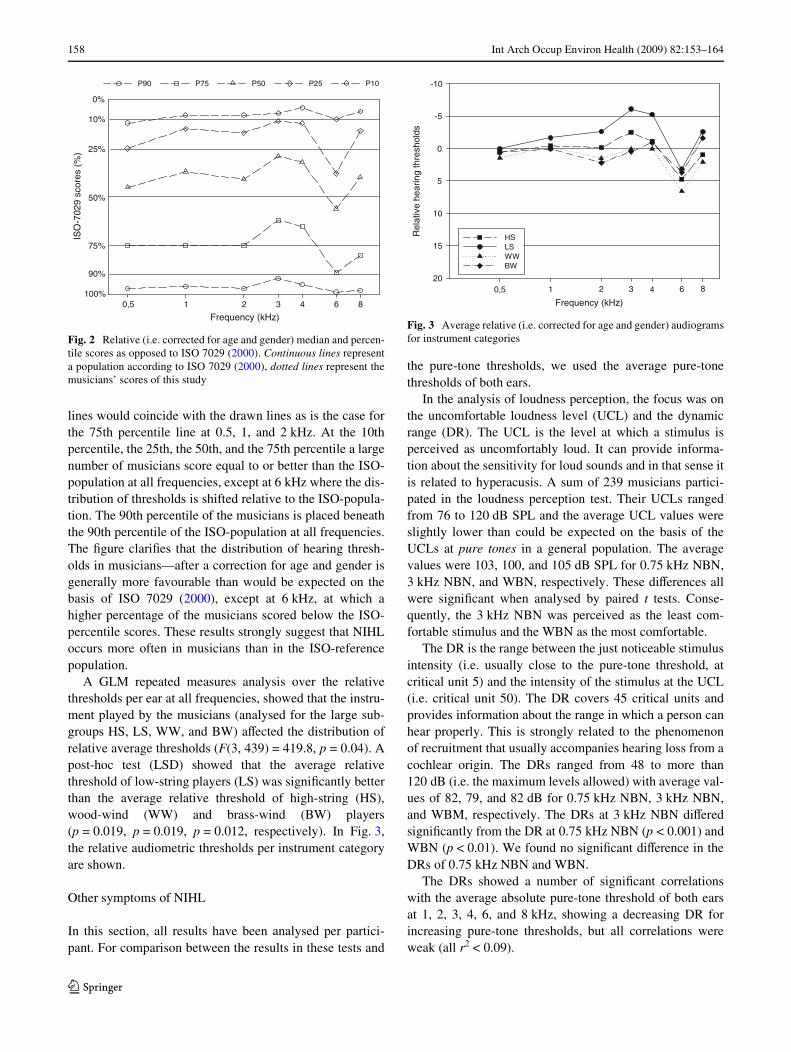
Absolute threshold levels, as used thus far, facilitate thecomparison of the PTA threshold levels with the results ofother audiological tests. Absolute pure-tone thresholds are,however, known to be strongly dependent on age and gen-der. Therefore, we also calculated relative thresholds, cor-rected for gender and age eVects according to ISO 7029(2000) standards. Relative thresholds were derived by sub-tracting the population median. Next the percentages ofears that were above the P90, P75, median, P25, and P10percentile points were generated. The results are presentedin Fig. 2.
In Fig. 2, the relative audiometric results of the musi-cians are presented by dotted lines, in which the symbolsrefer to the corresponding percentile values. The drawnlines correspond to the ISO-population percentile scores.When the musicians would have had a normal distributionof hearing levels according to age and gender, the dotted
Fig. 1 Musicians average audiograms according to the criteria fornormal hearing (N), notch moderate (NM), notch profound (NP), slop-ing loss (SL), Xat loss (FL), and a rest group (R)
Frequency (kHz)
Hea
ring
thre
shol
d (d
B H
L)
-10
0
10
20
30
40
50
60
NNMNP SL FLR
0,25 0,5 21 3 4 6 8
123
158 Int Arch Occup Environ Health (2009) 82:153–164
lines would coincide with the drawn lines as is the case forthe 75th percentile line at 0.5, 1, and 2 kHz. At the 10thpercentile, the 25th, the 50th, and the 75th percentile a largenumber of musicians score equal to or better than the ISO-population at all frequencies, except at 6 kHz where the dis-tribution of thresholds is shifted relative to the ISO-popula-tion. The 90th percentile of the musicians is placed beneaththe 90th percentile of the ISO-population at all frequencies.The Wgure clariWes that the distribution of hearing thresh-olds in musicians—after a correction for age and gender isgenerally more favourable than would be expected on thebasis of ISO 7029 (2000), except at 6 kHz, at which ahigher percentage of the musicians scored below the ISO-percentile scores. These results strongly suggest that NIHLoccurs more often in musicians than in the ISO-referencepopulation.
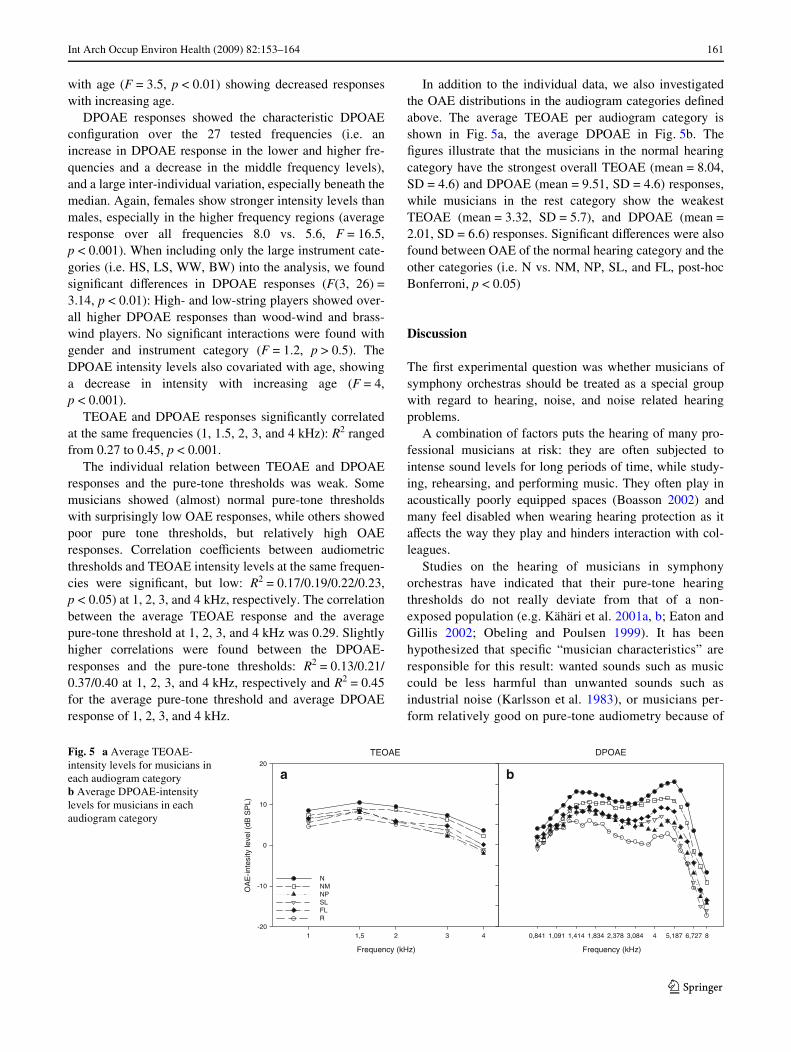
A GLM repeated measures analysis over the relativethresholds per ear at all frequencies, showed that the instru-ment played by the musicians (analysed for the large sub-groups HS, LS, WW, and BW) aVected the distribution ofrelative average thresholds (F(3, 439) = 419.8, p = 0.04). Apost-hoc test (LSD) showed that the average relativethreshold of low-string players (LS) was signiWcantly betterthan the average relative threshold of high-string (HS),wood-wind (WW) and brass-wind (BW) players(p = 0.019, p = 0.019, p = 0.012, respectively). In Fig. 3,the relative audiometric thresholds per instrument categoryare shown.
Other symptoms of NIHL
In this section, all results have been analysed per partici-pant. For comparison between the results in these tests and
the pure-tone thresholds, we used the average pure-tonethresholds of both ears.
In the analysis of loudness perception, the focus was onthe uncomfortable loudness level (UCL) and the dynamicrange (DR). The UCL is the level at which a stimulus isperceived as uncomfortably loud. It can provide informa-tion about the sensitivity for loud sounds and in that sense itis related to hyperacusis. A sum of 239 musicians partici-pated in the loudness perception test. Their UCLs rangedfrom 76 to 120 dB SPL and the average UCL values wereslightly lower than could be expected on the basis of theUCLs at pure tones in a general population. The averagevalues were 103, 100, and 105 dB SPL for 0.75 kHz NBN,3 kHz NBN, and WBN, respectively. These diVerences allwere signiWcant when analysed by paired t tests. Conse-quently, the 3 kHz NBN was perceived as the least com-fortable stimulus and the WBN as the most comfortable.
The DR is the range between the just noticeable stimulusintensity (i.e. usually close to the pure-tone threshold, atcritical unit 5) and the intensity of the stimulus at the UCL(i.e. critical unit 50). The DR covers 45 critical units andprovides information about the range in which a person canhear properly. This is strongly related to the phenomenonof recruitment that usually accompanies hearing loss from acochlear origin. The DRs ranged from 48 to more than120 dB (i.e. the maximum levels allowed) with average val-ues of 82, 79, and 82 dB for 0.75 kHz NBN, 3 kHz NBN,and WBM, respectively. The DRs at 3 kHz NBN diVeredsigniWcantly from the DR at 0.75 kHz NBN (p < 0.001) andWBN (p < 0.01). We found no signiWcant diVerence in theDRs of 0.75 kHz NBN and WBN.
The DRs showed a number of signiWcant correlationswith the average absolute pure-tone threshold of both earsat 1, 2, 3, 4, 6, and 8 kHz, showing a decreasing DR forincreasing pure-tone thresholds, but all correlations wereweak (all r2 < 0.09).
Fig. 2 Relative (i.e. corrected for age and gender) median and percen-tile scores as opposed to ISO 7029 (2000). Continuous lines representa population according to ISO 7029 (2000), dotted lines represent themusicians’ scores of this study
10%
25%
50%
75%
90%
Frequency (kHz)
ISO
-702
9 sc
ores
(%
)P90 P75 P50 P25 P10
100%
0%
0,5 21 3 4 6 8
Fig. 3 Average relative (i.e. corrected for age and gender) audiogramsfor instrument categories
Frequency (kHz)
Rel
ativ
e he
arin
g th
resh
olds
-10
-5
0
5
10
15
200,5 21 3 4 6 8
HSLS WW BW
123

Int Arch Occup Environ Health (2009) 82:153–164 159
In the results of the diplacusis matching the deviationbetween the ears is expressed as a percentage of the mea-sured frequency (e.g. when the pitch of a 1,000 Hz tonepresented to the right ear is matched to the pitch of a1,333 Hz tone presented to the left ear, the outcome mea-sure is 3.3%). Table 2 shows the numbers and percentagesof musicians with an interaural pitch diVerence of morethan 1, 2, or 3%, respectively, and the numbers and percent-ages of musicians per instrument category that show dipla-cusis to such degrees. For a total of 106 musicians (44%)the interaural pitch diVerence was more than 1%, for 43(18%) it was more than 2%, and for 20 (3%) more than 3%at one or more of the tested frequencies. Diplacusis moreoften occurs in the higher frequencies.
Although the prevalence of diplacusis seemed to behigher among WW and BW-players, no signiWcant diVer-ences in the degree of diplacusis at 1, 2, and 4 kHz werefound between instrument categories (�2 test, p > 0.05).There was no signiWcant age eVect.
A small but signiWcant correlation was found betweenthe asymmetry in the pure-tone audiogram and the per-ceived pitch diVerence at 4 kHz (r = 0.22, p = 0.001). Thepitch of the 4 kHz tone tended to be perceived lower in theear with the poorest threshold. Participants with an interau-ral diVerence of 1% or more at 1 and 2 kHz had signiW-cantly higher pure-tone thresholds [resp. F(1, 223) = 7.6,p = 0.006, F(1, 233) = 6.35, p = 0.012)].
Tinnitus matching could only be performed in case thetinnitus was present at the moment the test was taken.Accordingly, 42 (17%) musicians participated in this test.The level of the tinnitus was matched and compared with theaudiometric threshold levels resulting in a sensation level ofthe matched tone (dB SL). On average the sensation level ofthe tinnitus was 4 dB, but it ranged from 0 to 32 dB SL.
In a number of cases, it was diYcult to match the charac-ter of the tinnitus with the audiometer sounds. Qualitativedescriptions most often showed a high pitched tone-likesound, but numerous variations were mentioned (e.g. war-ble, hiss, buzz, ring, waterfall, crackle, vague tone, etc.).Pitch was matched with pure tones between 0.125 and8 kHz. Ten participants (25%) indicated the pitch of theirtinnitus was lower than 4 kHz. A sum of 15 participants(35%) indicated a pitch between 4 and 8 kHz. Unfortu-
nately, we could not estimate pitch above 8 kHz, as 17(40%) musicians indicated a pitch higher than 8 kHz.
Tinnitus was more often localized utmost left (18, 43%)than utmost right (7, 17%) and middle (13, 31%, �2 (4) =38.1087, p < 0.001). However, no signiWcant diVerence inlocalization was found between the instrument categories(p > 0.05). There was no signiWcant eVect of gender.
Participants with tinnitus at the moment of the test hadsigniWcantly worse average pure-tone thresholds than theones without tinnitus at the moment of the test (F(1,231) = 18.51, p = 0.03). This was especially the case for thehigher frequencies. Not surprisingly, the average age of theparticipants with tinnitus at the moment of the test was alsohigher (mean = 43.3 vs. mean (tinnitus) = 50.8, F(1, 231) =18.34, p < 0.000).
A total of 239 musicians participated in the speech-in-noise test. The average speech-to–noise ratio (SNR) was¡6.7 (SD 1.4), ranging from ¡9.2 to ¡1.6. The majority ofparticipants (231, 96.6%) scored an average SNR lower orequal to ¡4.1, indicating good hearing. 8 (3.3%) partici-pants scored an SNR between ¡4.1 and ¡1.4 (i.e. moderatehearing). No participants scored higher than ¡1.4, indicat-ing poor hearing as deWned by Smits et al. (2004).
No signiWcant diVerences were found between the meanSNRs for the factors instrument category, age, or gender.
The correlation between the SNR and the pure-tonethresholds at all measured frequencies was relatively low,but highest and signiWcant at 3 kHz (r = 0.26, p < 0.001).
The questionnaire
Most often the musicians judged their hearing of 10 years agoas signiWcantly better than 5 years ago, while the latter wasrated as signiWcantly better than their hearing now (mean: 8.8vs. 8.2 vs. 7.6 Wilcoxon signed ranks tests p < 0.01).
When asked to judge the quality of one’s own hearing inquiet, in noisy environments and when making music, nosigniWcant diVerences were found in these situations (theseratings were performed on a scale from 1 (very poor) to 5(very good).
A sum of 46 (19%) of the musicians indicated theywould be ashamed of having hearing disorders. Whenasked to further clarify their answer, 12 (5%) thought they
Table 2 Distribution of diplacusis over frequencies and instrument categories
Values are expressed in numbers and percent.
Number and % on tested frequencies Number and % musicians per instrument category
� freq ears 1 kHz 2 kHz 4 kHz HS LS WW BW
>1% 29 (12%) 41 (17%) 72 (30%) 39 (39%) 14 (33%) 30 (60%) 16 (46%)
>2% 7 (3%) 17 (7%) 29 12% 14 (14%) 6 (14%) 23 (46%) 8 (23%)
>3% 1 (0.4%) 5 (2%) 14 (6%) 6 (6%) 3 (7%) 6 (12%) 3 (9%)
123

160 Int Arch Occup Environ Health (2009) 82:153–164
would not be a good musician in case of hearing problems,6 (2%) stated that they thought their colleagues woulddoubt their ability to function as a musician. This madesome participants reluctant to talk about it or to take mea-surements associated with hearing problems (i.e. for somethis also included wearing hearing protection). A few (16/7%) stated they were afraid of losing their job after theorchestra management would be informed about hearingproblems. A sum of 6 (2%) thought this question was notapplicable to them (i.e. because they did not suVer fromhearing complaints), and 20 (8%) thought hearing problemsare part of the life of a musicians and should therefore bediscussed in all circumstances.
A large number of musicians indicated to use hearingprotection: 152 (52%) during orchestra repetitions, 70(29%) during concerts and 87 (36%) during other occa-sions, such as visits to a discotheque and other leisure activ-ities. Females indicated to wear hearing protection moreoften than males during repetitions and concerts(�2(1) = 4.68, p = 0.03). A few musicians only wear hear-ing protection when strictly necessary and only in one ear(e.g. the ear on the side of percussion or brass winds). Mostwearers use disposable hearing protectors (foam or cotton),a few have custom-made hearing protectors.
When asked about other auditory deWcits (i.e. hyperacu-sis, diplacusis, tinnitus, and distortion) 190 (79%) reportedcomplaints about hyperacusis, 17 (7%) about diplacusis,121 (51%) about tinnitus, and 57 (24%) about distortion oftones. The degree of the complaints varied from slight tosevere. Figure 4 shows cumulative results on the Wve-pointrating scale. The number of musicians that suVered fromhyperacusis, diplacusis, tinnitus, or distortion did notdepend on the instrument played by the musician or gender(p > 0.5).
Hyperacusis was mentioned most frequently as an audi-tory problem. A total of 79% indicated to be sensitive toloud sounds varying from slight (52, 22%) to very severe(23, 10%).
When comparing the subjective complaints about hyper-acusis with the results of the loudness-perception test, asmall, but signiWcant correlation was found: musicians whoindicated to suVer severely from hyperacusis scoredslightly lower UCL’s in the loudness perception test thanothers who indicated no or mild suVering (r = ¡0.29 for0.75 kHz; r = ¡0.21 for 3 kHz; r = ¡0.15 for WBN,p < 0.01). No signiWcant diVerences were found betweenthe large instrument groups. Females, however, indicated tosuVer from hyperacusis more severely than males(�2(4) = 10.3, p = 0.04).
Only 7% of the musicians indicated to experience aninteraural diVerence in pitch perception in contrast to theresults of the diplacusis matching where 18% showed aninteraural pitch diVerence of more than 2%. When the sub-jective results on the question of diplacusis were comparedto the results of the diplacusis matching, no signiWcant cor-relation was found for any of the tested frequencies. No sig-niWcant diVerence was found between males and femaleson the subjective rating of diplacusis.
One hundred and thirty two (51%) musicians indicatedto have complaints about tinnitus, varying from slight (42,32%) to severe (3, 2%).
The large instrument groups (i.e. HS, LS, WW, BW)showed only slight diVerences in the number of participantswith tinnitus. Tinnitus occurred the least in low string play-ers, while it occurred more often in brass wind and highstring players. No gender diVerence was found in the sub-jective rating.
EVects in OAE-responses
OAE-responses were obtained from 479 ears. Large inter-individual diVerences were found in TEOAE responses ofthe musicians in all frequency bands (1, 1.5, 2, 3, and4 kHz) and the median intensity levels of the TEOAE wereslightly decreasing with increasing frequency. In a GLMrepeated measures analysis with gender as between sub-jects factor, and frequency band as the repeated measure,females show overall higher TEOAE-responses than males(average response over all frequencies 8.4 vs. 4.6, F = 8.9,p < 0.001). No signiWcant diVerences were found forTEOAE-responses between the left and right ear(p > 0.05).
Taking only the large instrument categories (i.e. HS, LS,WW and BW) into account, the instrument signiWcantlyaVected the overall TEOAE response (F(4, 4) = 3, p < 0.01):brass wind players showed the lowest responses andhigh- and low-string players the highest. Responses covariated
Fig. 4 Cumulative proportion of musicians with complaints (rangingfrom slight to severe) about tinnitus, hyperacusis, diplacusis anddistortion
≥4 ≥3
100
80
60
40
20
0
Subjective judgement (from severe (5) to slight (2))
≥ 25
Cum
ulat
ive
% o
f com
plai
nts
Tinnitus Hyperacusis Diplacusis Distortion
123
Int Arch Occup Environ Health (2009) 82:153–164 161
with age (F = 3.5, p < 0.01) showing decreased responseswith increasing age.
DPOAE responses showed the characteristic DPOAEconWguration over the 27 tested frequencies (i.e. anincrease in DPOAE response in the lower and higher fre-quencies and a decrease in the middle frequency levels),and a large inter-individual variation, especially beneath themedian. Again, females show stronger intensity levels thanmales, especially in the higher frequency regions (averageresponse over all frequencies 8.0 vs. 5.6, F = 16.5,p < 0.001). When including only the large instrument cate-gories (i.e. HS, LS, WW, BW) into the analysis, we foundsigniWcant diVerences in DPOAE responses (F(3, 26) =3.14, p < 0.01): High- and low-string players showed over-all higher DPOAE responses than wood-wind and brass-wind players. No signiWcant interactions were found withgender and instrument category (F = 1.2, p > 0.5). TheDPOAE intensity levels also covariated with age, showinga decrease in intensity with increasing age (F = 4,p < 0.001).
TEOAE and DPOAE responses signiWcantly correlatedat the same frequencies (1, 1.5, 2, 3, and 4 kHz): R2 rangedfrom 0.27 to 0.45, p < 0.001.
The individual relation between TEOAE and DPOAEresponses and the pure-tone thresholds was weak. Somemusicians showed (almost) normal pure-tone thresholdswith surprisingly low OAE responses, while others showedpoor pure tone thresholds, but relatively high OAEresponses. Correlation coeYcients between audiometricthresholds and TEOAE intensity levels at the same frequen-cies were signiWcant, but low: R2 = 0.17/0.19/0.22/0.23,p < 0.05) at 1, 2, 3, and 4 kHz, respectively. The correlationbetween the average TEOAE response and the averagepure-tone threshold at 1, 2, 3, and 4 kHz was 0.29. Slightlyhigher correlations were found between the DPOAE-responses and the pure-tone thresholds: R2 = 0.13/0.21/0.37/0.40 at 1, 2, 3, and 4 kHz, respectively and R2 = 0.45for the average pure-tone threshold and average DPOAEresponse of 1, 2, 3, and 4 kHz.
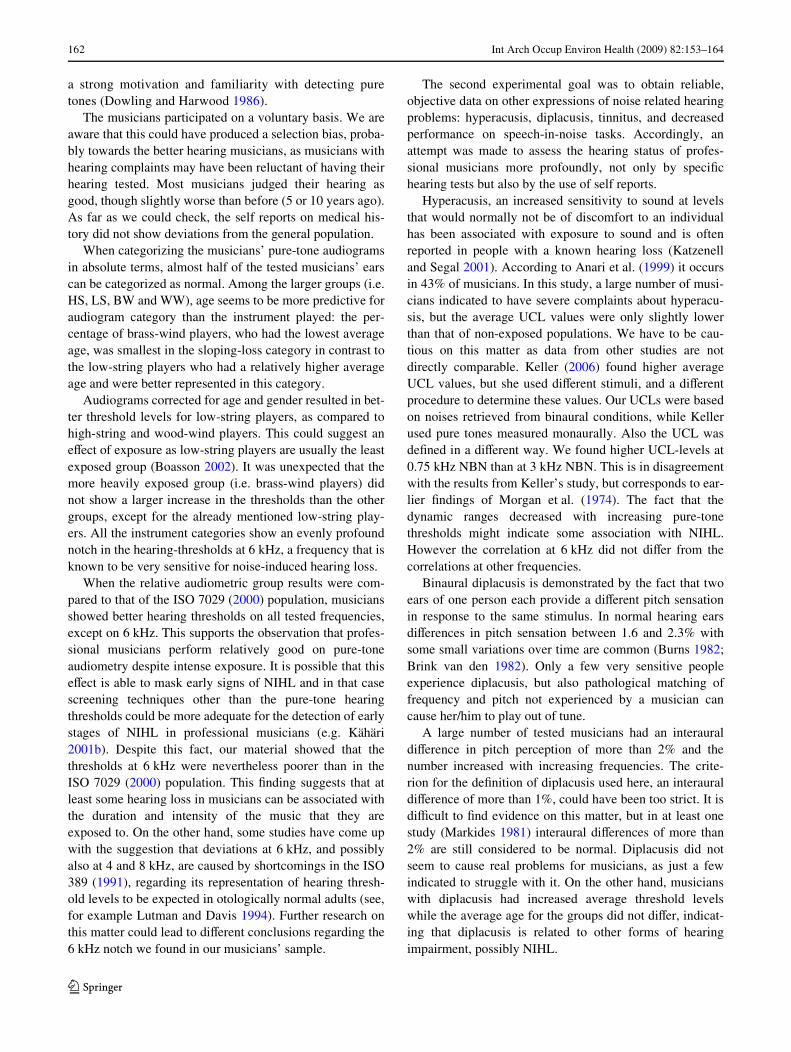
In addition to the individual data, we also investigatedthe OAE distributions in the audiogram categories deWnedabove. The average TEOAE per audiogram category isshown in Fig. 5a, the average DPOAE in Fig. 5b. TheWgures illustrate that the musicians in the normal hearingcategory have the strongest overall TEOAE (mean = 8.04,SD = 4.6) and DPOAE (mean = 9.51, SD = 4.6) responses,while musicians in the rest category show the weakestTEOAE (mean = 3.32, SD = 5.7), and DPOAE (mean =2.01, SD = 6.6) responses. SigniWcant diVerences were alsofound between OAE of the normal hearing category and theother categories (i.e. N vs. NM, NP, SL, and FL, post-hocBonferroni, p < 0.05)
Discussion
The Wrst experimental question was whether musicians ofsymphony orchestras should be treated as a special groupwith regard to hearing, noise, and noise related hearingproblems.
A combination of factors puts the hearing of many pro-fessional musicians at risk: they are often subjected tointense sound levels for long periods of time, while study-ing, rehearsing, and performing music. They often play inacoustically poorly equipped spaces (Boasson 2002) andmany feel disabled when wearing hearing protection as itaVects the way they play and hinders interaction with col-leagues.
Studies on the hearing of musicians in symphonyorchestras have indicated that their pure-tone hearingthresholds do not really deviate from that of a non-exposed population (e.g. Kähäri et al. 2001a, b; Eaton andGillis 2002; Obeling and Poulsen 1999). It has beenhypothesized that speciWc “musician characteristics” areresponsible for this result: wanted sounds such as musiccould be less harmful than unwanted sounds such asindustrial noise (Karlsson et al. 1983), or musicians per-form relatively good on pure-tone audiometry because of
Fig. 5 a Average TEOAE-intensity levels for musicians in each audiogram category b Average DPOAE-intensity levels for musicians in each audiogram category
TEOAE
Frequency (kHz)
OA
E-in
tesi
ty le
vel (
dB S
PL)
-20
-10
0
10
20
NNM NP SL FLR
DPOAE
Frequency (kHz)
80,841 1,091 1,414 1,834 2,378 3,084 4 5,187 6,72721 3 41,5
a b
123
162 Int Arch Occup Environ Health (2009) 82:153–164
a strong motivation and familiarity with detecting puretones (Dowling and Harwood 1986).
The musicians participated on a voluntary basis. We areaware that this could have produced a selection bias, proba-bly towards the better hearing musicians, as musicians withhearing complaints may have been reluctant of having theirhearing tested. Most musicians judged their hearing asgood, though slightly worse than before (5 or 10 years ago).As far as we could check, the self reports on medical his-tory did not show deviations from the general population.
When categorizing the musicians’ pure-tone audiogramsin absolute terms, almost half of the tested musicians’ earscan be categorized as normal. Among the larger groups (i.e.HS, LS, BW and WW), age seems to be more predictive foraudiogram category than the instrument played: the per-centage of brass-wind players, who had the lowest averageage, was smallest in the sloping-loss category in contrast tothe low-string players who had a relatively higher averageage and were better represented in this category.
Audiograms corrected for age and gender resulted in bet-ter threshold levels for low-string players, as compared tohigh-string and wood-wind players. This could suggest aneVect of exposure as low-string players are usually the leastexposed group (Boasson 2002). It was unexpected that themore heavily exposed group (i.e. brass-wind players) didnot show a larger increase in the thresholds than the othergroups, except for the already mentioned low-string play-ers. All the instrument categories show an evenly profoundnotch in the hearing-thresholds at 6 kHz, a frequency that isknown to be very sensitive for noise-induced hearing loss.
When the relative audiometric group results were com-pared to that of the ISO 7029 (2000) population, musiciansshowed better hearing thresholds on all tested frequencies,except on 6 kHz. This supports the observation that profes-sional musicians perform relatively good on pure-toneaudiometry despite intense exposure. It is possible that thiseVect is able to mask early signs of NIHL and in that casescreening techniques other than the pure-tone hearingthresholds could be more adequate for the detection of earlystages of NIHL in professional musicians (e.g. Kähäri2001b). Despite this fact, our material showed that thethresholds at 6 kHz were nevertheless poorer than in theISO 7029 (2000) population. This Wnding suggests that atleast some hearing loss in musicians can be associated withthe duration and intensity of the music that they areexposed to. On the other hand, some studies have come upwith the suggestion that deviations at 6 kHz, and possiblyalso at 4 and 8 kHz, are caused by shortcomings in the ISO389 (1991), regarding its representation of hearing thresh-old levels to be expected in otologically normal adults (see,for example Lutman and Davis 1994). Further research onthis matter could lead to diVerent conclusions regarding the6 kHz notch we found in our musicians’ sample.
The second experimental goal was to obtain reliable,objective data on other expressions of noise related hearingproblems: hyperacusis, diplacusis, tinnitus, and decreasedperformance on speech-in-noise tasks. Accordingly, anattempt was made to assess the hearing status of profes-sional musicians more profoundly, not only by speciWchearing tests but also by the use of self reports.
Hyperacusis, an increased sensitivity to sound at levelsthat would normally not be of discomfort to an individualhas been associated with exposure to sound and is oftenreported in people with a known hearing loss (Katzenelland Segal 2001). According to Anari et al. (1999) it occursin 43% of musicians. In this study, a large number of musi-cians indicated to have severe complaints about hyperacu-sis, but the average UCL values were only slightly lowerthan that of non-exposed populations. We have to be cau-tious on this matter as data from other studies are notdirectly comparable. Keller (2006) found higher averageUCL values, but she used diVerent stimuli, and a diVerentprocedure to determine these values. Our UCLs were basedon noises retrieved from binaural conditions, while Kellerused pure tones measured monaurally. Also the UCL wasdeWned in a diVerent way. We found higher UCL-levels at0.75 kHz NBN than at 3 kHz NBN. This is in disagreementwith the results from Keller’s study, but corresponds to ear-lier Wndings of Morgan et al. (1974). The fact that thedynamic ranges decreased with increasing pure-tonethresholds might indicate some association with NIHL.However the correlation at 6 kHz did not diVer from thecorrelations at other frequencies.
Binaural diplacusis is demonstrated by the fact that twoears of one person each provide a diVerent pitch sensationin response to the same stimulus. In normal hearing earsdiVerences in pitch sensation between 1.6 and 2.3% withsome small variations over time are common (Burns 1982;Brink van den 1982). Only a few very sensitive peopleexperience diplacusis, but also pathological matching offrequency and pitch not experienced by a musician cancause her/him to play out of tune.
A large number of tested musicians had an interauraldiVerence in pitch perception of more than 2% and thenumber increased with increasing frequencies. The crite-rion for the deWnition of diplacusis used here, an interauraldiVerence of more than 1%, could have been too strict. It isdiYcult to Wnd evidence on this matter, but in at least onestudy (Markides 1981) interaural diVerences of more than2% are still considered to be normal. Diplacusis did notseem to cause real problems for musicians, as just a fewindicated to struggle with it. On the other hand, musicianswith diplacusis had increased average threshold levelswhile the average age for the groups did not diVer, indicat-ing that diplacusis is related to other forms of hearingimpairment, possibly NIHL.
123

Int Arch Occup Environ Health (2009) 82:153–164 163
12% of men between 65 and 74 of age experience somekind of tinnitus and its prevalence increases with age(Lockwood et al. 2002). In musicians, however, it seems tobe far more common. About half of the musicians testedmentioned tinnitus as a complaint. In other studies tinnitushas been reported in 2–20% (Lockwood et al. 2002; Axels-son et al. 1989; Coles 1984; Skarzyjski et al. 2000). Thetinnitus reported in this study usually had a temporary char-acter, but some participants reported very loud and continu-ous tinnitus. In these cases the tinnitus could cause aserious handicap. Tinnitus was more often pitched in thehigher frequency area (i.e. higher than 4 kHz), whichstrongly suggests that tinnitus is related to intensive expo-sure to loud sounds. Tinnitus was more often localizedutmost left and this could not be related to the instrumenttype (e.g. in the HS group) or to the position in the orches-tra. As with diplacusis, musicians with tinnitus showedincreased hearing thresholds, while no diVerence in agecould be found with musicians who did not report tinnitus.
Most musicians scored within normal limits on thespeech-in-noise test. The musicians’ subjective assessmentdid not show any severe problems with understandingspeech in a noisy environment, or in music.
As the third main theme, we included OAE measure-ments in order to asses the added value in detection ofNIHL and to assess the relations between measurements ofhearing acuity (i.e. PTA, OAE) and self-reports on noise-induced hearing problems.
In both TEOAEs and DPOAEs large inter-individualdiVerences were found. No relation to individual audiomet-ric patterns could be determined. On group level however,we found clear diVerences between the average OAEresponses of diVerent audiometric subgroups: in general,more intense OAEs were found for groups with better aver-age pure-tone thresholds. The OAEs of the normal hearingmusicians were clearly distinguishable from the OAEs ofthe musicians in the other audiometric categories, suggest-ing a signalling function for early detection of NIHL. AWrm statement on this issue can, however, only be made onthe basis of a longitudinal study. The dissociation betweenaudiometric thresholds and OAE outcome measures can bea complication in the application of OAEs for screeningpurposes on an individual level. As long as experimentalevidence about the predictive value is not strong enough,the pure-tone audiogram should remain the gold standardfor the assessment of NIHL.
Finally, continuing education about the risks of intensivesound exposure to musicians, with the emphasis on the pos-sible development of tinnitus and hyperacusis and the needfor good hearing protection (i.e. not only in the form of per-sonal hearing protection such as ear plugs, but also on noiseabsorbing screens, and the importance of changing positionin the orchestra) is warranted.
Conclusions
In summary, most musicians in this study could be classi-Wed as having normal hearing. Relative auditory thresholdswere generally better than the normal-hearing referencegroup of ISO 7029 (2000) standard, except at 6 kHz, whichclearly suggests an association with NIHL. Tinnitus, dipla-cusis, and hyperacusis were found more often than could beexpected in the general population, based on other studies.Diplacusis does not seem to have much impact on the pro-fessional practice of the musicians, but tinnitus and hypera-cusis can cause severe problems in professional and privateenvironments. Also the prevalence of tinnitus and diplacu-sis are suggestive for the involvement of NIHL. Further-more, to make a statement about the early diagnosticqualities of the otoacoustic emissions towards NIHL, thereis a need for more data on the development of otoacousticemissions over time.
Acknowledgments The authors like to thank Miranda Neerings ofthe Academic Medical Center Amsterdam for her dedication and accu-racy in testing the musicians and prof. J. Festen for giving us the oppor-tunity to use the speech-in-noise-test developed by the VU universitymedical center. The AMC Medical Ethical Commission approved withthis study. This study was supported by the Agency for Dutch Orches-tras (Contactorgaan Nederlandse orkesten)
Open Access This article is distributed under the terms of theCreative Commons Attribution Noncommercial License whichpermits any noncommercial use, distribution, and reproduction in anymedium, provided the original author(s) and source are credited.
References
Anari M, Axelsson A, Eliasson A, Magnusson L (1999) Hypersensitiv-ity to sound: questionnaire data, audiometry and classiWcation.Scand Audiol 28:219–230
Avan P, BonWls P (1993) Frequency speciWcity of human distortionproduct otoacoustic emissions. Audiology 32(1):12–26
Axelsson A, Ringdahl A (1989) Tinnitus: a study of its prevalence andcharacteristics. Br J Audiol 23(1):53–62
Boasson MW (2002) A one year noise survey during rehearsals andperformances in the Netherlands Ballet Orchestra. In: Proceed-ings of the Institute of Acoustics 24(4):33–34
Brand T, Hohmann V (2002) An adaptive procedure for categoricalloudness scaling. J Acoust Soc Am 112(4):1597–1604
Brink van den G (1970) Experiments on bineural diplacusis and tone per-ception. In: Plomp R, Smoorenburg GF (eds) Frequency analysisand periodicity detection in hearing. SijthoV, Leiden, pp 362–373
Burns EM (1982) Pure-tone pitch anomalies. I. Pitch-intensity eVectsand diplacusis in normal ears. J Acoust Soc Am 72(5):1394–1402
Coles RR (1984) Epidemiology of tinnitus: (1) prevalence. J LaryngolOtol Suppl 9:7–15
Coles RR, Lutman ME, BuYn JT (2000) Guidelines on the diagnosisof noise-induced hearing loss for medicolegal purposes. ClinOtolaryngol Allied Sci 25(4):264–273
Dawson-Saunders B, Trapp RG (1994) Basic and clinical biostatistics,2nd edn. Appleton & Lange, Connecticut
Dowling wJ, Harwood DL (1986) Music cognition. Academic Press,St Louis
123

164 Int Arch Occup Environ Health (2009) 82:153–164
Eaton S, Gillis H (2002) Review of orchestra musicians hearing lossrisks. Can Acoust 30(2):5
Gorga MP, Dierking DM, Johnson TA, Beauchaine KL, Garner CA,Neely ST (2005) A validation and potential clinical application ofmultivariate analyses of distortion-product otoacoustic emissiondata. Ear Hear 26:593–607
ISO 389 (1991) Acoustics-standard reference zero for the calibrationof pure-tone audiometers, 3rd edn. International organization forstandardization, Geneva
ISO 7029 (2000) Acoustics—statistical distribution of hearing thresh-olds as a function of age, 2nd edn. International organization forstandardization, Geneva
Johnson DW, Sherman RE, Aldridge J, Lorraine A (1985) EVects ofinstrument type and orchestral position on hearing sensitivity for0.25 to 20 kHz in the orchestral musician. Scand Audiol14(4):215–221
Kähäri KR, Axelsson A, Hellström PA, Zachau G (2001a) Hearingassessment of classical orchestral musicians. Scand Audiol30(1):13–23
Kähäri KR, Axelsson A, Hellström PA, Zachau G (2001b) Hearingdevelopment in classical orchestral musicians. A follow-up study.Scand Audiol 30(3):141–149
Karlsson K, Lundquist PG, Olaussen T (1983) The hearing of sym-phony orchestra musicians. Scand Audiol 12(4):257–264
Katzenell U, Segal S (2001) Hyperacusis: review and clinical guide-lines. Otol Neurotol 22(3):321–327
Keller JN. (2006) Loudness discomfort levels: a retrospective studycomparing data from Pascoe (1988) and Washington UniversitySchool of Medicine. Washington University School of medicine
Lapsley-Miller JA, Marshall L, Heller LM (2004) A longitudinal studyin evoked otoacoustic emissions and pure-tone thresholds asmeasured in a hearing conservation program. Int J Audiol43(6):307–322
Lockwood AH, Salvi RJ, Burkhard RF (2002) Tinnitus. N Engl J Med347(12):904–910
Lutman ME, Davis AC (1994) The distribution of hearing thresholdlevels in the general population aged 18–30 years. Audiology33:327–350
Markides A (1981) Binaural pitch-matching with interrupted tones. BrJ Audiol 15(3):173–180
Martin GK, Ohlms LA, Franklin DJ, Harris FP, Lonsbury-Martin BL(1990) Distortion product emissions in humans. III. InXuence of sen-sorineural hearing loss. Ann Otol Rhinol Laryngol Suppl 147:30–42
Morgan DE, Wilson RH, Dirks DD (1974) Loudness discomfort level:selected methods and stimuli. J Acoust Soc Am 56(2):577–581
Niskar AS, Kieszak SM, Holmes AE, Esteban E, Rubin C, Brody DJ(2001) Estimated prevalence of noise-induced hearing thresholdshifts among children 6 to 19 years of age: the Third NationalHealth and Nutrition Examination Survey, 1988–1994, UnitedStates. Pediatrics 109(5):987–988
Obeling L, Poulsen T (1999) Hearing ability in Danish symphonyorchestra musicians. Noise Health 1(2):43–49
Rabinowitz PM, Galusha D, Slade MD, Dixon-Ernst C, Sircar KD, Do-bie RA (2006) Audiogram notches in noise-exposed workers. EarHear 27(6):742–750
Seither-Preisler A, Johnson L, Krumbholz K, Nobbe A, Patterson R,Seither S, Lütkenhöner B (2007) Tone sequences with conXictingfundamental pitch and timbre changes are heard diVerently bymusicians and nonmusicians. J Exp Psychol Hum Percept Per-form 33(3):743–751
Skarzyjski H, Rogowski M, Bartnik G, Fabijajska A (2000) Organi-zation of tinnitus management in Poland. Acta Otolaryngol12(2):225–226
Smits C, Kapteyn TS, Houtgast T (2004) Development and validationof an automatic speech-in-noise screening test by telephone. Int JAudiol 43(1):15–28
123