nokia conference call second quarter 2006 financian · pdf filenokia ultrasite - complete site...
TRANSCRIPT
1 © 2007 Nokia Fourth Quarter 2006 Financial Results
Olli-Pekka Kallasvuo President & CEO
Rick Simonson Executive Vice President & CFO
Bill Seymour Head of Investor Relations
Nokia Conference CallFourth Quarter 2006 Financial Results
January 25th, 2007 15.00 Helsinki time 8.00 New York time

2 © 2007 Nokia Fourth Quarter 2006 Financial Results
DisclaimerIt should be noted that certain statements herein which are not historical facts, including, without limitation, those regarding: A) the timing of product and solution deliveries; B) our ability to develop, implement and commercialize new products, solutions and technologies; C) expectations regarding market growth, developments and structural changes; D) expectations regarding our mobile device volume growth, market share, prices and margins; E) expectations and targets for our results of operations; F) the outcome of pending and threatened litigation; G) expected timing, scope and effects of the merger of Nokia's and Siemens' communications service provider businesses; and H) statements preceded by "believe," "expect," "anticipate," "foresee," "target," "estimate," "designed," "plans," "will" or similar expressions are forward-looking statements. Because these statements involve risks and uncertainties, actual results may differ materially from the results that we currently expect. Factors that could cause these differences include, but are not limited to: 1) the extent of the growth of the mobile communications industry, as well as the growth and profitability of the new market segments within that industry which we target; 2) the availability of new products and services by network operators and other market participants; 3) our ability to identify key market trends and to respond timely and successfully to the needs of our customers; 4) the impact of changes in technology and our ability to develop or otherwise acquire complex technologies as required by the market, with full rights needed to use; 5) competitiveness of our product portfolio; 6) timely and successful commercialization of new advanced products and solutions; 7) price erosion and cost management; 8) the intensity of competition in the mobile communications industry and our ability to maintain or improve our market position and respond to changes in the competitive landscape; 9) our ability to manage efficiently our manufacturing and logistics, as well as to ensure the quality, safety, security and timely delivery of our products and solutions; 10) inventory management risks resulting from shifts in market demand; 11) our ability to source quality components without interruption and at acceptable prices; 12) our success in collaboration arrangements relating to development of technologies or new products and solutions; 13) the success, financial condition and performance of our collaboration partners, suppliers and customers; 14) any disruption to information technology systems and networks that our operations rely on; 15) our ability to protect the complex technologies that we or others develop or that we license from claims that we have infringed third parties' intellectual property rights, as well as our unrestricted use on commercially acceptable terms of certain technologies in our products and solution offerings; 16) general economic conditions globally and, in particular, economic or political turmoil in emerging market countries where we do business; 17) developments under large, multi-year contracts or in relation to major customers; 18) exchange rate fluctuations, including, in particular, fluctuations between the euro, which is our reporting currency, and the US dollar, the Chinese yuan, the UK pound sterling and the Japanese yen; 19) the management of our customer financing exposure; 20) our ability to recruit, retain and develop appropriately skilled employees; 21) the impact of changes in government policies, laws or regulations; and 22) satisfaction of the conditions to the merger of Nokia's and Siemens' communications service provider businesses, including achievement of agreement between Nokia and Siemens on the results and consequences of a Siemens compliance review, and closing of transaction, and Nokia's and Siemens' ability to successfully integrate the operations and employees of their respective businesses; as well as 23) the risk factors specified on pages 12 - 22 of the company's annual report on Form 20-F for the year ended December 31, 2005 under "Item 3.D Risk Factors." Other unknown or unpredictable factors or underlying assumptions subsequently proving to be incorrect could cause actual results to differ materially from those in the forward-looking statements. Nokia does not undertake any obligation to update publicly or revise forward-looking statements, whether as a result of new information, future events or otherwise, except to the extent legally required.

3 © 2007 Nokia Fourth Quarter 2006 Financial Results
Nokia 4Q06 and Year 2006 Highlights(*)
• Net sales grew 13% in 4Q; 20% in 2006• Operating profit (excluding special items)
grew 12% in 4Q; 18% in 2006• Diluted EPS (excluding special items) grew
20% in 4Q; 29% in 2006• Nokia device volumes grew 26% in 4Q; 31%
in 2006• Nokia device market share for 4Q and 2006
was 36% - up 2 points in 4Q and 3 points in 2006 (**)
• Nokia Networks net sales grew 12% in 4Q; 14% in 2006
• Gross margins were up sequentially for all business groups
Nokia N76
(*) All prior period comparisons are year on year (**) Based on Nokia’s preliminary market estimates
4 © 2007 Nokia Fourth Quarter 2006 Financial Results
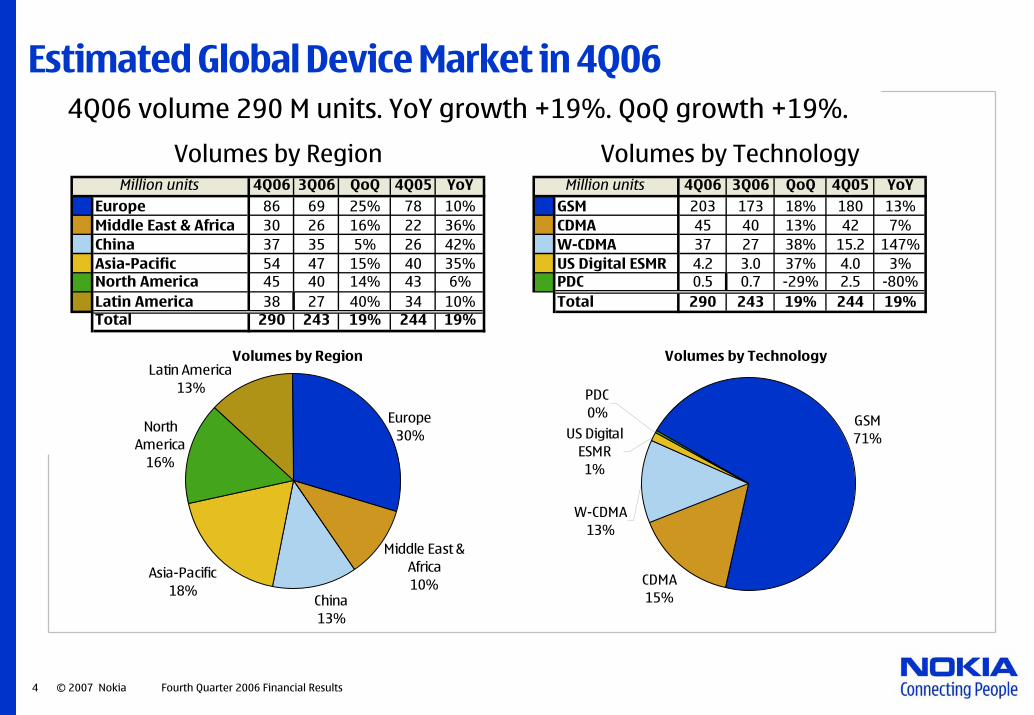
Estimated Global Device Market in 4Q06 4Q06 volume 290 M units. YoY growth +19%. QoQ growth +19%.
4Q06 3Q06 QoQ 4Q05 YoY 4Q06 3Q06 QoQ 4Q05 YoYEurope 86 69 25% 78 10% GSM 203 173 18% 180 13%Middle East & Africa 30 26 16% 22 36% CDMA 45 40 13% 42 7%China 37 35 5% 26 42% W-CDMA 37 27 38% 15.2 147%Asia-Pacific 54 47 15% 40 35% US Digital ESMR 4.2 3.0 37% 4.0 3%North America 45 40 14% 43 6% PDC 0.5 0.7 -29% 2.5 -80%Latin America 38 27 40% 34 10% Total 290 243 19% 244 19%Total 290 243 19% 244 19%
Volumes by Region Volumes by TechnologyMillion units Million units
Volumes by Region
Middle East & Africa10%
China13%
Asia-Pacific18%
North America
16%
Europe30%
Latin America13%
Volumes by Technology
CDMA15%
PDC0%
US Digital ESMR1%
W-CDMA13%
GSM71%

5 © 2007 Nokia Fourth Quarter 2006 Financial Results
Nokia Mobile Devices in 4Q06
Nokia Market share (*):• European sequential share gain – gains in Russia, Germany, Italy & Spain• YoY share gains in all regions except North America• Nokia #1 in fastest growing markets: #1 in India, #1 in China, #1 in Middle
East and Africa, #1 in South East Asia Pacific and #1 in WCDMA
(*) Based on Nokia’s preliminary market estimates
4Q06 3Q06 QoQ 4Q05 YoY 4Q06 3Q06 QoQ 4Q05 YoYEurope 33.3 24.8 33.9% 29.9 11.4% 89 93 -4% 99 -10%Middle East & Africa 15.5 13.3 16.5% 10.3 50.5%China 14.6 13.8 5.8% 9.5 53.7%Asia-Pacific 23.7 20.9 13.4% 14.8 60.1%North America 5.9 5.8 1.7% 9.8 -39.8%Latin America 12.5 9.9 26.3% 9.4 33.0%Total 105.5 88.5 19.1% 83.7 25.9%
Mobile Device Volume by RegionMillion units
Mobile Device ASPsEUR
Average sale price (ASP)

6 © 2007 Nokia Fourth Quarter 2006 Financial Results
Product Highlights for 4Q 2006

7 © 2007 Nokia Fourth Quarter 2006 Financial Results
Significant Products for 1Q 2007

8 © 2007 Nokia Fourth Quarter 2006 Financial Results
Nokia Networks in 4Q06: Highlights
• Net sales growth of 21% QoQ; 12% YoY• Several managed services and network
expansion deals announced• Nokia Siemens Network integration work
progressing; joint compliance review under way
Nokia Geographic Distribution of Sales 4Q06
Nokia UltraSite - complete site solution for GSM, EDGE and WCDMA Multimedia Networks
ChinaAsia-Pacific
Middle East & Africa
North America
Latin America
Europe

9 © 2007 Nokia Fourth Quarter 2006 Financial Results
Nokia Profit & Loss Account
EUR (million)Mobile
PhonesMulti-media
Enterprise Solutions Networks
Nokia 4Q06
Nokia 4Q05 Change
Nokia 3Q06 Change
Net sales 7 076 2 136 305 2 184 11 701 10 333 13% 10 100 16%YoY growth 14% 6% 99% 12% 13%
Gross profit 2 103 820 134 726 3 793 3 523 8% 3 122 21%Gross margin, % 29.7% 38.4% 43.9% 33.2% 32.4% 34.1% 30.9%
R&D -312 -246 -82 -341 -1 065 -1050 1% -905 18%% of net sales 4.4% 11.5% 26.9% 15.6% 9.1% 10.2% 9.0%
S&M -502 -225 -101 -164 -1 007 -887 14% -768 31%% of net sales 7.1% 10.5% 33.1% 7.5% 8.6% 8.6% 7.6%
AG&O -32 -23 -15 -92 -202 -218 -7% -349 -42%% of net sales 0.5% 1.1% 4.9% 4.2% 1.7% 2.1% 3.5%
Operating profit 1 257 326 -64 129 1 519 1 368 11% 1 100 38%Operating margin, % 17.8% 15.3% -21.0% 5.9% 13.0% 13.2% 10.9%
Financial income and expenses 44 78 -44% 34 29%
Profit before tax and minority interests 1 568 1 453 8% 1 145 37%
Net profit 1 273 1 073 19% 845 51%
EPS, Basic and Diluted (EUR) 0.32 0.25 28% 0.21 52%

10 © 2007 Nokia Fourth Quarter 2006 Financial Results
Special Items: 2005 and 2006
• 4Q06: Reported group operating margins were 13.0%. Excluding the special items, operating margins were 13.3%• 4Q06: Diluted EPS was EUR 0.32. Excluding the special items, diluted EPS was EUR 0.30.
2005 (Meur) Q1 Q2 Q3 Q4 TotalRestructuring charge (Multimedia) -15 -15Gain on the sale of real estate sales (Common group functions) 37 8 45Gain related to the divestiture of Nokia's Tetra business (42Meur in Networks and 19Meur in Multimedia) 61 61Gain related to the partial sale of a minority investment (Networks) 18 18Restructuring charge (Enterprise Solutions) -29 -29An impact on operating profit: -15 37 87 -29 80Other special items:Gain on the sale of France Telecom Bond (included in financial income) 40 17 57Tax refunds (included in taxes) 48 48
Total impact on diluted EPS (EUR): 0.01 0.015 0.005 0.04
2006 (Meur) Q1 Q2 Q3 Q4 TotalRestructuring charges and related asset write-downs primarily for the CDMA business (Mobile Phones) -14 -128 -142Restructuring charge (Enterprise Solutions) -8 -8Telsim settlement (Networks) 276 276NSN integration expenses -39 -39An impact on operating profit: -22 276 -128 -39 87Other special items:Tax refunds (included in taxes) 84 84
Total impact on diluted EPS (EUR): 0.05 -0.02 0.02 0.03

11 © 2007 Nokia Fourth Quarter 2006 Financial Results
Currency
• Nokia 4Q 2006 Reported Net Sales Growth: 13%• Nokia 4Q 2006 Constant Currency Net Sales Growth: 12%• 4Q06 EUR/USD average rate for P&L: 1.266• 1Q07 EUR/USD Plan rate: 1.312
Source: Bloomberg

12 © 2007 Nokia Fourth Quarter 2006 Financial Results
Balance Sheet & Cash Flow MetricsEUR (million) 4Q 2006 4Q 2005 YoY 3Q 2006 QoQ
Inventories 1 554 1 668 -7% 2275 -32%
Accounts Receivable 5 888 5 346 10% 5777 2%
Accounts Payable 3 732 3 494 7% 4264 -12%
Operating Cash Flow 1 659 1 063 56% 956 74%
Capital Expenditure 188 183 3% 150 25%Depreciation 179 189 -5% 181 -1%
Cash and Other liquid assets 8 537 9 910 -14% 7926 8%
Gearing (Net-Debt ratio) -68% -77% -67%
Distributions 700 1 763 720 Dividends Buybacks 700 1 763 -60% 720 -3%

13 © 2007 Nokia Fourth Quarter 2006 Financial Results
Improving Cash Flow
0
200
400
600
800
1000
1200
1400
1600
1800
1Q06 2Q06 3Q06 4Q06
Euro
MOperating Cash FlowFree Cash Flow*Operating profit**
* Free cash flow = Operating cash flow – CAPEX** Operating profit excluding special items

14 © 2007 Nokia Fourth Quarter 2006 Financial Results
4
5
6
7
8
9
10
11
12
13
Q403 Q104 Q204 Q304 Q404 Q105 Q205 Q305 Q405 Q106 Q206 Q306 Q406
Net C
ash
(Eur
o bi
llion
s)
3800
3900
4000
4100
4200
4300
4400
4500
4600
4700
4800
Dilu
ted
shar
e co
unt (
mill
ions
)
Cash levelShare count*
Distribution to shareholders
* Diluted
Decreased 15%

15 © 2007 Nokia Fourth Quarter 2006 Financial Results
Nokia Board Proposals and Announcements
Nokia’s Board of Directors proposals for the AGM:• An annual divided of EUR 0.43 per share• A share repurchase authorization of up to 380 million shares
Nokia’s Board of Directors announcements:• Plan to repurchase shares with up to EUR 4 billion between the AGM
and March 31, 2008 subject to the renewal of the authorization• Intention to cancel majority of the shares held by the company prior to
the AGM
NOTE: All board proposals are subject to shareholder approval inconjunction with our AGM on May 3, 2007.

16 © 2007 Nokia Fourth Quarter 2006 Financial Results
Expectations for Market and Nokia1Q07 Outlook• Mobile device market volumes to reflect normal industry
seasonality following a strong 4th quarter selling period• Nokia device market share: approx. at same level sequentially• Nokia’s Networks business to experience a sequential seasonal
net sales decline in the first quarter 2007.
2007 Outlook• Mobile device market volumes: up to 10% volume growth
(estimated 978 million units in 2006)• Mobile device market: value growth – but industry ASPs down• Mobile & fixed infrastructure and related services market: slight
growth (Euros)• Nokia device market share : target to increase market share
2007 Other Nokia Items• Tax rate: approximately 26%• CAPEX: approximately EUR 700 million (*)• Depreciation and amortization: approximately EUR 725 million (*)
Nokia N800 Internet Tablet(*) Does not include the impact of the Nokia Siemens Networks merger
17 © 2007 Nokia Fourth Quarter 2006 Financial Results

18 © 2007 Nokia Fourth Quarter 2006 Financial Results
Potential Ongoing Factors Impacting Device Gross Margin & ASP
• Potential Positive Drivers of Gross Margin
• Improving product portfolio in mid and higher end; strong performance in entry-level
• Growth of value add markets (e.g. WCDMA, smart phones, multimedia, enterprise, etc.)
• Continuing cost control
• Potential Negative Drivers of Gross Margin
• Competitive factors in general• Need to have an ever more
competitive product portfolio
• Potential Positive Drivers of ASP• Continuously improving product
portfolio• Growth of value add markets (e.g.
WCDMA, smart phones, multimedia, enterprise, etc.)
• Potential Negative Drivers of ASP• Competitive factors in general• Shift in market to higher growth
emerging markets