nokia's labor inflows and outflows in finland - etla
TRANSCRIPT

INokia’s Labor Inflows and Outflows in Finland: Observations from 1989 to 2010
Raportit Reports
3 May 2013
No 10
* ETLA – The Research Institute of the Finnish Economy, [email protected]** ETLA – The Research Institute of the Finnish Economy, [email protected]
Mika Pajarinen* – Petri Rouvinen**
ETLA ETLA
Observations from 1989 to 2010
Nokia’s Labor Inflows and Outflows in Finland
Suggested citation: Pajarinen, Mika & Rouvinen, Petri (3.5.2013). “Nokia’s Labor Inflows and Outflows in Finland: Observations from 1989 to 2010”. ETLA Reports No 10. http://pub.etla.fi/ETLA-Raportit-Reports-10.pdf

ETLA Raportit – ETLA Reports No 10II
Published as a part of the ongoing collaboration of BRIE, the Berkeley Roundtable on the International Economy at the University of California, and ETLA.
ISSN-L 2323-2447 ISSN 2323-2447 (print) ISSN 2323-2455 (online)

1Nokia’s Labor Inflows and Outflows in Finland: Observations from 1989 to 2010
Contents
Abstract 2
1 Introduction 3
2 Ourapproachanddataset 5
3 Personalcharacteristics 8 3.1 Labormarketstatus 8 3.2 Employeeage 9 3.3 Maritalstatus 11 3.4 Fieldofeducation 12 3.5 Levelofeducation 13 3.6 Occupation 14 3.7 Wagechangeduringaone-yearperiod 15 3.8 Wagechangeduringatwo-yearperiod 16
4 Organizationalcharacteristics 17 4.1 Industry 17 4.2 Firmsize 18 4.3 Firmage 19
5 Discussion 20

ETLA Raportit – ETLA Reports No 102
Nokia’s Labor Inflows and Outflows in FinlandObservations from 1989 to 2010
Abstract
Nokia’s ascent, dominance, and descent have resulted in significant labor inflows and outflows in Finland. In this paper, we document the aspects of these flows using official register-based data covering virtual-ly all individuals and organizations in Finland. Our setup may be compared to a laboratory experiment on the impacts of a single company on a country. During the 1990s, a large share of Nokia recruits were recent college graduates. Most of these recent graduates assumed various specialist and managerial positions at Nokia. During the 2000s, Nokia has been a good source of highly skilled labor for other businesses in Fin-land. More recently, an increasing share of former Nokia employees has been engaged with startups. Ad-ditionally, the proportion of former Nokia employees who have migrated to public sector jobs has grown.
Key words: Nokia, Finland, ICT, labor flows, employer-employee data
JEL: D21, J63, M51
Nokian työpaikkavirrat SuomessaHavaintoja vuosilta 1989–2010
Tiivistelmä
Nokia on toimintansa aikana ollut merkittävä sekä sisään- että ulospäin suuntautuneiden työpaikkavirto-jen lähde. Tässä raportissa tarkastelemme näitä työpaikkavirtoja monien eri taustamuuttujien avulla hyö-dyntäen Tilastokeskuksen rekisteripohjaisia aineistoja, jotka kattavat käytännössä kaikki henkilöt ja yrityk-set Suomessa. 1990-luvulla suuri osa Nokiaan tulleista työntekijöistä oli vastavalmistuneita tai opintojen loppusuoralla olevia opiskelijoita. Näistä useat työllistyivät erilaisiin asiantuntija- ja johtotason tehtäviin. 2000-luvulla Nokia on ollut huomattava työntekijöiden lähde yrityksille, jotka ovat rekrytoineet henkilös-töä korkeaa osaamistasoa vaativiin tehtäviin. Viime aikoina kasvava osuus entisistä Nokian työntekijöistä on perustanut uuden yrityksen tai muutoin työllistynyt alkuvaiheen yrityksiin. Myös siirtymät Nokiasta jul-kisen sektorin tehtäviin ovat lisääntyneet.
Asiasanat: Nokia, Suomi, ICT, työpaikkavirrat, työntekijä-työnantaja-aineisto JEL: D21, J63, M51

3Nokia’s Labor Inflows and Outflows in Finland: Observations from 1989 to 2010
05
101520253035404550
1997
1998
1999
2000
2001
2002
2003
2004
2005
2006
2007
2008
2009
2010
2011
2012
b. Nokia’s global handset market share, %(Data: Gartner)
0200400600800
1 0001 2001 4001 6001 8002 000
1991
1993
1995
1997
1999
2001
2003
2005
2007
2009
2011
a. Global handset salesMillions of phones p.a.(Data: Gartner)
-10112233445
1990
1992
1994
1996
1998
2000
2002
2004
2006
2008
2010
2012
c. Nokia’s share of Finnish GDP, %(Data: Ali-Yrkkö, ETLA)
0
10 000
20 000
30 000
40 000
50 000
60 000
70 000
1990
1992
1994
1996
1998
2000
2002
2004
2006
2008
2010
2012
d. ICT sector employment in Finland(Data: Statistics Finland)
Equipment manufacturing
Software, IT services
Telecommunications
Wholesale
1 IntroductionConsideringtherelianceofanationaleconomyononecompany,The Economist(August25,2012) concludes that “The importance of Nokia to Finland looks like a one-off [in globalcomparison].”1Nokiahasalsobeenaglobalforce:thecompanyledthemobilehandsetindus-trygrowingover40%annuallythroughoutthe1990s(Figure1.a),and,atitsheight,thecom-pany’sshareofglobalmobilephonedeliverieswasover40%in2006(Figure1.b).
AsaresultofNokia’sriseduringthe1990s,Finlandtransformedfrombeingoneoftheleastinformationandcommunicationtechnology(ICT)specializedcountriestobecomingthesin-glemostspecializedone(Koski,Rouvinen,&Ylä-Anttila,2002).2Duringtheearly1990s,thesuccessofNokiawasamajorfactorinpullingFinlandoutofthemostsevereeconomiccrisisinanyOECDcountrysinceWorldWarII.Duringthecompany’sprimefrom1998to2007,No-kiacontributedtonearlyaquarterofFinnisheconomicgrowth.Onthedownside,thereisnocomparisoninFinland’scorporatehistorytoNokia’sdescentsince2008:forexample,nearlyone-thirdoftheover8%dropintheFinnishGDPin2009isattributabletoNokia.
1 Economist. (August 25, 2012). One-firm economies: The Nokia effect. The Economist, 404(8799), 57. http://www.economist.com/node/215608672 Koski, H., Rouvinen, P., & Ylä-Anttila, P. (2002). ICT Clusters in Europe: The Great Central Banana and Small Nordic Potato. Informa-tion Economics and Policy, 14(2), 145–165.
Figure 1 The sectorial context of this paper
ETLA Raportit – ETLA Reports No 104
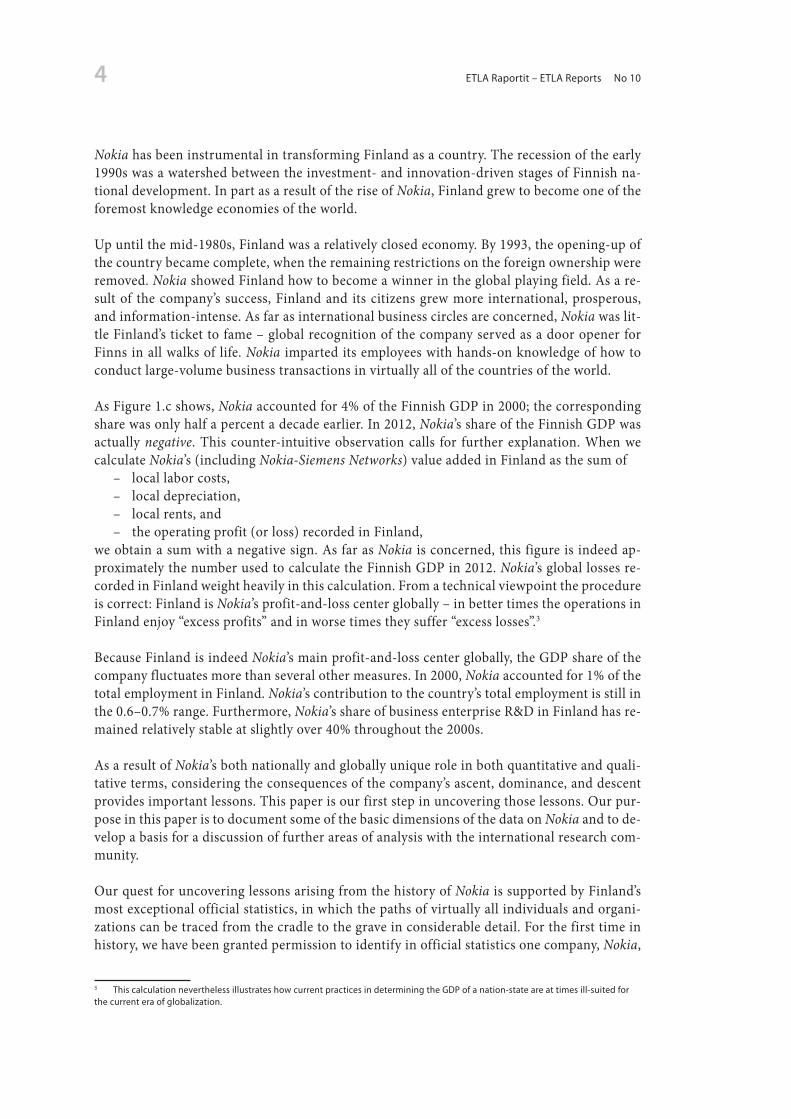
NokiahasbeeninstrumentalintransformingFinlandasacountry.Therecessionoftheearly1990swasawatershedbetweentheinvestment-andinnovation-drivenstagesofFinnishna-tionaldevelopment.InpartasaresultoftheriseofNokia,Finlandgrewtobecomeoneoftheforemostknowledgeeconomiesoftheworld.
Upuntilthemid-1980s,Finlandwasarelativelyclosedeconomy.By1993,theopening-upofthecountrybecamecomplete,whentheremainingrestrictionsontheforeignownershipwereremoved.NokiashowedFinlandhowtobecomeawinnerintheglobalplayingfield.Asare-sultof thecompany’ssuccess,Finlandand itscitizensgrewmore international,prosperous,andinformation-intense.Asfarasinternationalbusinesscirclesareconcerned,Nokiawaslit-tleFinland’stickettofame–globalrecognitionofthecompanyservedasadooropenerforFinnsinallwalksoflife.Nokia imparteditsemployeeswithhands-onknowledgeofhowtoconductlarge-volumebusinesstransactionsinvirtuallyallofthecountriesoftheworld.
AsFigure1.cshows,Nokiaaccountedfor4%oftheFinnishGDPin2000;thecorrespondingsharewasonlyhalfapercentadecadeearlier.In2012,Nokia’sshareoftheFinnishGDPwasactuallynegative.Thiscounter-intuitiveobservationcalls for furtherexplanation.WhenwecalculateNokia’s(includingNokia-Siemens Networks)valueaddedinFinlandasthesumof
– locallaborcosts,– localdepreciation,– localrents,and– theoperatingprofit(orloss)recordedinFinland,
weobtainasumwithanegativesign.AsfarasNokiaisconcerned,thisfigureisindeedap-proximatelythenumberusedtocalculatetheFinnishGDPin2012.Nokia’sgloballossesre-cordedinFinlandweightheavilyinthiscalculation.Fromatechnicalviewpointtheprocedureiscorrect:FinlandisNokia’sprofit-and-losscenterglobally–inbettertimestheoperationsinFinlandenjoy“excessprofits”andinworsetimestheysuffer“excesslosses”.3
BecauseFinlandisindeedNokia’smainprofit-and-losscenterglobally,theGDPshareofthecompanyfluctuatesmorethanseveralothermeasures.In2000,Nokiaaccountedfor1%ofthetotalemploymentinFinland.Nokia’scontributiontothecountry’stotalemploymentisstillinthe0.6–0.7%range.Furthermore,Nokia’sshareofbusinessenterpriseR&DinFinlandhasre-mainedrelativelystableatslightlyover40%throughoutthe2000s.
AsaresultofNokia’sbothnationallyandgloballyuniqueroleinbothquantitativeandquali-tativeterms,consideringtheconsequencesofthecompany’sascent,dominance,anddescentprovidesimportantlessons.Thispaperisourfirststepinuncoveringthoselessons.Ourpur-poseinthispaperistodocumentsomeofthebasicdimensionsofthedataonNokiaandtode-velopabasisforadiscussionoffurtherareasofanalysiswiththeinternationalresearchcom-munity.
OurquestforuncoveringlessonsarisingfromthehistoryofNokiaissupportedbyFinland’smostexceptionalofficialstatistics,inwhichthepathsofvirtuallyallindividualsandorgani-zationscanbetracedfromthecradletothegraveinconsiderabledetail.Forthefirsttimeinhistory,wehavebeengrantedpermissiontoidentifyinofficialstatisticsonecompany,Nokia,
3 This calculation nevertheless illustrates how current practices in determining the GDP of a nation-state are at times ill-suited for the current era of globalization.

5Nokia’s Labor Inflows and Outflows in Finland: Observations from 1989 to 2010
andthecompany’sfuture,current,andformeremployees.Weareunawareofanypriorworkusingsimilardataorwiththesamestartingpoint.
Duringthe1990s,alargeshareofNokiarecruitswererecentcollegegraduates.MostoftheserecentgraduatesassumedvariousspecialistandmanagerialpositionsatNokia.Currently,No-kiaseemstobeagoodandappreciatedsourceofhighlyskilled,globallyorientatedlaborforotherbusinessesinFinland.TheindividualsdepartingfromNokiahavemostlyfoundmana-gerialandspecialistpositionsinotherlargecorporations.However,morerecently,thereisamarkedincreaseinthenumberofex-Nokiaemployeesworkingatstartups.
2 Our approach and datasetWeemployofficialregister-baseddataatStatistics Finland inourresearch.Inprinciple,ourdataformacompleterecordofallindividualsandallfirmsinFinlandovertheirlifespans.Toobtaininformationonindividuals,weutilizetheFinnish Linked Employer-Employee Database(FLEED)fortheperiodfrom1989to2010.
FLEEDcontainsdetailedindividual-levelinformationontheworking-agepopulationofFin-land(forexample:age,familyrelations,education,labormarketstatus,occupation,andwag-es).FLEEDalsoprovidesdataonemployment including the identificationcodeof theem-ployingorganization,whichcanthenbelinkedtodatainothercomprehensiveenterprise-lev-eldatabases.
WearegrantedpermissiontorecognizeNokiaandthecompany’semployeesforthepurposeofouranalysis.Intheremainderofthispaper,wetrackemployeeswhoworkedforNokiaatleastonceduringtheperiodfrom1989to2010.Usingthesedata,wecananalyzewhatanemployeehasperformedbeforeworkingatNokia,whattheemployeehasperformedatNokia,andwhattheemployeehasperformedsincedepartingfromNokia.
Figure2comparesNokia’semploymentnumbersfromFLEED(bars)toinformationonFinn-ishemploymentbythecompanyfromNokia’sannualreports(line).Themeasurementmeth-ods,includingthedefinitionofthetimingofemployment,arenotexactlythesame.Asare-sult,somediscrepancybetweenthesetwodatasourcesisexpected.Asseeninthegraph,thereare some discrepancies in the data for the period from 1989 to 1994. Otherwise, the head-countsinourdataseemtomatchthedatafromNokia’sannualreportsquitewell.Atthispoint,weareunabletoconfirmtheexactcauseofthediscrepanciesfortheperiodfrom1989to1994.However,thesediscrepanciesseemtorelatetotheconglomeratestrategythatNokiapursuedduringthe1980sandparticularlytothestructureofthecompany’stelevisionbusinessdivi-sion,forwhichNokiamadeseveralsizableacquisitionsduringthisperiod.Forexample,No-kiaacquiredSwedishLuxorin1984andGermanStandard Elektrik Lorenzin1987.Theseac-quisitionsandothernon-communicationsactivitieswerediscontinuedintheearly1990s.TheremainingpartsoftheTVbusinessweredivestedin1994.Presumably,someemployeesintheTVlineofbusinessweremovedtothe“core”ofNokia.BecauseourprimaryinterestisNokia’stelecombusiness,thissingularweaknessinourdatashouldnotbetooproblematic.

ETLA Raportit – ETLA Reports No 106
t-1
Inflows (t-1 not in Nokia, t in Nokia) Education and other employees’ personal
characteristics at year t-1 Industry and other firm characteristics at year t-1
Stock of employees staying in Nokia (t-1 & t in Nokia) Personal and firm characteristics at the time of first
recruitment
t
Outflows (t-1 in Nokia, t not in Nokia) Education and other employees’ personal
characteristics at year t Industry and other firm characteristics at year t
0
5 000
10 000
15 000
20 000
25 000
30 000
1989
1990
1991
1992
1993
1994
1995
1996
1997
1998
1999
2000
2001
2002
2003
2004
2005
2006
2007
2008
2009
2010
Number of employees in Nokia’s annual report
FLEED
Ourapproachinthisdescriptivestudyisasfollows:Welookatthecharacteristicsofthoseem-ployeesenteringNokia(inflow),thoseemployeesdepartingfromNokia(outflow),andthoseemployeesthatremainemployedbyNokia(stock).Figure3illustratesthissetup.TheinflowisdefinedasthegroupofemployeeswhowerenotemployedbyNokiaatperiodt–1andwhowereemployedbyNokiaatperiodt.Similarly,theoutflowisdefinedasthegroupofemploy-eeswhowereemployedbyNokiaatperiodt–1andwhowerenotemployedbyNokiaatperiodt.ThestockineachperiodisdefinedasthegroupofemployeeswhowereemployedbyNokiabothatt–1andatt.
Figure 2 The number of Nokia’s employees in Finland according to FLEED (bars) and according to the company’s annual reports (line)
Data: Statistics Finland and Nokia’s annual reports. The authors’ calculations.
Figure 3 The setup of our analysis

7Nokia’s Labor Inflows and Outflows in Finland: Observations from 1989 to 2010
Wedividethecharacteristicsofemploymentflowsintopersonalandenterpriseparts.
Personalcharacteristics:– Labormarketstatus(employed,unemployed,studyorequivalent,retired),– Age(under25years,25to29years,30to44years,45to59years,atleast60years),– Maritalstatus(single,cohabiting,divorced),– Fieldofeducation(technical,business,other),– Levelofeducation(PhD,master’s,somelowerlevelthanmaster’s),– Jobtitle(manager,specialist,clerical,production,other),and– Wagechange(increased/decreased,bothoverayearandtwoyearsbeforeorafterenter-
ingintoordepartingfromNokia).
Company-levelcharacteristics:– Sector(ICTmanufacturing,non-ICTmanufacturing,ICTservices,non-ICTbusiness
services,otherservices,publicsectorandother),– Companyage(under3years,3to5years,6to10years,atleast11years),and– Size(under10employees,10to49employees,50to249employees,atleast250employ-
ees).
Weconsiderfourperiods:– 1989to1994:Restructuringfromconglomeratetotelecommanufacturer,– 1995to2000:Intensegrowthcycle,– 2001to2007:Steadystate,and– 2008to2010:Crisis.
Figure4showstheaggregatelaborinflowstoandoutflowsfromNokiaduringthesefourperi-ods.Duringtheearly1990s,therewasasevererecessioninFinland.Duringthistimeperiod,Nokia streamlined thecompany’sbusiness focus fromadiversifiedconglomerate toapure-playcommunicationscompany.Thisrestructuringprocessresultedinover13,000employees
0
5 000
10 000
15 000
20 000
25 000
30 000
1989-1994 1995-2000 2001-2007 2008-2010
Inflows Outflows
Figure 4 Employee inflows to and outflows from Nokia
Data: Statistics Finland. The authors’ calculations.

ETLA Raportit – ETLA Reports No 108
leavingNokia,whilenearly12,000newemployeesjoinedthecompany.SubsequentlyNokia’srecruitment intensifiedbecausethecompany’s telecombusinessgrewrapidly.From1995to2000,Nokiarecruitedover27,000employees,whilearound10,000personsleftthecompany.Aftertheintensegrowthcycleexperiencedduringthelatterhalfofthe1990s,businessgrewmoresteadily.From2000to2007,around14,000personsjoinedNokia,whileapproximately13,000leftNokia.Asaresultoftheglobalfinancialcrisis,certainindustrydevelopments,andinternalmishaps,Nokia’sfortunesturned.Consequently,from2008to2010,over7,000em-ployeesleft,whileonly4,000joinedthecompany.
Intheremainderofthispaper,westudylaborinflowsandoutflowsbyanalyzingpersonalandorganizational characteristics. All inflow and stock characteristics are determined at thetimeapersoneitherjoinsorleavesNokia.Thus,weleaveroomforfurtheranalysestostudy,forexample,whethertheprobabilityofanemployee’sdivorceishigherorlowerwhentheem-ployeeisemployedbyNokiaandwhetherorganizationsthatemployformerNokia employeessubsequentlyover-orunder-perform.Alloutflowcharacteristicsaredeterminedatthetimeofanemployee’sdeparturefromNokia.
Weprovideasimilarlystructuredfigureforeachoftheafore-mentionedpersonalandorgan-izationalcharacteristics.The“endcomposition”thatwereportfortheyear2010isbasedonthestatusesofemployeesatthetimeatwhichtheseemployeesjoinedNokia.Thus,wedonot,e.g.,accountformarriagesanddivorceswhileatNokia.Wewillreportthecompositionsofin-flowsandoutflowsforthefourtimewindowsdefinedabove(annualfiguresareavailableup-onrequest).
Becausecertaininformationmay,e.g.,beconditionalonremaininginemploymentafterleav-ingNokia,eachfigurealsoreportstheinflowandoutflowheadcounts.
3 Personal characteristics
3.1 Labor market statusFigure5illustrateslaborinflows,outflows,andthestockinthefinalyearwithrespecttoem-ployeelabormarketstatuses(thelowerandupperbarsshowinflowsandoutflows,respective-ly). Ineachperiod,overhalfof thenewrecruitswereelsewhereemployed immediatelybe-foreworkingatNokia.Thisproportionwasthelargest(74%)fortheperiodfrom2008to2010andthelowest(51%)fortheperiodfrom1995to2000.Theshareofrecruits,whowereun-employedimmediatelybeforejoiningNokia,was10%oraboveinthe1990s,butdecreasedinthe2000s.StudentshavebeenanotablesourceofNokia recruits,especiallyduringtherapidgrowthfrom1995to2000,whenover10,000studentsjoinedthecompanytotaling38%ofallnewemployees.Theshareofstudentinflowshasdecreasedinthe2000sandwasthelowest(19%)fortheperiodfrom2008to2010.OftheemployeesthatworkedatNokiain2010,six-tenthswereemployedelsewherebeforejoiningNokia,one-thirdwascollegeoruniversitystu-dents,andone-tenthwasunemployedimmediatelybeforejoiningNokia.
TheemployeeswhohavedepartedfromNokiaseemtohavefoundnewemploymentquiteeas-ily.However,duringtheongoingglobalcrisisfindingnewemploymenthasbeenmorediffi-cultforex-Nokiaemployeescomparedtootherperiods,e.g.,theearly1990satwhichtimeFin-

9Nokia’s Labor Inflows and Outflows in Finland: Observations from 1989 to 2010
in in in in
out outoutout
19891994 19952000 20012007 20082010 Nokia’s structure in 2010
61%
7%
32%
Employed
Unemployed
Study
64% 51%65% 74%
13%10%
6%7%
23%38% 29% 19%
11 942 27 174 14 146 4 136
78%65% 68% 56%
10%15% 14% 29%
3%2% 3% 4%
9% 18% 14% 11%
13 432 10 716 13 240 7 350
RetiredNumber of persons joining and departing Nokia
landfacedadomesticfinancialcrisis.Duringtheperiodfrom2008to2010,roughlyhalfoftheemployeeswholeftNokia foundnewjobsimmediately,whereasintheearly1990s,asmanyasfour-fifthsfoundemploymentimmediatelyafterdepartingfromNokia.Consequently,theshareofunemployedex-Nokia employeeshasincreasedalmostthreefoldfromtheearlierpe-riodtothelaterperiod,eventhoughthesharesofindividualsleavingtostudy(11%vs9%)ortoretire(4%vs3%)remainquitestable.
3.2 Employee age Nokiahasrecruitedrelativelyyoungpeople,whichisespeciallynotablewhentakingintoac-countthelengthystudytimesinFinland.ThirtypercentofNokia employeesin2010wereun-der25yearsoldwhenrecruitedbyNokia,whereas60%werelessthan30yearsold.Only2%were45yearsorolderwhenjoiningNokiaforthefirsttime.Theshareofyoungrecruitswasthehighestduringthe intensivegrowthcycleduringthe latterhalfof the1990s,when64%ofnewcomerswereunder30yearsoldandalmost40%wereunder25yearsold.Incontrast,duringthefinaltwoperiodsunderstudy,theproportionofyoungrecruitsdeclined,whilethe
Figure 5 Nokia’s employment flows by labor market status
Data source: Statistics Finland. The authors’ calculations. Notes: Category “Study” also includes compulsory military serv-ice. The structure in 2010 is based on information on the first recruitment by Nokia.

ETLA Raportit – ETLA Reports No 1010
share of more experienced individuals increased. From 2008 to 2010, roughly every fourthnewcomerwasbetween30to44yearsoldandtheshareofemployeeswhowerelessthan25yearoldsdroppedto14%.
The share of 30–44 year olds (at the time of departure from Nokia) departing from Nokia hasbeenthelargestoutflowforalloftheobservationperiods,rangingfrom39%inthelate1990sto58%infrom2008to2010.Theshareofdepartingemployeesunder30wasthehigh-estoutflowduringthelatterhalfofthe1990s(48%)andthelowestoutflowfrom2008to2010(16%).Notably,employeestypicallydepartfromNokiawellbeforereachingretirementage.Onlyonetofourpercentofemployeesdepartingfromthecompanyatanygiventimeare60yearsorolder.
in in in in
out outoutout
19891994 19952000 20012007 20082010 Nokia’s structure in 2010
30%
31%
27%
2%
35% 38% 25% 14%
22%28%
26%25%
33%27% 33%
41%
8% 2% 3% 4%
11 942 27 174 14 146 4 136
13% 23%10% 5%
15%
25%
21%11%
44%
39%54%
58%
26%11% 13%
22%2% 1% 2% 4%
13 432 10 716 13 240 7 350
024 years
2529 years
3044 years
4559 years
60+ years
Figure 6 Nokia’s employment flows by employee age
Data source: Statistics Finland. The authors’ calculations. The structure in 2010 is based on information on the first re-cruitment by Nokia.
11Nokia’s Labor Inflows and Outflows in Finland: Observations from 1989 to 2010
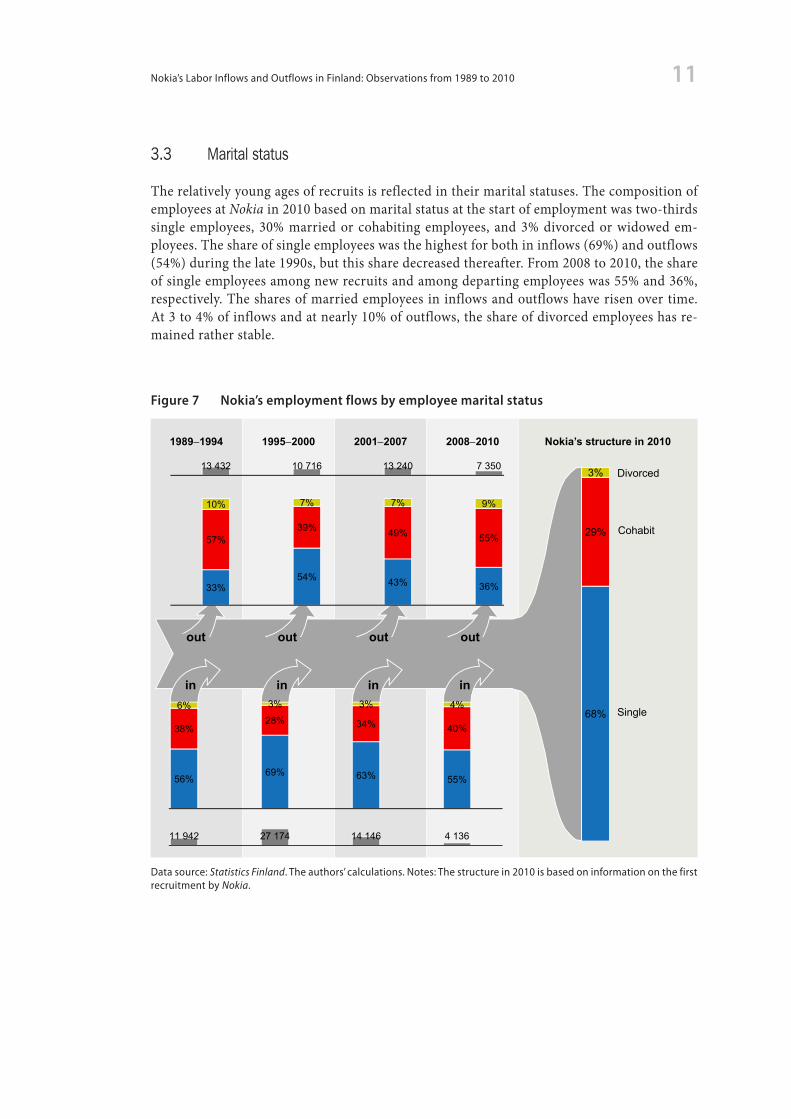
3.3 Marital statusTherelativelyyoungagesofrecruitsisreflectedintheirmaritalstatuses.ThecompositionofemployeesatNokiain2010basedonmaritalstatusatthestartofemploymentwastwo-thirdssingle employees,30%marriedor cohabitingemployees, and3%divorcedorwidowedem-ployees.Theshareofsingleemployeeswasthehighestforbothininflows(69%)andoutflows(54%)duringthelate1990s,butthissharedecreasedthereafter.From2008to2010,theshareofsingleemployeesamongnewrecruitsandamongdepartingemployeeswas55%and36%,respectively.Thesharesofmarriedemployeesininflowsandoutflowshaverisenovertime.At3to4%ofinflowsandatnearly10%ofoutflows,theshareofdivorcedemployeeshasre-mainedratherstable.
in in in in
out outoutout
19891994 19952000 20012007 20082010 Nokia’s structure in 2010
68%
29%
3%
Single
56%69% 63% 55%
38%28% 34% 40%
6% 3% 3% 4%
11 942 27 174 14 146 4 136
33%54% 43% 36%
57%39% 49% 55%
10% 7% 7% 9%
13 432 10 716 13 240 7 350Divorced
Cohabit
Figure 7 Nokia’s employment flows by employee marital status
Data source: Statistics Finland. The authors’ calculations. Notes: The structure in 2010 is based on information on the first recruitment by Nokia.

ETLA Raportit – ETLA Reports No 1012
3.4 Field of educationForty-threepercentofNokia’semployeesin2010studiedtechnicalsubjectmatter,17%stud-iedbusinessorthesocialsciences,andtheremaining40%studiedothersubjects.Astructur-alshiftseemstohavetakenplaceovertime:theshareofrecruitswithtechnicaleducationalbackgroundsdroppedfrom50%duringtheearly1990sto42%from2008to2010.Incontrast,theshareofrecruitswithbusiness-relatededucationalbackgroundsincreasedfrom14%from1989to1994to25%from2008to2010.Theshareofoutflowingemployeeswithtechnicaled-ucationalbackgroundshasbeenapproximately50to60%ineachperiod.Theshareofdepart-ingworkerswithbusiness-relatededucationalbackgroundsincreasedfrom15to16%duringthe1990sto23%from2008to2010.
in in in in
out outoutout
19891994 19952000 20012007 20082010 Nokia’s structure in 2010
43%
17%
40%
50% 45% 39% 42%
14% 15% 21% 25%
36% 40% 39% 33%
11 942 27 174 14 146 4 136
61% 51% 55% 59%
15%16%
21% 23%
24% 34% 24% 18%
13 432 10 716 13 240 7 350
Technical etc.
Business etc.
Other
Figure 8 Nokia’s employment flows by employee educational background
Data source: Statistics Finland. The authors’ calculations. Notes: The structure in 2010 is based on information on the first recruitment by Nokia.

13Nokia’s Labor Inflows and Outflows in Finland: Observations from 1989 to 2010
3.5 Level of educationOne-fourthofNokia’s employees in2010hadat leastamaster’s-leveldegree,and1%hadaPhDorequivalentdegree.Theshareofadvancedacademiclevelrecruitsincreasedgraduallyfrom22%duringtheearly1990sto56%from2008to2010.Theeducationallevelsofdepart-ingemployeesincreasedovertime.From1989to1994,22%ofdepartingNokia employeeshadamaster’s-leveldegree,whereasfrom2008to2010,theshareofdepartingemployeeswiththiseducationallevelwas62%.
in in in in
out outoutout
19891994 19952000 20012007 20082010 Nokia’s structure in 2010
1%
36%
63%
1% 1% 1% 2%21% 29%
43%54%
78% 70%56% 44%
11 942 27 174 14 146 4 136
1% 1% 2% 3%21% 30%
48%60%
78% 69%50% 38%
13 432 10 716 13 240 7 350
PhD or eq.
Master of eq.
Other (lower)
Figure 9 Nokia’s employment flows by employee level of education
Data source: Statistics Finland. The authors’ calculations. Notes: The structure in 2010 is based on information on the first recruitment by Nokia.
ETLA Raportit – ETLA Reports No 1014
in in in in
out outoutout
19951996 20002001 20052007 20082010 Nokia’s structure in 2010
4%
62%
15%
10%
9%
Production
Other (serv.)
5% 5% 5% 5%
53% 55% 54% 60%
18% 16% 15% 12%16% 11% 10% 8%8% 13% 16% 14%
886 932 3 389 2 217
4% 6% 15% 17%35%
49%
64% 59%12%10%
6% 8%43% 26%
8% 8%6% 10% 7% 7%
338 1 550 3 005 3 753
Specialist
Manager
Clerical
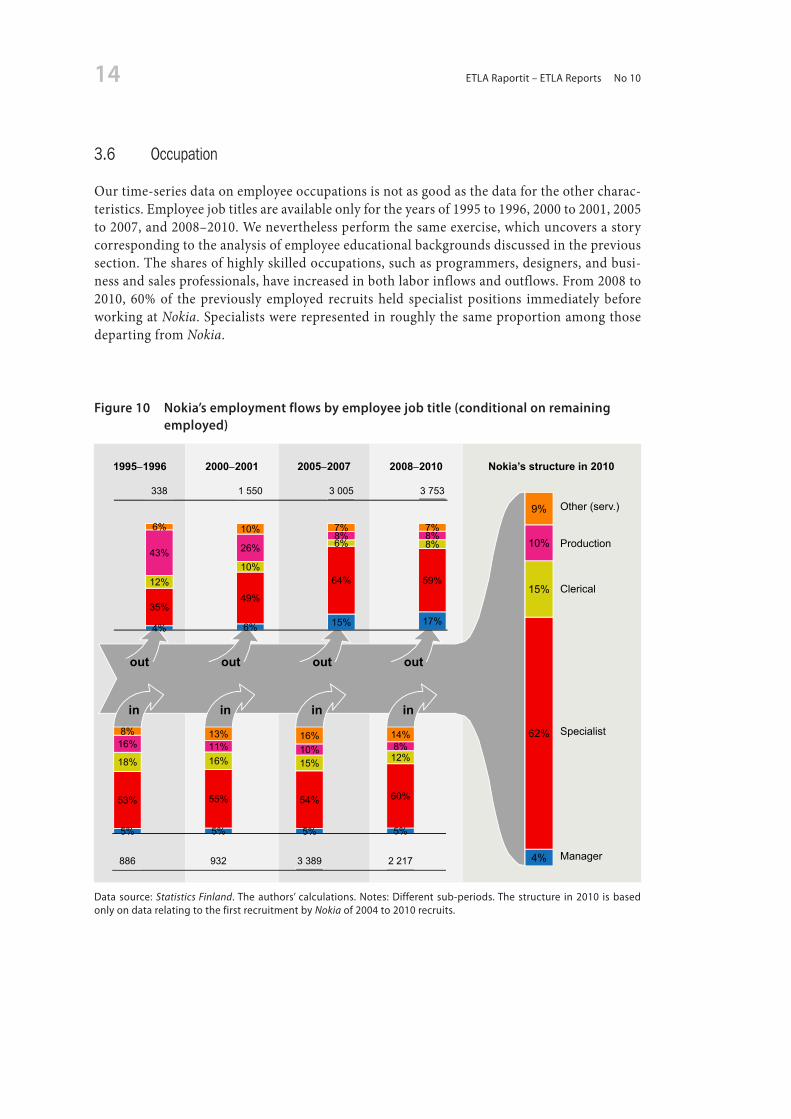
3.6 OccupationOurtime-seriesdataonemployeeoccupationsisnotasgoodasthedatafortheothercharac-teristics.Employeejobtitlesareavailableonlyfortheyearsof1995to1996,2000to2001,2005to2007,and2008–2010.Weneverthelessperformthesameexercise,whichuncoversastorycorrespondingtotheanalysisofemployeeeducationalbackgroundsdiscussedintheprevioussection.Thesharesofhighlyskilledoccupations,suchasprogrammers,designers,andbusi-nessandsalesprofessionals,haveincreasedinbothlaborinflowsandoutflows.From2008to2010, 60% of the previously employed recruits held specialist positions immediately beforeworkingatNokia.SpecialistswererepresentedinroughlythesameproportionamongthosedepartingfromNokia.
Figure 10 Nokia’s employment flows by employee job title (conditional on remaining employed)
Data source: Statistics Finland. The authors’ calculations. Notes: Different sub-periods. The structure in 2010 is based only on data relating to the first recruitment by Nokia of 2004 to 2010 recruits.

15Nokia’s Labor Inflows and Outflows in Finland: Observations from 1989 to 2010
3.7 Wage change during a one-year periodThree-fourthsoftheNokiaemployeesin2010receivedpayincreasesuponjoiningthecom-panycomparedtothewagelevelsoftheseemployeesoneyearpriortojoiningNokia.(Here,wedonotstudylaterwagedevelopmentsatNokia).Theshareofincomingemployeesachiev-ingpayincreaseswasthehighestfrom1995to2000(75%)andthelowestfrom1989to1994(58%).From1995to2000andfrom2008to2010,two-thirdsofoutgoingemployeesleftforbetter-paying jobs. From 1989 to 1994, the share of outgoing employees leaving Nokia forhigherpayingjobswasthelowest(49%)ofalloftheperiods.
in in in in
out outoutout
19891994 19952000 20012007 20082010 Nokia’s structure in 2010
75%
25%
58%75% 71% 67%
42%25% 29% 33%
7 131 12 527 6 928 2 217
49%69% 62% 68%
51%31% 38% 32%
9 896 5 980 7 698 3 753
Increased
Decreased
Figure 11 Nokia’s employment flows by employee wage increase during a one-year period (conditional on remaining employed)
Data source: Statistics Finland. The authors’ calculations. Notes: Wages have been deflated by the index of wage and sal-ary earnings. The structure in 2010 is based on information on the first recruitment by Nokia.

ETLA Raportit – ETLA Reports No 1016
3.8 Wage change during a two-year periodTheanalysisofwagechangesintheprevioussectionmaybebiasedbybonusesandotherex-traordinarypayments.Thus,weperformed the sameexercise forwagechangesovera two-yearperiod.Thisnewanalysis increasestheshareofemployeeswhosewage level increaseduponjoiningNokia.NinetypercentofNokiaemployeesin2010receivedpayincreasesuponjoiningthecompanyusingthetwo-yearcriterion.Theshareofinflowsforthischaracteristicwasthehighest(88%)duringthelatterhalfofthe1990sandthelowest(66%)duringtheear-ly1990s.Notabledifferencesariseinthisanalysisforoutflowscomparedtotheone-yearwagechangeanalysis.Duringtheearly1990s,61%ofNokia’sdepartingemployeesreceivedpayrais-es(comparedto49%intheprevioussection).From2008to2010,wagesincreasedfor40%ofdepartingNokiaemployees(comparedto68%intheprevioussection).
90%
10%
in in in in
out outoutout
19891994 19952000 20012007 20082010 Nokia’s structure in 2010
66%88% 86% 83%
34%12% 14% 17%
7 131 12 527 6 928 2 217
61%76%
58%40%
39%24%
42%60%
9 896 5 980 7 698 3 753
Increased
Decreased
Figure 12 Nokia’s employment flows by a person’s wage increase, over 2 years (conditional on remaining in employment)
Data source: Statistics Finland. The authors’ calculations. Notes: Wages have been deflated by the index of wage and sal-ary earnings. The structure in 2010 is based on information on the first recruitment by Nokia.

17Nokia’s Labor Inflows and Outflows in Finland: Observations from 1989 to 2010
in in in in
out outoutout
19891994 19952000 20012007 20082010 Nokia’s structure in 2010
20%
11%
16%
8%
28%
18%
ICT manuf.
Other services
Public sector etc.
47%28%
5% 2%
17%
13%
7% 6%
2%
8%
24% 31%
2%5%
11% 15%
15%24% 36% 32%
16% 21% 16% 13%
7 131 12 527 6 928 2 217
14% 18% 14%2%
55%20%
10%11%
1%
16%24%
22%
1%5% 11%
12%
9%17% 24%
23%
21% 24% 17%31%
9 896 5 980 7 698 3 753
ICT services
Non-ICT manuf.
Business serv. (exl. ICT)
4 Organizational characteristics
4.1 IndustryOvertime,Nokia’sbusinessemphasishasshiftedfrommanufacturingtowardsservices,whichisreflectedthroughtheoriginatingindustriesofthecompany’srecruits:theshareofrecruitsfrommanufacturinghasdeclinedfrom64%intheearly1990sto8%from2008to2010.Incontrast,recruits fromICTservices increasedfrom2%inthefirsthalfof the1990sto31%from2008to2010.
The shareofdepartingemployeesmoving toothermanufacturing firmshasalsodecreasedfrom69%intheearly1990sto13%from2008to2010.Manydepartingemployeesenterthepublic sector (which in our definition includes universities, public research institutes, andothernon-profitorganizations).Thesharemovingtothepublicsectorwasthe largestfrom2008to2010(31%).
Figure 13 Nokia’s employment flows by sector (conditional on remaining in employment)
Data source: Statistics Finland. The authors’ calculations. Notes: The structure in 2010 is based on information on the first recruitment by Nokia.

ETLA Raportit – ETLA Reports No 1018
HalfoftheNokiaemployeesin2010hadpreviouslybeenemployedinprivatesectorservices.In2010,one-thirdwaspreviouslyemployedinmanufacturing,whileone-fifthwasprevious-lyemployedinthepublicsector.Nearlyone-thirdin2010hadbeenrecruitedfromotherICTfirmseitherinmanufacturingorservices.
4.2 Firm sizeOverhalfofNokiaemployeesin2010werepreviouslyemployedbyanotherlargefirm(withat least250employees inFinland).Theshareof inflows fromlarge firmswas the largest intheearly1990s(74%),butthisshareofinflowshasgraduallydecreasedto50%from2008to2010.Duringthelattertimeperiod,theshareofmid-sizedfirmsasasourceofrecruitsgrewfrom12%to28%.Thesharesofoutflowsaresimilar to thesharesof inflows.Furthermore,from2008to2010,everyfifthemployeedepartedtoasmall(0to49employees)ormicro(0to9employees)firm.
in in in in
out outoutout
19891994 19952000 20012007 20082010 Nokia’s structure in 2010
9%
14%
21%
56%
6% 10% 9% 8%8%14% 16% 14%12%17% 27% 28%
74%58% 47% 50%
6 018 9 936 5 755 1 924
4% 9% 10% 18%7%18% 15%
18%13%
20% 19%25%
77%53% 56%
40%
8 012 4 560 6 454 2 585
1049 empl.
50249 empl.
250+ empl.
09 empl.
Figure 14 Nokia’s employment flows by firm size (conditional on remaining in private sector employment)
Data source: Statistics Finland. The authors’ calculations. Notes: The structure in 2010 is based on information on the first recruitment by Nokia.
19Nokia’s Labor Inflows and Outflows in Finland: Observations from 1989 to 2010
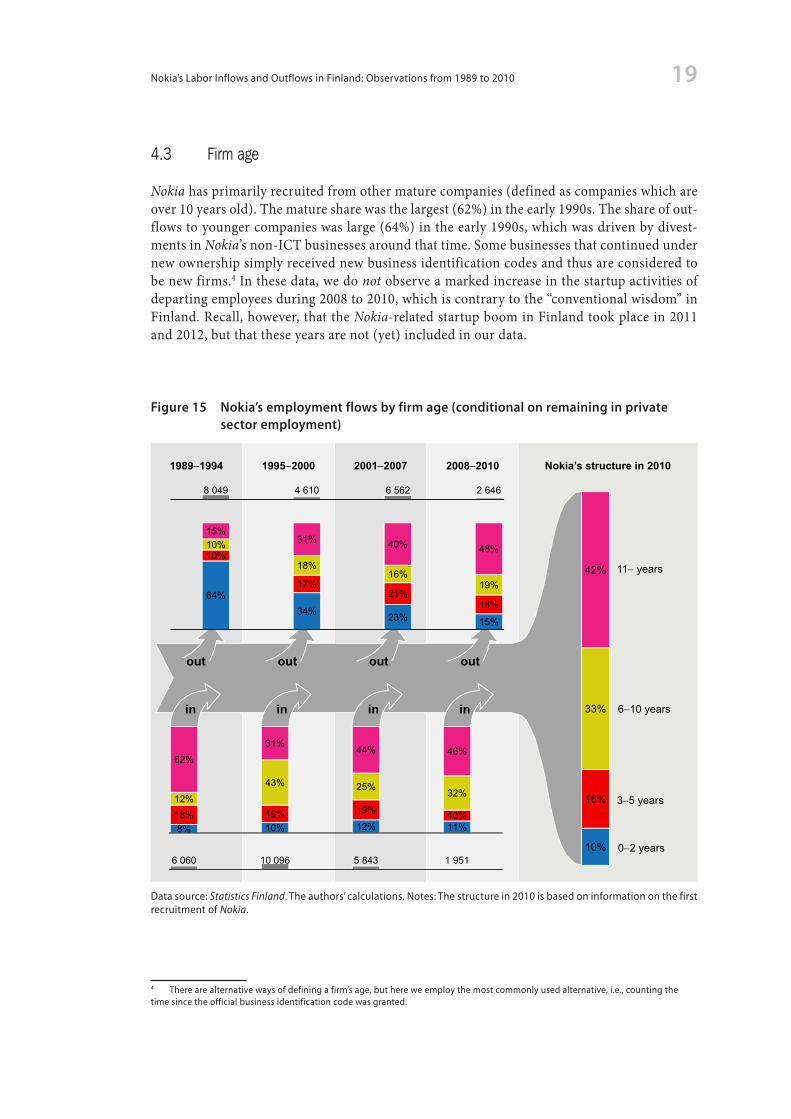
4.3 Firm age Nokiahasprimarilyrecruitedfromothermaturecompanies(definedascompanieswhichareover10yearsold).Thematuresharewasthelargest(62%)intheearly1990s.Theshareofout-flowstoyoungercompanieswaslarge(64%)intheearly1990s,whichwasdrivenbydivest-mentsinNokia’snon-ICTbusinessesaroundthattime.Somebusinessesthatcontinuedundernewownershipsimplyreceivednewbusinessidentificationcodesandthusareconsideredtobenewfirms.4Inthesedata,wedonotobserveamarkedincreaseinthestartupactivitiesofdepartingemployeesduring2008to2010,whichiscontrarytothe“conventionalwisdom”inFinland.Recall,however,thattheNokia-relatedstartupboominFinlandtookplacein2011and2012,butthattheseyearsarenot(yet)includedinourdata.
4 There are alternative ways of defining a firm’s age, but here we employ the most commonly used alternative, i.e., counting the time since the official business identification code was granted.
in in in in
out outoutout
19891994 19952000 20012007 20082010 Nokia’s structure in 2010
10%
16%
33%
42%
02 years
8% 10% 12% 11%18% 16% 19% 10%
12%43% 25% 32%
62%
31%44% 46%
6 060 10 096 5 843 1 951
64%34% 23% 15%
10%
17%21%
18%
10%
18%16%
19%
15%31% 40% 48%
8 049 4 610 6 562 2 646
35 years
610 years
11 years
Figure 15 Nokia’s employment flows by firm age (conditional on remaining in private sector employment)
Data source: Statistics Finland. The authors’ calculations. Notes: The structure in 2010 is based on information on the first recruitment of Nokia.

ETLA Raportit – ETLA Reports No 1020
5 DiscussionInpartbecauseoftherelativelysmallsizeofFinland,Nokia’sdirecttangibleimpactonFin-landhasbeenhuge.Arguably,Nokia’sgreatestimpactonFinlandhasneverthelessbeenintan-gibleinnature:NokiaprovidedFinnishcitizenswithhands-onknowledgeofhowtosucceedinglobalbusiness.AsaresultofNokia’ssuccess,Finlandgrewmoreinternational,prosper-ous,andinformation-intense.
BecauseofthecharacteristicsofbothNokiaandFinlandaswellasduetobothdomesticandglobalturmoilinthesurroundingenvironment,thecontextinthispaperresemblesalabora-toryexperimentontheimpactofasinglecompanyonacountry.
In recent years, Nokia has reduced recruitment directly from colleges and universities. Thelevel of formal education obtained by Nokia recruits has nevertheless risen over time. Thedominanceofengineeremployeeshasdeclinedovertime.Particularlyduringthe1990s,No-kia recruitedrelativelyyoungpeople.Byand large,recruitshaveassumedvariousspecialistandmanagerialpositionsatNokia.
Duringthe2000s,Nokia seemstohavebeenagoodsourceofhighlyskilled laborforotherbusinessesinFinland.Typically,departingex-Nokiaemployeesseemtohavefoundemploy-mentinhigh-levelmanagerialandspecialistpositions.Morerecently,anincreasingshareofNokiaemployeeshasbeenemployedatstartups.Presumably,thistendencywillbemorepro-nouncedwhentheyears2011and2012areconsidered(yettobeaddedtoourdata).Duringthemostrecentperiod,thelevelofmigrationofex-Nokia employeestopublicsectorjobshasalsogrown.
Nokia’sascent,dominance,anddescenthavesignificantlyimpactedlaborflowsinFinland.Inthispaper,wehavedocumentedsomeofthebasicdimensionsoftheseflowswiththepurposeofengagingothermembersoftheinternationalresearchcommunityinthinkingaboutpossi-blefutureresearchandanalysisquestionsrelatingtoNokia’semploymentdata.Weareopentosuggestionsandlookforwardtofindingnewcollaboratorsandco-authors!

21Nokia’s Labor Inflows and Outflows in Finland: Observations from 1989 to 2010

ETLA Raportit – ETLA Reports No 1022
Elinkeinoelämän tutkimuslaitosThe Research Institute of the Finnish EconomyLönnrotinkatu 4 B00120 Helsinki
ISSN-L 2323-2447, ISSN 2323-2447, ISSN 2323-2455 (Pdf )
Puh. 09-609 900Fax 09-601 753
Aikaisemmin ilmestynyt ETLA Raportit-sarjassa (ennen ETLA Keskusteluaiheita) Previously published in the ETLA Reports series (formerly ETLA Discussion Papers)
No 1 Nuutti Nikula – Markku Kotilainen, Determinants for Foreign Direct Investment in the Baltic Sea Region. 6.11.2012. 30 p.
No 2 Olavi Rantala, EU:n ilmastopolitiikan talousvaikutukset vuoteen 2020. 26.11.2012. 44 s.
No 3 Jukka Lassila – Tarmo Valkonen, Julkisen talouden rahoituksellinen kestävyys. 21.1.2013. 26 s.
No 4 Jukka Lassila – Niku Määttänen – Tarmo Valkonen, Kuntaeläkkeiden rahoitus ja kunnalliset palvelut. 30.1.2013. 30 s.
No 5 Niku Määttänen – Tarmo Valkonen, Asunnot eläkkeiksi? 18.2.2013. 26 s.
No 6 Ville Kaitila – John McQuinn – Iulia Siedschlag – Xiaoheng Zhang, International Investment and Firm Performance: Empirical Evidence from Small Open Economies. 1.3.2013. 40 p.
No 7 Paavo Suni – Vesa Vihriälä, Euro – How Big a Difference: Finland and Sweden in Search of Macro Stability. 4.3.2013. 14 p.
No 8 Ville Kaitila – Markku Kotilainen, EU:n ja Yhdysvaltojen mahdollisen kauppa- ja investointikumppanuus- sopimuksen vaikutuksia suomalaiselle elinkeinoelämälle ja yhteiskunnalle. 5.3.2013. 57 s.
No 9 Mika Maliranta – Vesa Vihriälä, Suomen kilpailukykyongelman luonne. 11.4.2013. 21 s.
Sarjan julkaisut ovat raportteja tutkimustuloksista ja väliraportteja tekeillä olevista tutkimuksista.
Julkaisut ovat ladattavissa pdf-muodossa osoitteessa: www.etla.fi » julkaisut » raportit
Papers in this series are reports on research results and on studies in progress.
Publications in pdf can be downloaded at www.etla.fi » publications » reports