nomura funds ireland plc · although stocks within the korean portfolio like daewoo securities , gs...
TRANSCRIPT
NOMURA FUNDS IRELAND PLC
Interim Report and Unaudited Financial Statements for the period from
incorporation (13th April, 2006) to 30th June, 2007
Company Registration No. 418598
NOMURA FUNDS IRELAND PLC
1 1
TABLE OF CONTENTS
Page
GENERAL INFORMATION 2 INVESTMENT MANAGER’S REPORT
- GLOBAL EMERGING MARKETS FUND 4 - INDIA EQUITY FUND 8 - ASIA PACIFIC EX-JAPAN EQUITY FUND 11
STATEMENT OF INVESTMENTS
- GLOBAL EMERGING MARKETS FUND 12- INDIA EQUITY FUND 27- ASIA PACIFIC EX-JAPAN EQUITY FUND 29
STATEMENT OF CHANGES IN THE PORTFOLIO
- GLOBAL EMERGING MARKETS FUND 32- INDIA EQUITY FUND 33 - ASIA PACIFIC EX-JAPAN EQUITY FUND 34
BALANCE SHEET 35
INCOME STATEMENT 36
STATEMENT OF CHANGES IN NET ASSETS ATTRIBUTABLE TO HOLDERS OF REDEEMABLE PARTICIPATING SHARES
37
CASH FLOW STATEMENT 38
NOTES TO THE FINANCIAL STATEMENTS 39 MANAGEMENT AND ADMINISTRATION 56
NOMURA FUNDS IRELAND PLC
2
GENERAL INFORMATION Nomura Funds Ireland Plc (the “Company”) is structured as an open-ended investment umbrella fund with variable capital and segregated liability between its sub-funds, incorporated under the laws of Ireland on 13th April, 2006 as a public limted company pursuant to the Companies Acts, 1963 to 2006. The Company has been authorised by the Financial Regulator as an investment company pursuant to the provisions of the European Communities (Undertakings for Collective Investment in Transferable Securities) Regulations, 2003 (as amended) (the “UCITS Regulations”.) The Company commenced operations on 18th December 2006. There are currently redeemable participating shares of three sub-funds (the “Sub-Funds”) in issue, the Global Emerging Markets Fund, The India Equity Fund and the Asia Pacific Ex-Japan Equity Fund. The Company currently offers the following share classes in each of the Sub-Funds. Sub Fund Share Classes Launch Date Launch Price Currency Global Emerging Markets Fund Class B 18th December 2006 100 USD India Equity Fund Class A 12th January 2007 100 INR Class B 12th January 2007 100 INR Asia Pacific Ex-Equity Fund Class A 28th June 2007 100 USD Global Emerging Markets Fund The investment objective of the Global Emerging Markets Fund is to achieve long-term capital growth through investment in an actively managed portfolio of global emerging market securities. The Global Emerging Markets Fund shall invest, under normal market conditions, primarily in equity and equity related securities (which includes but is not limited to equities, depositary receipts, convertible securities, preferred shares and structured notes) listed or traded on a recognised exchange in the countries covered by the MSCI Emerging Markets Index (the “Index Countries”). The Global Emerging Markets Fund may invest in equity and equity related securities listed or traded on any recognised exchange in non-Index Countries provided that the business activities of the issuers of such securities are in the Index Countries or in other emerging countries. The Global Emerging Markets Fund may also hold exposure to the Index Countries through investment in such instruments as American Depositary Receipts (ADRs), Global Depositary Receipts (GDRs) or Non-Voting Depositary Receipts (NVDRs) and which may be listed on any recognised exchange in a non-Index Country. The Global Emerging Markets Fund will invest across the entire range of capitalisations (from small cap to large cap). Investment in equity and equity related securities in Russia is not expected to exceed twice the percentage weighting of Russian securities held by the MSCI Emerging Markets Index. The performance of the Global Emerging Markets Fund’s portfolio of investments will be measured against the MSCI Emerging Markets Index which is a free float adjusted market capitalisation index that is designed to measure equity market performance in the global emerging markets. The Investment Manager is, however, entitled at any time to change the Index where, for reasons outside the Investment Manager's control, the Index has been replaced by another index or where another index may reasonably be considered by the Investment Manager to have become the industry standard for the relevant exposure.
NOMURA FUNDS IRELAND PLC
3
GENERAL INFORMATION (CONTINUED) India Equity Fund
The investment objective of the India Equity Fund is to achieve long-term capital growth through investment in an actively managed portfolio of Indian securities. The India Equity Fund shall invest, under normal market conditions, primarily in equity and equity related securities listed or traded on a recognised exchange in India. The India Equity Fund may invest in equity and equity related securities listed or traded on any recognised exchange outside India provided that the business activities of the issuers of such securities are in India. The India Equity Fund may also hold exposure to India through investment in such instruments as American Depositary Receipts (ADRs), Global Depositary Receipts (GDRs) and which may be listed on any recognised exchange outside India. The India Equity Fund will invest across the entire range of capitalisations (from small cap to large cap). The performance of the India Equity Fund’s portfolio of investments will be measured against the MSCI India Index. The Investment Manager is, however, entitled at any time to change the Index where, for reasons outside the Investment Manager's control, the Index has been replaced by another index or where another index may reasonably be considered by the Investment Manager to have become the industry standard for the relevant exposure. The India Equity Fund will be managed so as to maintain a near fully invested position, other than during periods where the Investment Manager believes that a larger cash position is warranted. Asia Pacific Ex-Japan Equity Fund The investment objective of the Asia Pacific Ex-Japan Equity Fund is to achieve long term capital growth through investment in an actively managed portfolio of Asia Pacific (excluding Japan) securities. The Asia Pacific Ex-Japan Equity Fund shall invest under normal market conditions, primarily in equity and equity related securities listed or traded on a recognised exchange in the countries covered by the MSCI All Countries Asia Pacific Ex-Japan Index (the “Index Countries”). The Asia Pacific Ex-Japan Equity Fund may invest up to 20% of its net assets in equity and equity related securities listed or traded on any recognised exchange in non Index countries provided that the business activities of the issuers of such securities are in the Index Countries. The Asia Pacific Ex-Japan Equity Fund may also hold exposure to the Index Countries through investment in such instruments as American Depositary Receipts (ADRs) and Global Depositary Receipts (GDRs) and which may be listed on any recognised exchange in a non-Index Country. The Asia Pacific Ex-Japan Equity Fund will invest across the entire range of capitalisations (from small cap to large cap). The performance of the Asia Pacific Ex-Japan Equity Fund’s portfolio of investments will be measured against the Index. The Investment Manager is however entitled at any time to change the Index, where for reasons outside the Investment Manager’s control, the Index has been replaced by another index or where another index may reasonably be considered by the Investment Manager to have become the industry standard for the relevant exposure.
NOMURA FUNDS IRELAND PLC
4
GLOBAL EMERGING MARKETS FUND INVESTMENT MANAGER’S REPORT For the period from 13th April, 2006 (date of incorporation) to 30th June, 2007 The Global Emerging Markets Fund continued its rising trend over the first half of 2007, with the MSCI EM up by 17.55% (USD basis). The Fund outperformed the benchmark by 1.34%, delivering an absolute performance of 18.89%. Since inception, on the 18th December 2006, the fund has outperformed the benchmark by 1.62%, with a performance of 22.00%. The fund is managed on a regional basis by the three designated managers: Nomura Asset Management Singapore covers emerging Asia (approximately 53% of the fund), Charlemagne Capital covers emerging Europe, Middle East and Africa (EMEA) (approximately 26% of the fund) and Gartmore Investment Management covers Latin America (approximately 21% of the fund). There is no co-ordination of investment strategy and each manager is completely independent in their decisions and management of their regional sub-portfolios. Consequently the interim report investment commentary is presented on a regional basis with Asia first, followed by EMEA and finishing with Latin America. Nomura Asset Management Singapore - Emerging Asia Market Review / Economy (Emerging Asia) For the first six months of 2007, the MSCI AC Asia Pacific Ex-Japan Free Index rose a substantial 18.45%. In terms of individual markets, the Philippines and Malaysia were the leaders, followed by China, Thailand and India. Underperforming markets included Indonesia and Taiwan. In China, the economic environment remained strong with first quarter GDP growing at 11.1%. Investors were also encouraged by the actions taken by the Chinese government, including the 1% increase in reserve requirements of commercial banks, the increase in lending rates and the increase in stamp duties, which were all much milder than expected. Furthermore, in a bid to reduce the upward pressure on the currency, the government eased the QFII quota of commercial banks to invest in stocks on the Hong Kong exchange. In India, after profit taking in the first quarter, investors returned on signs that inflation was starting to trend down. From the high 6% levels throughout the first quarter of the calendar year, the wholesale price index has gradually eased to around the 4% level in June. The economic environment was also positive with fiscal fourth quarter GDP growth reported at 9.1% compared to 8.7% in the previous quarter. In terms of the smaller markets, economic conditions are robust in both Thailand and the Philippines. More importantly, investors are showing more interest in these two markets since they have generally lagged behind the other markets in the region. Performance Review / Portfolio Highlights (Emerging Asia) The emerging Asia sub-portfolio underperformed its benchmark by 0.19% for the period under review. Stock selection contributed positively to the performance of the fund, while the overall country allocation effect was negative. Stock selection activity in India, Malaysia, Taiwan, and Thailand added value, but was negative in China, Indonesia and South Korea. The negative country allocation effect was mainly due to lack of exposure in Pakistan, this was partially offset by our underweight exposure in India and Taiwan. In Taiwan, the significant positive stock selection result was primarily due to the overweight positions in Hon Hai Precision Industry, Formosa Plastics, and D-Link. Shares of D-Link continued their robust performance, underpinned by its strong sales to SOHO/SME customers in emerging markets and the expected earnings contribution of new wireless standards such as 802.11n. Meanwhile, overweight positions in Advantech and Taiwan Secom hurt the portfolio. An underweight position in Mediatek was also negative. On the other hand, the performance of the Korean portfolio was disappointing in the second quarter of 2007. The gainers were the medium and small cap stocks and also heavy industrials stocks which rallied significantly. Although stocks within the Korean portfolio like Daewoo Securities, GS Engineering and Construction, and Daewoo Shipbuilding participated in this rally, other holdings, which mainly comprised blue chips, lagged behind. This included stocks like Samsung Electronics which suffered from the weak DRAM and NAND flash spot prices and more defensive consumer names like Hite Brewery and Shinsegae.
NOMURA FUNDS IRELAND PLC
5
GLOBAL EMERGING MARKETS FUND INVESTMENT MANAGER’S REPORT (CONTINUED) For the period from 13th April, 2006 (date of incorporation) to 30th June, 2007 Strategy and Future Outlook (Emerging Asia) Asia Pacific markets have been very strong for the year to date, and our longer-term view of the Asian markets remains unequivocally positive. The global economy continues to grow at a healthy pace; and although interest rates are rising, this is partly due to lower savings rates in developing countries as consumption rises. We expect this consumption growth to accelerate and when added to the expected pick up in capital investment and infrastructure spending in the Asia Pacific region, this could point to further corporate profit growth. However, in the shorter term, we are predicting a period of consolidation. Credit spreads globally are rising and we feel that problems in the sub prime mortgage market and an impending unwinding of the low grade Collateralised Debt Obligation (CDO) market could be potentially contagious for the Asia Pacific region. We are also closely watching the China domestic “A” share market. It is not surprising that the market is so strong; after all, much of the world’s liquidity resides in China. However, we are concerned that the authorities might overreact and introduce policies that could exacerbate any future decline. Given our short-term concerns, we will endeavour to maintain a relatively cautious investment stance. However, we also believe this period of consolidation will be an ideal time to increase the risk exposure of our portfolios. It is our view that the next stage of this bull market will be more heavily influenced by domestic investors. These investors have been largely absent from the market recently, but a combination of low interest rates, rising wages and property prices, and improved confidence generally means they should become more active. Retail investors tend to favour small and mid cap companies. As such, we will utilize this expected period of weakness to reduce the large cap bias of our portfolios. The Philippines has also performed well, but the liquidity position is extraordinarily loose, courtesy of the $US1.0 billion plus per month of Overseas Foreign Worker (OFW) remittances. With inflation and interest rates low, we believe the Central bank will not intervene and this liquidity will increasingly find its way into asset markets. We are also seeing a number of interesting new IPOs in this market. We have made no changes to our overweight positions in Chinese equities. Our market specialists have become more positive about the domestic property market. In Taiwan, we will utilize the recent strength in financial share prices to move further underweight and use the proceeds to add to the basic material sector with its low PE ratio. We will also reduce the exposure to financial companies in Korea after a period of outperformance. Charlemagne Capital - EMEA Market Review / Economy (EMEA) Emerging stock markets continued to trend higher over the first six months of the year, apart from a marked correction in late February / early March as fears of a further tightening of US monetary policy threw doubts over continued global expansion in general and booming property markets in particular. Such fears however proved to be largely misplaced and against an economic and political backdrop that remained essentially benign, corporate profits continued to grow at least as strongly as expected and emerging stock markets soon recovered their poise and resumed their upward trend. Markets have also experienced short periods of volatility, in part due to the gyrations of energy prices, in part due to some concern over the increasingly strident approach that Russia appears to be adopting on the world stage. However, investor appetite for risk remained strong, as illustrated by a number of very large public offerings that were broadly successful. Investors in Turkey, for example, were also not overly concerned by a number of developments that on other occasions could have prompted sharp share price falls. Economies across Africa continued to mature, and although further down the development curve, progress in many countries has been encouraging. Performance Review / Portfolio Highlights (EMEA) The EMEA sub-portfolio outperformed its MSCI Emerging Markets EMEA Index benchmark on a consistent basis over the first half of 2007, rising 14.8% in value against a 9.0% return from the benchmark. It returned a positive absolute performance in four out of the six months under review. The second quarter saw the strongest outperformance as markets recovered strongly from earlier weakness.
NOMURA FUNDS IRELAND PLC
6
GLOBAL EMERGING MARKETS FUND INVESTMENT MANAGER’S REPORT (CONTINUED) For the period from 13th April, 2006 (date of incorporation) to 30th June, 2007 Performance Review / Portfolio Highlights (EMEA) (continued) The EMEA sub-portfolio generates its return from selecting undervalued and underappreciated companies across the region, whilst at the same time keeping within a strict risk framework. In this respect, it has found Africa to be a fertile hunting ground. One example is Mintails, a small South African gold miner with whom we have a strong relationship, where we increased our exposure over the period under review. The company subsequently announced that it had discovered significant deposits of recoverable higher value uranium, and its share price has more than doubled as a result. Exposure to European banks has also proved to be successful; OTP Bank, a Hungarian bank with regional ambitions, rose by 26.5% over the six months under review as the market has begun to recognise the quality of its management and the opportunities that lie ahead. Sberbank, another key holding for the sub-portfolio, rose 10.3% after the market digested a mammoth rights issue. Another success has been European Minerals, a Kazak gold mining company, which gained 93.2% ahead of starting production later this year, reflecting the higher prices that its output will now fetch on world markets. Strategy and Future Outlook (EMEA) The underlying economic backdrop remains supportive for emerging European equity markets, with GDP growth robust and inflation generally under control. Interest rates seem unlikely to rise significantly further. This is a backdrop against which successful companies can prosper. The earnings growth thus generated provides protection against inevitable periods of volatility as underlying stock markets sometimes have a tendency to get ahead of themselves. As economies across the region grow and mature, they are becoming less dependent upon energy and raw material production, with consumer participation becoming more significant. The sub-portfolio is well positioned to benefit from such a trend, with an overweight exposure to the consumer sectors as a result of holdings in selected companies where current valuations appear undemanding. The EMEA region is likely to attract further funds as investors seek out the greatest growth potential. Risks remain, but a mature and considered approach seems likely to bring rewards. Gartmore Investment Management - Latin America Market Review / Economy (Latin America) In the first half of 2007, the benchmark MSCI EM Latin America Index gained 27.1% in US dollar terms, outperforming global equities by more than 100%. Latin equity markets have outperformed all other regions over a five-year timescale. The strength of the global economy has been an important factor driving growth. International trade flows have been boosted by the emergence of worldwide production markets, where companies seek competitive advantage. Rapid urbanisation and industrialisation has generated demand for commodities for construction and infrastructure development. Industrialisation has led to job-creation and growing consumer purchasing power. At the same time, rising productivity has made it possible for higher commodity prices to be absorbed without significant rises in the prices of consumer goods. We allocate the most significant weightings in the Nomura Ireland Fund to Brazil and Mexico. Over the last twelve years, Brazil has moved from a situation of political and economic instability towards greater democracy and a positive growth outlook. The central bank has raised its economic growth forecast from 4.1% to 4.7% for 2007, while reducing its inflation forecast. This opens the way for another interest rate cut following the 0.5% reduction in June. Mexican President Felipe Calderon has enjoyed rising popularity as his early initiatives as the ‘President of Employment’ have been well supported. In 2007 he began to address the issue of pension reform, and prepared new legislation which will attempt to boost tax revenue collection from the lowest level in Latin America after Guatemala. While evidence has emerged on the slowing of Mexico’s economy, we maintain our overweight as the most recent data shows growth picking up in Mexico’s major trading partner, the US, in May.
NOMURA FUNDS IRELAND PLC
7
GLOBAL EMERGING MARKETS FUND INVESTMENT MANAGER’S REPORT (CONTINUED) For the period from 13th April, 2006 (date of incorporation) to 30th June, 2007 Performance Review / Portfolio Highlights (Latin America) The Latin America sub-portfolio returned 29.7% in the six months to June, gross of tax and fees, outperforming the benchmark MSCI EM Latin America Index by 2.6%. Global demand for commodities helped make Minera Atacocha, the Peruvian metals producer, a key contributor in the period under review. With metals prices firm, we highlight Brazilian iron-ore producer MMX Mineracao, the Chilean mining company Quimica y Minera, and Minera El Brocal of Peru. Confab Industrial, the Brazilian producer of steel tubes for oil and gas pipelines, has been a significant contributor in infrastructure, with shares buoyed by government plans to accelerate spending on fixed asset investments. We also favour the Brazilian highway management company Cia de Concessoes Rodoviarias (CCR). Roads are critical in export logistics, and further privatisations are expected on key routes. The strengthening Brazilian real, a key trend in 2007, should help our overweight in consumer discretionary stocks. Forecasts suggest sales at Brazilian clothing retailer Lojas Renner will be sharply higher in H1 2007. We exited from Bancolombia in April as we perceived the bank’s earnings outlook to be deteriorating. Steelmaker Ternium also disappointed, due to comments by Venezuelan President Hugo Chavez about the possible seizure of assets in the sector. Our underweight in Brazilian steelmaker Usinas Siderurgicas de Minas Gerais (Usiminas) also detracted, with the company expected to benefit from an investment grade rating achieved in June. Strategy and future outlook (Latin America) We maintain our positive view of the Latin region. At global level, the positive growth stimulus offered by the US economy may have moderated, but Europe’s contribution has notably improved. This, combined with the demands of dynamic Asian economies such as China and India, offers the prospect of maintained demand for commodities and finished products from Latin economies. At country level, Brazil’s commitment to reform and political liberalisation, combined with recent reductions in interest rates, offers upside potential for equities. We note that domestic pension and mutual funds with USD 590 billion under management are estimated to increase their equity allocation from 18% to 20% by 2009, which will also offer support to the equity market. Brazil’s credit rating has recently been upgraded to BB, two levels below investment grade, leading many to believe that the country could reach investment grade within the next 24-36 months. Mexico is also expected to benefit from pension reform, with the legislation governing Afores due to be modernised in 2007.
NOMURA FUNDS IRELAND PLC
8
INDIA EQUITY FUND INVESTMENT MANAGER’S REPORT For the period from 13th April, 2006 (date of incorporation) to 30th June, 2007 Market/Economic Review Over January to June 2007, the Indian equity markets (represented by the BSE Sensex) appreciated by 6.3% in local currency terms. The markets rose to all-time highs in early February before sentiment turned negative due to rising inflation and pre-budget nervousness exacerbated by the profit booking across global markets towards February end. However, the correction was relatively short-lived as there has been no change to the underlying strength of the economy, inflationary pressures have moderated and corporate earnings continue to grow profitably. As of end June 2007, the markets had recovered its losses closing just shy of all-time high levels.
The Indian economy has sustained its strong progression. GDP for YE March 2007 rose 9.4%, higher than the government’s initial estimate of 9.2%. Industrial and Services sectors continue to lead with double-digit growth and initial estimates for near normal monsoon also augur well for the Agricultural sector. The Balance of Payments surplus increased to USD 36.6 billion during FY2007 compared to USD 15.1 billion in the previous year - a stable Current Account deficit (at 1% of GDP) and strong capital flows contributed to the rise. Inflation trends have eased to 4.2% levels from the above 6% levels a few months back, with the Reserve Bank also pausing in its monetary tightening cycle over the last quarter.
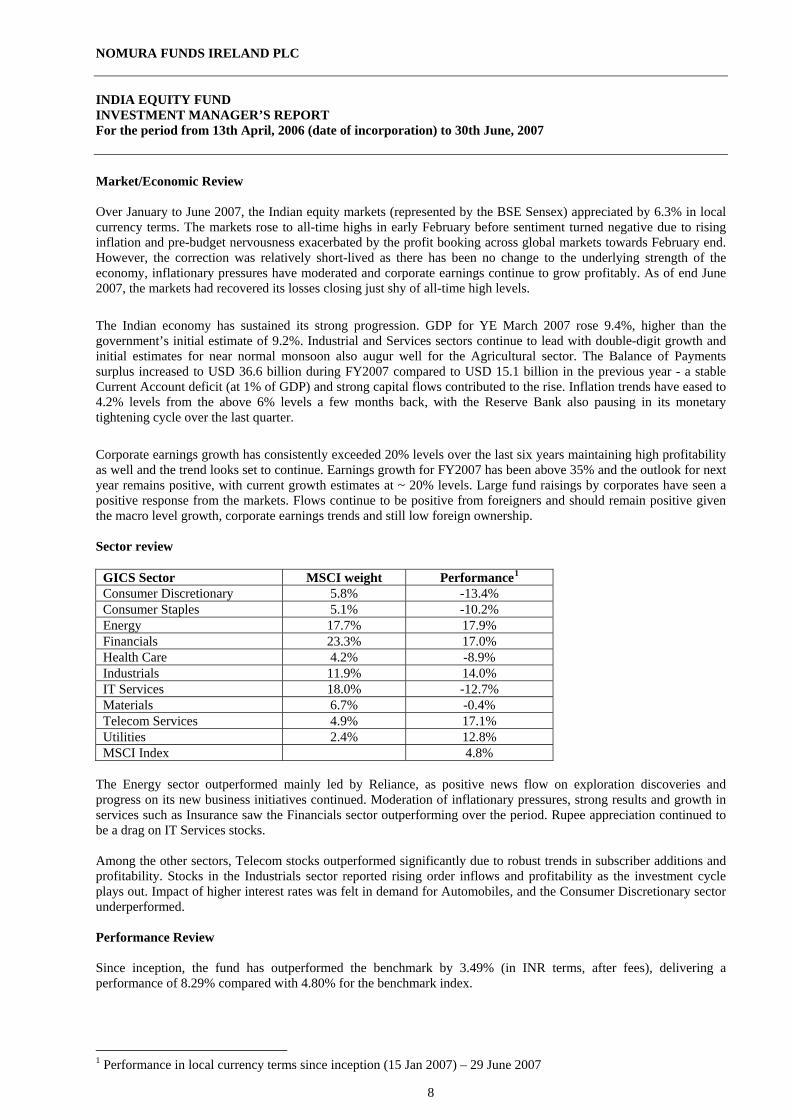
Corporate earnings growth has consistently exceeded 20% levels over the last six years maintaining high profitability as well and the trend looks set to continue. Earnings growth for FY2007 has been above 35% and the outlook for next year remains positive, with current growth estimates at ~ 20% levels. Large fund raisings by corporates have seen a positive response from the markets. Flows continue to be positive from foreigners and should remain positive given the macro level growth, corporate earnings trends and still low foreign ownership. Sector review
GICS Sector MSCI weight Performance1 Consumer Discretionary 5.8% -13.4% Consumer Staples 5.1% -10.2% Energy 17.7% 17.9% Financials 23.3% 17.0% Health Care 4.2% -8.9% Industrials 11.9% 14.0% IT Services 18.0% -12.7% Materials 6.7% -0.4% Telecom Services 4.9% 17.1% Utilities 2.4% 12.8% MSCI Index 4.8%
The Energy sector outperformed mainly led by Reliance, as positive news flow on exploration discoveries and progress on its new business initiatives continued. Moderation of inflationary pressures, strong results and growth in services such as Insurance saw the Financials sector outperforming over the period. Rupee appreciation continued to be a drag on IT Services stocks. Among the other sectors, Telecom stocks outperformed significantly due to robust trends in subscriber additions and profitability. Stocks in the Industrials sector reported rising order inflows and profitability as the investment cycle plays out. Impact of higher interest rates was felt in demand for Automobiles, and the Consumer Discretionary sector underperformed. Performance Review Since inception, the fund has outperformed the benchmark by 3.49% (in INR terms, after fees), delivering a performance of 8.29% compared with 4.80% for the benchmark index.
1 Performance in local currency terms since inception (15 Jan 2007) – 29 June 2007
NOMURA FUNDS IRELAND PLC
9
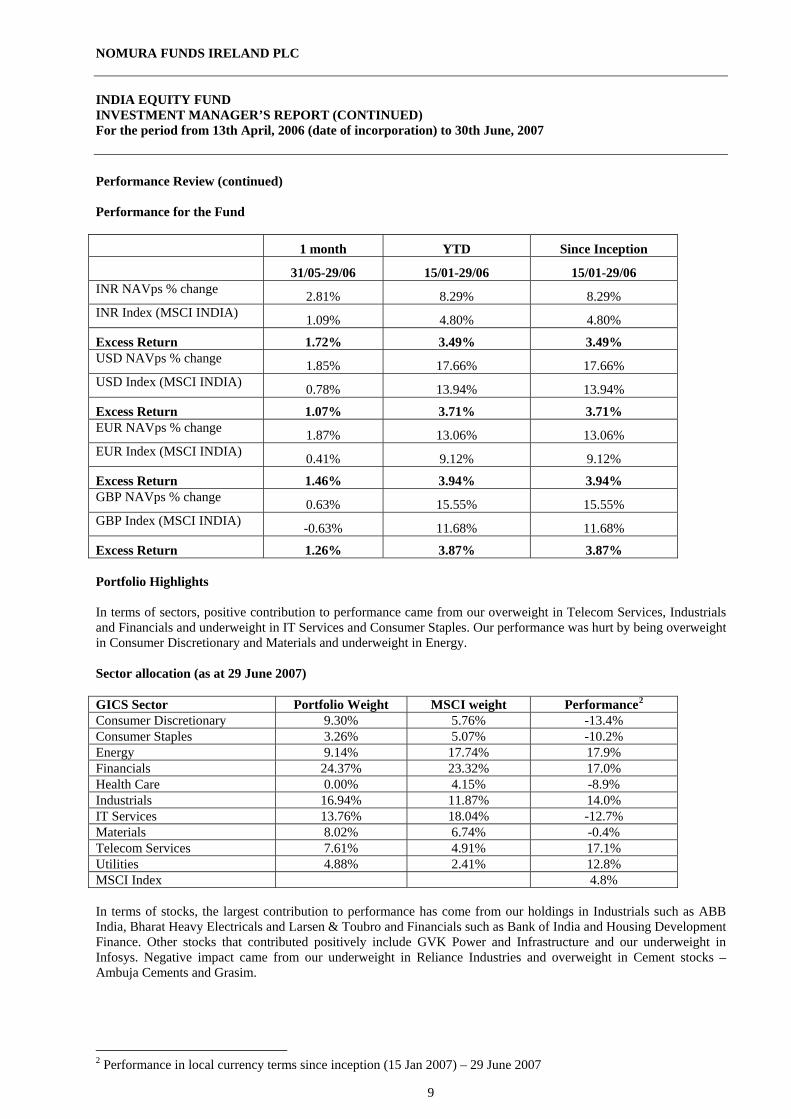
INDIA EQUITY FUND INVESTMENT MANAGER’S REPORT (CONTINUED) For the period from 13th April, 2006 (date of incorporation) to 30th June, 2007 Performance Review (continued) Performance for the Fund 1 month YTD Since Inception 31/05-29/06 15/01-29/06 15/01-29/06 INR NAVps % change
2.81% 8.29% 8.29% INR Index (MSCI INDIA)
1.09% 4.80% 4.80%
Excess Return 1.72% 3.49% 3.49% USD NAVps % change 1.85% 17.66% 17.66% USD Index (MSCI INDIA) 0.78% 13.94% 13.94%
Excess Return
1.07% 3.71% 3.71% EUR NAVps % change 1.87% 13.06% 13.06% EUR Index (MSCI INDIA) 0.41% 9.12% 9.12%
Excess Return
1.46% 3.94% 3.94% GBP NAVps % change 0.63% 15.55% 15.55% GBP Index (MSCI INDIA) -0.63% 11.68% 11.68%
Excess Return
1.26% 3.87% 3.87% Portfolio Highlights In terms of sectors, positive contribution to performance came from our overweight in Telecom Services, Industrials and Financials and underweight in IT Services and Consumer Staples. Our performance was hurt by being overweight in Consumer Discretionary and Materials and underweight in Energy. Sector allocation (as at 29 June 2007) GICS Sector Portfolio Weight MSCI weight Performance2 Consumer Discretionary 9.30% 5.76% -13.4% Consumer Staples 3.26% 5.07% -10.2% Energy 9.14% 17.74% 17.9% Financials 24.37% 23.32% 17.0% Health Care 0.00% 4.15% -8.9% Industrials 16.94% 11.87% 14.0% IT Services 13.76% 18.04% -12.7% Materials 8.02% 6.74% -0.4% Telecom Services 7.61% 4.91% 17.1% Utilities 4.88% 2.41% 12.8% MSCI Index 4.8% In terms of stocks, the largest contribution to performance has come from our holdings in Industrials such as ABB India, Bharat Heavy Electricals and Larsen & Toubro and Financials such as Bank of India and Housing Development Finance. Other stocks that contributed positively include GVK Power and Infrastructure and our underweight in Infosys. Negative impact came from our underweight in Reliance Industries and overweight in Cement stocks – Ambuja Cements and Grasim.
2 Performance in local currency terms since inception (15 Jan 2007) – 29 June 2007
NOMURA FUNDS IRELAND PLC
10
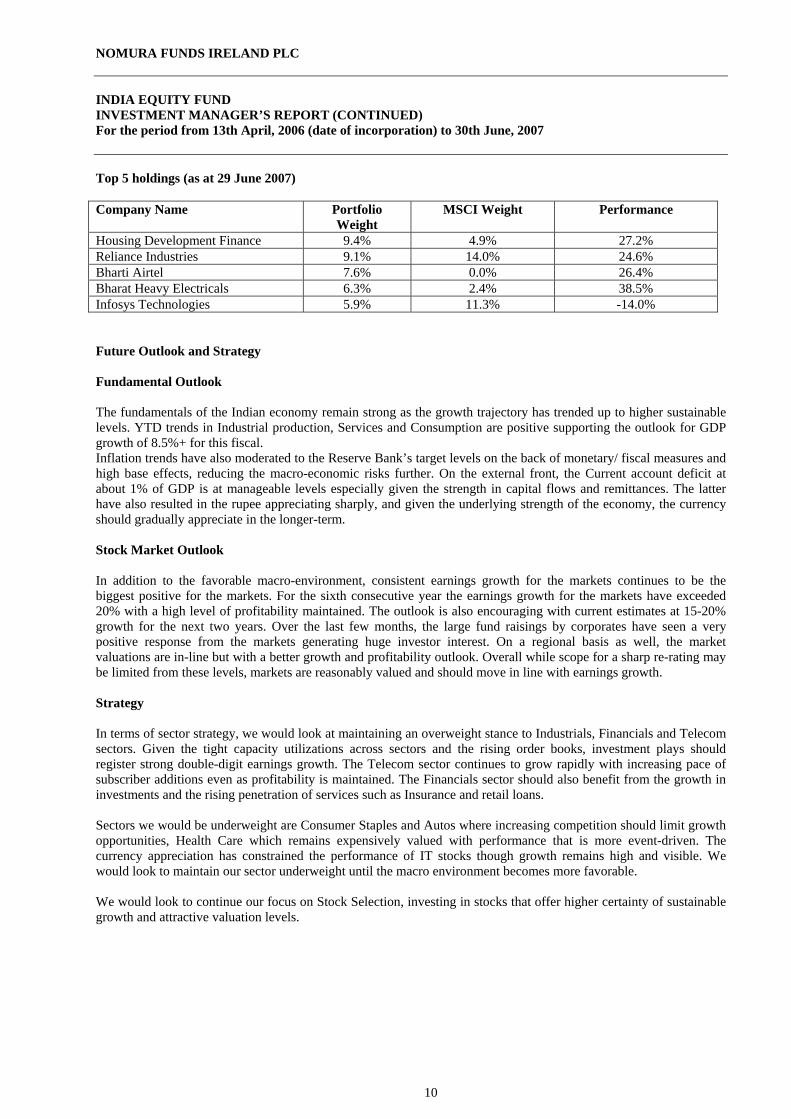
INDIA EQUITY FUND INVESTMENT MANAGER’S REPORT (CONTINUED) For the period from 13th April, 2006 (date of incorporation) to 30th June, 2007 Top 5 holdings (as at 29 June 2007) Company Name Portfolio
Weight MSCI Weight Performance
Housing Development Finance 9.4% 4.9% 27.2% Reliance Industries 9.1% 14.0% 24.6% Bharti Airtel 7.6% 0.0% 26.4% Bharat Heavy Electricals 6.3% 2.4% 38.5% Infosys Technologies 5.9% 11.3% -14.0% Future Outlook and Strategy Fundamental Outlook The fundamentals of the Indian economy remain strong as the growth trajectory has trended up to higher sustainable levels. YTD trends in Industrial production, Services and Consumption are positive supporting the outlook for GDP growth of 8.5%+ for this fiscal. Inflation trends have also moderated to the Reserve Bank’s target levels on the back of monetary/ fiscal measures and high base effects, reducing the macro-economic risks further. On the external front, the Current account deficit at about 1% of GDP is at manageable levels especially given the strength in capital flows and remittances. The latter have also resulted in the rupee appreciating sharply, and given the underlying strength of the economy, the currency should gradually appreciate in the longer-term. Stock Market Outlook In addition to the favorable macro-environment, consistent earnings growth for the markets continues to be the biggest positive for the markets. For the sixth consecutive year the earnings growth for the markets have exceeded 20% with a high level of profitability maintained. The outlook is also encouraging with current estimates at 15-20% growth for the next two years. Over the last few months, the large fund raisings by corporates have seen a very positive response from the markets generating huge investor interest. On a regional basis as well, the market valuations are in-line but with a better growth and profitability outlook. Overall while scope for a sharp re-rating may be limited from these levels, markets are reasonably valued and should move in line with earnings growth. Strategy In terms of sector strategy, we would look at maintaining an overweight stance to Industrials, Financials and Telecom sectors. Given the tight capacity utilizations across sectors and the rising order books, investment plays should register strong double-digit earnings growth. The Telecom sector continues to grow rapidly with increasing pace of subscriber additions even as profitability is maintained. The Financials sector should also benefit from the growth in investments and the rising penetration of services such as Insurance and retail loans. Sectors we would be underweight are Consumer Staples and Autos where increasing competition should limit growth opportunities, Health Care which remains expensively valued with performance that is more event-driven. The currency appreciation has constrained the performance of IT stocks though growth remains high and visible. We would look to maintain our sector underweight until the macro environment becomes more favorable. We would look to continue our focus on Stock Selection, investing in stocks that offer higher certainty of sustainable growth and attractive valuation levels.
NOMURA FUNDS IRELAND PLC
11
ASIA EX-JAPAN EQUITY FUND INVESTMENT MANAGER’S REPORT For the period from 13th April, 2006 (date of incorporation) to 30th June, 2007 Investment Outlook and Strategy Asia Pacific markets have been very strong for the year to date, and our longer-term view of the Asian markets remains unequivocally positive. The global economy continues to grow at a healthy pace; and although interest rates are rising, this is partly due to lower savings rates in developing countries as consumption rises. We expect this consumption growth to accelerate and when added to the expected pick up in capital investment and infrastructure spending in the Asia Pacific region, this could point to further corporate profit growth. However, in the shorter term, we are predicting a period of consolidation. Credit spreads globally are rising and we feel that problems in the sub prime mortgage market and an impending unwinding of the low grade Collateralised Debt Obligation (CDO) market could be potentially contagious for the Asia Pacific region. We are also closely watching the China domestic “A” share market. It is not surprising that the market is so strong; after all, much of the world’s liquidity resides in China. However, we are concerned that the authorities might overreact and introduce policies that could exacerbate any future decline. Given our short-term concerns, we will endeavour to maintain a relatively cautious investment stance. However, we also believe this period of consolidation will be an ideal time to increase the risk exposure of our portfolios.
NOMURA FUNDS IRELAND PLC
12
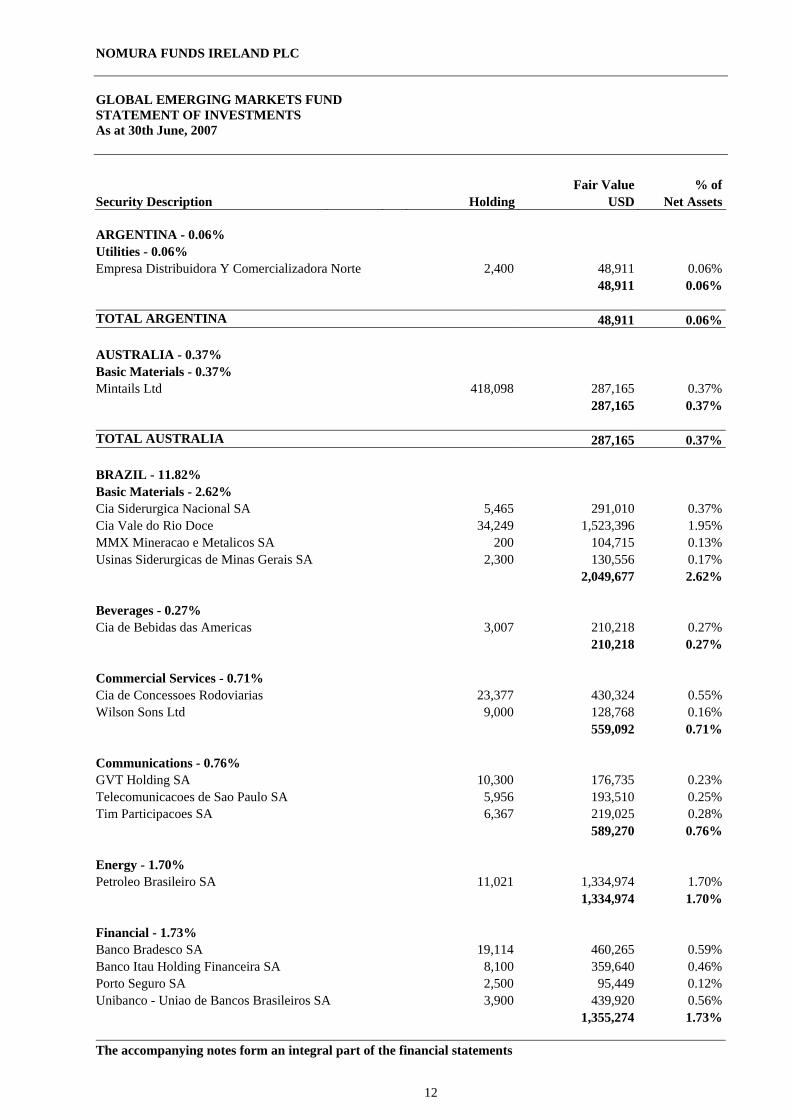
GLOBAL EMERGING MARKETS FUND STATEMENT OF INVESTMENTS As at 30th June, 2007
Fair Value % of Security Description Holding USD Net Assets ARGENTINA - 0.06% Utilities - 0.06% Empresa Distribuidora Y Comercializadora Norte 2,400 48,911 0.06% 48,911 0.06% TOTAL ARGENTINA 48,911 0.06% AUSTRALIA - 0.37% Basic Materials - 0.37% Mintails Ltd 418,098 287,165 0.37% 287,165 0.37% TOTAL AUSTRALIA 287,165 0.37% BRAZIL - 11.82% Basic Materials - 2.62% Cia Siderurgica Nacional SA 5,465 291,010 0.37%Cia Vale do Rio Doce 34,249 1,523,396 1.95%MMX Mineracao e Metalicos SA 200 104,715 0.13%Usinas Siderurgicas de Minas Gerais SA 2,300 130,556 0.17% 2,049,677 2.62% Beverages - 0.27% Cia de Bebidas das Americas 3,007 210,218 0.27% 210,218 0.27% Commercial Services - 0.71% Cia de Concessoes Rodoviarias 23,377 430,324 0.55%Wilson Sons Ltd 9,000 128,768 0.16% 559,092 0.71% Communications - 0.76% GVT Holding SA 10,300 176,735 0.23%Telecomunicacoes de Sao Paulo SA 5,956 193,510 0.25%Tim Participacoes SA 6,367 219,025 0.28% 589,270 0.76% Energy - 1.70% Petroleo Brasileiro SA 11,021 1,334,974 1.70% 1,334,974 1.70% Financial - 1.73% Banco Bradesco SA 19,114 460,265 0.59%Banco Itau Holding Financeira SA 8,100 359,640 0.46%Porto Seguro SA 2,500 95,449 0.12%Unibanco - Uniao de Bancos Brasileiros SA 3,900 439,920 0.56%
1,355,274 1.73% The accompanying notes form an integral part of the financial statements
NOMURA FUNDS IRELAND PLC
13
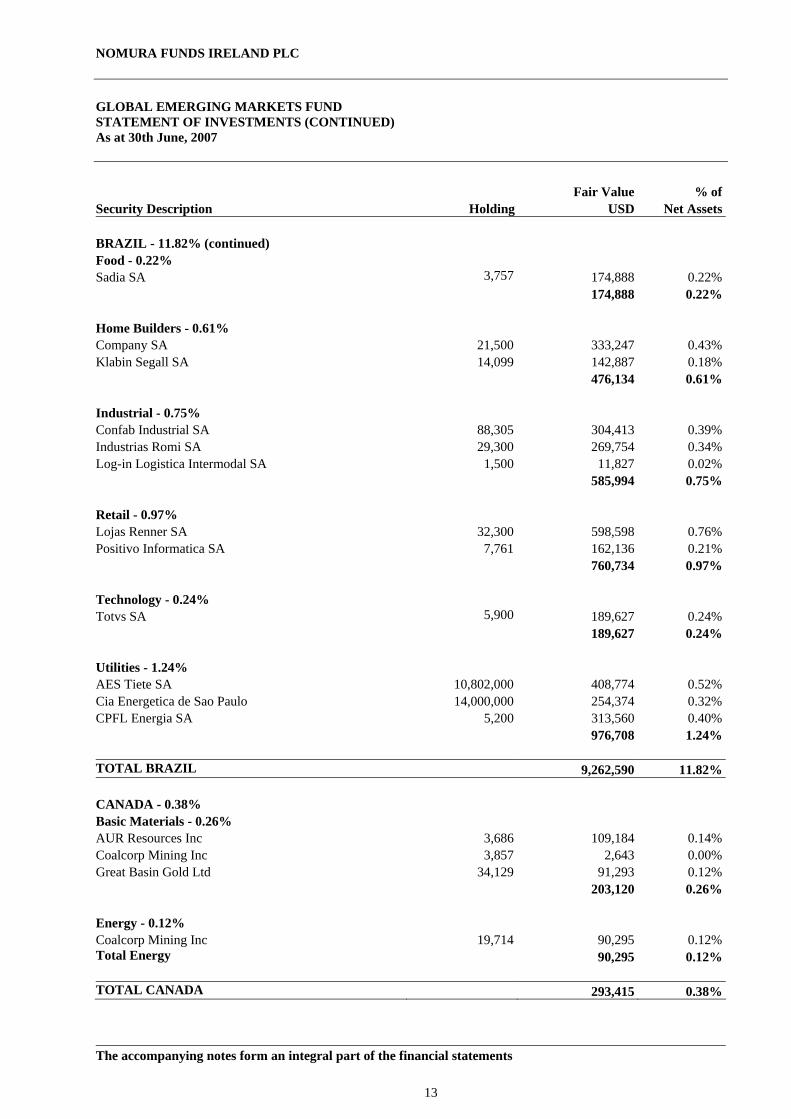
GLOBAL EMERGING MARKETS FUND STATEMENT OF INVESTMENTS (CONTINUED) As at 30th June, 2007
Fair Value % of Security Description Holding USD Net Assets BRAZIL - 11.82% (continued) Food - 0.22% Sadia SA 3,757 174,888 0.22% 174,888 0.22% Home Builders - 0.61%
Company SA 21,500 333,247 0.43%Klabin Segall SA 14,099 142,887 0.18% 476,134 0.61% Industrial - 0.75% Confab Industrial SA 88,305 304,413 0.39%Industrias Romi SA 29,300 269,754 0.34%Log-in Logistica Intermodal SA 1,500 11,827 0.02% 585,994 0.75% Retail - 0.97% Lojas Renner SA 32,300 598,598 0.76%Positivo Informatica SA 7,761 162,136 0.21% 760,734 0.97% Technology - 0.24% Totvs SA 5,900 189,627 0.24% 189,627 0.24% Utilities - 1.24%
AES Tiete SA 10,802,000 408,774 0.52%Cia Energetica de Sao Paulo 14,000,000 254,374 0.32%CPFL Energia SA 5,200 313,560 0.40% 976,708 1.24% TOTAL BRAZIL 9,262,590 11.82% CANADA - 0.38% Basic Materials - 0.26% AUR Resources Inc 3,686 109,184 0.14%Coalcorp Mining Inc 3,857 2,643 0.00%Great Basin Gold Ltd 34,129 91,293 0.12% 203,120 0.26% Energy - 0.12% Coalcorp Mining Inc 19,714 90,295 0.12%Total Energy 90,295 0.12% TOTAL CANADA 293,415 0.38% The accompanying notes form an integral part of the financial statements
NOMURA FUNDS IRELAND PLC
14
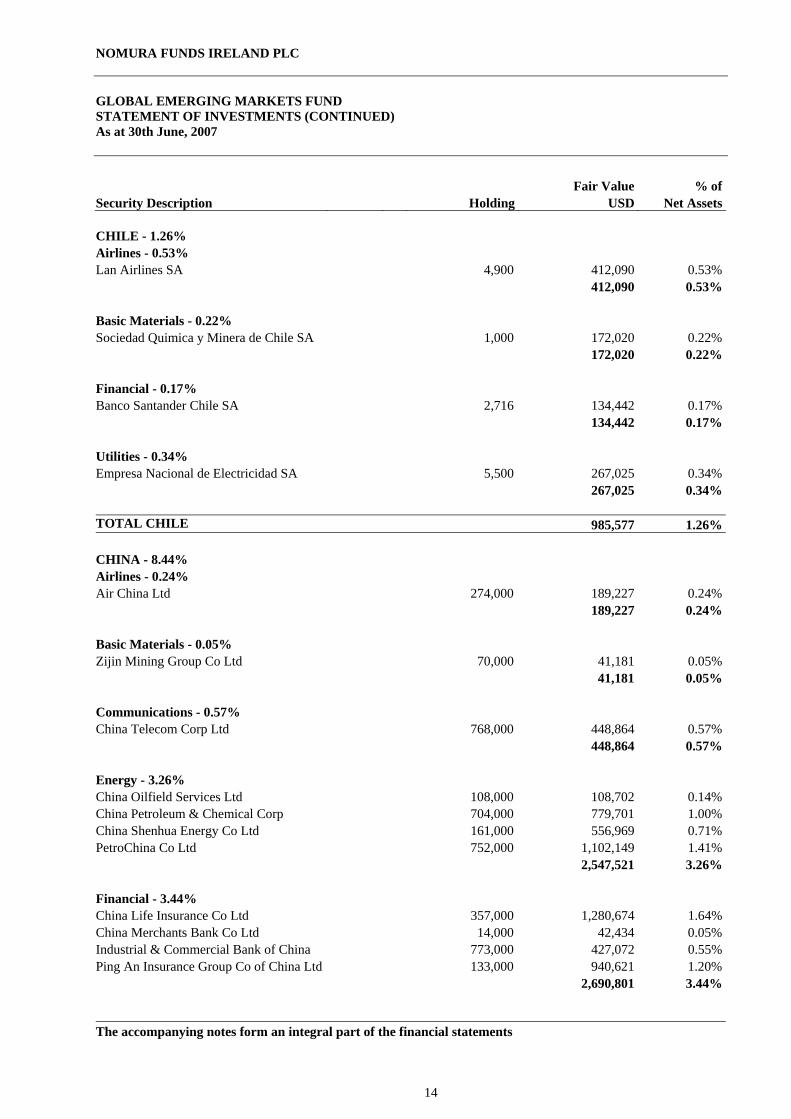
GLOBAL EMERGING MARKETS FUND STATEMENT OF INVESTMENTS (CONTINUED) As at 30th June, 2007
Fair Value % of Security Description Holding USD Net Assets CHILE - 1.26% Airlines - 0.53% Lan Airlines SA 4,900 412,090 0.53% 412,090 0.53% Basic Materials - 0.22% Sociedad Quimica y Minera de Chile SA 1,000 172,020 0.22% 172,020 0.22% Financial - 0.17% Banco Santander Chile SA 2,716 134,442 0.17% 134,442 0.17% Utilities - 0.34% Empresa Nacional de Electricidad SA 5,500 267,025 0.34% 267,025 0.34% TOTAL CHILE 985,577 1.26% CHINA - 8.44% Airlines - 0.24% Air China Ltd 274,000 189,227 0.24% 189,227 0.24% Basic Materials - 0.05% Zijin Mining Group Co Ltd 70,000 41,181 0.05% 41,181 0.05% Communications - 0.57% China Telecom Corp Ltd 768,000 448,864 0.57% 448,864 0.57% Energy - 3.26% China Oilfield Services Ltd 108,000 108,702 0.14%China Petroleum & Chemical Corp 704,000 779,701 1.00%China Shenhua Energy Co Ltd 161,000 556,969 0.71%PetroChina Co Ltd 752,000 1,102,149 1.41% 2,547,521 3.26% Financial - 3.44%
China Life Insurance Co Ltd 357,000 1,280,674 1.64%China Merchants Bank Co Ltd 14,000 42,434 0.05%Industrial & Commercial Bank of China 773,000 427,072 0.55%Ping An Insurance Group Co of China Ltd 133,000 940,621 1.20% 2,690,801 3.44% The accompanying notes form an integral part of the financial statements
NOMURA FUNDS IRELAND PLC
15
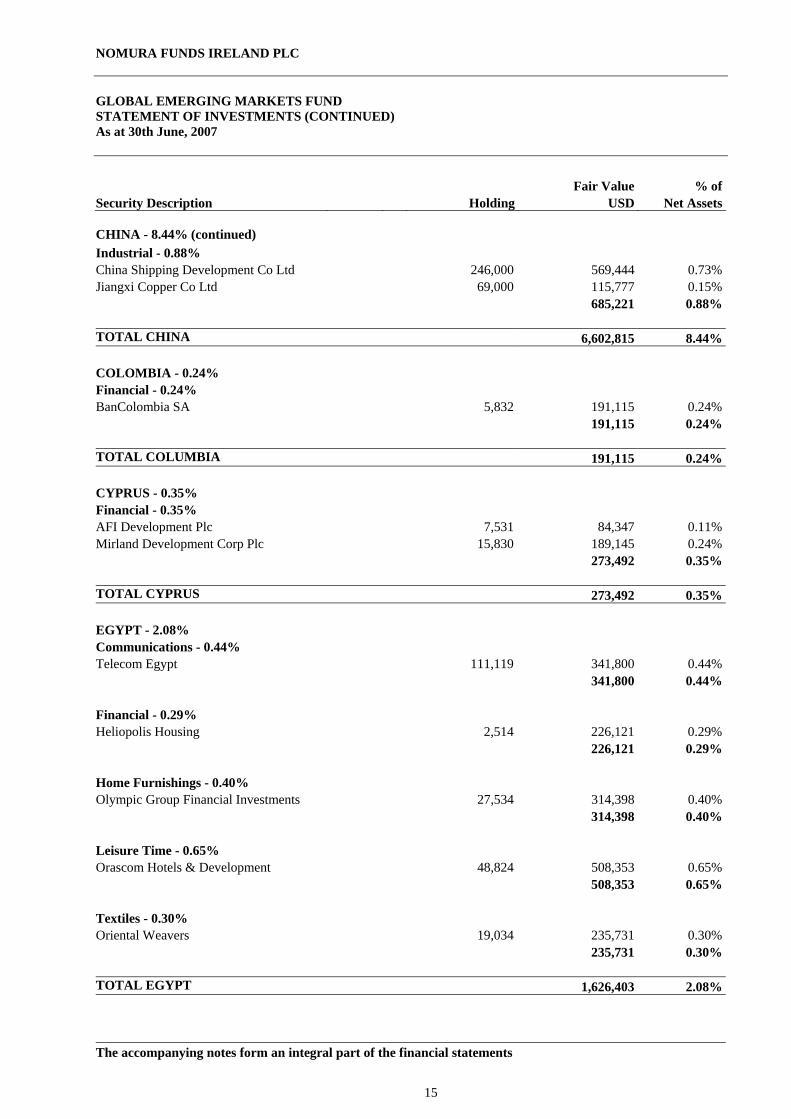
GLOBAL EMERGING MARKETS FUND STATEMENT OF INVESTMENTS (CONTINUED) As at 30th June, 2007
Fair Value % of Security Description Holding USD Net Assets CHINA - 8.44% (continued) Industrial - 0.88% China Shipping Development Co Ltd 246,000 569,444 0.73%Jiangxi Copper Co Ltd 69,000 115,777 0.15% 685,221 0.88% TOTAL CHINA 6,602,815 8.44% COLOMBIA - 0.24% Financial - 0.24% BanColombia SA 5,832 191,115 0.24% 191,115 0.24% TOTAL COLUMBIA 191,115 0.24% CYPRUS - 0.35% Financial - 0.35% AFI Development Plc 7,531 84,347 0.11%Mirland Development Corp Plc 15,830 189,145 0.24% 273,492 0.35% TOTAL CYPRUS 273,492 0.35% EGYPT - 2.08% Communications - 0.44% Telecom Egypt 111,119 341,800 0.44% 341,800 0.44% Financial - 0.29% Heliopolis Housing 2,514 226,121 0.29% 226,121 0.29% Home Furnishings - 0.40% Olympic Group Financial Investments 27,534 314,398 0.40% 314,398 0.40% Leisure Time - 0.65% Orascom Hotels & Development 48,824 508,353 0.65% 508,353 0.65% Textiles - 0.30% Oriental Weavers 19,034 235,731 0.30% 235,731 0.30% TOTAL EGYPT 1,626,403 2.08% The accompanying notes form an integral part of the financial statements
NOMURA FUNDS IRELAND PLC
16
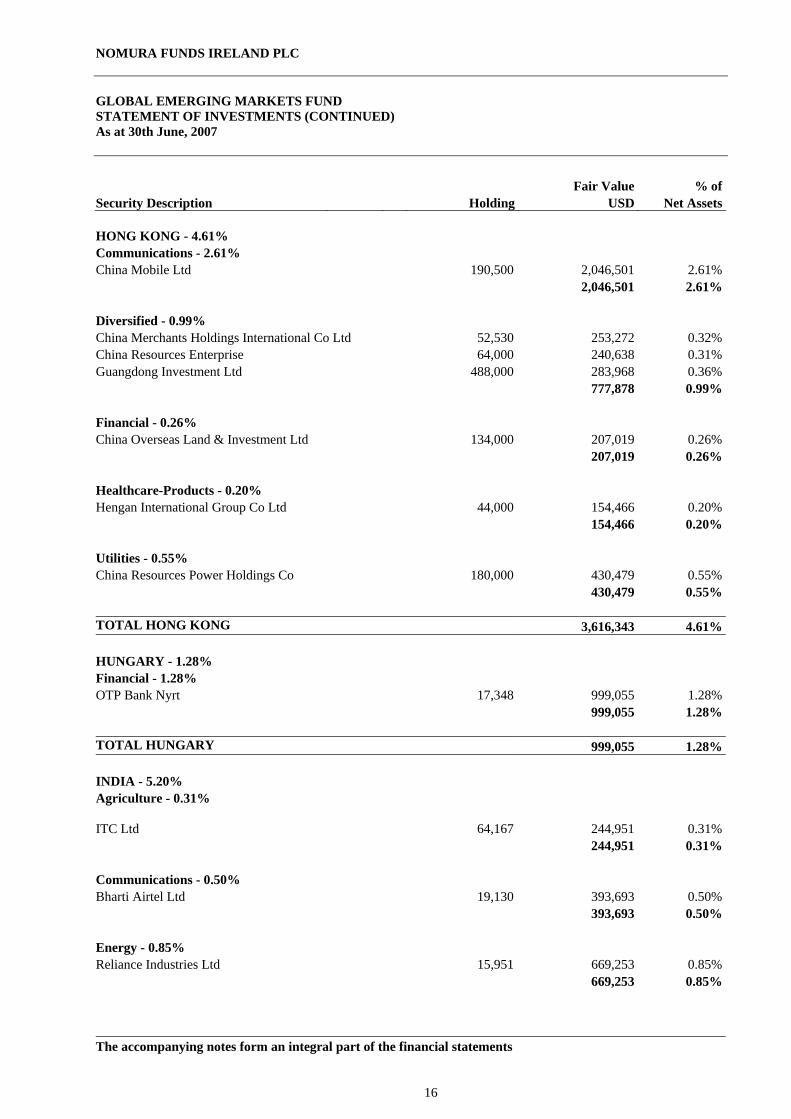
GLOBAL EMERGING MARKETS FUND STATEMENT OF INVESTMENTS (CONTINUED) As at 30th June, 2007
Fair Value % of Security Description Holding USD Net Assets HONG KONG - 4.61% Communications - 2.61% China Mobile Ltd 190,500 2,046,501 2.61% 2,046,501 2.61% Diversified - 0.99% China Merchants Holdings International Co Ltd 52,530 253,272 0.32%China Resources Enterprise 64,000 240,638 0.31%Guangdong Investment Ltd 488,000 283,968 0.36% 777,878 0.99% Financial - 0.26% China Overseas Land & Investment Ltd 134,000 207,019 0.26% 207,019 0.26% Healthcare-Products - 0.20% Hengan International Group Co Ltd 44,000 154,466 0.20% 154,466 0.20% Utilities - 0.55% China Resources Power Holdings Co 180,000 430,479 0.55% 430,479 0.55% TOTAL HONG KONG 3,616,343 4.61% HUNGARY - 1.28% Financial - 1.28% OTP Bank Nyrt 17,348 999,055 1.28% 999,055 1.28% TOTAL HUNGARY 999,055 1.28% INDIA - 5.20% Agriculture - 0.31%
ITC Ltd
64,167 244,951 0.31% 244,951 0.31% Communications - 0.50% Bharti Airtel Ltd 19,130 393,693 0.50% 393,693 0.50% Energy - 0.85% Reliance Industries Ltd 15,951 669,253 0.85%
669,253 0.85%
The accompanying notes form an integral part of the financial statements
NOMURA FUNDS IRELAND PLC
17
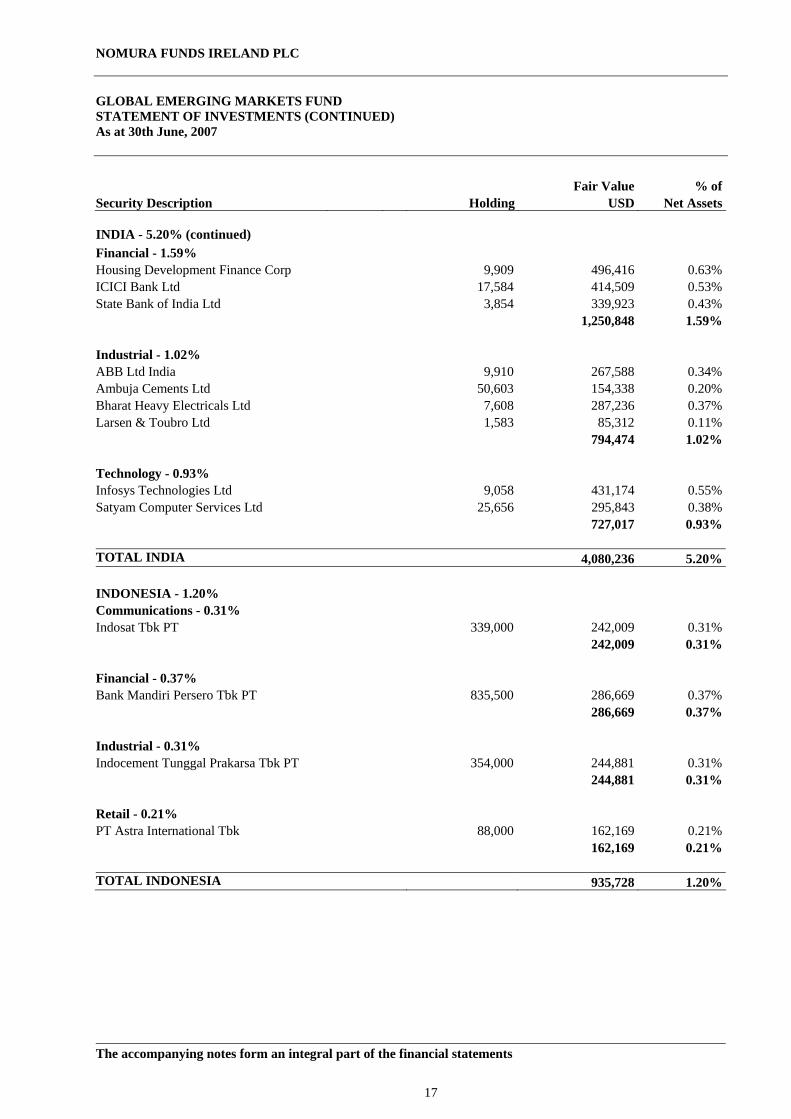
GLOBAL EMERGING MARKETS FUND STATEMENT OF INVESTMENTS (CONTINUED) As at 30th June, 2007
Fair Value % of Security Description Holding USD Net Assets INDIA - 5.20% (continued) Financial - 1.59% Housing Development Finance Corp 9,909 496,416 0.63%ICICI Bank Ltd 17,584 414,509 0.53%State Bank of India Ltd 3,854 339,923 0.43% 1,250,848 1.59% Industrial - 1.02% ABB Ltd India 9,910 267,588 0.34%Ambuja Cements Ltd 50,603 154,338 0.20%Bharat Heavy Electricals Ltd 7,608 287,236 0.37%Larsen & Toubro Ltd 1,583 85,312 0.11% 794,474 1.02% Technology - 0.93% Infosys Technologies Ltd 9,058 431,174 0.55%Satyam Computer Services Ltd 25,656 295,843 0.38% 727,017 0.93% TOTAL INDIA 4,080,236 5.20% INDONESIA - 1.20% Communications - 0.31% Indosat Tbk PT 339,000 242,009 0.31% 242,009 0.31% Financial - 0.37% Bank Mandiri Persero Tbk PT 835,500 286,669 0.37% 286,669 0.37% Industrial - 0.31% Indocement Tunggal Prakarsa Tbk PT 354,000 244,881 0.31% 244,881 0.31% Retail - 0.21% PT Astra International Tbk 88,000 162,169 0.21% 162,169 0.21% TOTAL INDONESIA 935,728 1.20% The accompanying notes form an integral part of the financial statements
NOMURA FUNDS IRELAND PLC
18
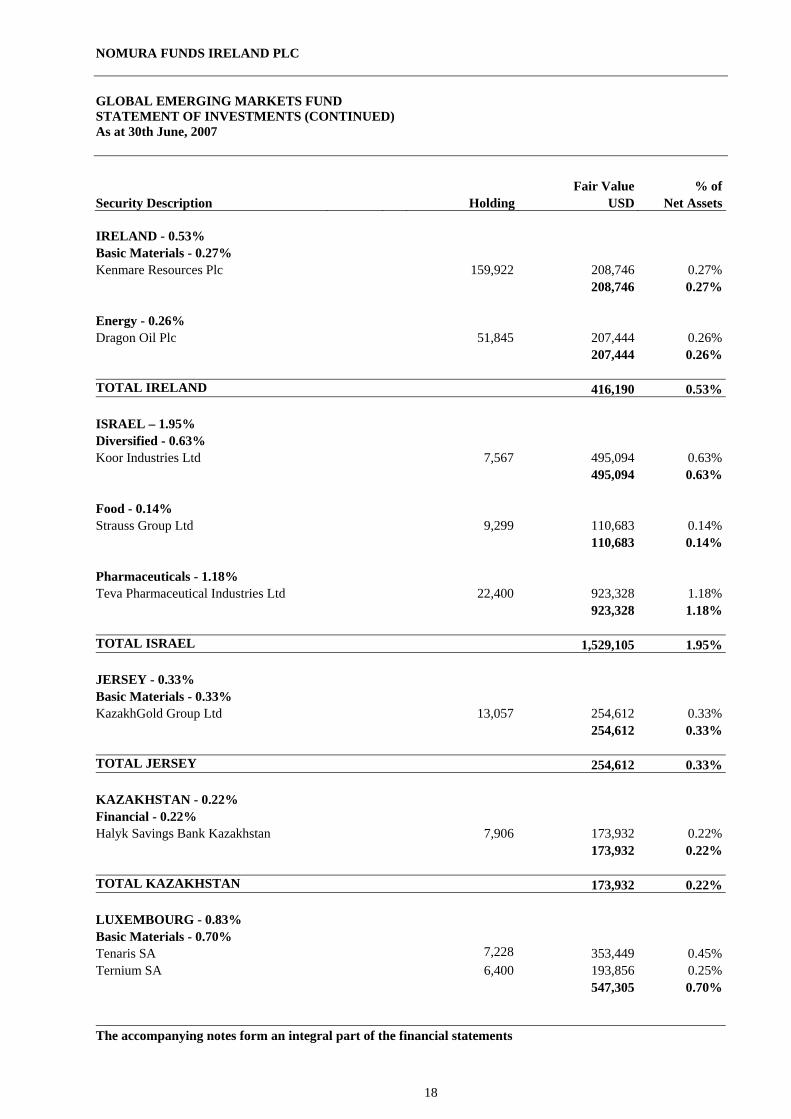
GLOBAL EMERGING MARKETS FUND STATEMENT OF INVESTMENTS (CONTINUED) As at 30th June, 2007
Fair Value % of Security Description Holding USD Net Assets IRELAND - 0.53% Basic Materials - 0.27% Kenmare Resources Plc 159,922 208,746 0.27% 208,746 0.27% Energy - 0.26% Dragon Oil Plc 51,845 207,444 0.26% 207,444 0.26% TOTAL IRELAND 416,190 0.53% ISRAEL – 1.95% Diversified - 0.63% Koor Industries Ltd 7,567 495,094 0.63% 495,094 0.63% Food - 0.14% Strauss Group Ltd 9,299 110,683 0.14% 110,683 0.14% Pharmaceuticals - 1.18% Teva Pharmaceutical Industries Ltd 22,400 923,328 1.18% 923,328 1.18% TOTAL ISRAEL 1,529,105 1.95% JERSEY - 0.33% Basic Materials - 0.33% KazakhGold Group Ltd 13,057 254,612 0.33% 254,612 0.33% TOTAL JERSEY 254,612 0.33% KAZAKHSTAN - 0.22% Financial - 0.22% Halyk Savings Bank Kazakhstan 7,906 173,932 0.22% 173,932 0.22% TOTAL KAZAKHSTAN 173,932 0.22% LUXEMBOURG - 0.83% Basic Materials - 0.70% Tenaris SA 7,228 353,449 0.45%Ternium SA 6,400 193,856 0.25% 547,305 0.70% The accompanying notes form an integral part of the financial statements
NOMURA FUNDS IRELAND PLC
19
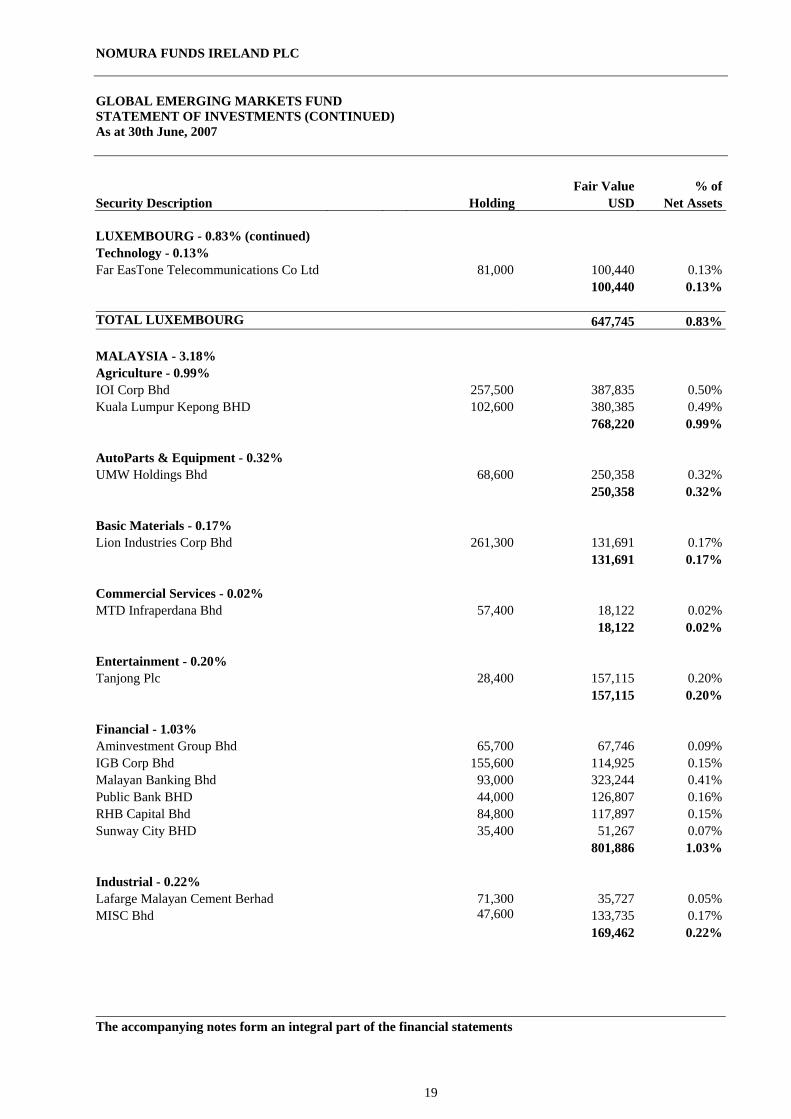
GLOBAL EMERGING MARKETS FUND STATEMENT OF INVESTMENTS (CONTINUED) As at 30th June, 2007
Fair Value % of Security Description Holding USD Net Assets LUXEMBOURG - 0.83% (continued) Technology - 0.13% Far EasTone Telecommunications Co Ltd 81,000 100,440 0.13% 100,440 0.13% TOTAL LUXEMBOURG 647,745 0.83% MALAYSIA - 3.18% Agriculture - 0.99% IOI Corp Bhd 257,500 387,835 0.50%Kuala Lumpur Kepong BHD 102,600 380,385 0.49% 768,220 0.99% AutoParts & Equipment - 0.32% UMW Holdings Bhd 68,600 250,358 0.32% 250,358 0.32% Basic Materials - 0.17% Lion Industries Corp Bhd 261,300 131,691 0.17% 131,691 0.17% Commercial Services - 0.02% MTD Infraperdana Bhd 57,400 18,122 0.02% 18,122 0.02% Entertainment - 0.20% Tanjong Plc 28,400 157,115 0.20% 157,115 0.20% Financial - 1.03% Aminvestment Group Bhd 65,700 67,746 0.09%IGB Corp Bhd 155,600 114,925 0.15%Malayan Banking Bhd 93,000 323,244 0.41%Public Bank BHD 44,000 126,807 0.16%RHB Capital Bhd 84,800 117,897 0.15%Sunway City BHD 35,400 51,267 0.07% 801,886 1.03% Industrial - 0.22% Lafarge Malayan Cement Berhad 71,300 35,727 0.05%MISC Bhd 47,600 133,735 0.17% 169,462 0.22% The accompanying notes form an integral part of the financial statements
NOMURA FUNDS IRELAND PLC
20
GLOBAL EMERGING MARKETS FUND STATEMENT OF INVESTMENTS (CONTINUED) As at 30th June, 2007
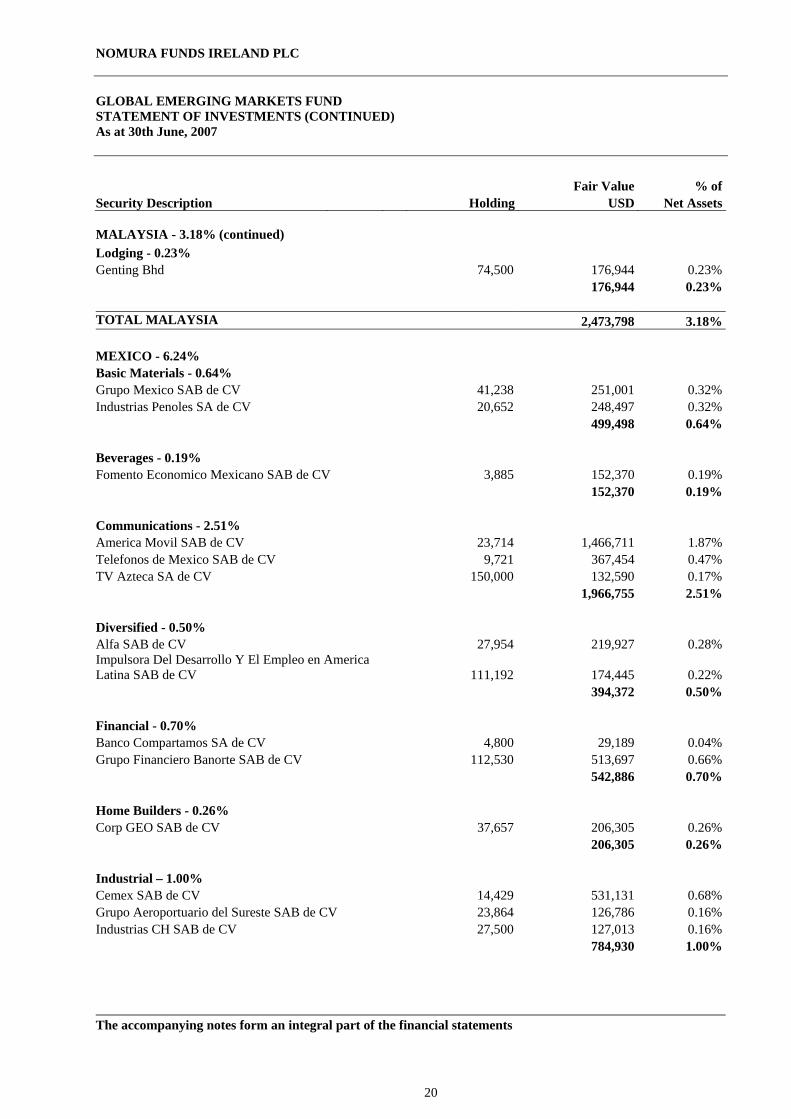
Fair Value % of Security Description Holding USD Net Assets MALAYSIA - 3.18% (continued) Lodging - 0.23% Genting Bhd 74,500 176,944 0.23% 176,944 0.23% TOTAL MALAYSIA 2,473,798 3.18% MEXICO - 6.24% Basic Materials - 0.64% Grupo Mexico SAB de CV 41,238 251,001 0.32%Industrias Penoles SA de CV 20,652 248,497 0.32% 499,498 0.64% Beverages - 0.19% Fomento Economico Mexicano SAB de CV 3,885 152,370 0.19% 152,370 0.19% Communications - 2.51% America Movil SAB de CV 23,714 1,466,711 1.87%Telefonos de Mexico SAB de CV 9,721 367,454 0.47%TV Azteca SA de CV 150,000 132,590 0.17% 1,966,755 2.51% Diversified - 0.50% Alfa SAB de CV 27,954 219,927 0.28%Impulsora Del Desarrollo Y El Empleo en America Latina SAB de CV 111,192 174,445 0.22% 394,372 0.50% Financial - 0.70% Banco Compartamos SA de CV 4,800 29,189 0.04%Grupo Financiero Banorte SAB de CV 112,530 513,697 0.66% 542,886 0.70% Home Builders - 0.26% Corp GEO SAB de CV 37,657 206,305 0.26% 206,305 0.26% Industrial – 1.00% Cemex SAB de CV 14,429 531,131 0.68%Grupo Aeroportuario del Sureste SAB de CV 23,864 126,786 0.16%Industrias CH SAB de CV 27,500 127,013 0.16% 784,930 1.00% The accompanying notes form an integral part of the financial statements
NOMURA FUNDS IRELAND PLC
21
GLOBAL EMERGING MARKETS FUND STATEMENT OF INVESTMENTS (CONTINUED) As at 30th June, 2007
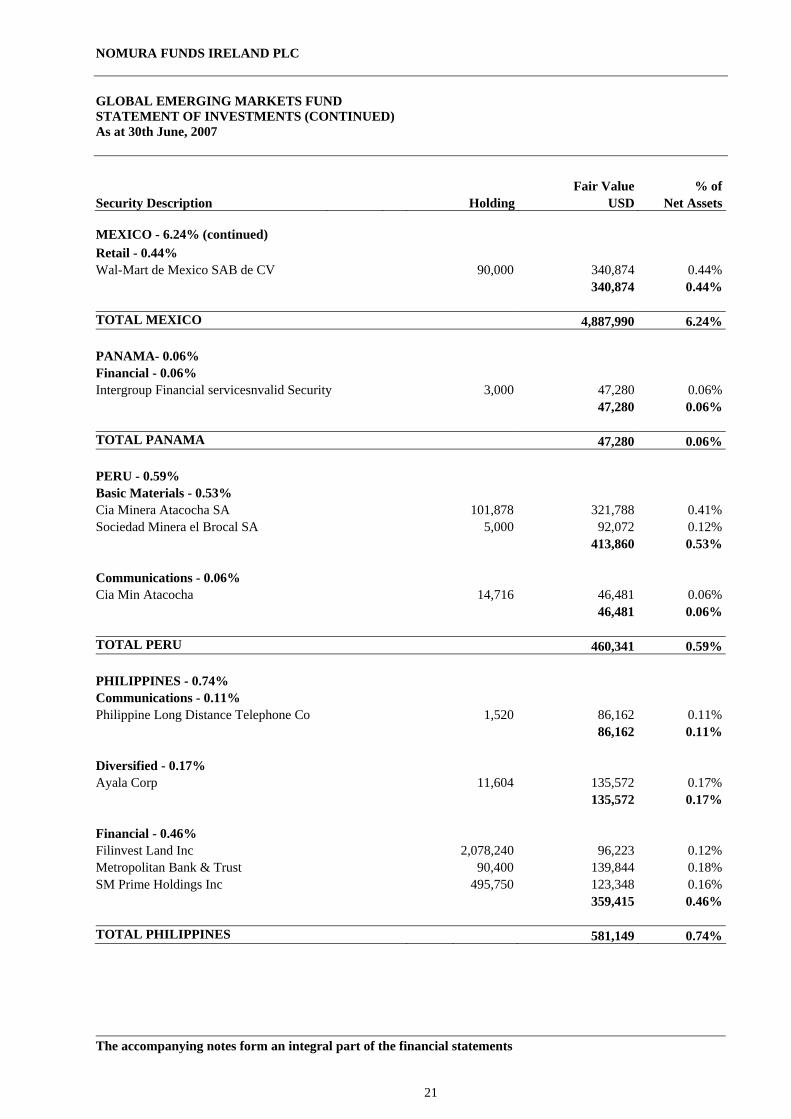
Fair Value % of Security Description Holding USD Net Assets MEXICO - 6.24% (continued) Retail - 0.44% Wal-Mart de Mexico SAB de CV 90,000 340,874 0.44% 340,874 0.44% TOTAL MEXICO 4,887,990 6.24% PANAMA- 0.06% Financial - 0.06% Intergroup Financial servicesnvalid Security 3,000 47,280 0.06% 47,280 0.06% TOTAL PANAMA 47,280 0.06% PERU - 0.59% Basic Materials - 0.53% Cia Minera Atacocha SA 101,878 321,788 0.41%Sociedad Minera el Brocal SA 5,000 92,072 0.12% 413,860 0.53% Communications - 0.06% Cia Min Atacocha 14,716 46,481 0.06% 46,481 0.06% TOTAL PERU 460,341 0.59% PHILIPPINES - 0.74% Communications - 0.11% Philippine Long Distance Telephone Co 1,520 86,162 0.11% 86,162 0.11% Diversified - 0.17% Ayala Corp 11,604 135,572 0.17% 135,572 0.17% Financial - 0.46% Filinvest Land Inc 2,078,240 96,223 0.12%Metropolitan Bank & Trust 90,400 139,844 0.18%SM Prime Holdings Inc 495,750 123,348 0.16% 359,415 0.46% TOTAL PHILIPPINES 581,149 0.74% The accompanying notes form an integral part of the financial statements
NOMURA FUNDS IRELAND PLC
22
GLOBAL EMERGING MARKETS FUND STATEMENT OF INVESTMENTS (CONTINUED) As at 30th June, 2007
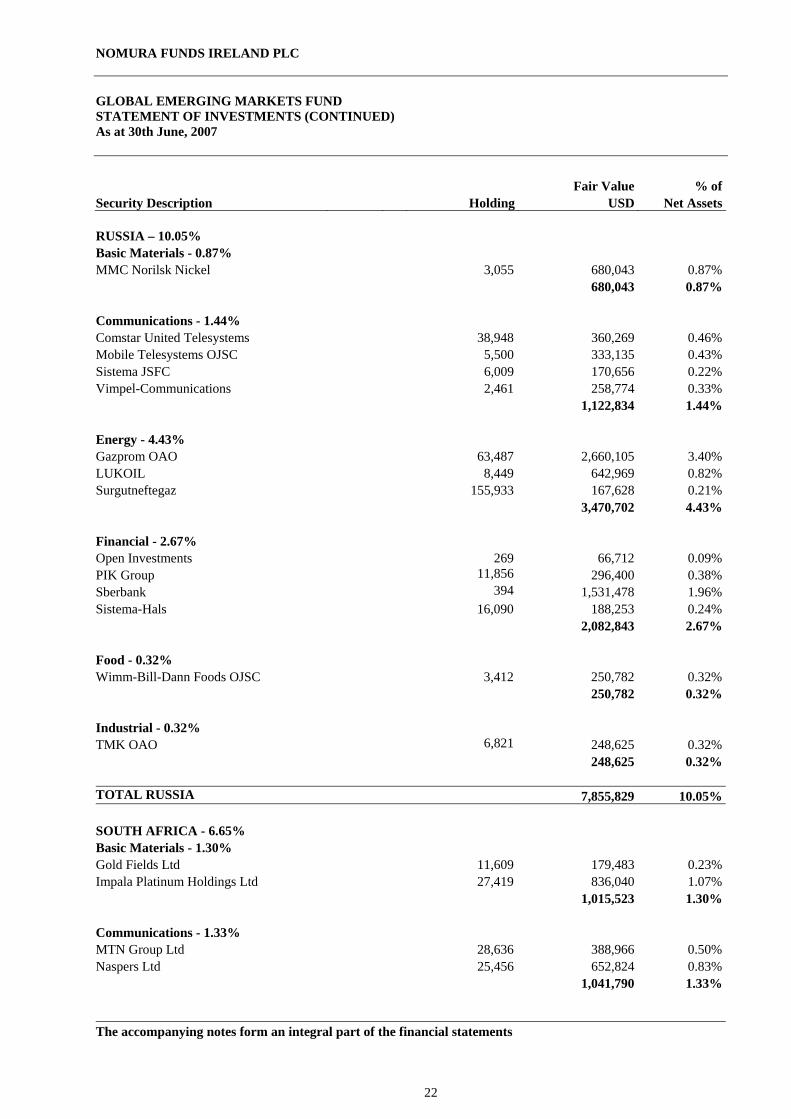
Fair Value % of Security Description Holding USD Net Assets RUSSIA – 10.05% Basic Materials - 0.87% MMC Norilsk Nickel 3,055 680,043 0.87% 680,043 0.87% Communications - 1.44% Comstar United Telesystems 38,948 360,269 0.46%Mobile Telesystems OJSC 5,500 333,135 0.43%Sistema JSFC 6,009 170,656 0.22%Vimpel-Communications 2,461 258,774 0.33% 1,122,834 1.44% Energy - 4.43% Gazprom OAO 63,487 2,660,105 3.40%LUKOIL 8,449 642,969 0.82%Surgutneftegaz 155,933 167,628 0.21% 3,470,702 4.43% Financial - 2.67% Open Investments 269 66,712 0.09%PIK Group 11,856 296,400 0.38%Sberbank 394 1,531,478 1.96%Sistema-Hals 16,090 188,253 0.24% 2,082,843 2.67% Food - 0.32% Wimm-Bill-Dann Foods OJSC 3,412 250,782 0.32% 250,782 0.32% Industrial - 0.32% TMK OAO 6,821 248,625 0.32% 248,625 0.32% TOTAL RUSSIA 7,855,829 10.05% SOUTH AFRICA - 6.65% Basic Materials - 1.30% Gold Fields Ltd 11,609 179,483 0.23%Impala Platinum Holdings Ltd 27,419 836,040 1.07% 1,015,523 1.30% Communications - 1.33% MTN Group Ltd 28,636 388,966 0.50%Naspers Ltd 25,456 652,824 0.83% 1,041,790 1.33% The accompanying notes form an integral part of the financial statements
NOMURA FUNDS IRELAND PLC
23
GLOBAL EMERGING MARKETS FUND STATEMENT OF INVESTMENTS (CONTINUED) As at 30th June, 2007
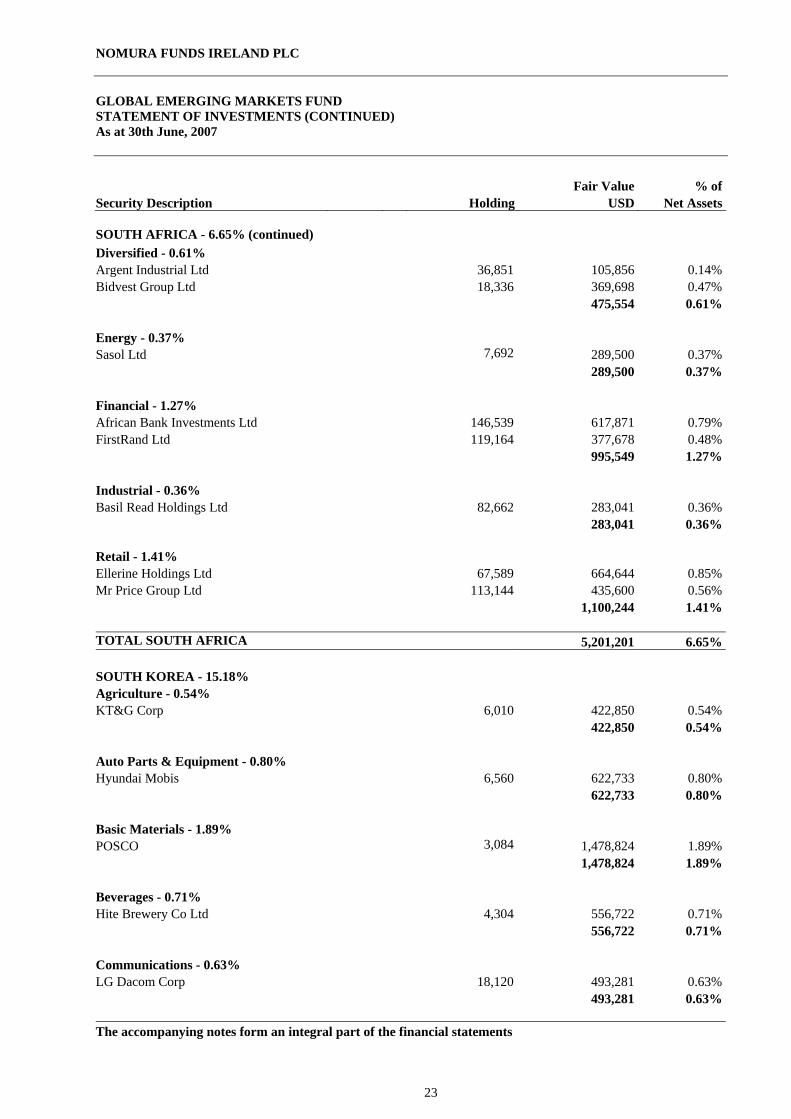
Fair Value % of Security Description Holding USD Net Assets SOUTH AFRICA - 6.65% (continued) Diversified - 0.61% Argent Industrial Ltd 36,851 105,856 0.14%Bidvest Group Ltd 18,336 369,698 0.47% 475,554 0.61% Energy - 0.37% Sasol Ltd 7,692 289,500 0.37% 289,500 0.37% Financial - 1.27% African Bank Investments Ltd 146,539 617,871 0.79%FirstRand Ltd 119,164 377,678 0.48% 995,549 1.27% Industrial - 0.36% Basil Read Holdings Ltd 82,662 283,041 0.36% 283,041 0.36% Retail - 1.41% Ellerine Holdings Ltd 67,589 664,644 0.85%Mr Price Group Ltd 113,144 435,600 0.56% 1,100,244 1.41% TOTAL SOUTH AFRICA 5,201,201 6.65% SOUTH KOREA - 15.18% Agriculture - 0.54% KT&G Corp 6,010 422,850 0.54% 422,850 0.54% Auto Parts & Equipment - 0.80% Hyundai Mobis 6,560 622,733 0.80% 622,733 0.80% Basic Materials - 1.89% POSCO 3,084 1,478,824 1.89% 1,478,824 1.89% Beverages - 0.71% Hite Brewery Co Ltd 4,304 556,722 0.71% 556,722 0.71% Communications - 0.63% LG Dacom Corp 18,120 493,281 0.63% 493,281 0.63% The accompanying notes form an integral part of the financial statements
NOMURA FUNDS IRELAND PLC
24
GLOBAL EMERGING MARKETS FUND STATEMENT OF INVESTMENTS (CONTINUED) As at 30th June, 2007
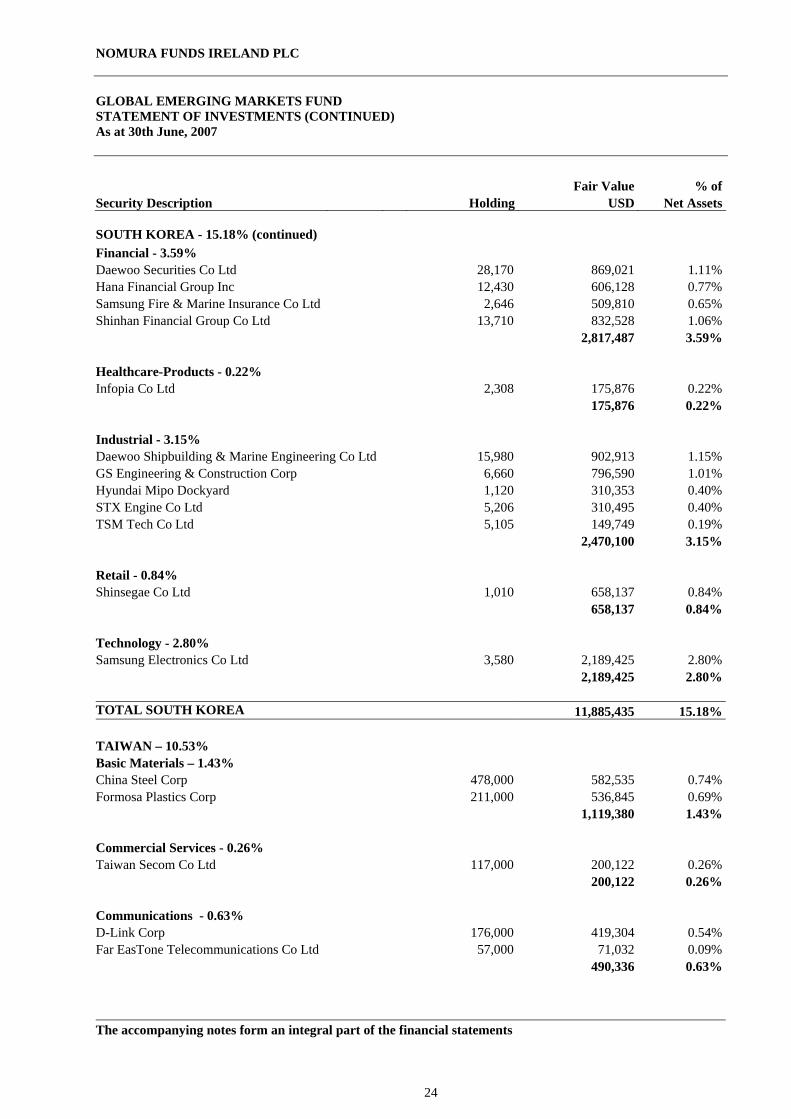
Fair Value % of Security Description Holding USD Net Assets SOUTH KOREA - 15.18% (continued) Financial - 3.59% Daewoo Securities Co Ltd 28,170 869,021 1.11%Hana Financial Group Inc 12,430 606,128 0.77%Samsung Fire & Marine Insurance Co Ltd 2,646 509,810 0.65%Shinhan Financial Group Co Ltd 13,710 832,528 1.06% 2,817,487 3.59% Healthcare-Products - 0.22% Infopia Co Ltd 2,308 175,876 0.22% 175,876 0.22% Industrial - 3.15% Daewoo Shipbuilding & Marine Engineering Co Ltd 15,980 902,913 1.15%GS Engineering & Construction Corp 6,660 796,590 1.01%Hyundai Mipo Dockyard 1,120 310,353 0.40%STX Engine Co Ltd 5,206 310,495 0.40%TSM Tech Co Ltd 5,105 149,749 0.19% 2,470,100 3.15% Retail - 0.84% Shinsegae Co Ltd 1,010 658,137 0.84% 658,137 0.84% Technology - 2.80% Samsung Electronics Co Ltd 3,580 2,189,425 2.80% 2,189,425 2.80% TOTAL SOUTH KOREA 11,885,435 15.18% TAIWAN – 10.53% Basic Materials – 1.43% China Steel Corp 478,000 582,535 0.74%Formosa Plastics Corp 211,000 536,845 0.69% 1,119,380 1.43% Commercial Services - 0.26% Taiwan Secom Co Ltd 117,000 200,122 0.26% 200,122 0.26% Communications - 0.63% D-Link Corp 176,000 419,304 0.54%Far EasTone Telecommunications Co Ltd 57,000 71,032 0.09% 490,336 0.63% The accompanying notes form an integral part of the financial statements
NOMURA FUNDS IRELAND PLC
25
GLOBAL EMERGING MARKETS FUND STATEMENT OF INVESTMENTS (CONTINUED) As at 30th June, 2007
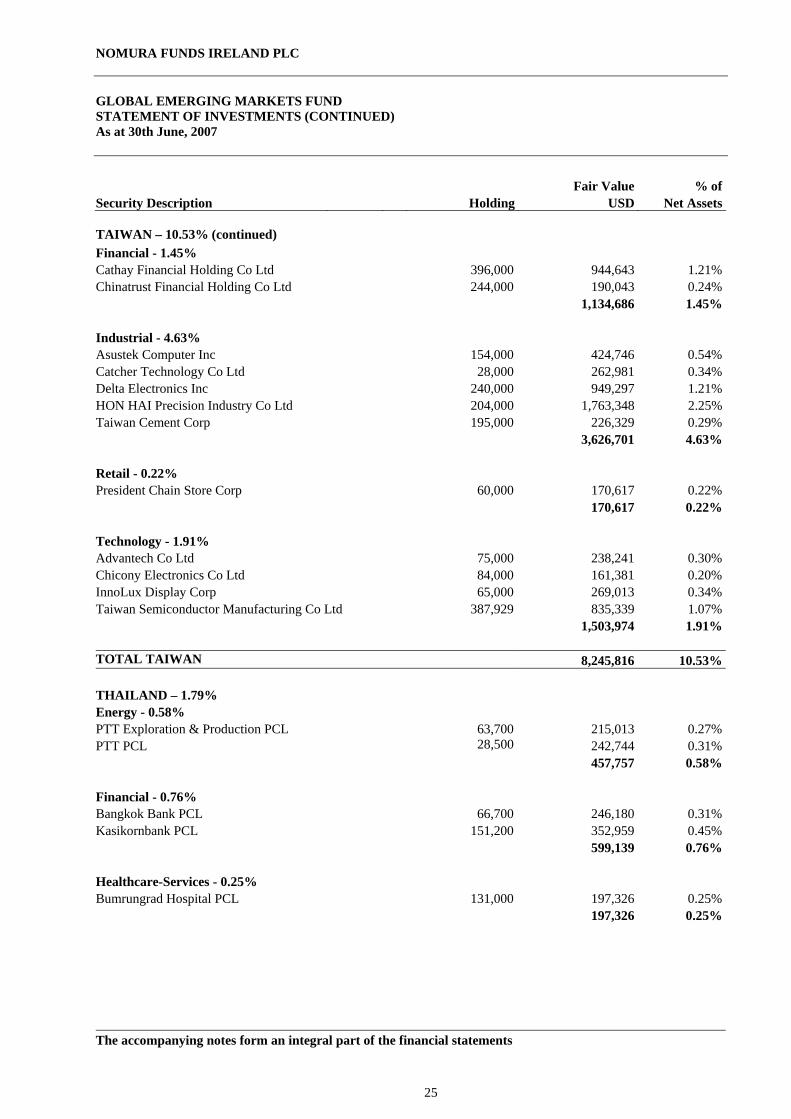
Fair Value % of Security Description Holding USD Net Assets TAIWAN – 10.53% (continued) Financial - 1.45% Cathay Financial Holding Co Ltd 396,000 944,643 1.21%Chinatrust Financial Holding Co Ltd 244,000 190,043 0.24% 1,134,686 1.45% Industrial - 4.63% Asustek Computer Inc 154,000 424,746 0.54%Catcher Technology Co Ltd 28,000 262,981 0.34%Delta Electronics Inc 240,000 949,297 1.21%HON HAI Precision Industry Co Ltd 204,000 1,763,348 2.25%Taiwan Cement Corp 195,000 226,329 0.29% 3,626,701 4.63% Retail - 0.22% President Chain Store Corp 60,000 170,617 0.22% 170,617 0.22% Technology - 1.91% Advantech Co Ltd 75,000 238,241 0.30%Chicony Electronics Co Ltd 84,000 161,381 0.20%InnoLux Display Corp 65,000 269,013 0.34%Taiwan Semiconductor Manufacturing Co Ltd 387,929 835,339 1.07% 1,503,974 1.91% TOTAL TAIWAN 8,245,816 10.53% THAILAND – 1.79% Energy - 0.58% PTT Exploration & Production PCL 63,700 215,013 0.27%PTT PCL 28,500 242,744 0.31% 457,757 0.58% Financial - 0.76% Bangkok Bank PCL 66,700 246,180 0.31%Kasikornbank PCL 151,200 352,959 0.45% 599,139 0.76% Healthcare-Services - 0.25% Bumrungrad Hospital PCL 131,000 197,326 0.25% 197,326 0.25% The accompanying notes form an integral part of the financial statements
NOMURA FUNDS IRELAND PLC
26
GLOBAL EMERGING MARKETS FUND STATEMENT OF INVESTMENTS (CONTINUED) As at 30th June, 2007
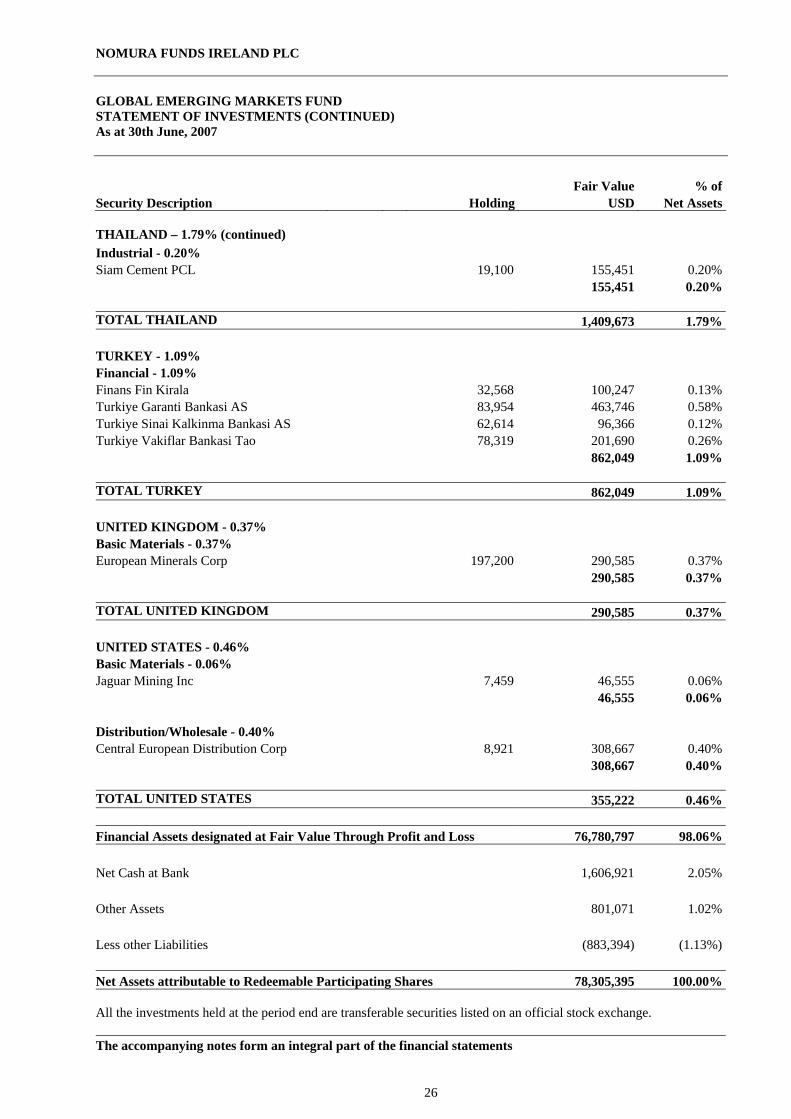
Fair Value % of Security Description Holding USD Net Assets THAILAND – 1.79% (continued) Industrial - 0.20% Siam Cement PCL 19,100 155,451 0.20% 155,451 0.20% TOTAL THAILAND 1,409,673 1.79% TURKEY - 1.09% Financial - 1.09% Finans Fin Kirala 32,568 100,247 0.13%Turkiye Garanti Bankasi AS 83,954 463,746 0.58%Turkiye Sinai Kalkinma Bankasi AS 62,614 96,366 0.12%Turkiye Vakiflar Bankasi Tao 78,319 201,690 0.26% 862,049 1.09% TOTAL TURKEY 862,049 1.09% UNITED KINGDOM - 0.37% Basic Materials - 0.37% European Minerals Corp 197,200 290,585 0.37% 290,585 0.37% TOTAL UNITED KINGDOM 290,585 0.37% UNITED STATES - 0.46% Basic Materials - 0.06% Jaguar Mining Inc 7,459 46,555 0.06% 46,555 0.06% Distribution/Wholesale - 0.40% Central European Distribution Corp 8,921 308,667 0.40% 308,667 0.40% TOTAL UNITED STATES 355,222 0.46% Financial Assets designated at Fair Value Through Profit and Loss 76,780,797 98.06% Net Cash at Bank 1,606,921 2.05% Other Assets 801,071 1.02% Less other Liabilities (883,394) (1.13%) Net Assets attributable to Redeemable Participating Shares 78,305,395 100.00% All the investments held at the period end are transferable securities listed on an official stock exchange. The accompanying notes form an integral part of the financial statements
NOMURA FUNDS IRELAND PLC
27
INDIA EQUITY FUND STATEMENT OF INVESTMENTS As at 30th June, 2007
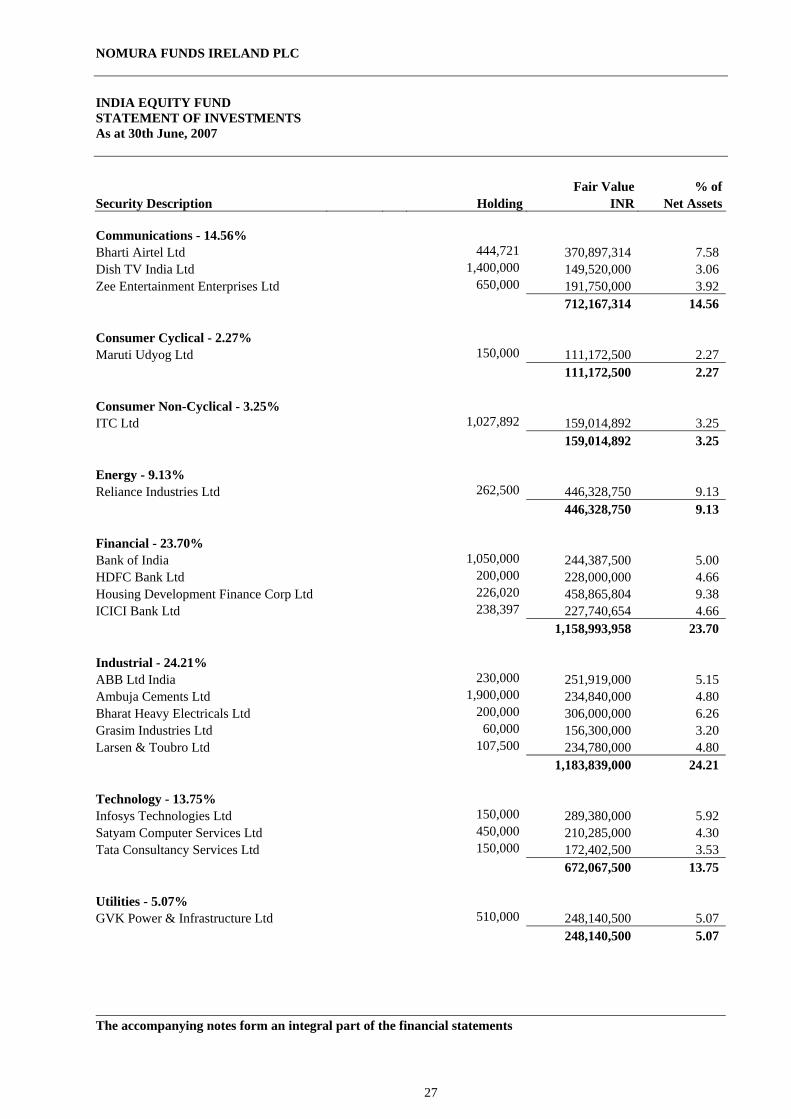
Fair Value % of Security Description Holding INR Net Assets Communications - 14.56% Bharti Airtel Ltd 444,721 370,897,314 7.58 Dish TV India Ltd 1,400,000 149,520,000 3.06 Zee Entertainment Enterprises Ltd 650,000 191,750,000 3.92 712,167,314 14.56 Consumer Cyclical - 2.27% Maruti Udyog Ltd 150,000 111,172,500 2.27 111,172,500 2.27 Consumer Non-Cyclical - 3.25% ITC Ltd 1,027,892 159,014,892 3.25 159,014,892 3.25 Energy - 9.13% Reliance Industries Ltd 262,500 446,328,750 9.13 446,328,750 9.13 Financial - 23.70% Bank of India 1,050,000 244,387,500 5.00 HDFC Bank Ltd 200,000 228,000,000 4.66 Housing Development Finance Corp Ltd 226,020 458,865,804 9.38 ICICI Bank Ltd 238,397 227,740,654 4.66 1,158,993,958 23.70 Industrial - 24.21% ABB Ltd India 230,000 251,919,000 5.15 Ambuja Cements Ltd 1,900,000 234,840,000 4.80 Bharat Heavy Electricals Ltd 200,000 306,000,000 6.26 Grasim Industries Ltd 60,000 156,300,000 3.20 Larsen & Toubro Ltd 107,500 234,780,000 4.80 1,183,839,000 24.21 Technology - 13.75% Infosys Technologies Ltd 150,000 289,380,000 5.92 Satyam Computer Services Ltd 450,000 210,285,000 4.30 Tata Consultancy Services Ltd 150,000 172,402,500 3.53 672,067,500 13.75 Utilities - 5.07% GVK Power & Infrastructure Ltd 510,000 248,140,500 5.07 248,140,500 5.07 The accompanying notes form an integral part of the financial statements
NOMURA FUNDS IRELAND PLC
28
INDIA EQUITY FUND STATEMENT OF INVESTMENTS (CONTINUED) As at 30th June, 2007
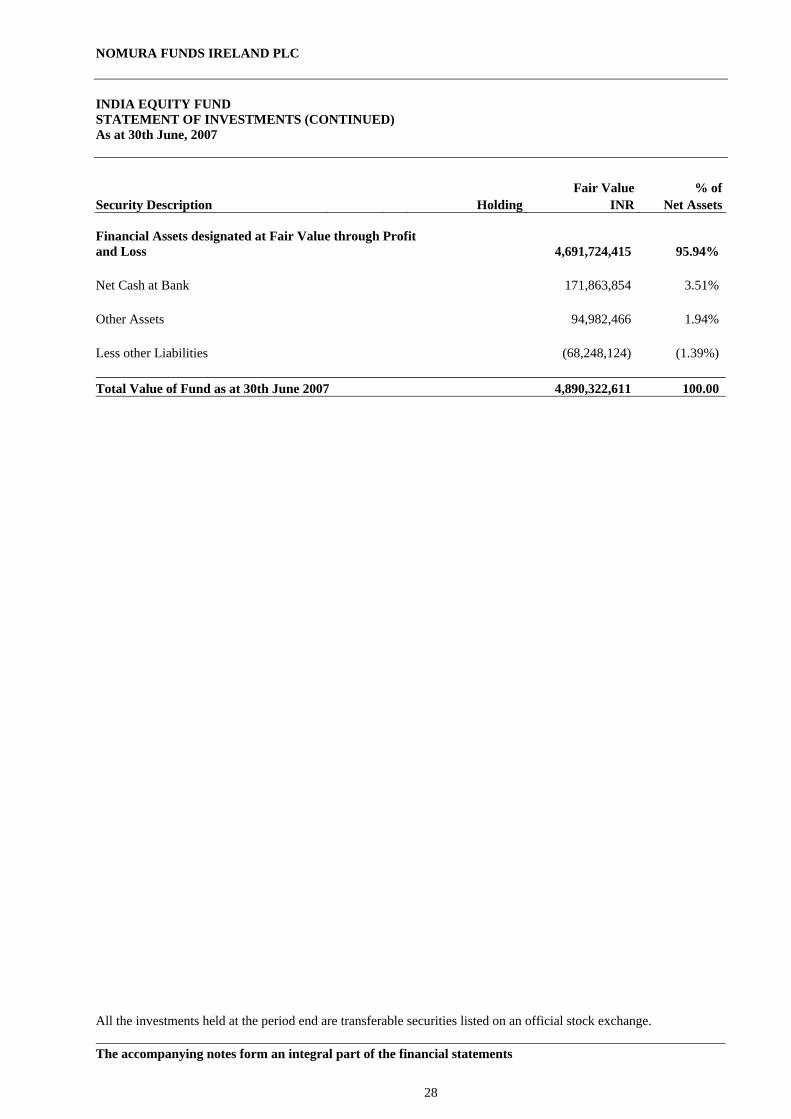
Fair Value % of Security Description Holding INR Net Assets Financial Assets designated at Fair Value through Profit and Loss 4,691,724,415 95.94% Net Cash at Bank 171,863,854 3.51% Other Assets 94,982,466 1.94% Less other Liabilities (68,248,124) (1.39%) Total Value of Fund as at 30th June 2007 4,890,322,611 100.00 All the investments held at the period end are transferable securities listed on an official stock exchange. The accompanying notes form an integral part of the financial statements
NOMURA FUNDS IRELAND PLC
29
ASIA PACIFIC EX-JAPAN EQUITY FUND STATEMENT OF INVESTMENTS As at 30th June, 2007
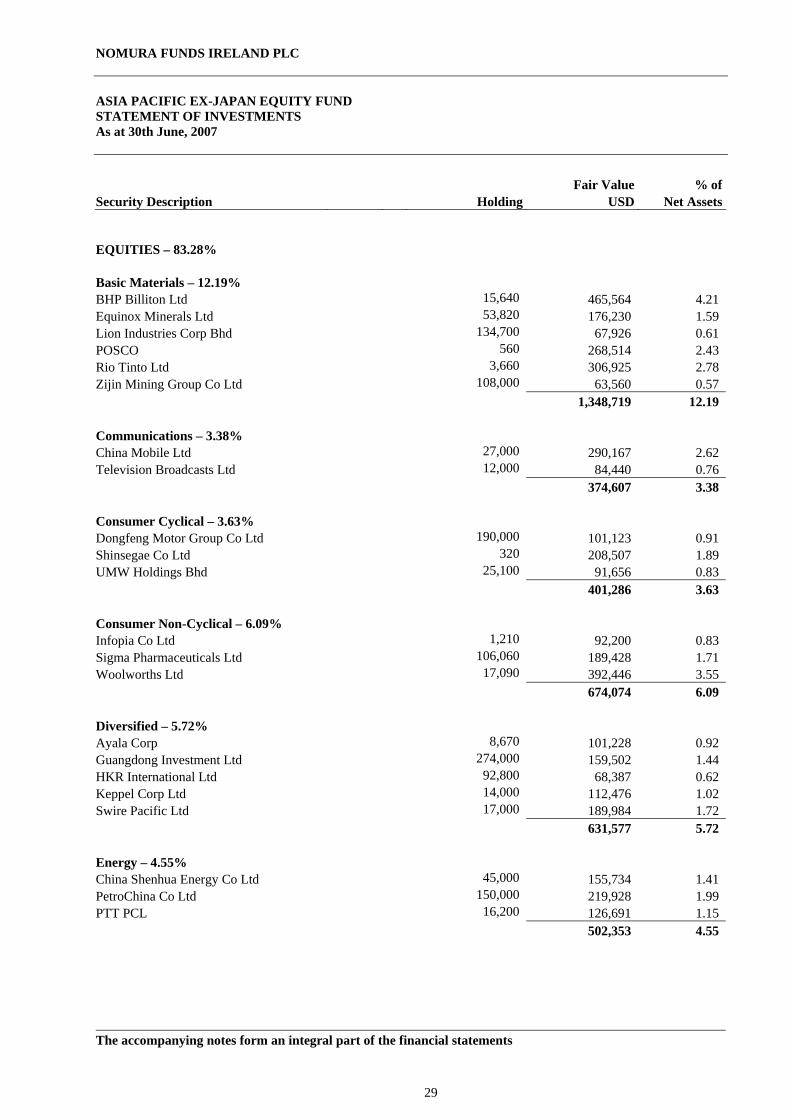
Fair Value % of Security Description Holding USD Net Assets EQUITIES – 83.28% Basic Materials – 12.19% BHP Billiton Ltd 15,640 465,564 4.21 Equinox Minerals Ltd 53,820 176,230 1.59 Lion Industries Corp Bhd 134,700 67,926 0.61 POSCO 560 268,514 2.43 Rio Tinto Ltd 3,660 306,925 2.78 Zijin Mining Group Co Ltd 108,000 63,560 0.57 1,348,719 12.19 Communications – 3.38% China Mobile Ltd 27,000 290,167 2.62 Television Broadcasts Ltd 12,000 84,440 0.76 374,607 3.38 Consumer Cyclical – 3.63% Dongfeng Motor Group Co Ltd 190,000 101,123 0.91 Shinsegae Co Ltd 320 208,507 1.89 UMW Holdings Bhd 25,100 91,656 0.83 401,286 3.63 Consumer Non-Cyclical – 6.09% Infopia Co Ltd 1,210 92,200 0.83 Sigma Pharmaceuticals Ltd 106,060 189,428 1.71 Woolworths Ltd 17,090 392,446 3.55 674,074 6.09 Diversified – 5.72% Ayala Corp 8,670 101,228 0.92 Guangdong Investment Ltd 274,000 159,502 1.44 HKR International Ltd 92,800 68,387 0.62 Keppel Corp Ltd 14,000 112,476 1.02 Swire Pacific Ltd 17,000 189,984 1.72 631,577 5.72 Energy – 4.55% China Shenhua Energy Co Ltd 45,000 155,734 1.41 PetroChina Co Ltd 150,000 219,928 1.99 PTT PCL 16,200 126,691 1.15 502,353 4.55 The accompanying notes form an integral part of the financial statements
NOMURA FUNDS IRELAND PLC
30
ASIA PACIFIC EX-JAPAN EQUITY FUND STATEMENT OF INVESTMENTS (CONTINUED) As at 30th June, 2007
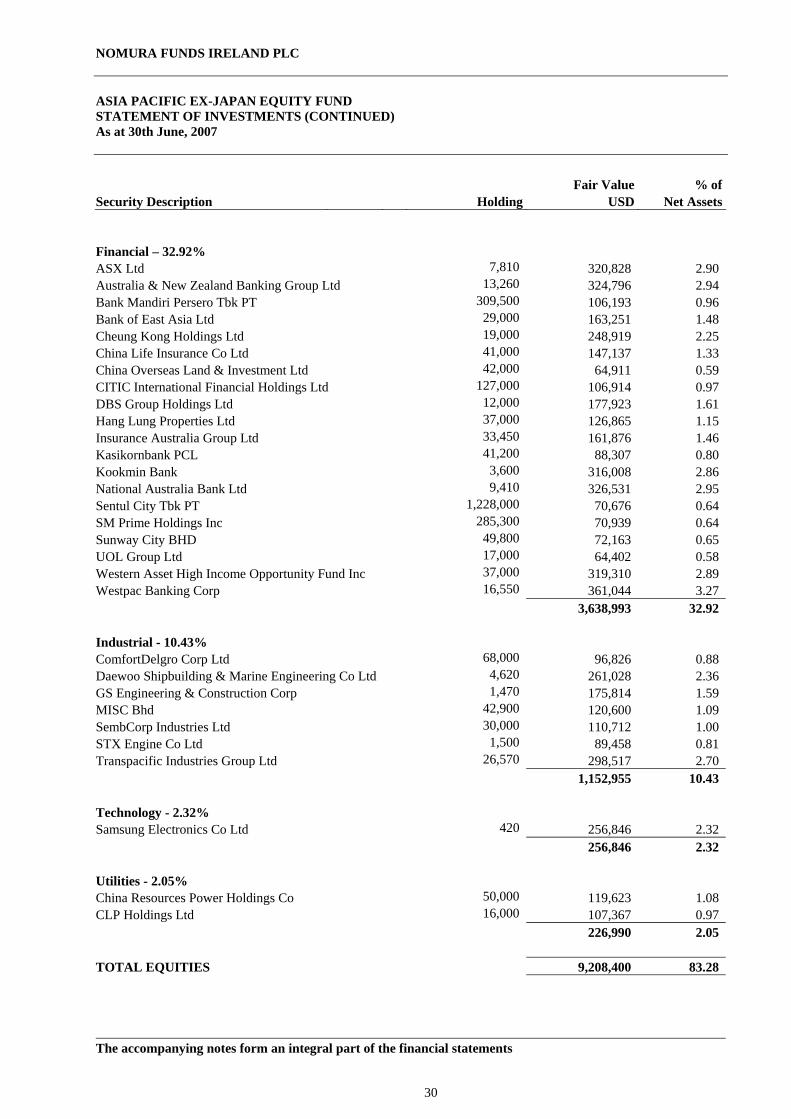
Fair Value % of Security Description Holding USD Net Assets Financial – 32.92% ASX Ltd 7,810 320,828 2.90 Australia & New Zealand Banking Group Ltd 13,260 324,796 2.94 Bank Mandiri Persero Tbk PT 309,500 106,193 0.96 Bank of East Asia Ltd 29,000 163,251 1.48 Cheung Kong Holdings Ltd 19,000 248,919 2.25 China Life Insurance Co Ltd 41,000 147,137 1.33 China Overseas Land & Investment Ltd 42,000 64,911 0.59 CITIC International Financial Holdings Ltd 127,000 106,914 0.97 DBS Group Holdings Ltd 12,000 177,923 1.61 Hang Lung Properties Ltd 37,000 126,865 1.15 Insurance Australia Group Ltd 33,450 161,876 1.46 Kasikornbank PCL 41,200 88,307 0.80 Kookmin Bank 3,600 316,008 2.86 National Australia Bank Ltd 9,410 326,531 2.95 Sentul City Tbk PT 1,228,000 70,676 0.64 SM Prime Holdings Inc 285,300 70,939 0.64 Sunway City BHD 49,800 72,163 0.65 UOL Group Ltd 17,000 64,402 0.58 Western Asset High Income Opportunity Fund Inc 37,000 319,310 2.89 Westpac Banking Corp 16,550 361,044 3.27 3,638,993 32.92 Industrial - 10.43% ComfortDelgro Corp Ltd 68,000 96,826 0.88 Daewoo Shipbuilding & Marine Engineering Co Ltd 4,620 261,028 2.36 GS Engineering & Construction Corp 1,470 175,814 1.59 MISC Bhd 42,900 120,600 1.09 SembCorp Industries Ltd 30,000 110,712 1.00 STX Engine Co Ltd 1,500 89,458 0.81 Transpacific Industries Group Ltd 26,570 298,517 2.70 1,152,955 10.43 Technology - 2.32% Samsung Electronics Co Ltd 420 256,846 2.32 256,846 2.32 Utilities - 2.05% China Resources Power Holdings Co 50,000 119,623 1.08 CLP Holdings Ltd 16,000 107,367 0.97 226,990 2.05 TOTAL EQUITIES 9,208,400 83.28 The accompanying notes form an integral part of the financial statements
NOMURA FUNDS IRELAND PLC
31
ASIA PACIFIC EX-JAPAN EQUITY FUND STATEMENT OF INVESTMENTS (CONTINUED) As at 30th June, 2007
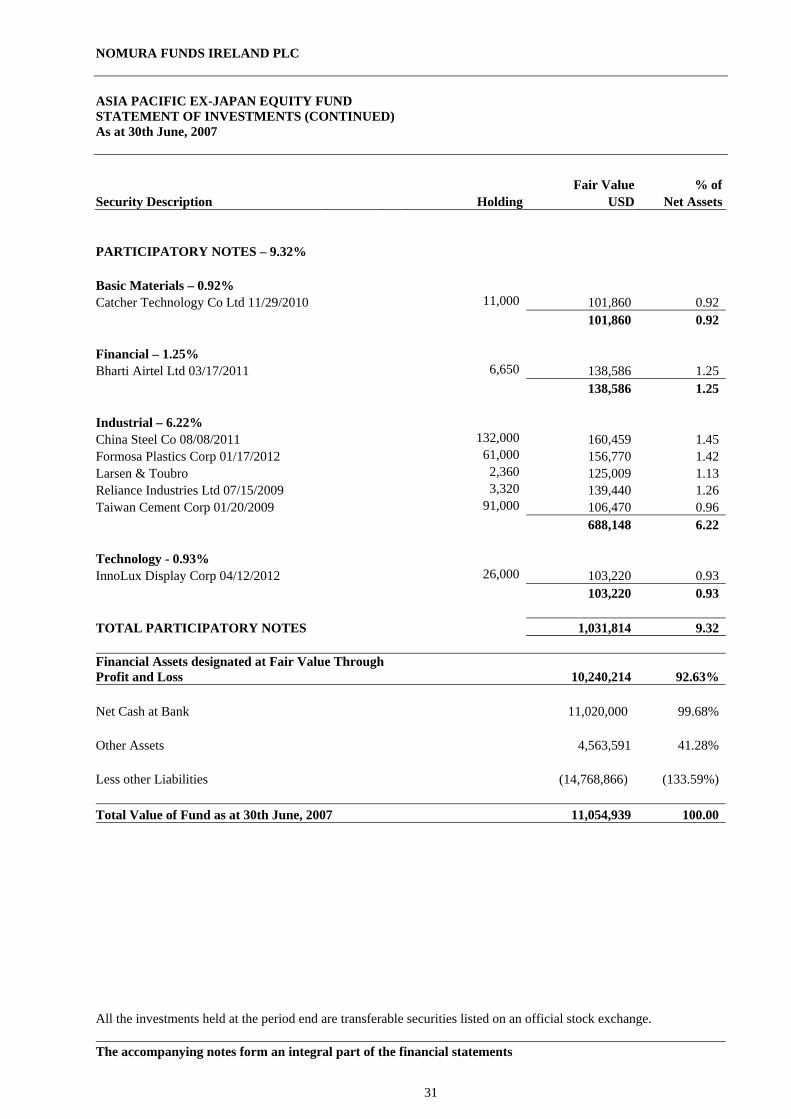
Fair Value % of Security Description Holding USD Net Assets PARTICIPATORY NOTES – 9.32% Basic Materials – 0.92% Catcher Technology Co Ltd 11/29/2010 11,000 101,860 0.92 101,860 0.92 Financial – 1.25% Bharti Airtel Ltd 03/17/2011 6,650 138,586 1.25 138,586 1.25 Industrial – 6.22% China Steel Co 08/08/2011 132,000 160,459 1.45 Formosa Plastics Corp 01/17/2012 61,000 156,770 1.42 Larsen & Toubro 2,360 125,009 1.13 Reliance Industries Ltd 07/15/2009 3,320 139,440 1.26 Taiwan Cement Corp 01/20/2009 91,000 106,470 0.96 688,148 6.22 Technology - 0.93% InnoLux Display Corp 04/12/2012 26,000 103,220 0.93 103,220 0.93 TOTAL PARTICIPATORY NOTES 1,031,814 9.32 Financial Assets designated at Fair Value Through Profit and Loss 10,240,214 92.63% Net Cash at Bank 11,020,000 99.68% Other Assets 4,563,591 41.28% Less other Liabilities (14,768,866) (133.59%) Total Value of Fund as at 30th June, 2007 11,054,939 100.00 All the investments held at the period end are transferable securities listed on an official stock exchange. The accompanying notes form an integral part of the financial statements
NOMURA FUNDS IRELAND PLC
32
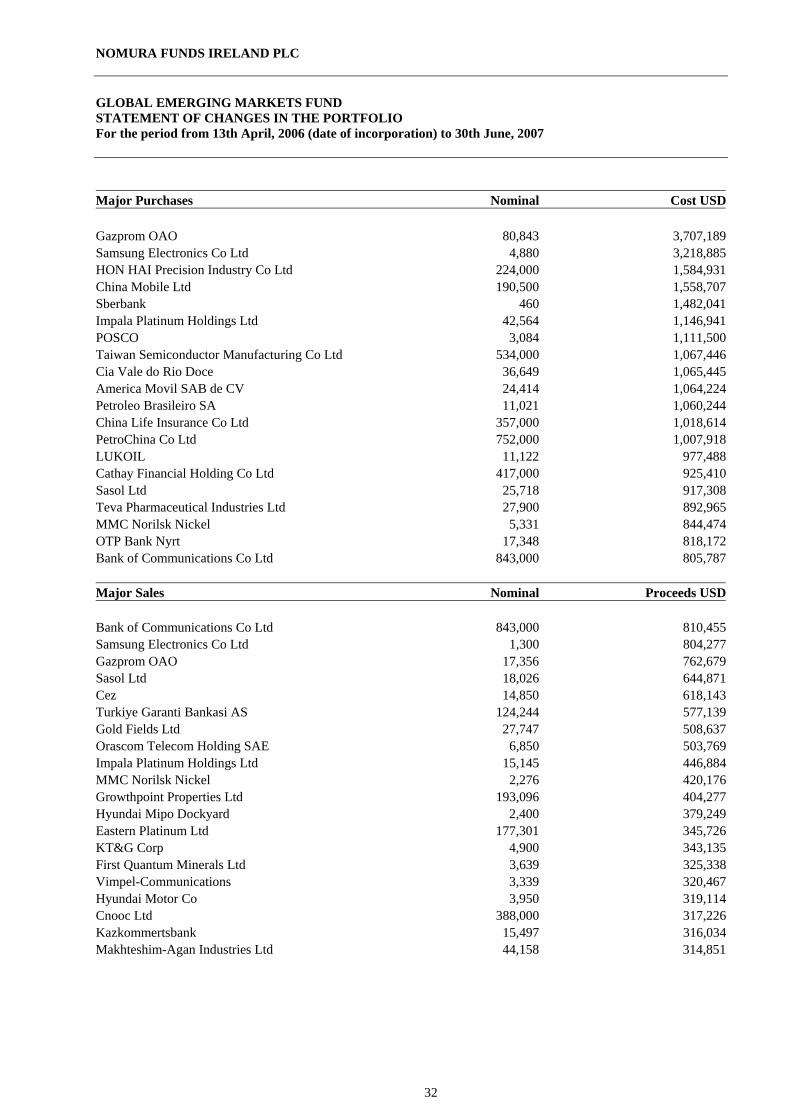
GLOBAL EMERGING MARKETS FUND STATEMENT OF CHANGES IN THE PORTFOLIO For the period from 13th April, 2006 (date of incorporation) to 30th June, 2007
Major Purchases Nominal Cost USD Gazprom OAO 80,843 3,707,189 Samsung Electronics Co Ltd 4,880 3,218,885 HON HAI Precision Industry Co Ltd 224,000 1,584,931 China Mobile Ltd 190,500 1,558,707 Sberbank 460 1,482,041 Impala Platinum Holdings Ltd 42,564 1,146,941 POSCO 3,084 1,111,500 Taiwan Semiconductor Manufacturing Co Ltd 534,000 1,067,446 Cia Vale do Rio Doce 36,649 1,065,445 America Movil SAB de CV 24,414 1,064,224 Petroleo Brasileiro SA 11,021 1,060,244 China Life Insurance Co Ltd 357,000 1,018,614 PetroChina Co Ltd 752,000 1,007,918 LUKOIL 11,122 977,488 Cathay Financial Holding Co Ltd 417,000 925,410 Sasol Ltd 25,718 917,308 Teva Pharmaceutical Industries Ltd 27,900 892,965 MMC Norilsk Nickel 5,331 844,474 OTP Bank Nyrt 17,348 818,172 Bank of Communications Co Ltd 843,000 805,787 Major Sales Nominal Proceeds USD Bank of Communications Co Ltd 843,000 810,455 Samsung Electronics Co Ltd 1,300 804,277 Gazprom OAO 17,356 762,679 Sasol Ltd 18,026 644,871 Cez 14,850 618,143 Turkiye Garanti Bankasi AS 124,244 577,139 Gold Fields Ltd 27,747 508,637 Orascom Telecom Holding SAE 6,850 503,769 Impala Platinum Holdings Ltd 15,145 446,884 MMC Norilsk Nickel 2,276 420,176 Growthpoint Properties Ltd 193,096 404,277 Hyundai Mipo Dockyard 2,400 379,249 Eastern Platinum Ltd 177,301 345,726 KT&G Corp 4,900 343,135 First Quantum Minerals Ltd 3,639 325,338 Vimpel-Communications 3,339 320,467 Hyundai Motor Co 3,950 319,114 Cnooc Ltd 388,000 317,226 Kazkommertsbank 15,497 316,034 Makhteshim-Agan Industries Ltd 44,158 314,851

NOMURA FUNDS IRELAND PLC
33
INDIA EQUITY FUND STATEMENT OF CHANGES IN THE PORTFOLIO For the period from 13th April, 2006 (date of incorporation) to 30th June, 2007 Major Purchases Nominal Cost INR Housing Development Finance Corp Ltd 250,000 398,457,081 Reliance Industries Ltd 275,000 374,585,907 Infosys Technologies Ltd 171,000 371,787,278 Ambuja Cements Ltd 2,500,000 360,176,623 Bharti Airtel Ltd 444,721 302,951,160 Cipla Ltd 1,072,340 275,494,131 Bharat Heavy Electricals Ltd 120,000 273,326,173 Satyam Computer Services Ltd 544,971 268,230,913 HDFC Bank Ltd 215,000 231,914,647 ICICI Bank Ltd 238,397 229,811,124 Tata Motors Ltd 225,000 212,967,101 Grasim Industries Ltd 75,000 208,754,950 ABB Ltd India 54,256 198,643,863 Larsen & Toubro Ltd 125,000 191,721,777 Bank of India 1,100,000 190,674,838 Tata Consultancy Services Ltd 150,000 187,855,415 Zee Entertainment Enterprises Ltd 650,000 186,002,366 Maruti Udyog Ltd 200,000 184,268,152 ITC Ltd 1,027,892 176,650,846 GVK Power & Infrastructure Ltd 530,761 172,497,325 All Sales Nominal Proceeds INR Cipla Ltd 1,072,340 243,170,645 Tata Motors Ltd 225,000 158,848,278 Ashok Leyland Ltd 2,000,000 74,731,889 Ambuja Cements Ltd 600,000 64,740,574 Satyam Computer Services Ltd 94,971 48,421,341 Housing Development Finance Corp Ltd 23,980 46,776,053 Bharat Heavy Electricals Ltd 20,000 45,600,969 Infosys Technologies Ltd 21,000 43,816,514 Maruti Udyog Ltd 50,000 38,861,636 ABB Ltd India 24,256 38,822,974 Larsen & Toubro Ltd 17,500 36,154,325 Grasim Industries Ltd 15,000 32,043,335 Reliance Industries Ltd 12,500 21,807,527 HDFC Bank Ltd 15,000 17,187,417 Bank of India 50,000 11,145,828 GVK Power & Infrastructure Ltd 20,761 9,579,764
NOMURA FUNDS IRELAND PLC
34
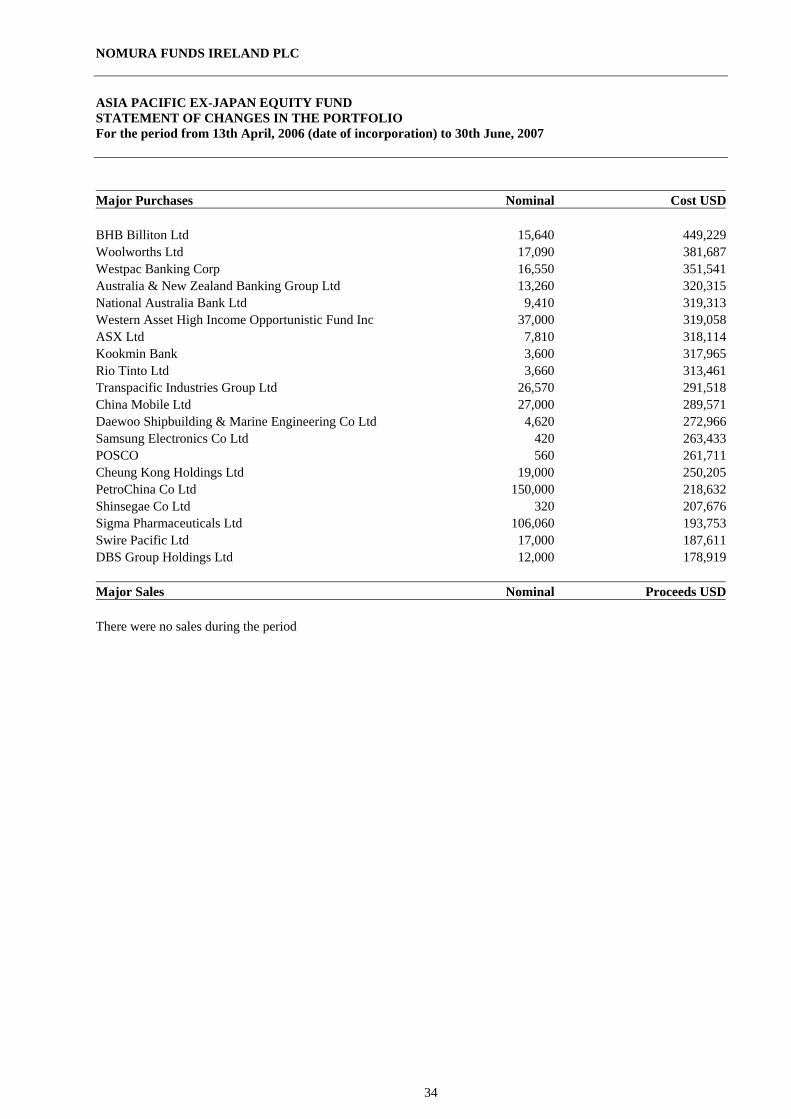
ASIA PACIFIC EX-JAPAN EQUITY FUND STATEMENT OF CHANGES IN THE PORTFOLIO For the period from 13th April, 2006 (date of incorporation) to 30th June, 2007
Major Purchases Nominal Cost USD BHB Billiton Ltd 15,640 449,229Woolworths Ltd 17,090 381,687Westpac Banking Corp 16,550 351,541Australia & New Zealand Banking Group Ltd 13,260 320,315National Australia Bank Ltd 9,410 319,313Western Asset High Income Opportunistic Fund Inc 37,000 319,058ASX Ltd 7,810 318,114Kookmin Bank 3,600 317,965Rio Tinto Ltd 3,660 313,461Transpacific Industries Group Ltd 26,570 291,518China Mobile Ltd 27,000 289,571Daewoo Shipbuilding & Marine Engineering Co Ltd 4,620 272,966Samsung Electronics Co Ltd 420 263,433POSCO 560 261,711Cheung Kong Holdings Ltd 19,000 250,205PetroChina Co Ltd 150,000 218,632Shinsegae Co Ltd 320 207,676Sigma Pharmaceuticals Ltd 106,060 193,753Swire Pacific Ltd 17,000 187,611DBS Group Holdings Ltd 12,000 178,919 Major Sales Nominal Proceeds USD There were no sales during the period
NOMURA FUNDS IRELAND PLC
35
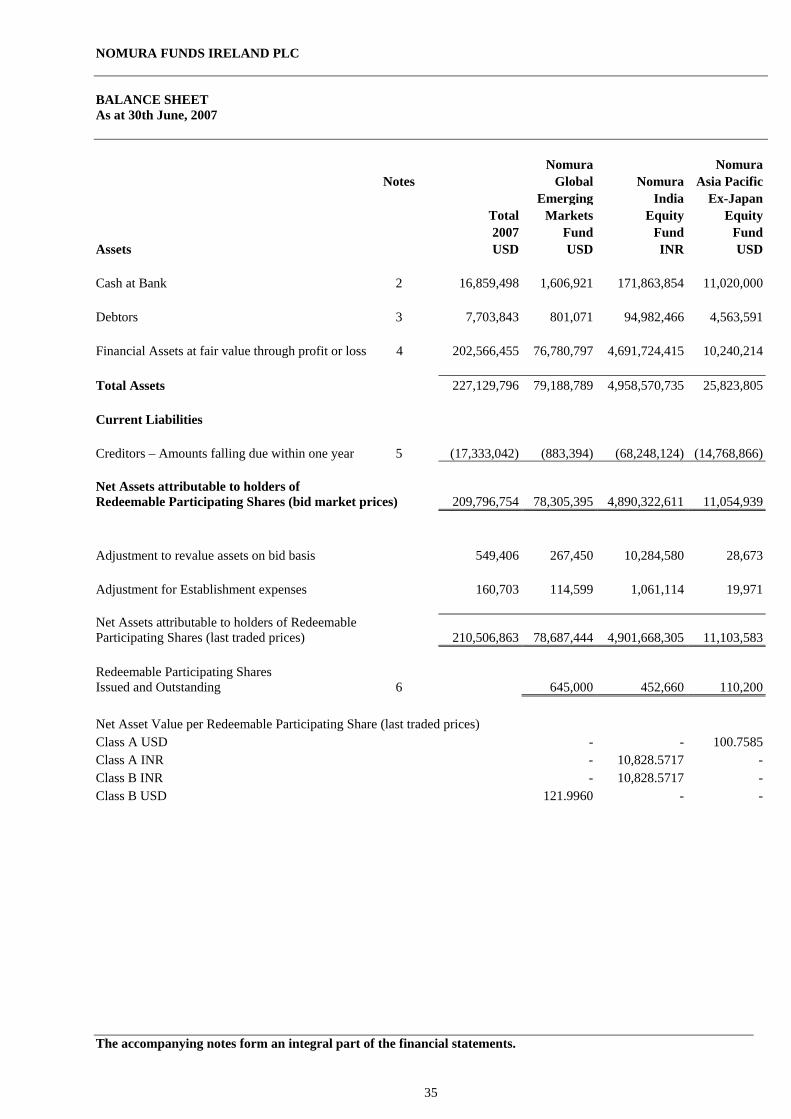
BALANCE SHEET As at 30th June, 2007 Nomura Nomura Notes Global Nomura Asia Pacific Emerging India Ex-Japan Total Markets Equity Equity 2007 Fund Fund FundAssets USD USD INR USD Cash at Bank 2 16,859,498 1,606,921 171,863,854 11,020,000 Debtors 3 7,703,843 801,071 94,982,466 4,563,591 Financial Assets at fair value through profit or loss 4 202,566,455 76,780,797 4,691,724,415 10,240,214 Total Assets 227,129,796 79,188,789 4,958,570,735 25,823,805 Current Liabilities Creditors – Amounts falling due within one year 5 (17,333,042) (883,394) (68,248,124) (14,768,866) Net Assets attributable to holders of Redeemable Participating Shares (bid market prices) 209,796,754 78,305,395 4,890,322,611 11,054,939 Adjustment to revalue assets on bid basis 549,406 267,450 10,284,580 28,673 Adjustment for Establishment expenses 160,703 114,599 1,061,114 19,971 Net Assets attributable to holders of Redeemable Participating Shares (last traded prices) 210,506,863 78,687,444 4,901,668,305 11,103,583 Redeemable Participating Shares Issued and Outstanding 6 645,000 452,660 110,200 Net Asset Value per Redeemable Participating Share (last traded prices) Class A USD - - 100.7585Class A INR - 10,828.5717 -Class B INR - 10,828.5717 -Class B USD 121.9960 - -
The accompanying notes form an integral part of the financial statements.
NOMURA FUNDS IRELAND PLC
36
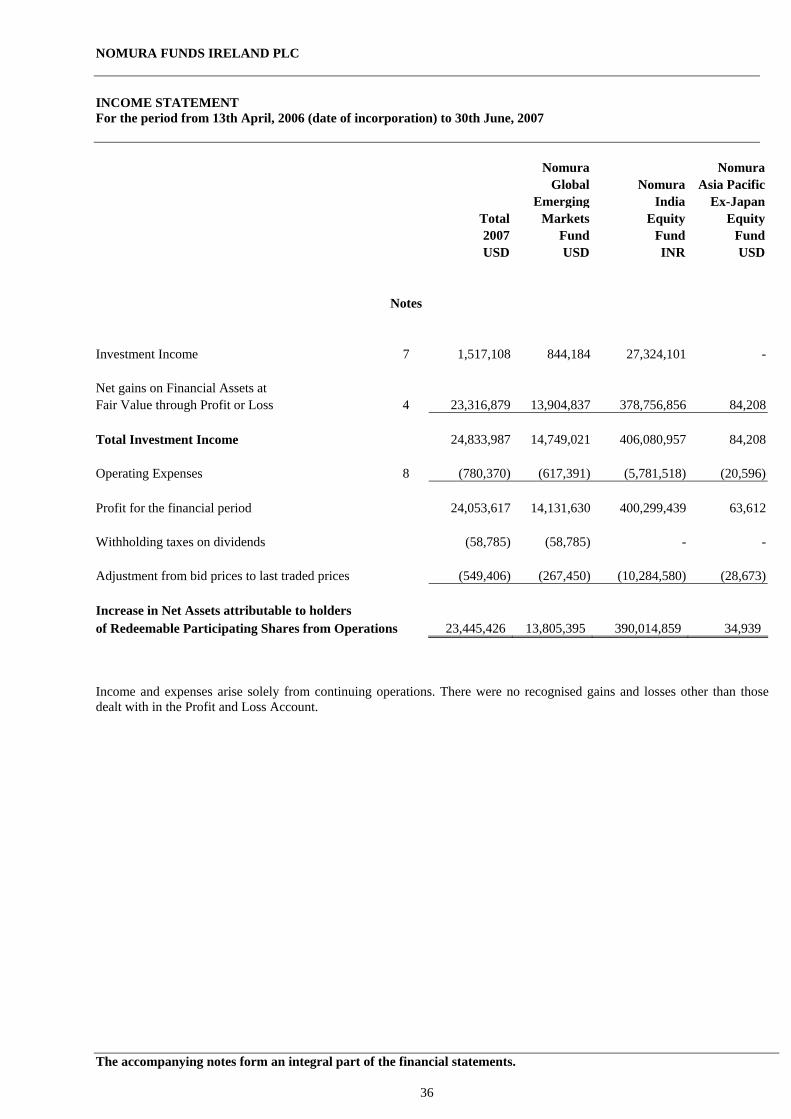
INCOME STATEMENT For the period from 13th April, 2006 (date of incorporation) to 30th June, 2007 Nomura Nomura Global Nomura Asia Pacific Emerging India Ex-Japan Total Markets Equity Equity 2007 Fund Fund Fund USD USD INR USD Notes Investment Income 7 1,517,108 844,184 27,324,101 - Net gains on Financial Assets at Fair Value through Profit or Loss 4 23,316,879 13,904,837 378,756,856 84,208 Total Investment Income 24,833,987 14,749,021 406,080,957 84,208 Operating Expenses 8 (780,370) (617,391) (5,781,518) (20,596) Profit for the financial period 24,053,617 14,131,630 400,299,439 63,612
Withholding taxes on dividends (58,785) (58,785) - - Adjustment from bid prices to last traded prices (549,406) (267,450) (10,284,580) (28,673) Increase in Net Assets attributable to holders of Redeemable Participating Shares from Operations 23,445,426 13,805,395 390,014,859 34,939 Income and expenses arise solely from continuing operations. There were no recognised gains and losses other than those dealt with in the Profit and Loss Account. The accompanying notes form an integral part of the financial statements.
NOMURA FUNDS IRELAND PLC
37
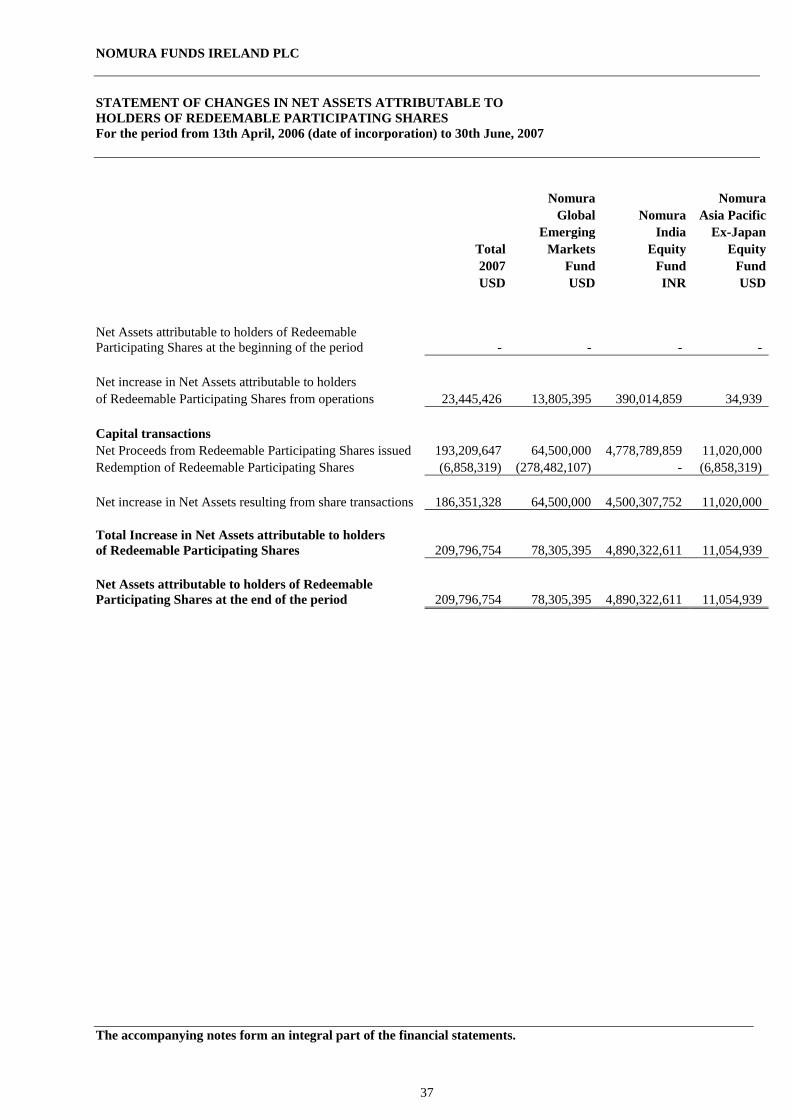
STATEMENT OF CHANGES IN NET ASSETS ATTRIBUTABLE TO HOLDERS OF REDEEMABLE PARTICIPATING SHARES For the period from 13th April, 2006 (date of incorporation) to 30th June, 2007 Nomura Nomura Global Nomura Asia Pacific Emerging India Ex-Japan Total Markets Equity Equity 2007 Fund Fund Fund USD USD INR USD
Net Assets attributable to holders of Redeemable Participating Shares at the beginning of the period - - - - Net increase in Net Assets attributable to holders of Redeemable Participating Shares from operations 23,445,426 13,805,395 390,014,859 34,939
Capital transactions Net Proceeds from Redeemable Participating Shares issued 193,209,647 64,500,000 4,778,789,859 11,020,000 Redemption of Redeemable Participating Shares (6,858,319) (278,482,107) - (6,858,319) Net increase in Net Assets resulting from share transactions 186,351,328 64,500,000 4,500,307,752 11,020,000 Total Increase in Net Assets attributable to holders of Redeemable Participating Shares 209,796,754 78,305,395 4,890,322,611 11,054,939 Net Assets attributable to holders of Redeemable Participating Shares at the end of the period 209,796,754 78,305,395 4,890,322,611 11,054,939
The accompanying notes form an integral part of the financial statements.
NOMURA FUNDS IRELAND PLC
38
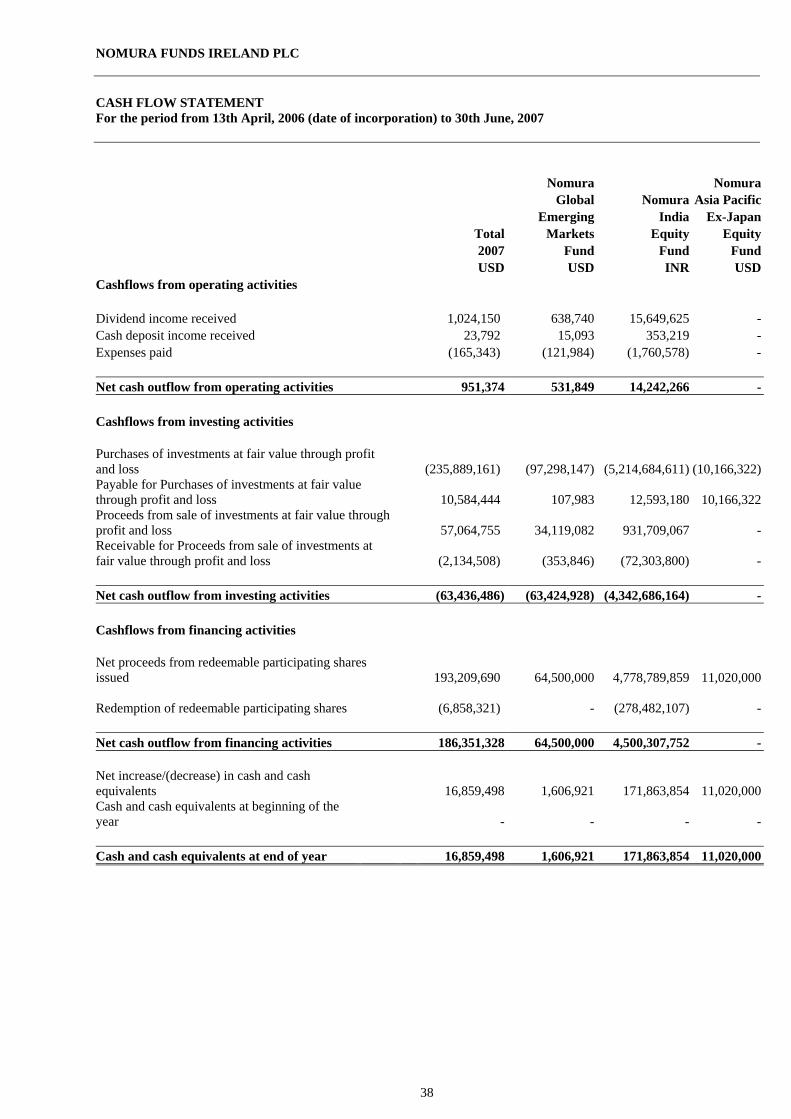
CASH FLOW STATEMENT For the period from 13th April, 2006 (date of incorporation) to 30th June, 2007 Nomura Nomura Global Nomura Asia Pacific Emerging India Ex-Japan Total Markets Equity Equity 2007 Fund Fund Fund USD USD INR USDCashflows from operating activities Dividend income received 1,024,150 638,740 15,649,625 -Cash deposit income received 23,792 15,093 353,219 -Expenses paid (165,343) (121,984) (1,760,578) - Net cash outflow from operating activities 951,374 531,849 14,242,266 - Cashflows from investing activities Purchases of investments at fair value through profit and loss
(235,889,161)
(97,298,147) (5,214,684,611) (10,166,322)
Payable for Purchases of investments at fair value through profit and loss
10,584,444
107,983 12,593,180 10,166,322
Proceeds from sale of investments at fair value through profit and loss
57,064,755
34,119,082 931,709,067 -
Receivable for Proceeds from sale of investments at fair value through profit and loss (2,134,508) (353,846) (72,303,800) - Net cash outflow from investing activities (63,436,486) (63,424,928) (4,342,686,164) -
Cashflows from financing activities
Net proceeds from redeemable participating shares issued 193,209,690 64,500,000 4,778,789,859 11,020,000
Redemption of redeemable participating shares
(6,858,321)
- (278,482,107) -
Net cash outflow from financing activities 186,351,328 64,500,000 4,500,307,752 - Net increase/(decrease) in cash and cash equivalents 16,859,498 1,606,921 171,863,854 11,020,000Cash and cash equivalents at beginning of the year -
- - -
Cash and cash equivalents at end of year 16,859,498 1,606,921 171,863,854 11,020,000
NOMURA FUNDS IRELAND PLC
39
NOTES TO THE FINANCIAL STATEMENTS For the period from 13th April, 2006 (date of incorporation) to 30th June, 2007 1. Summary of Significant Accounting Policies
The principal accounting policies applied in the preparation of these financial statements are set out below. Basis of Preparation The financial statements of Nomura Funds Ireland Plc have been prepared in accordance with International Financial Reporting Standards (IFRS) and Irish statute comprising the Companies Acts, 1963 to 2006, and the European Communities (Undertakings for Collective Investment in Transferable Securities) Regulations 2003 (as amended). The financial statements have been prepared under the historical cost convention, as modified by the revaluation of financial assets and financial liabilities at fair value through profit or loss. The preparation of financial statements in conformity with IFRS requires the use of certain critical accounting estimates. It also requires the Board of Directors to exercise its judgement in the process of applying the Fund’s accounting policies. Financial Assets and Financial Liabilities at Fair Value through Profit or Loss1 (a) Classification The Company classifies its investments as financial assets or financial liabilities at fair value through profit or loss. These financial assets and financial liabilities are classified as held for trading or designated by the Board of Directors at fair value through profit or loss at inception. Financial assets or financial liabilities held for trading are those acquired or incurred principally for the purposes of selling or repurchasing in the short term. (b) Recognition/Derecognition Purchases and sales of investments are recognised on the trade date – the date on which the Sub-Fund commits to purchase or sell the investment. Investments are derecognised when the rights to receive cash flows from the investments have expired or the Sub-Fund has transferred substantially all risks and rewards of ownership. (c) Measurement Financial assets and financial liabilities at fair value through profit or loss are initially recognised at fair value. Transaction costs are expensed in the Income Statement. Subsequent to initial recognition, all financial assets and financial liabilities at fair value through profit or loss are measured at fair value. Gains and losses arising from changes in the fair value of the ‘financial assets or financial liabilities at fair value through profit or loss’ category are presented in the Income Statement in the period in which they arise. Dividend income from financial assets at fair value through profit or loss is recognised in the Income Statement within dividend income when the Company’s right to receive payments is established. (d) Fair Value Estimation The fair value of financial instruments traded in active markets (such as trading securities) is based on quoted market prices at the balance sheet date. The quoted market price used for financial assets held by the Sub-Funds is the current bid price; the appropriate quoted market price for financial liabilities is the current asking price. The fair value of financial instruments that are not traded in an active market is determined by using valuation techniques. The Sub-Funds uses a variety of methods and make assumptions that are based on market conditions existing at each balance sheet date. Valuation techniques used include the use of comparable recent arm’s length transactions, discounted cash flow analysis and other valuation techniques commonly used by market participants. There were no investments priced in this manner during the period from 13th April, 2006 (date of incorporation) to 30th June, 2007.
NOMURA FUNDS IRELAND PLC
40
NOTES TO THE FINANCIAL STATEMENTS For the period from 13th April, 2006 (date of incorporation) to 30th June, 2007 1. Summary of Significant Accounting Policies (continued)
Foreign Currency Translation Functional and Presentation Currency Items included in the Sub-Fund’s financial statements are measured using the currency of the primary economic environment in which it operates (‘the functional currency’). The Board of Directors considers the US Dollar as the currency that most faithfully represents the economic effects of the underlying transactions, events and conditions of the Global Emerging Markets Fund and the Asia Pacific Ex-Japan Equity Fund and the Indian Rupee in the case of the India Equity Fund. Transactions and Balances Foreign currency transactions are translated into the functional currency using the exchange rates prevailing at the dates of the transactions. Foreign exchange gains and losses resulting from the settlement of such transactions and from the translation at period-end exchange rates of monetary assets and liabilities denominated in foreign currencies are recognised in the Income Statement. Translation differences on non-monetary financial assets and liabilities such as equities at fair value through profit or loss are recognised in the Income Statement within the fair value net gain or loss. Offsetting Financial Instruments Financial assets and liabilities are offset and the net amount reported in the Balance Sheet when there is a legally enforceable right to offset the recognised amounts and there is an intention to settle on a net basis, or realise the asset and settle the liability simultaneously. Due From and Due to Brokers Amounts due from and to brokers represents receivables for securities sold and payables for securities purchased that have been contracted for but not yet settled or delivered on the balance sheet date, respectively. Cash and Cash Equivalents Cash and cash equivalents includes cash in hand, deposits held on call with banks, other short-term highly liquid investments with original maturities of three months or less and bank overdrafts. Redeemable Participating Shares The Company issues Redeemable Participating Shares, which are redeemable at the holder’s option and are classified as financial liabilities. Redeemable Participating shares can be put back to the Company at any time for cash equal to a proportionate share of the particular Sub-Fund’s net asset value. The Redeemable Participating Share is carried at the redemption amount that is payable at the balance sheet date if the holder exercises the right to put the share back to the Company. Redeemable Participating Shares are issued and redeemed at the holder’s option at prices based on the Sub-Fund’s net assets value per share at the time of issue or redemption. The Sub-Fund’s net asset value per share is calculated by dividing the net assets attributable to the holders of Redeemable Participating Shares with the total number of outstanding redeemable participating shares. In accordance with the provisions of the Company’s regulations, investment positions are valued based on the last traded market price for the purpose of determining the net asset value per share for subscriptions and redemptions. Dividend Income and Expense Dividends are credited to the Income Statement on the dates on which the relevant securities are listed as “ex-dividend”. Income is accounted for gross of any non reclaimable/irrecoverable withholding taxes and net of any tax credits. The withholding tax is shown separately in the Income Statement. Realised gains and losses on investment transactions are calculated using the average cost method. Brokerage Commissions Brokerage commissions include additional fees on top of the asking price of the security. The bid-asking spread is not disclosed as part of a brokerage commission. This spread is included in the Income Statement within the fair value net gain or loss.
NOMURA FUNDS IRELAND PLC
41
NOTES TO THE FINANCIAL STATEMENTS For the period from 13th April, 2006 (date of incorporation) to 30th June, 2007 1. Summary of Significant Accounting Policies (continued)
Distributions Payable to Holders of Redeemable Participating Shares The Global Emerging Markets Fund and the Asia Pacific Ex-Japan Fund are accumulating Sub-Funds and therefore it is not currently intended to distribute dividends to the holders of Redeemable Participating Shares. The income and earnings of these Sub-Funds will be accumulated and reinvested on behalf of the holders of Redeemable Participating Shares. The Articles of Association of the India Equity Fund empower the Directors to declare dividends in respect of any shares in the India Equity Fund out of the net income of the India Equity Fund whether from dividends, interest or otherwise and/or net realised gains (i.e. realised gains net of realised and unrealised losses) or net realised and unrealised gains (i.e. realised and unrealised capital gains net of all realised and unrealised losses), subject to certain adjustments. The present intention of the Directors is to apply for distributor status in respect of Class B Shares from the United Kingdom HM Revenue and Customs for each distribution period. It is not the current intention of the Directors to make distributions in respect of Class A, Class C or Class D Shares of the Sub-Fund. The income, earnings and gains of the Sub-Fund attributable to Class A, Class C and Class D Shares will be accumulated and reinvested on behalf of Shareholders of Class A, Class C and Class D Shares of the Sub-Fund. Proposed distributions to holders of Redeemable Participating Shares are recognised as finance costs in the Income Statement. Taxation Under current law and practice, the Company qualifies as an investment undertaking as defined in Section 739B of the Taxes Consolidation Act, 1997, as amended. On that basis, it is not chargeable to Irish Tax on its income or capital gains. However, Irish tax can arise on the happening of a chargeable event in the Company. A chargeable event includes any distribution payments to shareholders or any encashment, redemption or transfer of shares. No tax will arise on the Company in respect of chargeable events in respect of:
• a shareholder who is neither Irish resident nor ordinarily resident in Ireland for tax purposes, at the time of
the chargeable event, provided appropriate valid declarations in accordance with the provisions of the Taxes Consolidated Act, 1997 as amended, are held by the Company; and
• certain exempted Irish tax resident shareholders who have provided the Company with the necessary signed statutory declarations.
There was no chargeable event during the period under review. Capital gains, dividends, and interest received (if any) by the Company may be subject to withholding taxes imposed by the country from which the investment income/gains are received and such taxes may not be recoverable by the Company or its shareholders.
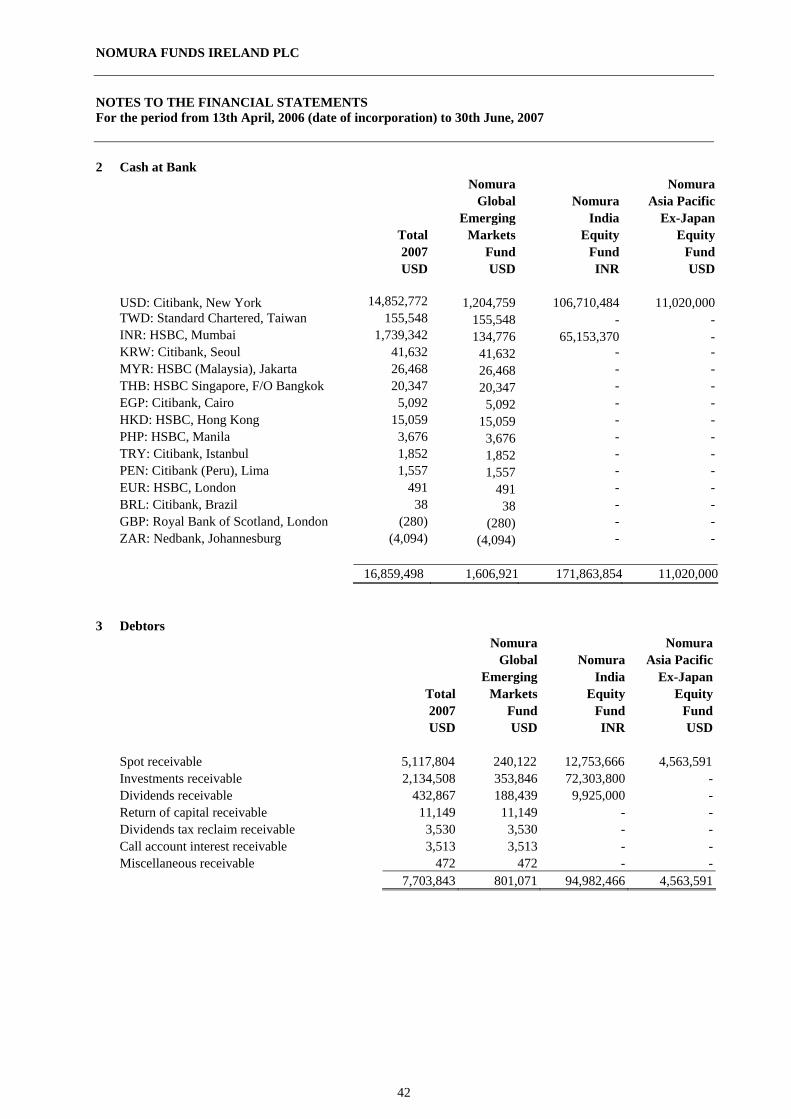
NOMURA FUNDS IRELAND PLC
42
NOTES TO THE FINANCIAL STATEMENTS For the period from 13th April, 2006 (date of incorporation) to 30th June, 2007 2 Cash at Bank Nomura Nomura Global Nomura Asia Pacific Emerging India Ex-Japan Total Markets Equity Equity 2007 Fund Fund Fund USD USD INR USD USD: Citibank, New York 14,852,772 1,204,759 106,710,484 11,020,000 TWD: Standard Chartered, Taiwan 155,548 155,548 - - INR: HSBC, Mumbai 1,739,342 134,776 65,153,370 - KRW: Citibank, Seoul 41,632 41,632 - - MYR: HSBC (Malaysia), Jakarta 26,468 26,468 - - THB: HSBC Singapore, F/O Bangkok 20,347 20,347 - - EGP: Citibank, Cairo 5,092 5,092 - - HKD: HSBC, Hong Kong 15,059 15,059 - - PHP: HSBC, Manila 3,676 3,676 - - TRY: Citibank, Istanbul 1,852 1,852 - - PEN: Citibank (Peru), Lima 1,557 1,557 - - EUR: HSBC, London 491 491 - - BRL: Citibank, Brazil 38 38 - - GBP: Royal Bank of Scotland, London (280) (280) - - ZAR: Nedbank, Johannesburg (4,094) (4,094) - - 16,859,498 1,606,921 171,863,854 11,020,000 3 Debtors Nomura Nomura Global Nomura Asia Pacific Emerging India Ex-Japan Total Markets Equity Equity 2007 Fund Fund Fund USD USD INR USD Spot receivable 5,117,804 240,122 12,753,666 4,563,591 Investments receivable 2,134,508 353,846 72,303,800 - Dividends receivable 432,867 188,439 9,925,000 - Return of capital receivable 11,149 11,149 - - Dividends tax reclaim receivable 3,530 3,530 - - Call account interest receivable 3,513 3,513 - - Miscellaneous receivable 472 472 - - 7,703,843 801,071 94,982,466 4,563,591
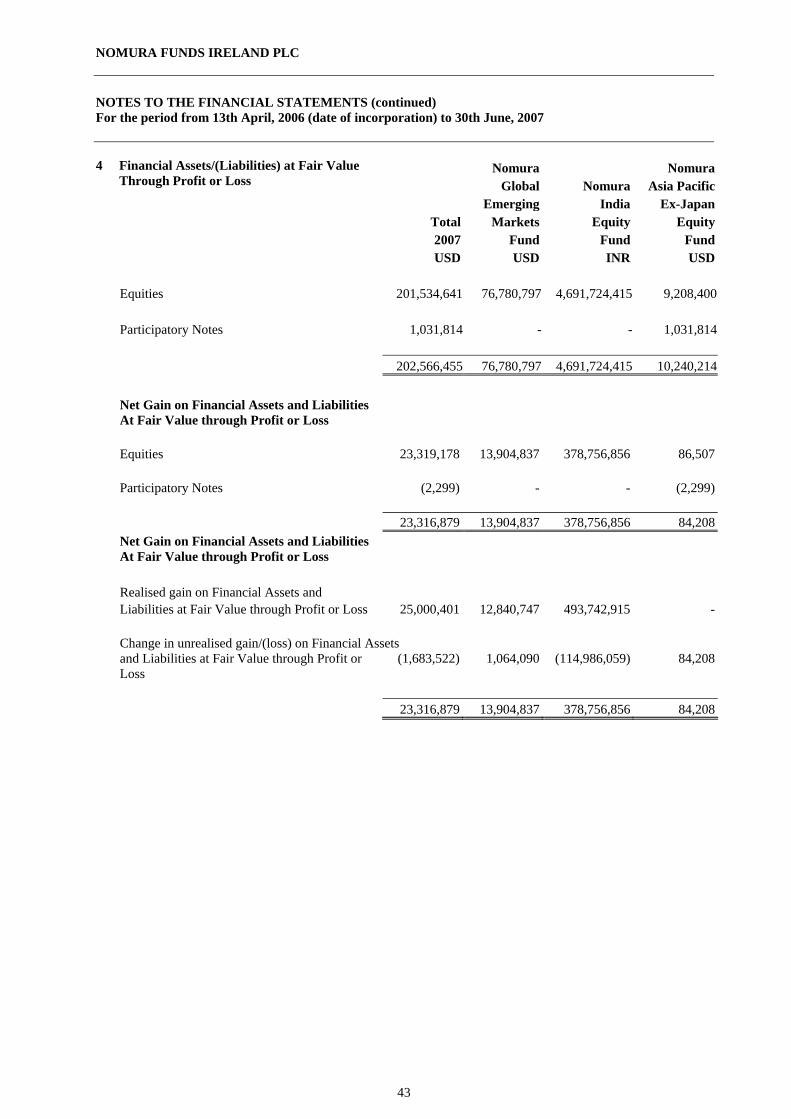
NOMURA FUNDS IRELAND PLC
43
NOTES TO THE FINANCIAL STATEMENTS (continued) For the period from 13th April, 2006 (date of incorporation) to 30th June, 2007
Nomura NomuraGlobal Nomura Asia Pacific
Emerging India Ex-Japan
4 Financial Assets/(Liabilities) at Fair Value Through Profit or Loss
Total Markets Equity Equity 2007 Fund Fund Fund USD USD INR USD Equities 201,534,641 76,780,797 4,691,724,415 9,208,400 Participatory Notes 1,031,814 - - 1,031,814 202,566,455 76,780,797 4,691,724,415 10,240,214
Net Gain on Financial Assets and Liabilities At Fair Value through Profit or Loss Equities 23,319,178 13,904,837 378,756,856 86,507 Participatory Notes (2,299) - - (2,299) 23,316,879 13,904,837 378,756,856 84,208
Net Gain on Financial Assets and Liabilities At Fair Value through Profit or Loss Realised gain on Financial Assets and Liabilities at Fair Value through Profit or Loss 25,000,401 12,840,747 493,742,915 - Change in unrealised gain/(loss) on Financial Assets and Liabilities at Fair Value through Profit or Loss
(1,683,522) 1,064,090 (114,986,059) 84,208
23,316,879 13,904,837 378,756,856 84,208
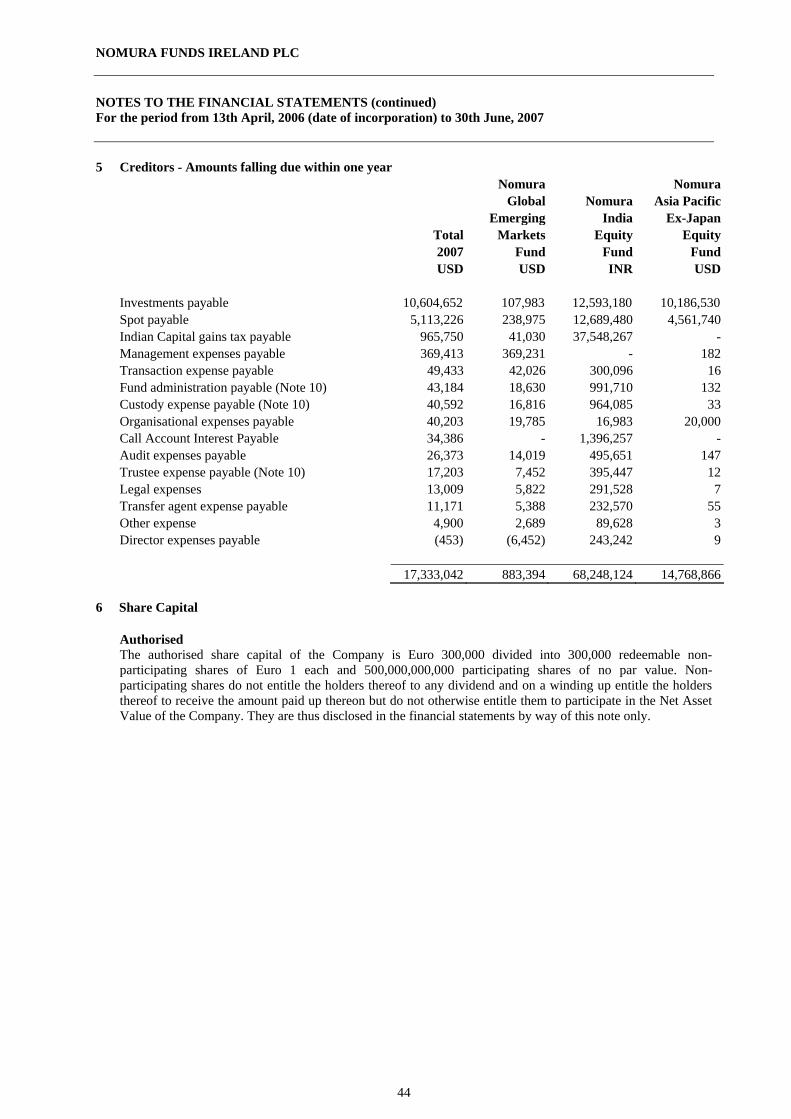
NOMURA FUNDS IRELAND PLC
44
NOTES TO THE FINANCIAL STATEMENTS (continued) For the period from 13th April, 2006 (date of incorporation) to 30th June, 2007 5 Creditors - Amounts falling due within one year Nomura Nomura Global Nomura Asia Pacific Emerging India Ex-Japan Total Markets Equity Equity 2007 Fund Fund Fund USD USD INR USD Investments payable 10,604,652 107,983 12,593,180 10,186,530 Spot payable 5,113,226 238,975 12,689,480 4,561,740 Indian Capital gains tax payable 965,750 41,030 37,548,267 - Management expenses payable 369,413 369,231 - 182 Transaction expense payable 49,433 42,026 300,096 16 Fund administration payable (Note 10) 43,184 18,630 991,710 132 Custody expense payable (Note 10) 40,592 16,816 964,085 33 Organisational expenses payable 40,203 19,785 16,983 20,000 Call Account Interest Payable 34,386 - 1,396,257 - Audit expenses payable 26,373 14,019 495,651 147 Trustee expense payable (Note 10) 17,203 7,452 395,447 12 Legal expenses 13,009 5,822 291,528 7 Transfer agent expense payable 11,171 5,388 232,570 55 Other expense 4,900 2,689 89,628 3 Director expenses payable (453) (6,452) 243,242 9 17,333,042 883,394 68,248,124 14,768,866 6 Share Capital
Authorised The authorised share capital of the Company is Euro 300,000 divided into 300,000 redeemable non-participating shares of Euro 1 each and 500,000,000,000 participating shares of no par value. Non-participating shares do not entitle the holders thereof to any dividend and on a winding up entitle the holders thereof to receive the amount paid up thereon but do not otherwise entitle them to participate in the Net Asset Value of the Company. They are thus disclosed in the financial statements by way of this note only.
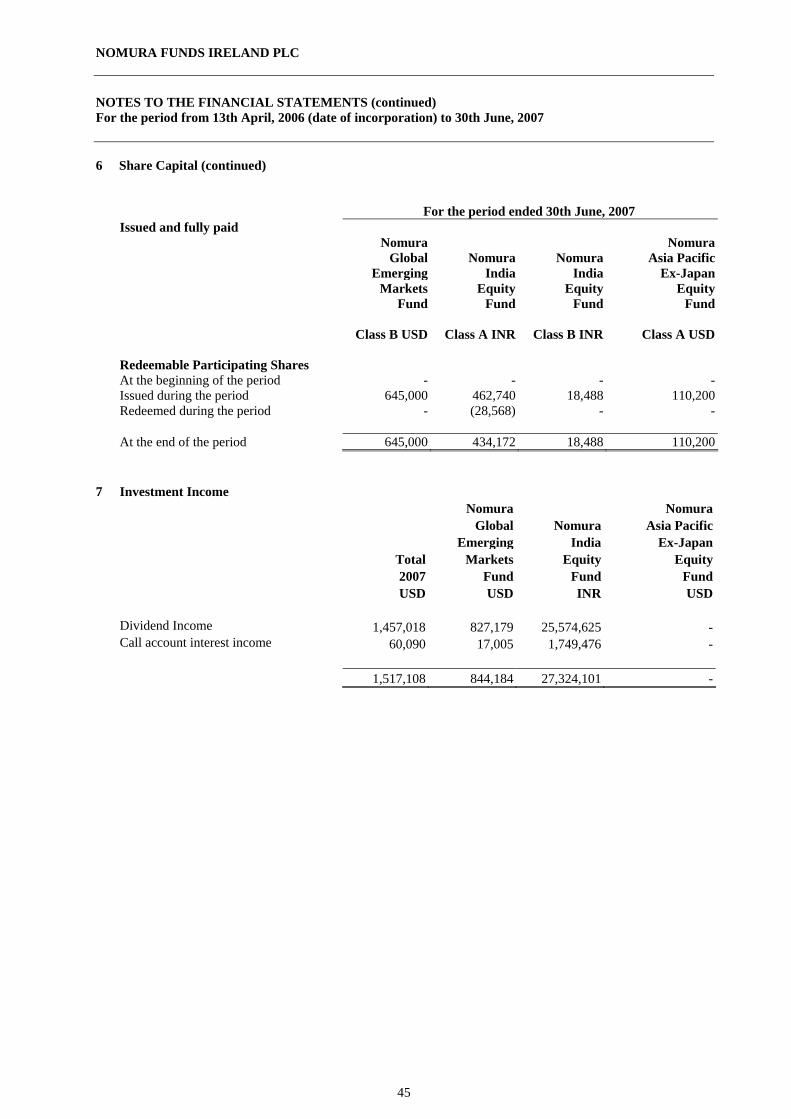
NOMURA FUNDS IRELAND PLC
45
NOTES TO THE FINANCIAL STATEMENTS (continued) For the period from 13th April, 2006 (date of incorporation) to 30th June, 2007 6 Share Capital (continued)
For the period ended 30th June, 2007
Issued and fully paid Nomura Nomura Global Nomura Nomura Asia Pacific Emerging India India Ex-Japan Markets Equity Equity Equity Fund Fund Fund Fund Class B USD Class A INR Class B INR Class A USD Redeemable Participating Shares At the beginning of the period - - - -Issued during the period 645,000 462,740 18,488 110,200Redeemed during the period - (28,568) - - At the end of the period 645,000 434,172 18,488 110,200
7 Investment Income
Nomura Nomura Global Nomura Asia Pacific Emerging India Ex-Japan Total Markets Equity Equity 2007 Fund Fund Fund USD USD INR USD Dividend Income 1,457,018 827,179 25,574,625 - Call account interest income 60,090 17,005 1,749,476 - 1,517,108 844,184 27,324,101 -
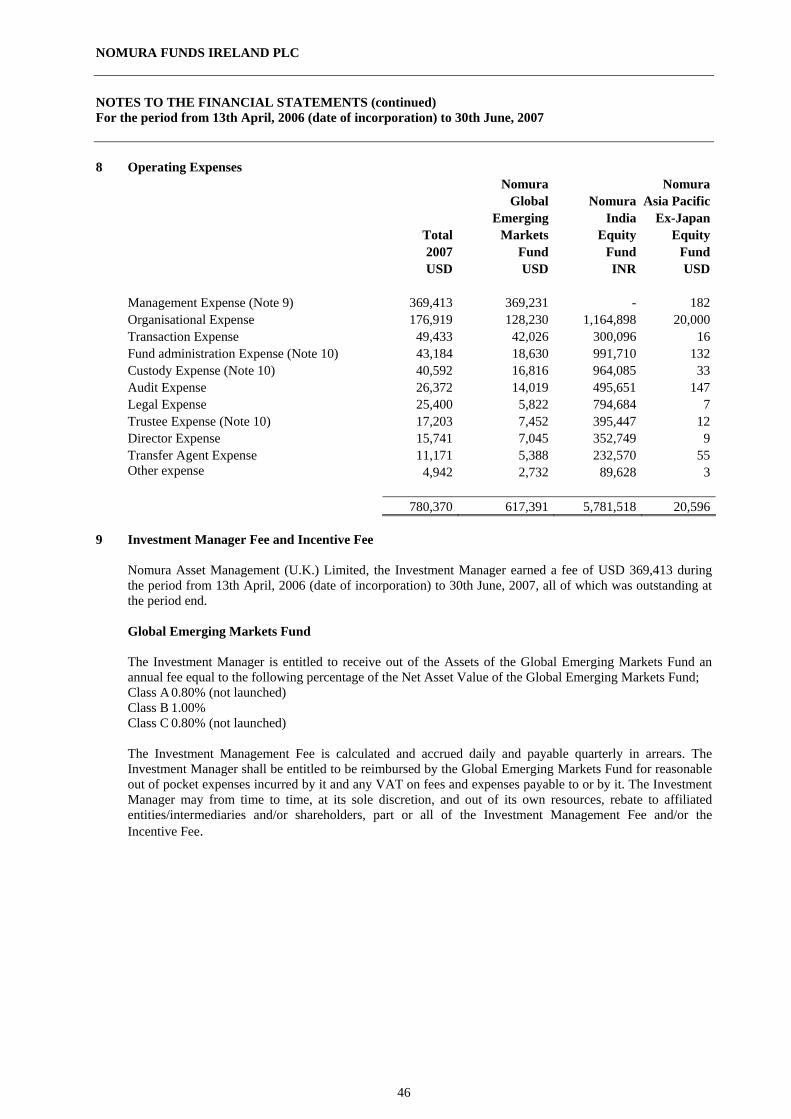
NOMURA FUNDS IRELAND PLC
46
NOTES TO THE FINANCIAL STATEMENTS (continued) For the period from 13th April, 2006 (date of incorporation) to 30th June, 2007 8 Operating Expenses
Nomura Nomura Global Nomura Asia Pacific Emerging India Ex-Japan Total Markets Equity Equity 2007 Fund Fund Fund USD USD INR USD Management Expense (Note 9) 369,413 369,231 - 182 Organisational Expense 176,919 128,230 1,164,898 20,000 Transaction Expense 49,433 42,026 300,096 16 Fund administration Expense (Note 10) 43,184 18,630 991,710 132 Custody Expense (Note 10) 40,592 16,816 964,085 33 Audit Expense 26,372 14,019 495,651 147 Legal Expense 25,400 5,822 794,684 7 Trustee Expense (Note 10) 17,203 7,452 395,447 12 Director Expense 15,741 7,045 352,749 9 Transfer Agent Expense 11,171 5,388 232,570 55 Other expense 4,942 2,732 89,628 3 780,370 617,391 5,781,518 20,596
9 Investment Manager Fee and Incentive Fee
Nomura Asset Management (U.K.) Limited, the Investment Manager earned a fee of USD 369,413 during the period from 13th April, 2006 (date of incorporation) to 30th June, 2007, all of which was outstanding at the period end. Global Emerging Markets Fund The Investment Manager is entitled to receive out of the Assets of the Global Emerging Markets Fund an annual fee equal to the following percentage of the Net Asset Value of the Global Emerging Markets Fund; Class A 0.80% (not launched) Class B 1.00% Class C 0.80% (not launched) The Investment Management Fee is calculated and accrued daily and payable quarterly in arrears. The Investment Manager shall be entitled to be reimbursed by the Global Emerging Markets Fund for reasonable out of pocket expenses incurred by it and any VAT on fees and expenses payable to or by it. The Investment Manager may from time to time, at its sole discretion, and out of its own resources, rebate to affiliated entities/intermediaries and/or shareholders, part or all of the Investment Management Fee and/or the Incentive Fee.
NOMURA FUNDS IRELAND PLC
47
NOTES TO THE FINANCIAL STATEMENTS (continued) For the period from 13th April, 2006 (date of incorporation) to 30th June, 2007
9 Investment Manager Fee and Incentive Fee (continued)
Global Emerging Markets Fund (continued)
The Investment Manager is also entitled to a performance related investment management fee on the A Share Class (the "Incentive Fee") payable in arrears in respect of each Performance Period capped at 2% in total including the Investment Management Fee. The Performance Periods of the Sub-Fund are each financial year of the Sub-Fund. The first Performance Period commenced on 18th December, 2006 and will terminate on 31st December, 2007. In the event of any under-performance of the Sub-Fund, a Performance Period will be extended to include subsequent Financial Year periods until such under-performance is recovered. Where the Directors believe, due to specific conditions existing in a Sub-Fund, that to extend a Performance Period to include a subsequent twelve month period would prejudice current Shareholders in the Sub-Fund, the Directors may terminate the Performance Period at the end of the current financial year. In those circumstances, a new Performance Period will commence immediately following the conclusion of the current Performance Period and the opening Net Asset Value will be equal to the higher of the audited Net Asset Value of the relevant Sub-Fund as at the date at which the last Incentive Fee crystallised and became payable and the Closing Net Asset Value at the end of the terminated period. If the Investment Management Agreement terminates for any reason other than on the last day of a Performance Period, the date of such termination shall be deemed to be the last day of the Performance Period then current. An Incentive Fee is payable in respect of a Performance Period if the Sub-Fund outperforms the Benchmark index being the MSCI Emerging Markets Index (Total Return with Net Dividends Reinvested). The Incentive Fee payable is a maximum of 10% of the excess of the percentage change in the Net Asset Value per Share (adjusted for reinvestment of dividends paid out by the Sub-Fund) minus the percentage change in the Benchmark index multiplied by the Average Net Asset Value (as defined below) of the Performance Period. As the Benchmark index is on a total return basis, dividends paid by the Sub-Fund will be treated as reinvested in the Sub-Fund at the time of their payment, with the Net Asset Value adjusted accordingly.
India Equity Fund The Investment Manager is entitled to receive out of the Assets of the India Equity Fund an annual fee equal to the following percentage of the Net Asset Value of the India Equity Fund; Class A 0.00% Class B 0.00% Class C 1.00% (not launched) Class D 1.50% (not launched) The Investment Management Fee is calculated and accrued daily and payable quarterly in arrears. The Investment Manager shall be entitled to be reimbursed by the India Equity Fund for reasonable out of pocket expenses incurred by it and any VAT on fees and expenses payable to or by it. The Investment Manager shall pay out of its own fee the fee of any sub-investment manager.
NOMURA FUNDS IRELAND PLC
48
NOTES TO THE FINANCIAL STATEMENTS (continued) For the period from 13th April, 2006 (date of incorporation) to 30th June, 2007
9 Investment Manager Fee and Incentive Fee (continued)
India Equity Fund (continued)
The Investment Manager is also entitled to a performance related investment management fee on the C Share Class (the "Incentive Fee") payable in arrears in respect of each Performance Period capped at 2% in total including the Investment Management Fee. The Performance Periods of the Sub-Fund are each Financial Year of the Sub-Fund. The first Performance Period commenced on 12th January, 2007 and will terminate on 31st December, 2007. In the event of any under-performance of the Sub-Fund, a Performance Period will be extended to include subsequent Financial Year periods until such under-performance is recovered. Where the Directors believe, due to specific conditions existing in a Sub-Fund, that to extend a Performance Period to include a subsequent twelve month period would prejudice current Shareholders in the Sub-Fund, the Directors may terminate the Performance Period at the end of the current Financial Year. In those circumstances, a new Performance Period will commence immediately following the conclusion of the current Performance Period and the Opening Net Asset Value will be equal to the higher of the audited Net Asset Value of the relevant Sub-Fund as at the date at which the last Incentive Fee crystallised and became payable and the Closing Net Asset Value at the end of the terminated period. If the Investment Management Agreement terminates for any reason other than on the last day of a Performance Period, the date of such termination shall be deemed to be the last day of the Performance Period then current. An Incentive Fee is payable in respect of a Performance Period if the Sub-Fund outperforms the Benchmark index being the MSCI India Index (Total Return with Net Dividends Reinvested). The Incentive Fee payable is a maximum of 10% of the excess of the percentage change in the Net Asset Value per Share (adjusted for reinvestment of dividends paid out by the Sub-Fund) minus the percentage change in the Benchmark index multiplied by the Average Net Asset Value (as defined below) of the Performance Period. As the Benchmark index is on a total return basis, dividends paid by the Sub-Fund will be treated as reinvested in the Sub-Fund at the time of their payment, with the Net Asset Value adjusted accordingly. Asia Pacific Ex-Japan Equity Fund The Investment Manager is entitled to receive out of the Assets of the Asia Pacific Ex-Japan Equity Fund an annual fee equal to the following percentage of the Net Asset Value of the Asia Pacific Ex-Japan Equity Fund; Class A 0.65% Class B 0.30% (not launched) The Investment Management Fee is calculated and accrued daily and payable quarterly in arrears. The Investment Manager shall be entitled to be reimbursed by the Asia Pacific Ex-Japan Equity Fund for reasonable out of pocket expenses incurred by it and any VAT on fees and expenses payable to or by it. The Investment Manager shall pay out of its own fee the fee of any sub-investment manager. The Investment Manager may also be entitled to an Incentive Fee payable in arrears in respect of the Sub-Fund, as specified in the relevant Class Supplement. The Investment Manager is also entitled to a performance related investment management fee on the A Share Class (the "Incentive Fee") payable in arrears in respect of each Performance Period capped at 2% in total including the Investment Management Fee. The Performance Periods of the Sub-Fund are each Accounting Period of the Sub-Fund. The first Performance Period commenced on the 28th June, 2007 and will terminate on 31st December, 2007. In the event of any under-performance of the Sub-Fund, a Performance Period will be extended to include subsequent Accounting Periods until such under-performance is recovered. Where the Directors believe, due to specific conditions existing in the Sub-Fund, that to extend a Performance Period to include a subsequent twelve month period would prejudice current Shareholders in the Sub-Fund, the Directors may terminate the Performance Period at the end of the current Accounting Period.
NOMURA FUNDS IRELAND PLC
49
NOTES TO THE FINANCIAL STATEMENTS (continued) For the period from 13th April, 2006 (date of incorporation) to 30th June, 2007
9 Investment Manager Fee and Incentive Fee (continued)
Asia Pacific Ex-Japan Equity Fund (continued) In those circumstances, a new Performance Period will commence immediately following the conclusion of the current Performance Period and the Opening Net Asset Value per Share will be equal to the higher of the audited Net Asset Value per Share of the Sub-Fund as at the date at which the last Incentive Fee crystallised and became payable and the Closing Net Asset Value per Share at the end of the terminated Performance Period. If the Investment Management Agreement terminates for any reason other than on the last day of a Performance Period, the date of such termination shall be deemed to be the last day of the Performance Period then current. An Incentive Fee is payable in respect of a Performance Period if the Sub-Fund outperforms the Benchmark Index being the MSCI All Countries Asia Pacific Ex-Japan Index. The Incentive Fee payable is a maximum of 10% of the excess of the percentage change in the Net Asset Value per Share (adjusted for reinvestment of dividends paid out by the Sub-Fund) minus the percentage change in the Index multiplied by the Average Net Asset Value (as defined below) of the Performance Period. As the Index is on a total return basis, dividends paid by the Sub-Fund will be treated as reinvested in the Sub-Fund at the time of their payment, with the Net Asset Value per Share adjusted accordingly.
10 Administration and Custodian Fees
The Company shall pay to the Administrator, out of the assets of each Sub-Fund, an annual fee, accrued at each Valuation Point and payable monthly in arrears, at a rate which shall not exceed 0.05% per annum of the Net Asset Value of each Sub-Fund subject to a minimum annual fee of USD 48,000 per Sub-Fund (plus VAT, if any thereon). The Administrator shall also be entitled to receive a monthly fee of USD 500 per Share Class of a Sub-fund launched (such fee will not be applied to the first two Share Classes of a Sub-Fund launched by the Fund). The Administrator will be entitled to receive a register fee per Sub-Fund of USD 10,000 per annum and shall also receive registration fees, and transaction charges as agreed at normal commercial rates and shall also be entitled to be repaid out of the assets of the sub-Fund all of its reasonable out-of-pocket expenses incurred on behalf of the sub-Fund which shall include legal fees, couriers’ fees and telecommunication costs and expenses together with VAT, if any, thereon. Each Sub-Fund will bear its proportion of the fees and expenses of the Administrator Brown Brothers Harriman Fund Administration Services (Ireland) Limited as Administrator earned a fee of USD 43,184 for the period from incorporation to 30th June 2007 all of which was outstanding at the period end. The Custodian shall be entitled to receive, out of the assets of each Sub-Fund, a trustee fee, accrued at each Valuation Point and payable monthly in arrears, of 0.02% per annum of the Net Asset Value of each Sub-Fund. The Custodian shall also be entitled to receive, out of the assets of each Sub-Fund, a custody fee, accrued at each Valuation Point and payable monthly in arrears, which shall not exceed 0.4% per annum, calculated by reference to the market value of the investments that the Sub-Fund may make in each relevant market, subject to a minimum annual fee of USD 12,000 per annum.
NOMURA FUNDS IRELAND PLC
50
NOTES TO THE FINANCIAL STATEMENTS (continued) For the period from 13th April, 2006 (date of incorporation) to 30th June, 2007
10 Administration and Custodian Fees (continued)
The Custodian is also entitled to agreed upon transaction charges and to recover properly vouched out-of-pocket expenses out of the assets of the relevant Sub-Fund (plus VAT thereon, if any), including legal fees, couriers' fees and telecommunication costs and expenses and the fees, transaction charges and expenses of any sub-custodian appointed by it which shall be at normal commercial rates together with VAT, if any, thereon. Each Sub-Fund will bear its proportion of the fees and expenses of the Custodian. During the period from incorporation to 30th June 2007 Brown Brothers Harriman Trustee Services (Ireland) Limited earned a fee of USD 57,795 for custodial and trustee services all of which was outstanding at the period end.
11 Directors’ Fees
Each Director is entitled to charge a fee for their services at a rate determined by the Directors up to a maximum fee per Director of €10,000 per annum (plus VAT) and may be entitled to special remuneration if called upon to perform any special or extra services to the Fund. All Directors will be entitled to reimbursement by the Fund of expenses properly incurred in connection with the business of the Fund or the discharge of their duties. The aggregate emoluments of the Directors (including expenses) for the period ended 30th June, 2007 was USD 15,741 of which USD 453 was receivable at the period end.
12 Establishment Expenses For financial statement purposes organisational expenses totalling USD 176,919 including fees paid to the professional advisors of the company were entirely written off in the period from 13th April, 2006 (date of incorporation) to 30th June 2007. For the purpose of calculating the pricing NAV, establishment expenses are being amortized over the first five financial years of the company. USD 16,216 was amortized for the period from 13th April, 2006 (date of incorporation) to 30th June, 2007.
14 Financial Risk Management
Strategy in using Financial Instruments The Sub-Funds activities expose them to a variety of financial risks: market risk (including currency risk and price risk), credit risk and liquidity risk. The Company's overall risk management programme focuses on the unpredictability of financial markets and seeks to minimise potential adverse effects on the Sub-Funds financial performance. The Sub-Funds may employ derivative financial instruments to moderate certain risk exposures. The investment objective of the Sub-Funds is to achieve long-term capital growth through investment in an actively managed portfolio of global emerging market securities (Global Emerging Markets Fund); Indian securities (India Equity Fund) or Asia Pacific (excluding Japan) securities (Asia Pacific Ex-Japan Equity Fund). Market Price Risk The Sub-Funds may trade in financial instruments, taking positions in traded instruments to take advantage of short-term market movements in the equity markets. All securities investments present a risk of loss of capital. The Investment Manager moderates this risk through a careful selection of securities within specified limits. The maximum risk resulting from financial instruments is determined by the fair value of the financial instruments. The Sub-Funds’ overall market positions are monitored on a daily basis by the Sub-Funds’ Investment Manager and are reviewed on a quarterly basis by the Board of Directors.
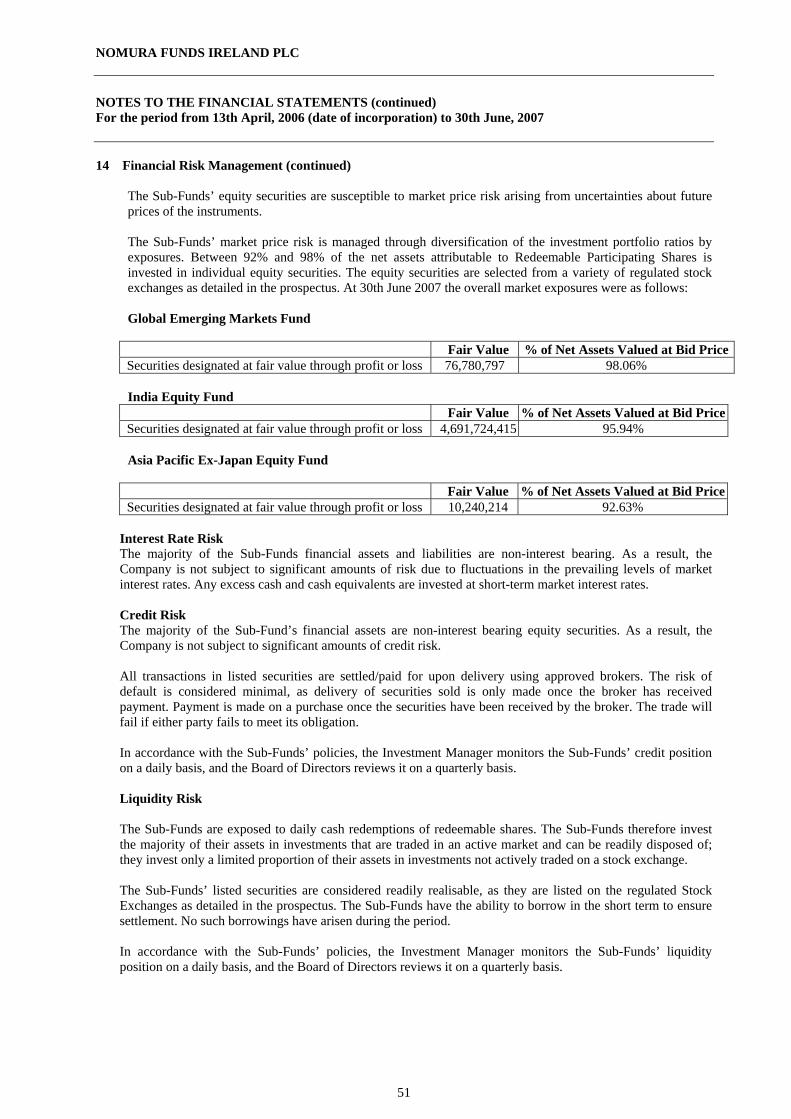
NOMURA FUNDS IRELAND PLC
51
NOTES TO THE FINANCIAL STATEMENTS (continued) For the period from 13th April, 2006 (date of incorporation) to 30th June, 2007
14 Financial Risk Management (continued)
The Sub-Funds’ equity securities are susceptible to market price risk arising from uncertainties about future prices of the instruments.
The Sub-Funds’ market price risk is managed through diversification of the investment portfolio ratios by exposures. Between 92% and 98% of the net assets attributable to Redeemable Participating Shares is invested in individual equity securities. The equity securities are selected from a variety of regulated stock exchanges as detailed in the prospectus. At 30th June 2007 the overall market exposures were as follows: Global Emerging Markets Fund Fair Value % of Net Assets Valued at Bid PriceSecurities designated at fair value through profit or loss 76,780,797 98.06% India Equity Fund Fair Value % of Net Assets Valued at Bid PriceSecurities designated at fair value through profit or loss 4,691,724,415 95.94%
Asia Pacific Ex-Japan Equity Fund Fair Value % of Net Assets Valued at Bid PriceSecurities designated at fair value through profit or loss 10,240,214 92.63%
Interest Rate Risk The majority of the Sub-Funds financial assets and liabilities are non-interest bearing. As a result, the Company is not subject to significant amounts of risk due to fluctuations in the prevailing levels of market interest rates. Any excess cash and cash equivalents are invested at short-term market interest rates. Credit Risk The majority of the Sub-Fund’s financial assets are non-interest bearing equity securities. As a result, the Company is not subject to significant amounts of credit risk. All transactions in listed securities are settled/paid for upon delivery using approved brokers. The risk of default is considered minimal, as delivery of securities sold is only made once the broker has received payment. Payment is made on a purchase once the securities have been received by the broker. The trade will fail if either party fails to meet its obligation. In accordance with the Sub-Funds’ policies, the Investment Manager monitors the Sub-Funds’ credit position on a daily basis, and the Board of Directors reviews it on a quarterly basis. Liquidity Risk The Sub-Funds are exposed to daily cash redemptions of redeemable shares. The Sub-Funds therefore invest the majority of their assets in investments that are traded in an active market and can be readily disposed of; they invest only a limited proportion of their assets in investments not actively traded on a stock exchange. The Sub-Funds’ listed securities are considered readily realisable, as they are listed on the regulated Stock Exchanges as detailed in the prospectus. The Sub-Funds have the ability to borrow in the short term to ensure settlement. No such borrowings have arisen during the period.
In accordance with the Sub-Funds’ policies, the Investment Manager monitors the Sub-Funds’ liquidity position on a daily basis, and the Board of Directors reviews it on a quarterly basis.
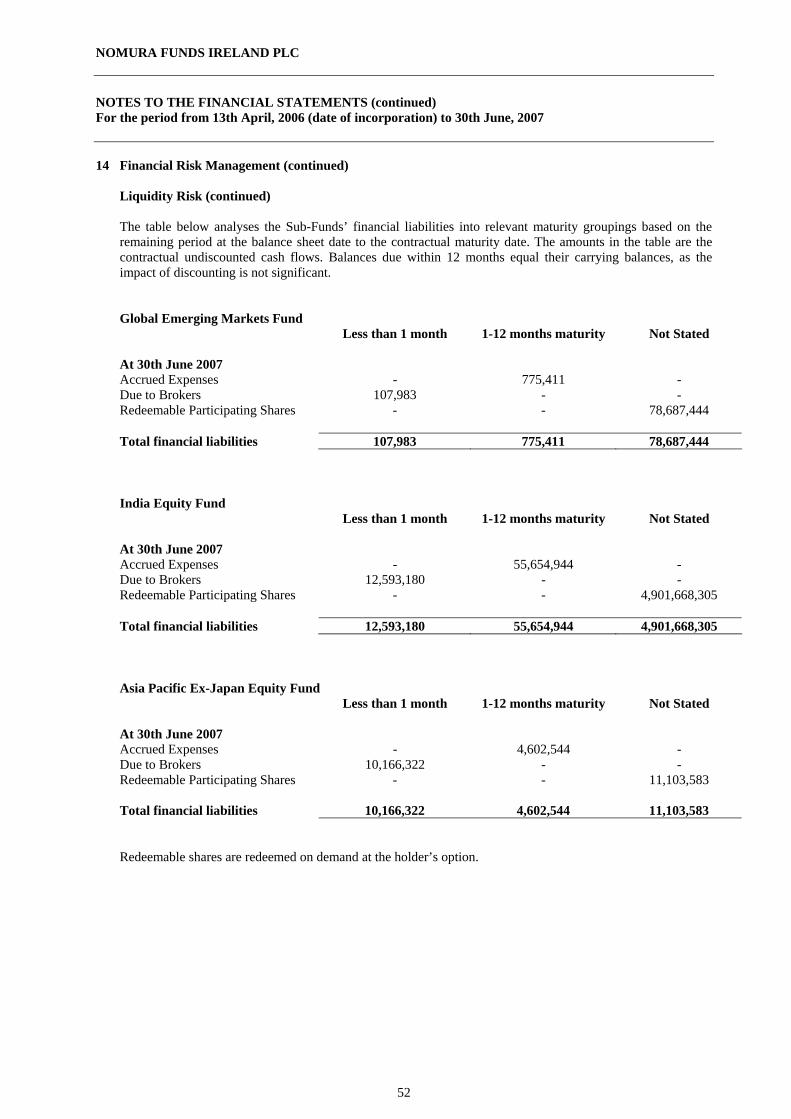
NOMURA FUNDS IRELAND PLC
52
NOTES TO THE FINANCIAL STATEMENTS (continued) For the period from 13th April, 2006 (date of incorporation) to 30th June, 2007
14 Financial Risk Management (continued)
Liquidity Risk (continued) The table below analyses the Sub-Funds’ financial liabilities into relevant maturity groupings based on the remaining period at the balance sheet date to the contractual maturity date. The amounts in the table are the contractual undiscounted cash flows. Balances due within 12 months equal their carrying balances, as the impact of discounting is not significant.
Global Emerging Markets Fund Less than 1 month 1-12 months maturity Not Stated
At 30th June 2007 Accrued Expenses - 775,411 - Due to Brokers 107,983 - - Redeemable Participating Shares - - 78,687,444 Total financial liabilities 107,983 775,411 78,687,444 India Equity Fund
Less than 1 month 1-12 months maturity Not Stated
At 30th June 2007 Accrued Expenses - 55,654,944 - Due to Brokers 12,593,180 - - Redeemable Participating Shares - - 4,901,668,305 Total financial liabilities 12,593,180 55,654,944 4,901,668,305
Asia Pacific Ex-Japan Equity Fund
Less than 1 month 1-12 months maturity Not Stated
At 30th June 2007 Accrued Expenses - 4,602,544 - Due to Brokers 10,166,322 - - Redeemable Participating Shares - - 11,103,583 Total financial liabilities 10,166,322 4,602,544 11,103,583
Redeemable shares are redeemed on demand at the holder’s option.
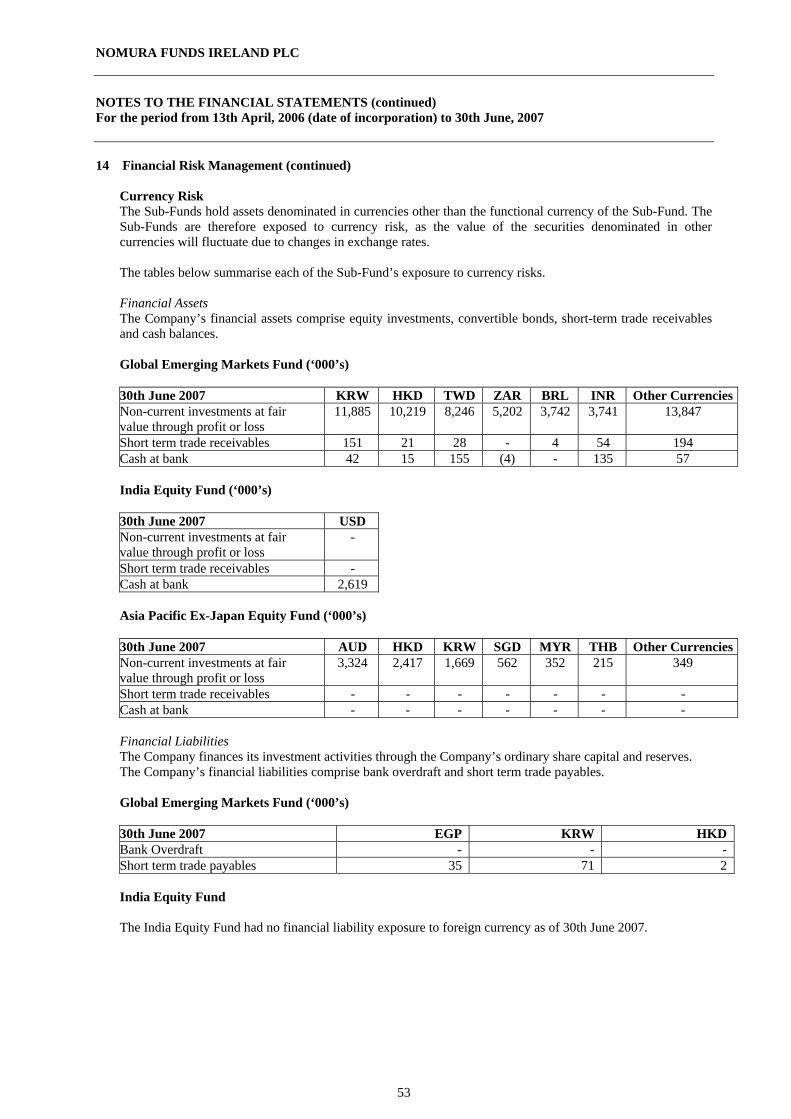
NOMURA FUNDS IRELAND PLC
53
NOTES TO THE FINANCIAL STATEMENTS (continued) For the period from 13th April, 2006 (date of incorporation) to 30th June, 2007
14 Financial Risk Management (continued)
Currency Risk The Sub-Funds hold assets denominated in currencies other than the functional currency of the Sub-Fund. The Sub-Funds are therefore exposed to currency risk, as the value of the securities denominated in other currencies will fluctuate due to changes in exchange rates. The tables below summarise each of the Sub-Fund’s exposure to currency risks. Financial Assets The Company’s financial assets comprise equity investments, convertible bonds, short-term trade receivables and cash balances. Global Emerging Markets Fund (‘000’s) 30th June 2007 KRW HKD TWD ZAR BRL INR Other CurrenciesNon-current investments at fair value through profit or loss
11,885 10,219 8,246 5,202 3,742 3,741 13,847
Short term trade receivables 151 21 28 - 4 54 194 Cash at bank 42 15 155 (4) - 135 57 India Equity Fund (‘000’s) 30th June 2007 USD Non-current investments at fair value through profit or loss
-
Short term trade receivables - Cash at bank 2,619 Asia Pacific Ex-Japan Equity Fund (‘000’s) 30th June 2007 AUD HKD KRW SGD MYR THB Other CurrenciesNon-current investments at fair value through profit or loss
3,324 2,417 1,669 562 352 215 349
Short term trade receivables - - - - - - - Cash at bank - - - - - - -
Financial Liabilities The Company finances its investment activities through the Company’s ordinary share capital and reserves. The Company’s financial liabilities comprise bank overdraft and short term trade payables. Global Emerging Markets Fund (‘000’s) 30th June 2007 EGP KRW HKD Bank Overdraft - - - Short term trade payables 35 71 2 India Equity Fund The India Equity Fund had no financial liability exposure to foreign currency as of 30th June 2007.
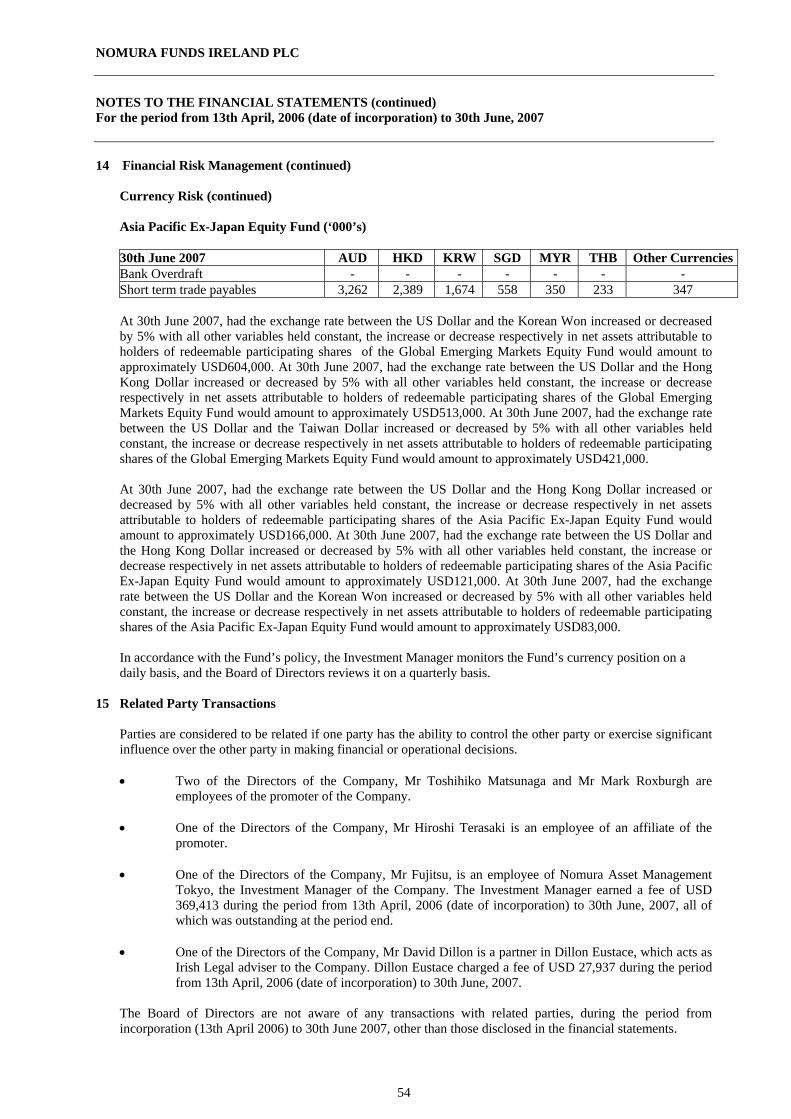
NOMURA FUNDS IRELAND PLC
54
NOTES TO THE FINANCIAL STATEMENTS (continued) For the period from 13th April, 2006 (date of incorporation) to 30th June, 2007
14 Financial Risk Management (continued)
Currency Risk (continued) Asia Pacific Ex-Japan Equity Fund (‘000’s) 30th June 2007 AUD HKD KRW SGD MYR THB Other CurrenciesBank Overdraft - - - - - - - Short term trade payables 3,262 2,389 1,674 558 350 233 347 At 30th June 2007, had the exchange rate between the US Dollar and the Korean Won increased or decreased by 5% with all other variables held constant, the increase or decrease respectively in net assets attributable to holders of redeemable participating shares of the Global Emerging Markets Equity Fund would amount to approximately USD604,000. At 30th June 2007, had the exchange rate between the US Dollar and the Hong Kong Dollar increased or decreased by 5% with all other variables held constant, the increase or decrease respectively in net assets attributable to holders of redeemable participating shares of the Global Emerging Markets Equity Fund would amount to approximately USD513,000. At 30th June 2007, had the exchange rate between the US Dollar and the Taiwan Dollar increased or decreased by 5% with all other variables held constant, the increase or decrease respectively in net assets attributable to holders of redeemable participating shares of the Global Emerging Markets Equity Fund would amount to approximately USD421,000. At 30th June 2007, had the exchange rate between the US Dollar and the Hong Kong Dollar increased or decreased by 5% with all other variables held constant, the increase or decrease respectively in net assets attributable to holders of redeemable participating shares of the Asia Pacific Ex-Japan Equity Fund would amount to approximately USD166,000. At 30th June 2007, had the exchange rate between the US Dollar and the Hong Kong Dollar increased or decreased by 5% with all other variables held constant, the increase or decrease respectively in net assets attributable to holders of redeemable participating shares of the Asia Pacific Ex-Japan Equity Fund would amount to approximately USD121,000. At 30th June 2007, had the exchange rate between the US Dollar and the Korean Won increased or decreased by 5% with all other variables held constant, the increase or decrease respectively in net assets attributable to holders of redeemable participating shares of the Asia Pacific Ex-Japan Equity Fund would amount to approximately USD83,000. In accordance with the Fund’s policy, the Investment Manager monitors the Fund’s currency position on a daily basis, and the Board of Directors reviews it on a quarterly basis.
15 Related Party Transactions
Parties are considered to be related if one party has the ability to control the other party or exercise significant influence over the other party in making financial or operational decisions. • Two of the Directors of the Company, Mr Toshihiko Matsunaga and Mr Mark Roxburgh are
employees of the promoter of the Company. • One of the Directors of the Company, Mr Hiroshi Terasaki is an employee of an affiliate of the
promoter. • One of the Directors of the Company, Mr Fujitsu, is an employee of Nomura Asset Management
Tokyo, the Investment Manager of the Company. The Investment Manager earned a fee of USD 369,413 during the period from 13th April, 2006 (date of incorporation) to 30th June, 2007, all of which was outstanding at the period end.
• One of the Directors of the Company, Mr David Dillon is a partner in Dillon Eustace, which acts as
Irish Legal adviser to the Company. Dillon Eustace charged a fee of USD 27,937 during the period from 13th April, 2006 (date of incorporation) to 30th June, 2007.
The Board of Directors are not aware of any transactions with related parties, during the period from incorporation (13th April 2006) to 30th June 2007, other than those disclosed in the financial statements.
NOMURA FUNDS IRELAND PLC
55
NOTES TO THE FINANCIAL STATEMENTS (continued) For the period from 13th April, 2006 (date of incorporation) to 30th June, 2007
17 Net Asset Value per Redeemable Participating Share
The net asset value per Redeemable Participating Share is calculated by dividing the total Net Assets (as calculated for pricing purposes) of the Sub-Fund by the number of Redeemable Participating Shares in issue. The net asset value per Redeemable Participating Share reported in the Balance Sheet is that used for pricing purposes.
18 Efficient Portfolio Management
The Company may employ techniques and instruments relating to transferable securities and/ or other financial instruments in which it invests for investment purposes or hedging. Where a Sub-Fund invests in financial derivative instruments for such purposes, a risk management process will be submitted to the Financial Regulator by the Company, prior to the Sub-Fund engaging in such transactions in accordance with the Financial Regulator’s requirements as set out in Guidance Note 3/03.
The Investment Manager did not use any derivative instruments for the purpose of efficient portfolio management during the period.
19 Soft Commissions
The Investment Manager or its delegate may effect transactions with or through the agency of another person with whom it or its delegates (or an affiliated entity) has arrangements under which that person will, from time to time, provide to or procure for the Investment Manager or its delegate (and/or an affiliated party) goods, services or other benefits such as research and advisory services, specialised computer hardware or software. No direct payment may be made for such goods or services but the Investment Manager or its delegate may undertake to place business with that person provided that person has agreed to provide best execution with respect to such business and the services provided must be of a type which assist in the provision of investment services to the Company. There were no soft commission arrangements entered into by the Investment Manager or its delegate, on behalf of the Company during the period.
20 Events after the Balance Sheet Date There were no post Balance Sheet events.
21 Approval of Financial Statements
The financial statements were authorised for issue by the Directors on 13th August, 2007.
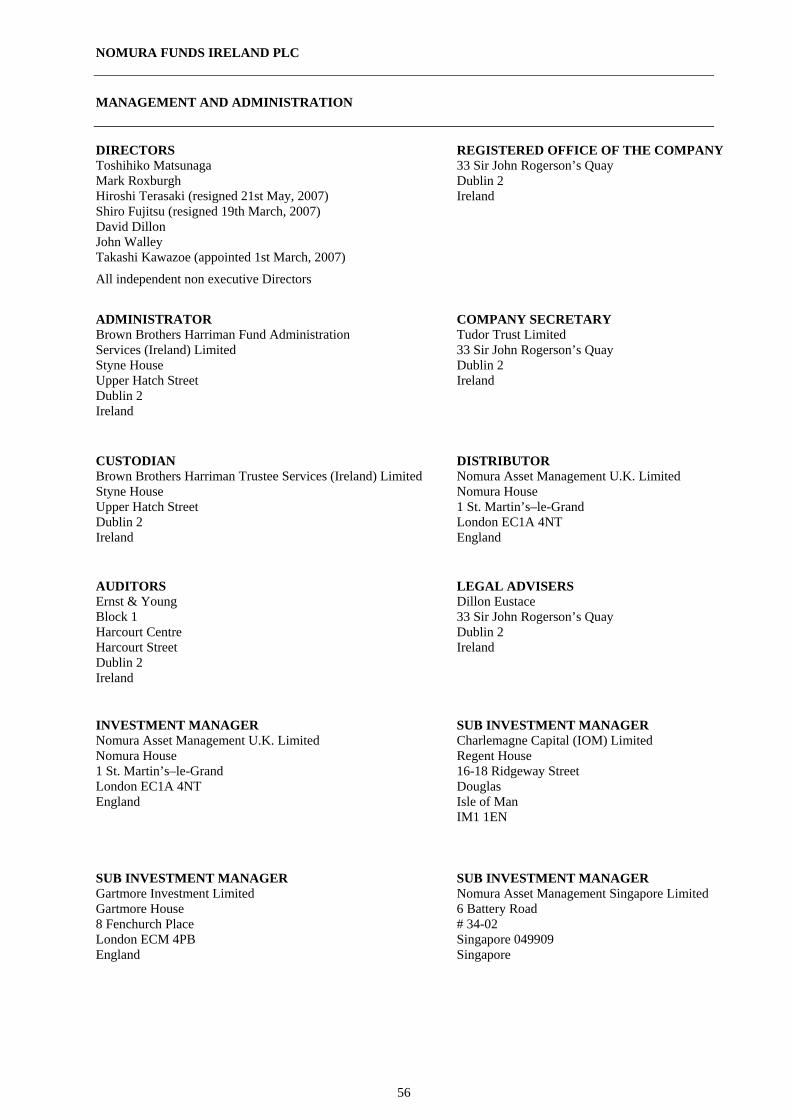
NOMURA FUNDS IRELAND PLC
56
MANAGEMENT AND ADMINISTRATION
DIRECTORS Toshihiko Matsunaga Mark Roxburgh Hiroshi Terasaki (resigned 21st May, 2007) Shiro Fujitsu (resigned 19th March, 2007) David Dillon John Walley Takashi Kawazoe (appointed 1st March, 2007)
REGISTERED OFFICE OF THE COMPANY 33 Sir John Rogerson’s Quay Dublin 2 Ireland
All independent non executive Directors
ADMINISTRATOR Brown Brothers Harriman Fund Administration Services (Ireland) Limited Styne House Upper Hatch Street Dublin 2 Ireland
COMPANY SECRETARY Tudor Trust Limited 33 Sir John Rogerson’s Quay Dublin 2 Ireland
CUSTODIAN Brown Brothers Harriman Trustee Services (Ireland) Limited Styne House Upper Hatch Street Dublin 2 Ireland
DISTRIBUTOR Nomura Asset Management U.K. Limited Nomura House 1 St. Martin’s–le-Grand London EC1A 4NT England
AUDITORS Ernst & Young Block 1 Harcourt Centre Harcourt Street Dublin 2 Ireland
LEGAL ADVISERS Dillon Eustace 33 Sir John Rogerson’s Quay Dublin 2 Ireland
INVESTMENT MANAGER Nomura Asset Management U.K. Limited Nomura House 1 St. Martin’s–le-Grand London EC1A 4NT England
SUB INVESTMENT MANAGER Charlemagne Capital (IOM) Limited Regent House 16-18 Ridgeway Street Douglas Isle of Man IM1 1EN
SUB INVESTMENT MANAGER Gartmore Investment Limited Gartmore House 8 Fenchurch Place London ECM 4PB England
SUB INVESTMENT MANAGER Nomura Asset Management Singapore Limited 6 Battery Road # 34-02 Singapore 049909 Singapore