nomura securities
TRANSCRIPT
Nomura SecuritiesSecurities Company Analysis
June 11, 2013
Table of Contents} Securities Industry Analysis
} Nature of the Business
} Industry Outlook
} Major Factors & Risks
} Recent Changes in Regulations
} Company Analysis
} Asset & Liability Structure
} Income Structure
} Risk Management
} Challenges & Opportunities
} Conclusion
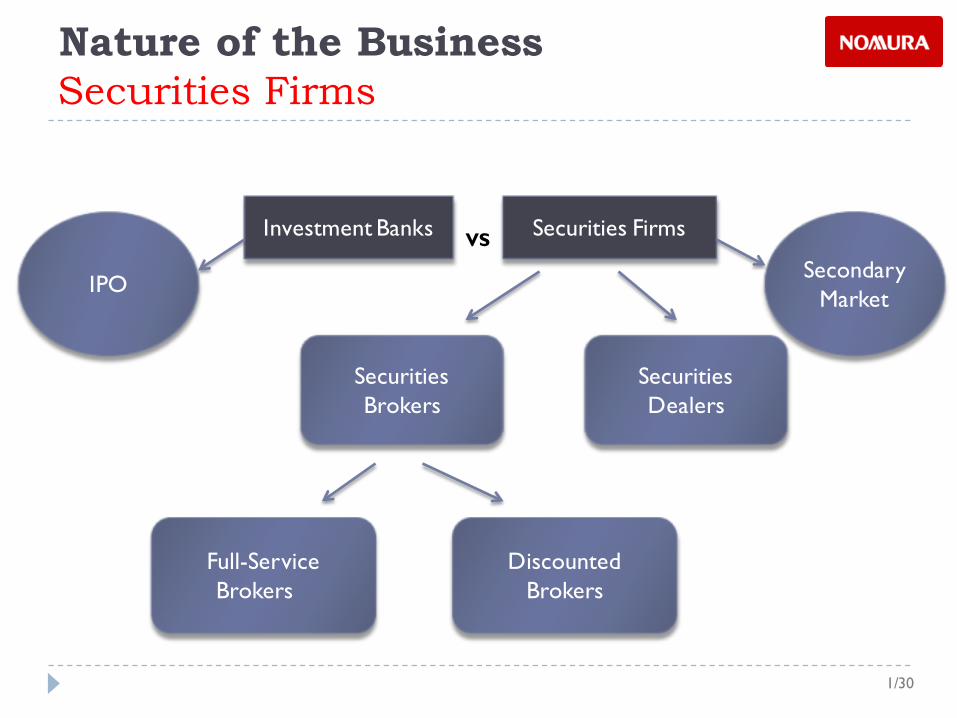
Securities FirmsNature of the Business
1/30
Investment Banks Securities FirmsVS
IPOSecondary
Market
Securities Brokers
SecuritiesDealers
Full-Service Brokers
Discounted Brokers
Table of Contents} Securities Industry Analysis
} Nature of the Business
} Industry Outlook
} Major Factors & Risks
} Recent Changes in Regulations
} Company Analysis
} Asset & Liability Structure
} Income Structure
} Risk Management
} Challenges & Opportunities
} Conclusion
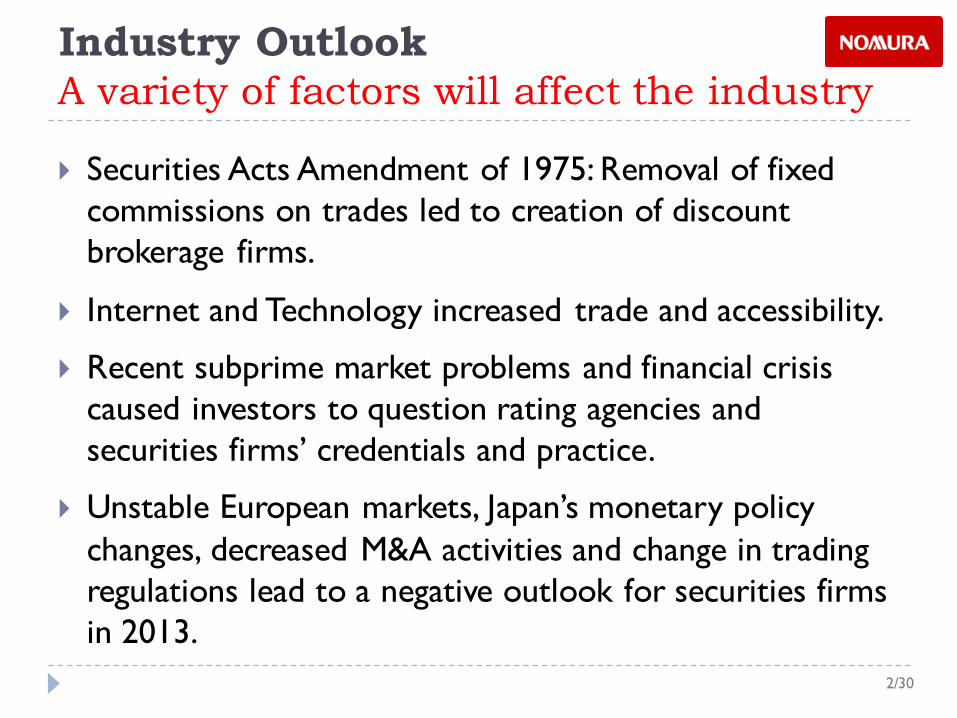
} Securities Acts Amendment of 1975: Removal of fixed commissions on trades led to creation of discount brokerage firms.
} Internet and Technology increased trade and accessibility.
} Recent subprime market problems and financial crisis caused investors to question rating agencies and securities firms’ credentials and practice.
} Unstable European markets, Japan’s monetary policy changes, decreased M&A activities and change in trading regulations lead to a negative outlook for securities firms in 2013.
A variety of factors will affect the industryIndustry Outlook
2/30
Table of Contents} Securities Industry Analysis
} Nature of the Business
} Industry Outlook
} Major Factors & Risks
} Recent Changes in Regulations
} Company Analysis
} Asset & Liability Structure
} Income Structure
} Risk Management
} Challenges & Opportunities
} Conclusion
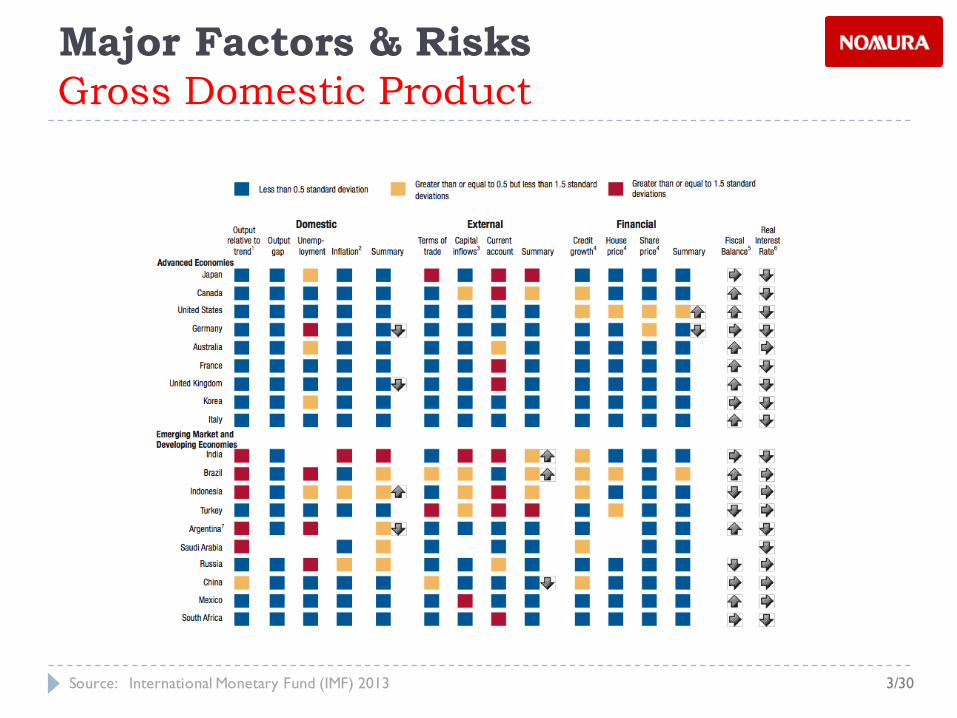
Gross Domestic ProductMajor Factors & Risks
3/30Source: International Monetary Fund (IMF) 2013
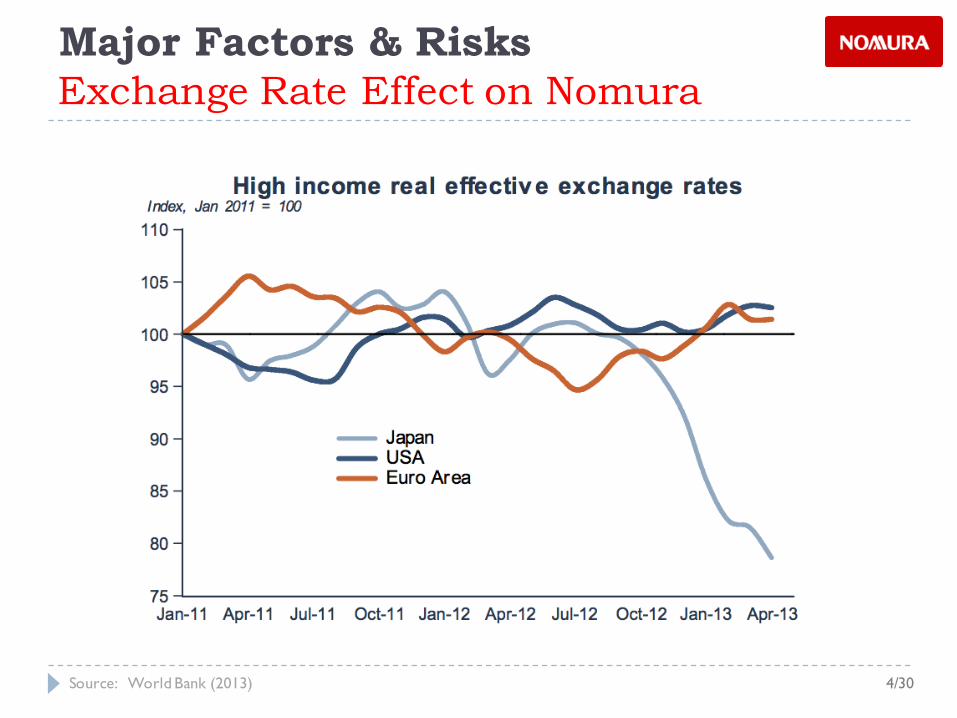
Exchange Rate Effect on NomuraMajor Factors & Risks
4/30Source: World Bank (2013)
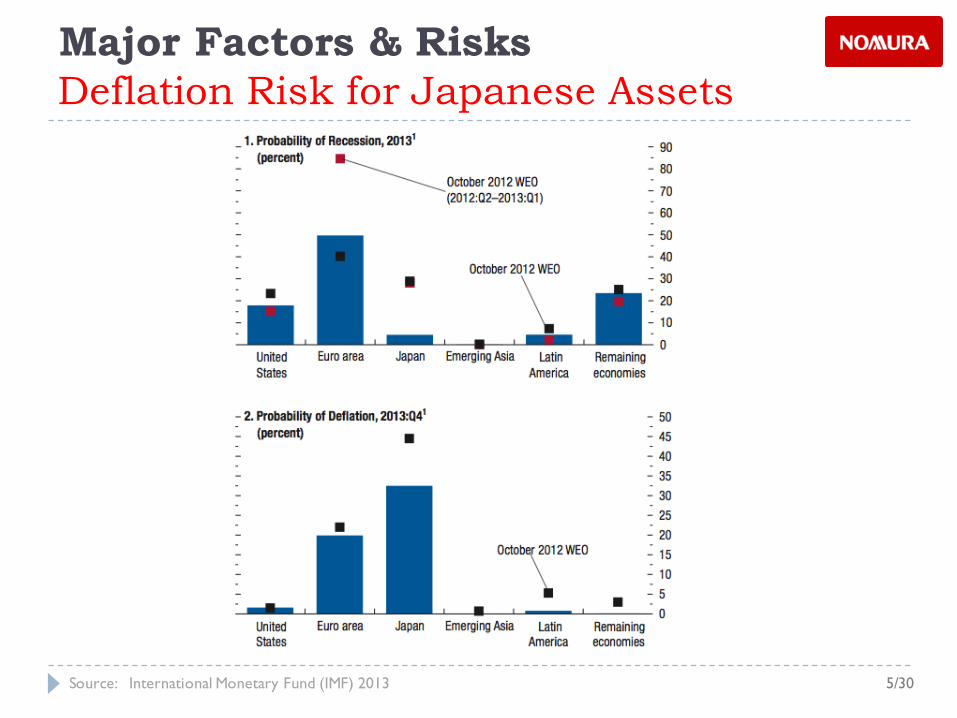
Deflation Risk for Japanese AssetsMajor Factors & Risks
5/30Source: International Monetary Fund (IMF) 2013
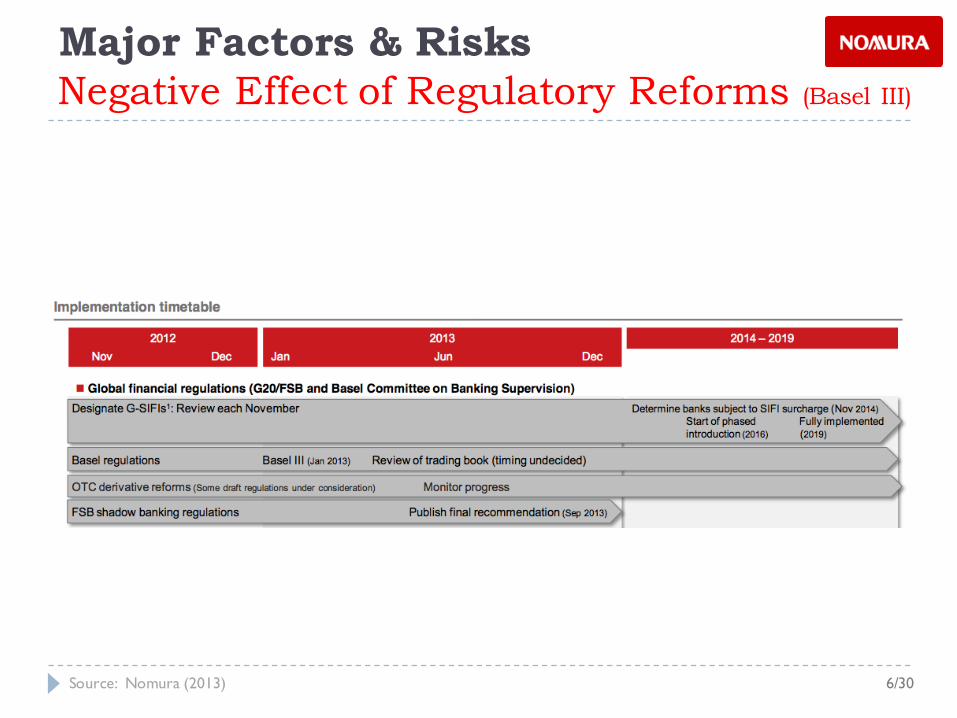
Negative Effect of Regulatory Reforms (Basel III)
Major Factors & Risks
6/30Source: Nomura (2013)
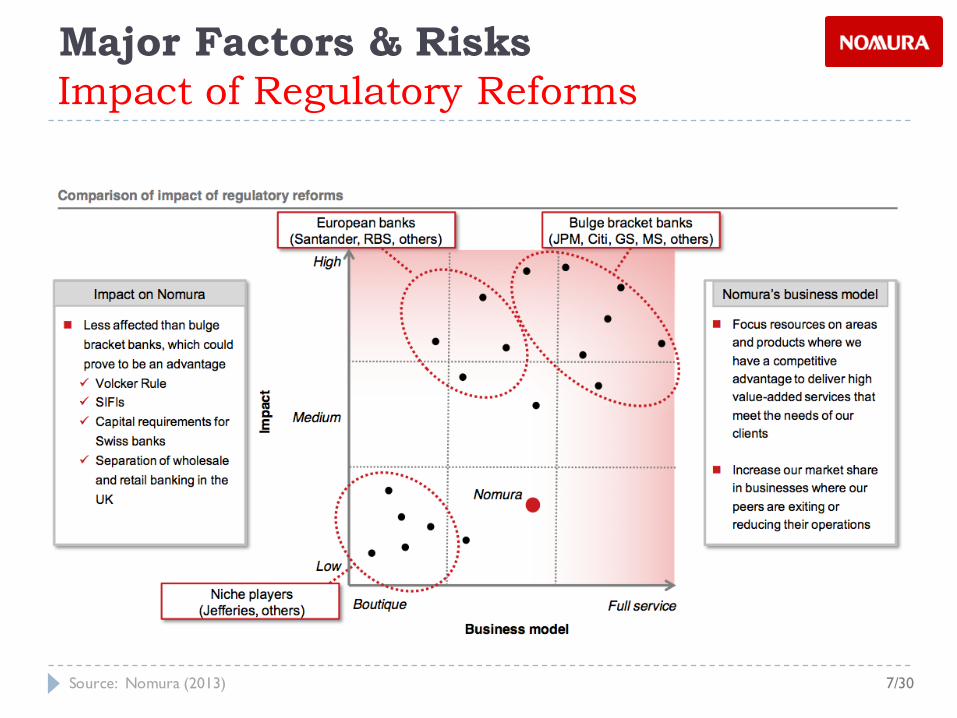
Impact of Regulatory ReformsMajor Factors & Risks
7/30Source: Nomura (2013)

Table of Contents} Securities Industry Analysis
} Nature of the Business
} Industry Outlook
} Major Factors & Risks
} Recent Changes in Regulations
} Company Analysis
} Asset & Liability Structure
} Income Structure
} Risk Management
} Challenges & Opportunities
} Conclusion
} 1980s eased financial regulation
} 1999 Abolition of Glass-Steagal Act
} 2007 Real estate price collapse
} MBS, CDO value down
} FRS interest rate cut
} Financial Crisis
Dodd-Frank Reform & Consumer ProtectionRecent Changes in Regulations
8/30
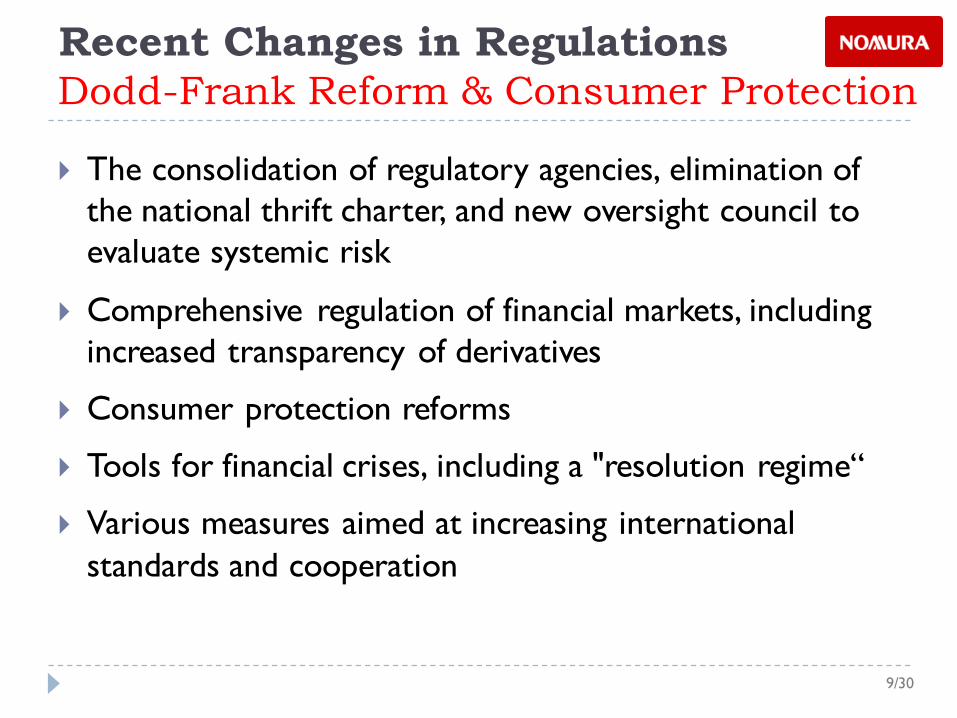
} The consolidation of regulatory agencies, elimination of the national thrift charter, and new oversight council to evaluate systemic risk
} Comprehensive regulation of financial markets, including increased transparency of derivatives
} Consumer protection reforms
} Tools for financial crises, including a "resolution regime“
} Various measures aimed at increasing international standards and cooperation
Dodd-Frank Reform & Consumer ProtectionRecent Changes in Regulations
9/30
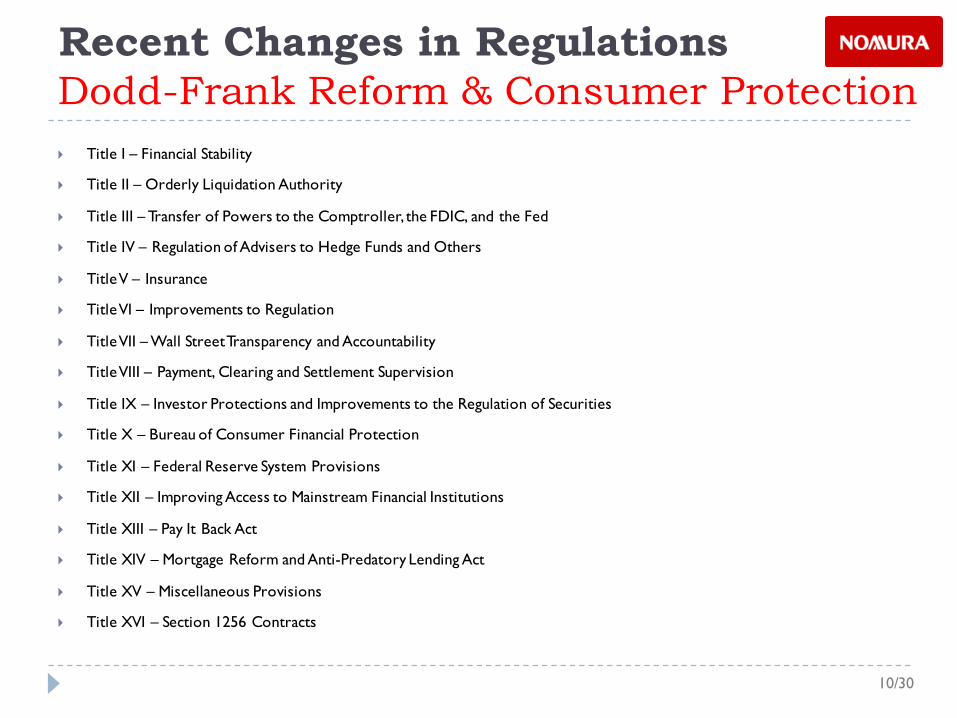
} Title I – Financial Stability
} Title II – Orderly Liquidation Authority
} Title III – Transfer of Powers to the Comptroller, the FDIC, and the Fed
} Title IV – Regulation of Advisers to Hedge Funds and Others
} Title V – Insurance
} Title VI – Improvements to Regulation
} Title VII – Wall Street Transparency and Accountability
} Title VIII – Payment, Clearing and Settlement Supervision
} Title IX – Investor Protections and Improvements to the Regulation of Securities
} Title X – Bureau of Consumer Financial Protection
} Title XI – Federal Reserve System Provisions
} Title XII – Improving Access to Mainstream Financial Institutions
} Title XIII – Pay It Back Act
} Title XIV – Mortgage Reform and Anti-Predatory Lending Act
} Title XV – Miscellaneous Provisions
} Title XVI – Section 1256 Contracts
Dodd-Frank Reform & Consumer ProtectionRecent Changes in Regulations
10/30
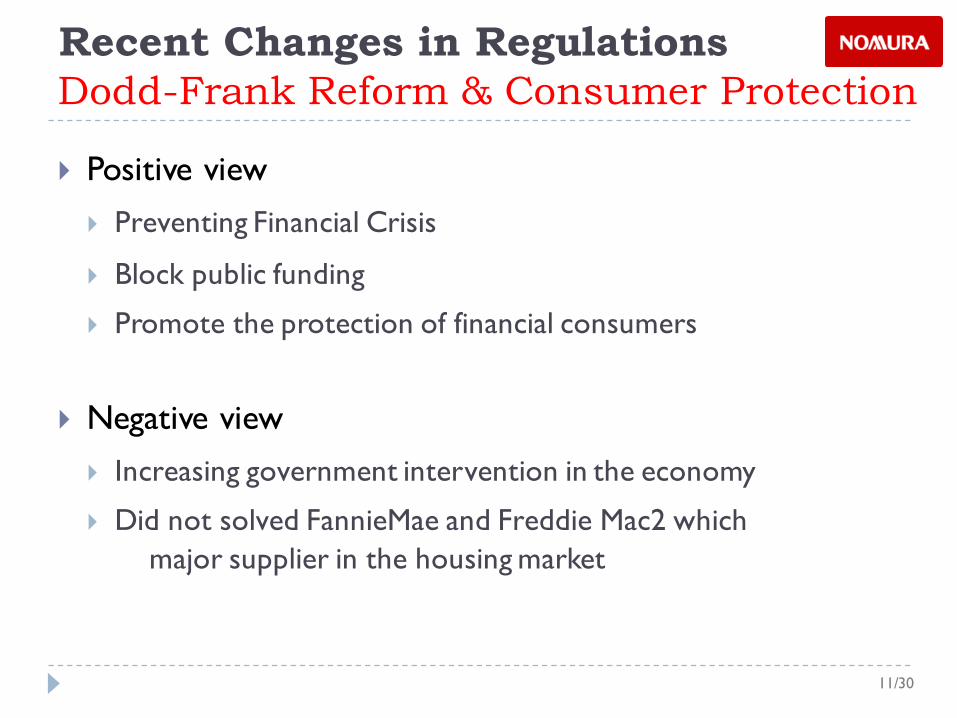
} Positive view} Preventing Financial Crisis
} Block public funding
} Promote the protection of financial consumers
} Negative view} Increasing government intervention in the economy
} Did not solved FannieMae and Freddie Mac2 which major supplier in the housing market
Dodd-Frank Reform & Consumer ProtectionRecent Changes in Regulations
11/30
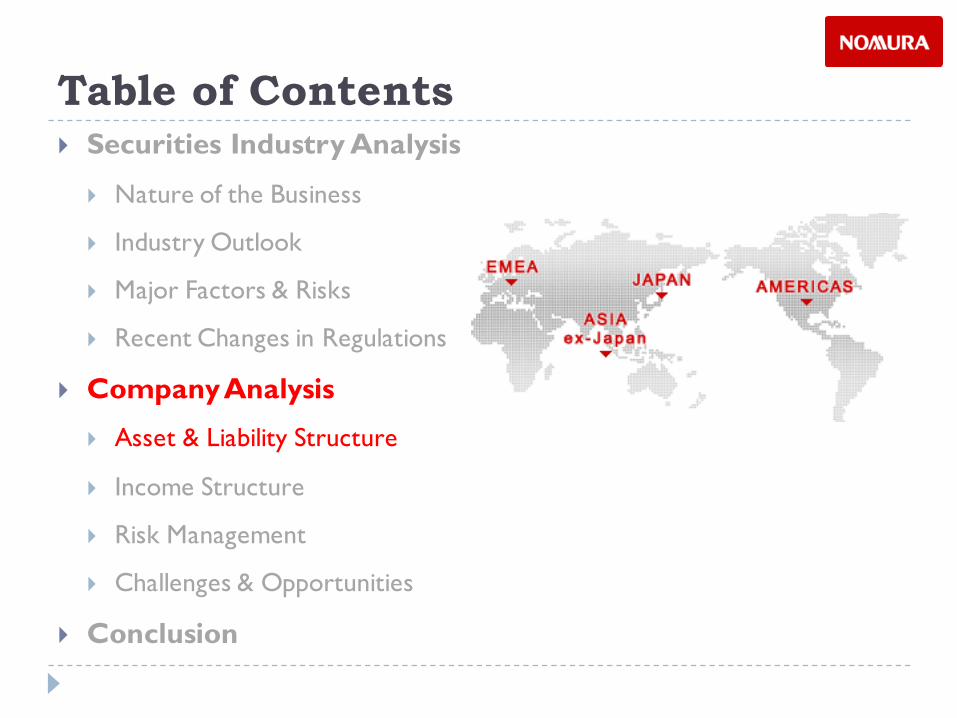
Table of Contents} Securities Industry Analysis
} Nature of the Business
} Industry Outlook
} Major Factors & Risks
} Recent Changes in Regulations
} Company Analysis
} Asset & Liability Structure
} Income Structure
} Risk Management
} Challenges & Opportunities
} Conclusion
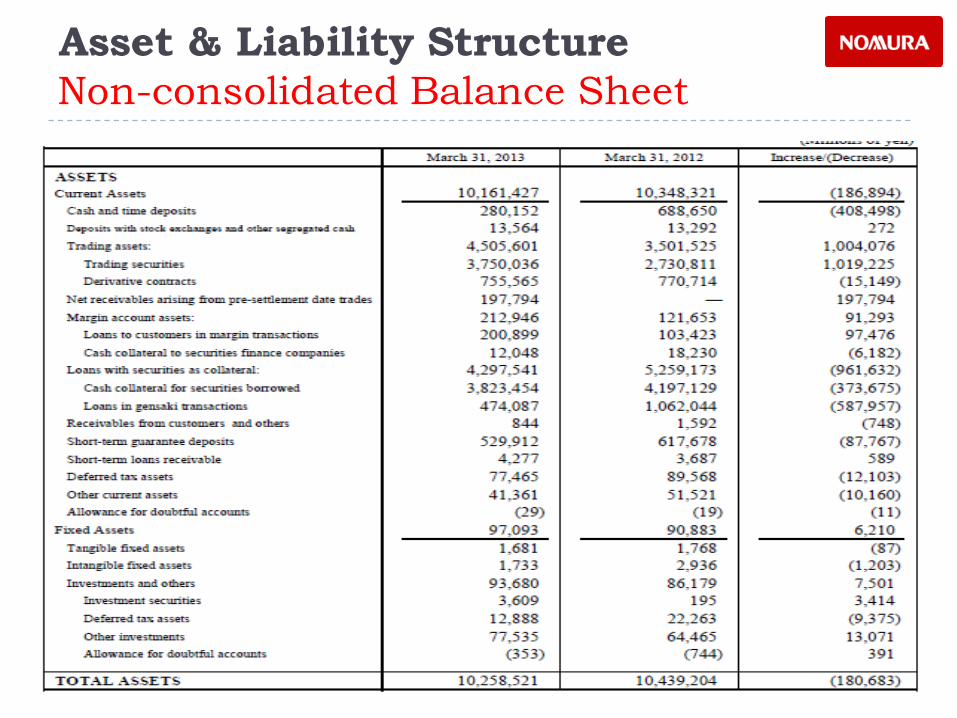
Non-consolidated Balance Sheet Asset & Liability Structure
Source: http://www.ge.com/company/index.html 1/30
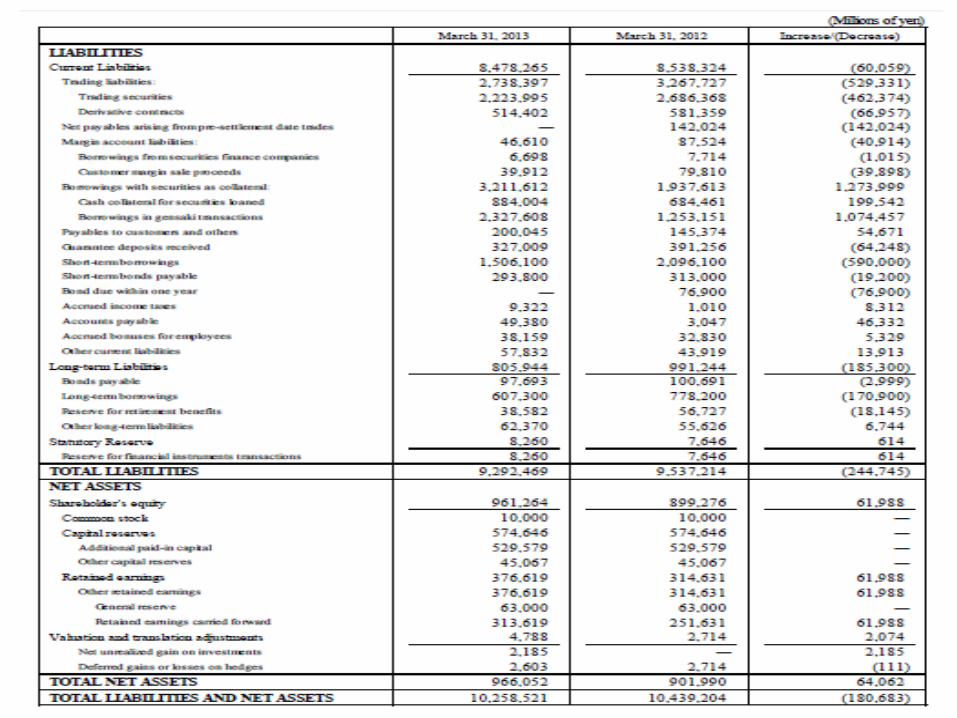
Non-consolidated balance sheet Asset & Liability Structure
Source: http://www.ge.com/company/index.html 1/30
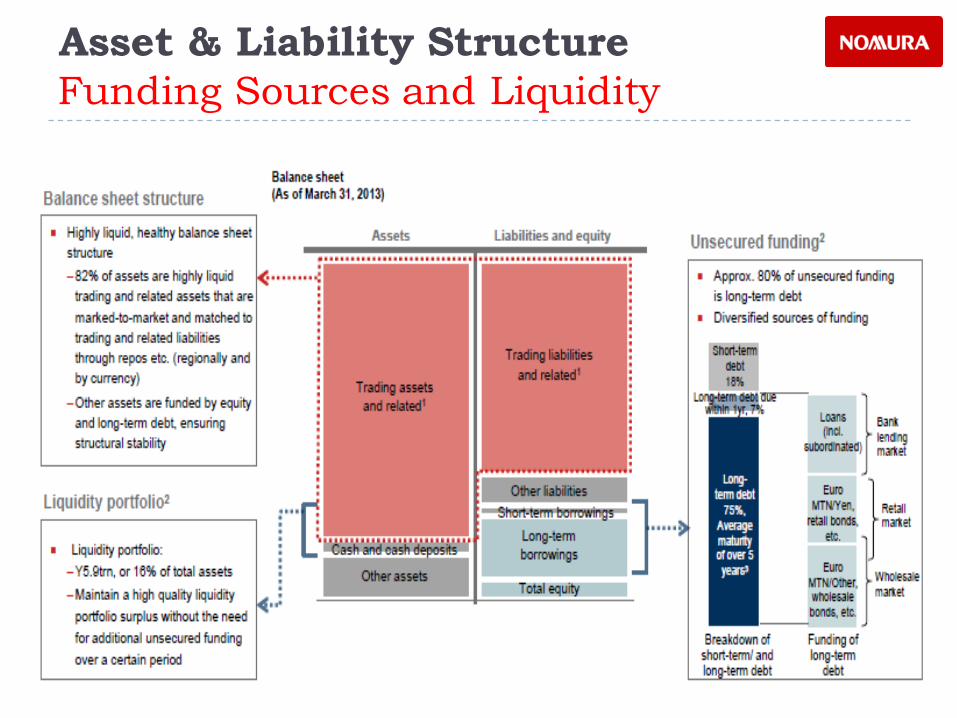
Funding Sources and LiquidityAsset & Liability Structure
Source: http://www.ge.com/company/index.html 1/30
Table of Contents} Securities Industry Analysis
} Nature of the Business
} Industry Outlook
} Major Factors & Risks
} Recent Changes in Regulations
} Company Analysis
} Asset & Liability Structure
} Income Structure
} Risk Management
} Challenges & Opportunities
} Conclusion
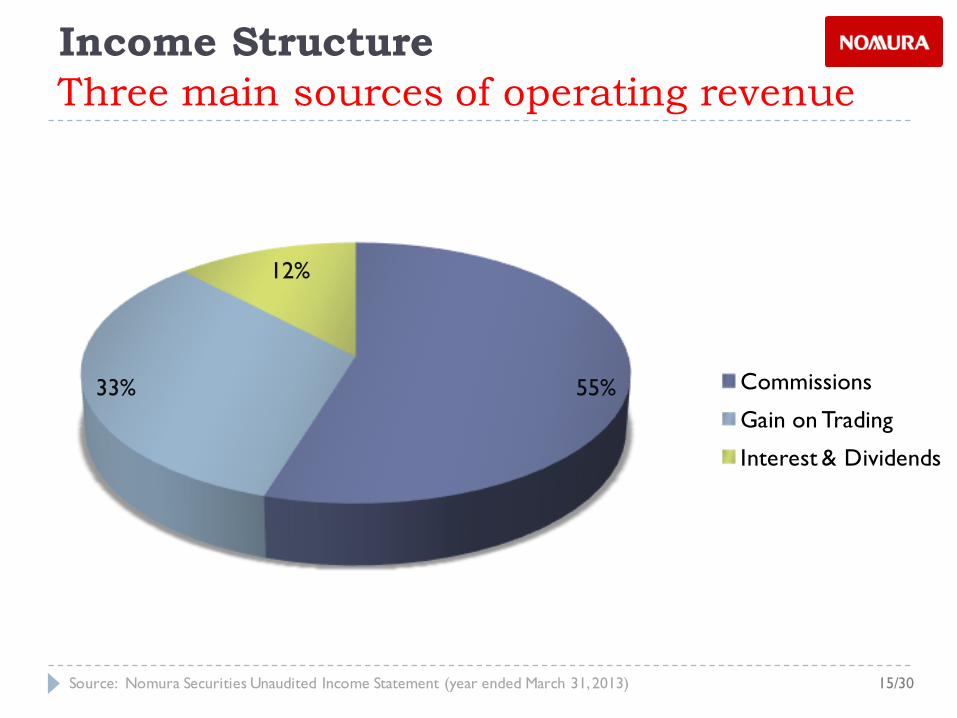
Three main sources of operating revenue
55%33%
12%
Commissions
Gain on Trading
Interest & Dividends
Income Structure
Source: Nomura Securities Unaudited Income Statement (year ended March 31, 2013) 15/30
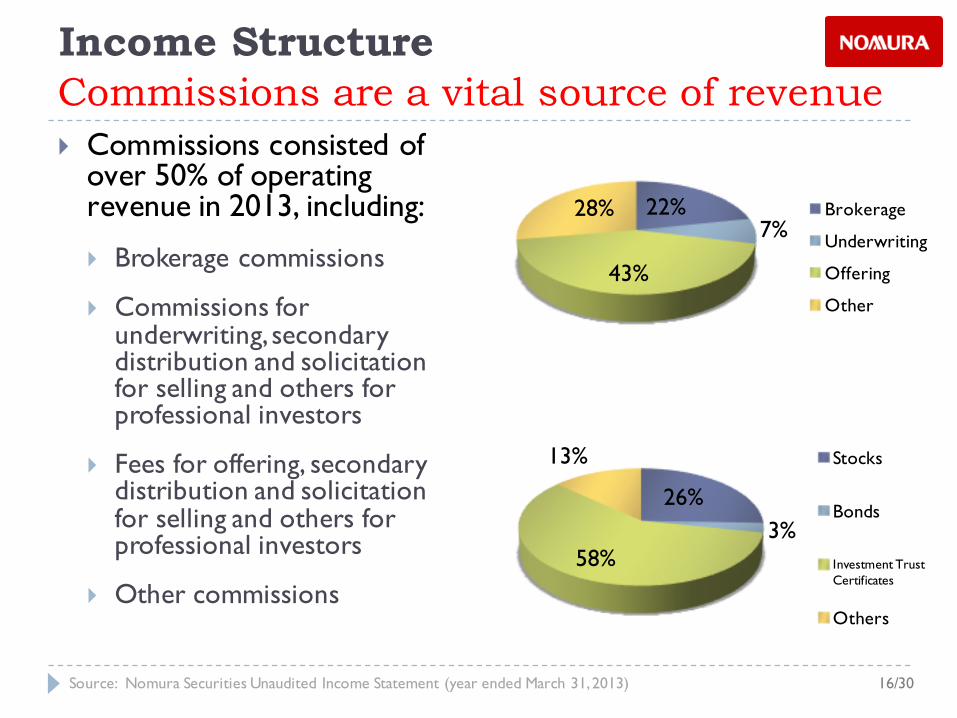
Commissions are a vital source of revenue} Commissions consisted of
over 50% of operating revenue in 2013, including:
} Brokerage commissions
} Commissions for underwriting, secondary distribution and solicitation for selling and others for professional investors
} Fees for offering, secondary distribution and solicitation for selling and others for professional investors
} Other commissions
22%7%
43%
28% Brokerage
Underwriting
Offering
Other
Income Structure
Source: Nomura Securities Unaudited Income Statement (year ended March 31, 2013)
26%3%
58%
13% Stocks
Bonds
Investment Trust Certificates
Others
16/30
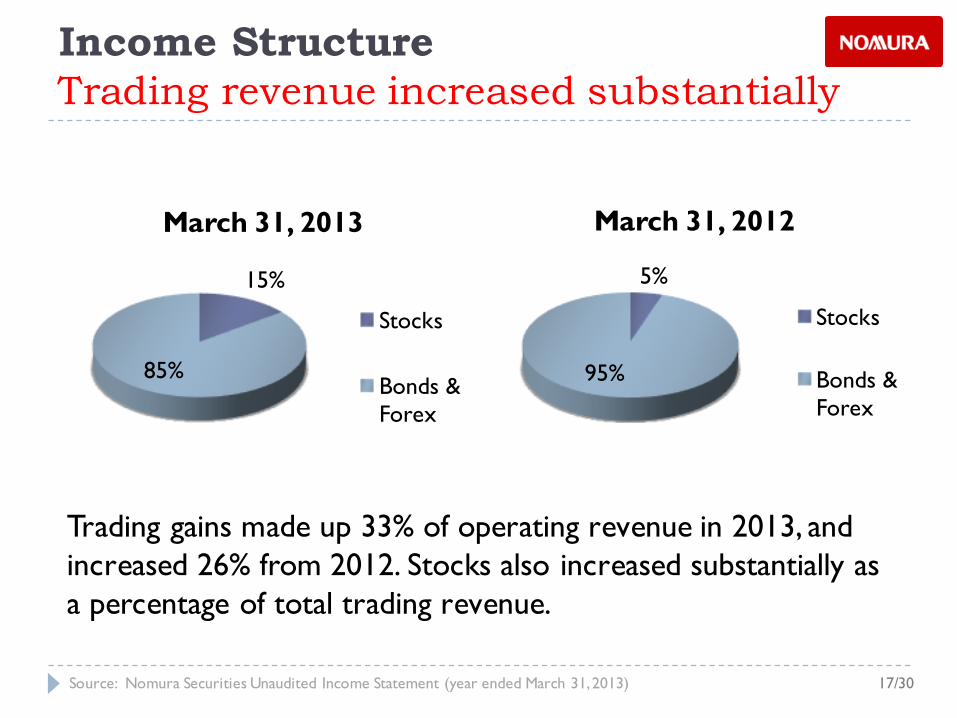
Trading revenue increased substantiallyIncome Structure
17/30Source: Nomura Securities Unaudited Income Statement (year ended March 31, 2013)
15%
85%
March 31, 2013
Stocks
Bonds & Forex
5%
95%
March 31, 2012
Stocks
Bonds & Forex
Trading gains made up 33% of operating revenue in 2013, and increased 26% from 2012. Stocks also increased substantially as a percentage of total trading revenue.

Table of Contents} Securities Industry Analysis
} Nature of the Business
} Industry Outlook
} Major Factors & Risks
} Recent Changes in Regulations
} Company Analysis
} Asset & Liability Structure
} Income Structure
} Risk Management
} Challenges & Opportunities
} Conclusion
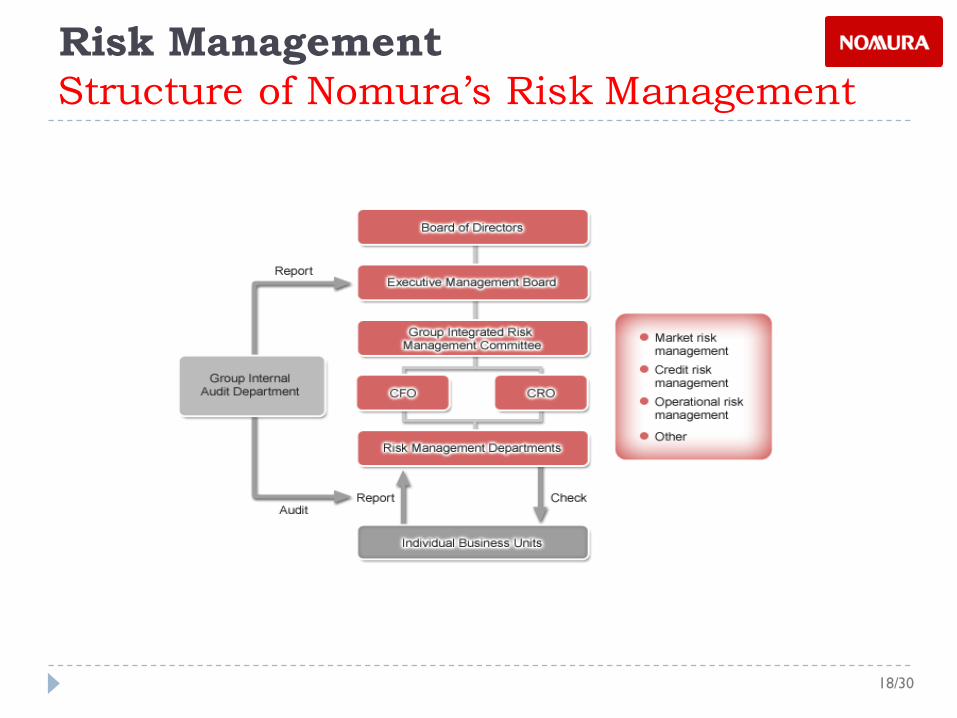
Structure of Nomura’s Risk ManagementRisk Management
18/30
} The Group Integrated Risk Management Committee (GIRMC) is chaired by the Group CEO and includes:
} The Group COO
} Business division CEOs
} CRO (Chief Risk Officer)
} Other persons designated by the Group CEO
} Under the direction of the Executive Management Board, GIRMC is responsible for deliberating and deciding on important risk management issues for the Nomura group.
Structure of Nomura’s Risk ManagementRisk Management
19/30
1. Market Risks Management: Performance Review Committee (PRC)
2. Credit Risks Management: Investment Risk Supervisory Committee (IRSC)
3. Liquidity Risks Management: Trading Divisions4. Events Risks Management5. Administrative Risks Management6. Financial Reporting Risks Management7. Information System Risks Management8. Legal compliance Management: Legal & Compliance
Department9. Reputation Risks Management
Nine Different DepartmentsRisk Management
20/30
Table of Contents} Securities Industry Analysis
} Nature of the Business
} Industry Outlook
} Major Factors & Risks
} Recent Changes in Regulations
} Company Analysis
} Asset & Liability Structure
} Income Structure
} Risk Management
} Challenges & Opportunities
} Conclusion
} Culture Crash
1. Lehman: high risk tolerance, frequent use of leverage, and swift decision making
2. Nomura: more hierarchical, conservative, and favored more stable revenues based on moderate levels or risk taking
Challenges Facing NomuraChallenges & Opportunities
21/30
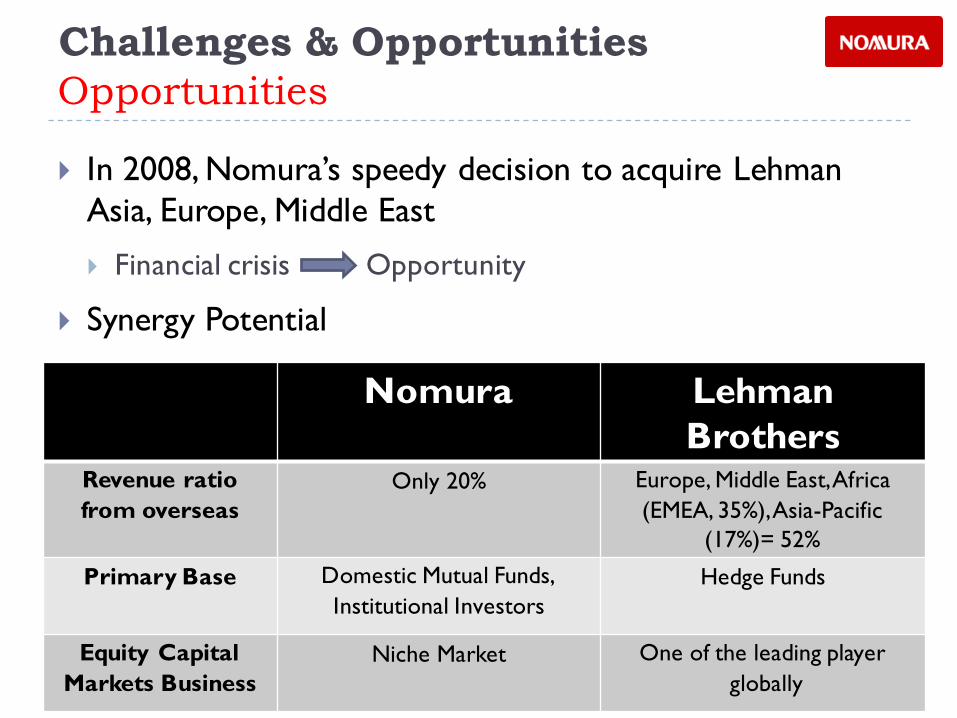
} In 2008, Nomura’s speedy decision to acquire Lehman Asia, Europe, Middle East
} Financial crisis Opportunity
} Synergy Potential
OpportunitiesChallenges & Opportunities
30/30 Source: Nomura (2013)
Nomura Lehman Brothers
Revenue ratiofrom overseas
Only 20% Europe, Middle East, Africa(EMEA, 35%),Asia-Pacific
(17%)= 52%
Primary Base Domestic Mutual Funds,Institutional Investors
Hedge Funds
Equity CapitalMarkets Business
Niche Market One of the leading playerglobally
} In FY 2008, Nomura recorded a net loss of 208.2 billion yen, the worst loss in its history
} Recovery: In FY 2009’s Annual report, a net profit of 67.8 billion yen
} Nomura has posted seven consecutive quarters in the black, up to the fourth quarter of 2010
Financial PerformanceChallenges & Opportunities
23/30
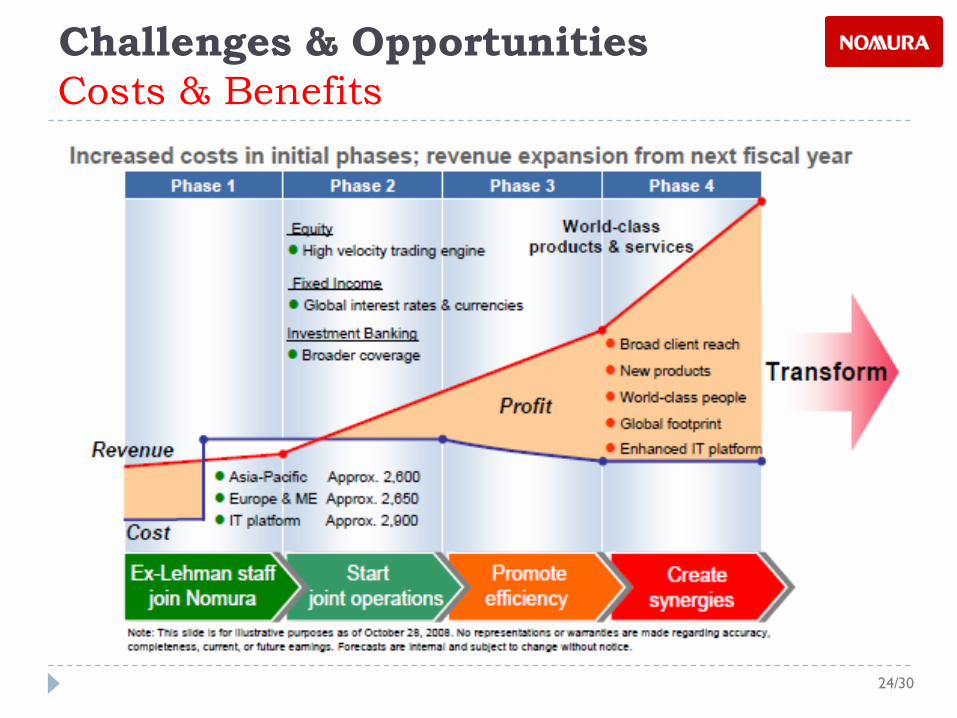
Costs & BenefitsChallenges & Opportunities
24/30
Table of Contents} Securities Industry Analysis
} Nature of the Business
} Industry Outlook
} Major Factors & Risks
} Recent Changes in Regulations
} Company Analysis
} Asset & Liability Structure
} Income Structure
} Risk Management
} Challenges & Opportunities
} Conclusion
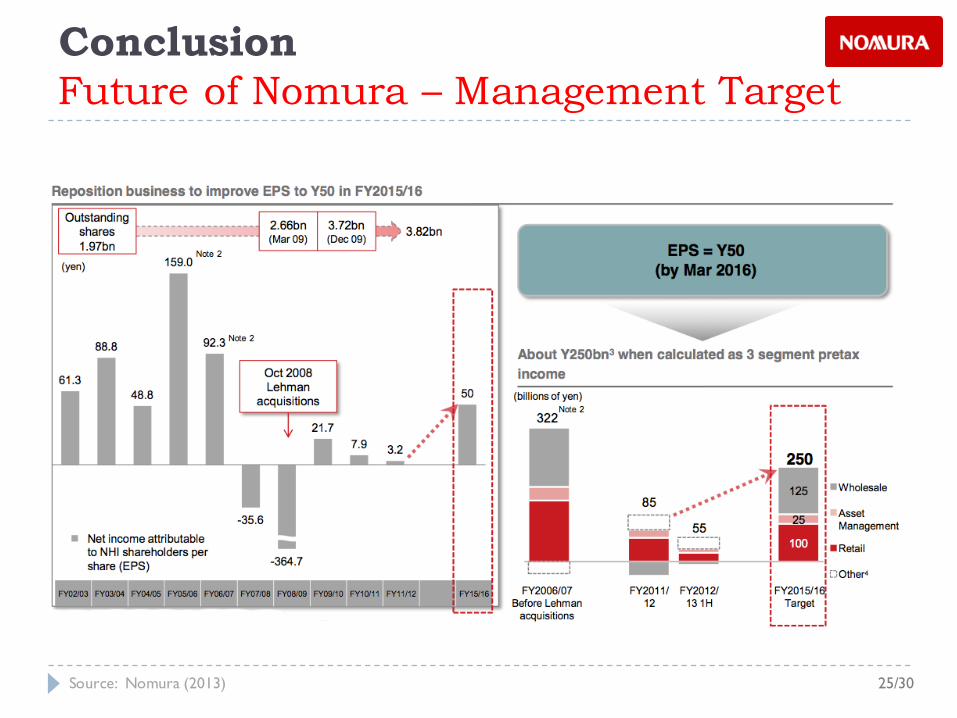
Future of Nomura – Management TargetConclusion
25/30Source: Nomura (2013)
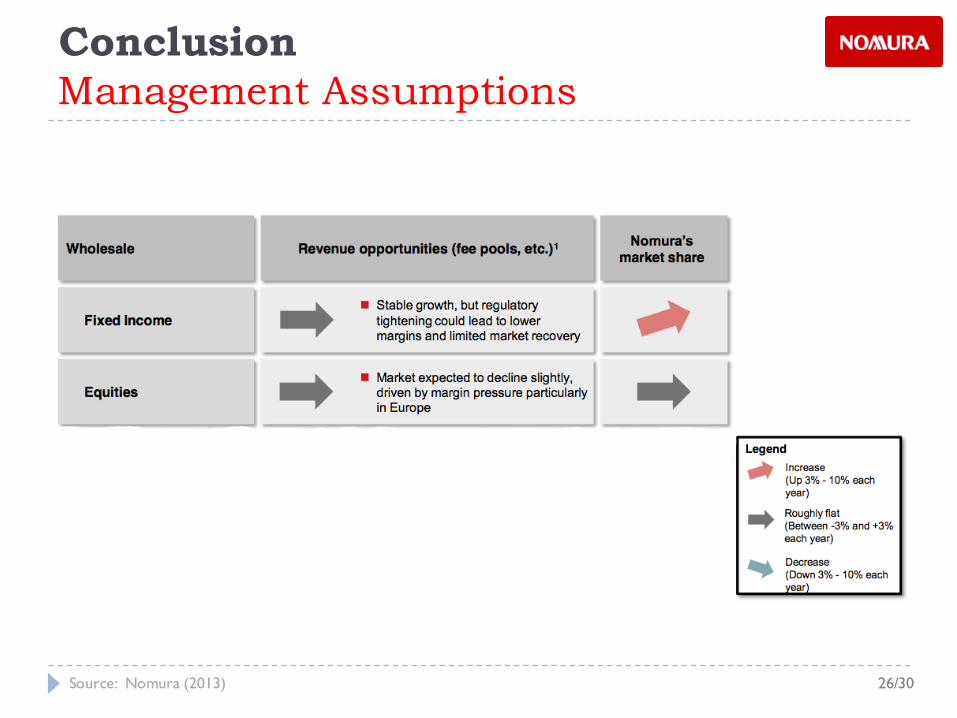
Management AssumptionsConclusion
26/30Source: Nomura (2013)
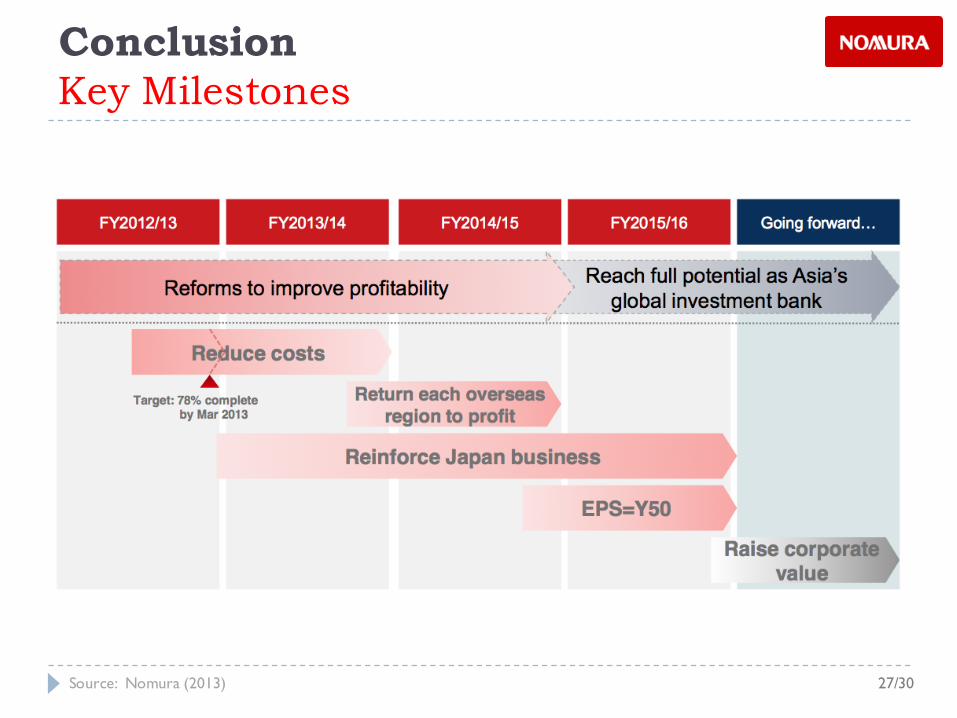
Key MilestonesConclusion
27/30Source: Nomura (2013)
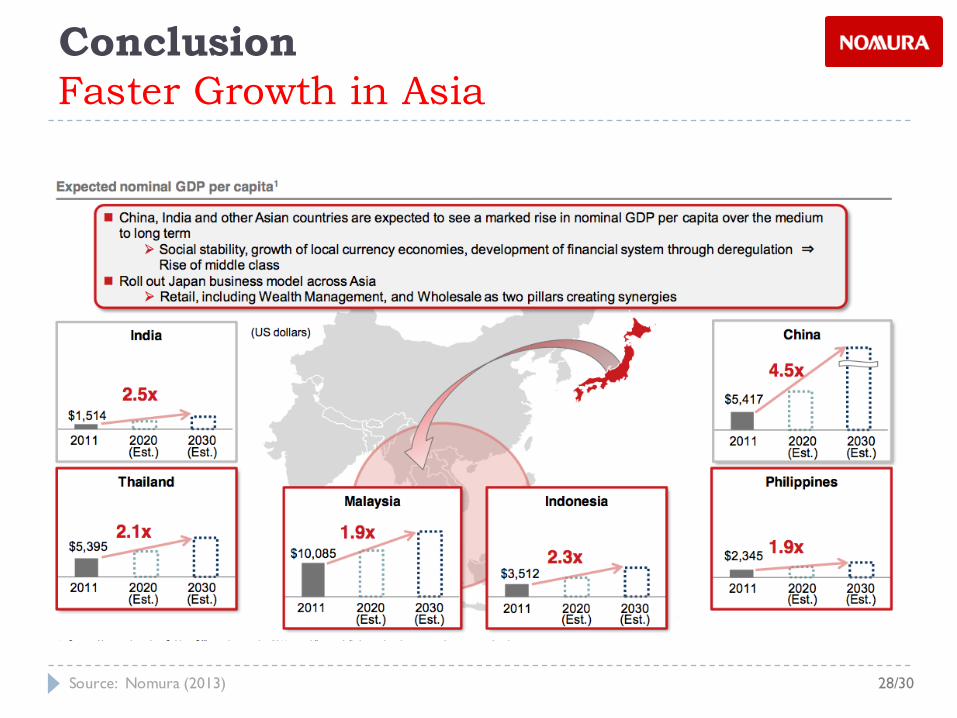
Faster Growth in AsiaConclusion
28/30Source: Nomura (2013)
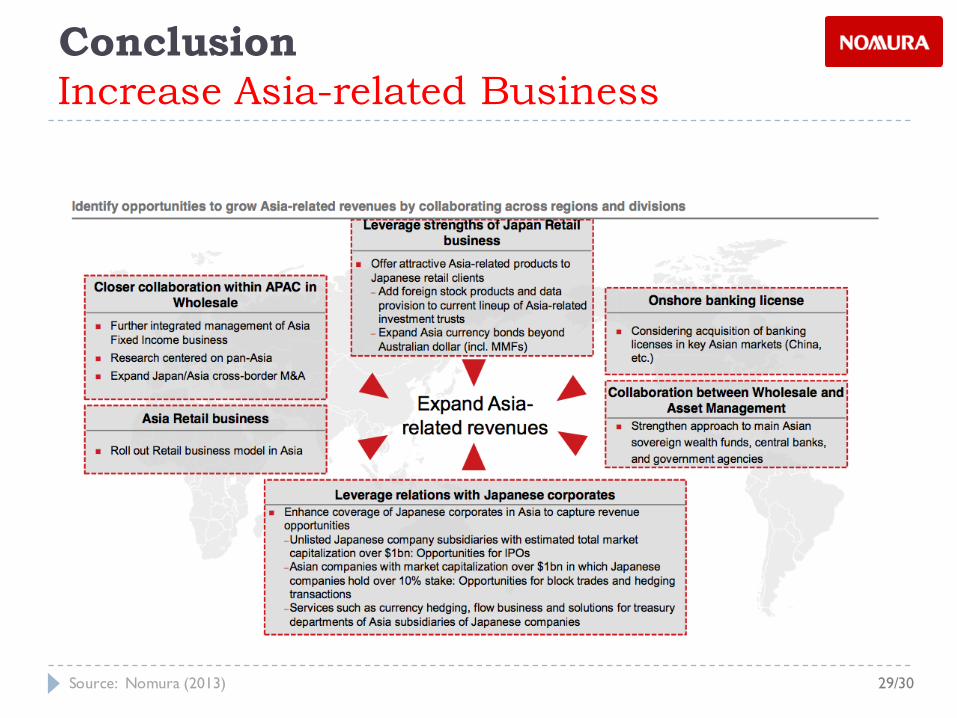
Increase Asia-related BusinessConclusion
29/30Source: Nomura (2013)
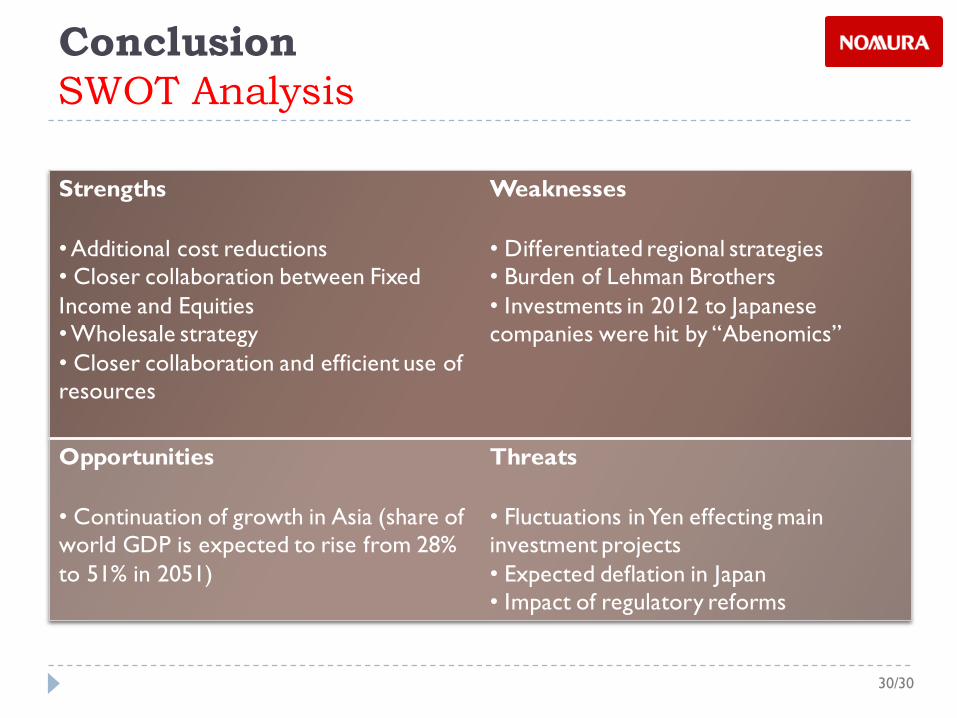
Strengths
•Additional cost reductions• Closer collaboration between Fixed Income and Equities•Wholesale strategy• Closer collaboration and efficient use of resources
Weaknesses
• Differentiated regional strategies• Burden of Lehman Brothers• Investments in 2012 to Japanese companies were hit by “Abenomics”
Opportunities
• Continuation of growth in Asia (share of world GDP is expected to rise from 28% to 51% in 2051)
Threats
• Fluctuations in Yen effecting main investment projects• Expected deflation in Japan• Impact of regulatory reforms
SWOT AnalysisConclusion
30/30